Article

Comparison of Structure and Local Dynamics of Two Peptide Dendrimers with the Same Backbone but with Different Side Groups in Their Spacers

by
Sofia E. Mikhtaniuk
1,
Valeriy V. Bezrodnyi
1,2,
Oleg V. Shavykin
1,2,
Igor M. Neelov
1,
Nadezhda N. Sheveleva
2,
Anastasia V. Penkova
2 and
Denis A. Markelov
2,*
1
St. Petersburg National Research University of Information Technologies, Mechanics and Optics (ITMO University), Kronverkskiy pr. 49, 197101 St. Petersburg, Russia
2
St. Petersburg State University, 7/9 Universitetskaya nab., 199034 St. Petersburg, Russia
*
Author to whom correspondence should be addressed.
Polymers 2020, 12(8), 1657; https://doi.org/10.3390/polym12081657
Submission received: 30 June 2020 / Revised: 19 July 2020 / Accepted: 20 July 2020 / Published: 25 July 2020
(This article belongs to the Special Issue Polymer Structure and Property II)

Abstract

:
In this paper, we perform computer simulation of two lysine-based dendrimers with Lys-2Lys and Lys-2Gly repeating units. These dendrimers were recently studied experimentally by NMR (Sci. Reports, 2018, 8, 8916) and tested as carriers for gene delivery (Bioorg. Chem., 2020, 95, 103504). Simulation was performed by molecular dynamics method in a wide range of temperatures. We have shown that the Lys-2Lys dendrimer has a larger size but smaller fluctuations as well as lower internal density in comparison with the Lys-2Gly dendrimer. The Lys-2Lys dendrimer has larger charge but counterions form more ion pairs with its NH 3 + groups and reduce the bare charge and zeta potential of the first dendrimer more strongly. It was demonstrated that these differences between dendrimers are due to the lower flexibility and the larger charge (+2) of each 2Lys spacers in comparison with 2Gly ones. The terminal CH 2 groups in both dendrimers move faster than the inner CH 2 groups. The calculated temperature dependencies of the spin-lattice relaxation times of these groups for both dendrimers are in a good agreement with the experimental results obtained by NMR.

Graphical Abstract

1. Introduction

Dendrimers are spherical, regularly branched macromolecules [1,2]. They have a central core, branched repeating units, and a large number of terminal groups which are available for functionalization. Dendrimers (for example, polyamidoamine (PAMAM) and polyethylenimine (PEI) dendrimers) are widely used in many biomedical applications, for example, as antibacterial and antiviral agents [3] as well as nanocontainers for delivery of drugs [4,5], genes [6,7,8,9], and other nanoparticles [10].
At the same time, there are poly-L-Lysine (PLL) dendrimers that consist of natural lysine amino acid residues [11,12,13]. Due to the presence of these residues, such dendrimers have lower toxicity than PAMAM dendrimers. Therefore, PLL dendrimers are more suitable as antibacterial and antiviral agents [14], and as drug [15,16,17,18] and gene [19,20] delivery vehicles [21]. They have antiangiogenic properties that help to inhibit tumor growth [22]. Biodistribution of PLL dendrimers was studied in several papers [23,24]. Despite numerous applications in biomedicine of PLL dendrimers, their physico-chemical properties have been studied in a few works in comparison with commercially available PAMAM dendrimers. In particular, the systematic studies of a hydrodynamic radius and a radius of gyration ( R g ) of PLL dendrimers of different generations ( G = 1 10 ) were performed only in dimethylformamide solvent [25,26]. The sizes and the local mobility of PLL dendrimers ( G = 2 , 4 ) in water at different temperatures have been recently studied by hydrodynamic and NMR methods [27,28,29]. Molecular dynamics (MD) simulation of PLL dendrimers of G = 4 with modified terminal groups in water was also presented [30]. Systematic MD simulation of PLL dendrimers with unmodified terminal groups in water for G = 1 5 at room temperature [31] and for G = 2 , 4 at different temperatures [27,28,29] have been performed. Brownian dynamics (BD) simulation [32,33,34] and self-consistent field simulation [35] for study of these dendrimers were also applied.
Generally, peptide dendrimers [36,37,38,39,40,41] can consist of any combination of amino acid residues. Some authors include in this class any dendrimers (for example, PAMAM, PEI, etc.) with modified terminal groups containing amino acid residues [40,41]. At the same time, the most common peptide dendrimers still only have branched lysine amino acid residues in each repeating unit [36,37,38] while other amino acid residues or short linear peptides are chemically attached to terminal groups of a dendrimer [36,37]. The other possibility of creating new peptide dendrimers is an insertion of amino acids residues or short peptides as spacers between neighboring branching points inside dendrimers [38]. Application of peptide dendrimers in catalysis was described in [42,43,44], as antimicrobial peptides in [45,46,47], and for transdermal delivery in [48]. Applications of dendrimers for drug delivery were described in [49] and for gene delivery in [50,51,52,53,54,55,56]. Our study of siRNA delivery to normal and cancer cells using dendrimers simulated in this paper was described in [57], and using dendrimers of other amino acid composition but with the same distribution of charges along backbone of dendrimer in [58]. Computer simulation of peptide dendrimers was performed earlier by Brownian dynamics [59], molecular dynamics [60,61] methods, and by a numerical self-consistent field approach [62]. Synthesis and NMR study of some new peptide dendrimers with internally inserted amino acid spacers between each pair of branching points were also described in recent papers [63,64,65,66].
The main goal of the present paper is to investigate the structure and local orientational mobility of two peptide dendrimers having the same backbone but different volume and charge of side groups by MD method, and to compare their structural properties and orientational dynamics with the experimental results obtained earlier [63] using NMR spectroscopy. It is important to note that these dendrimers were tested as carriers for gene delivery [57].

2. Materials and Methods

Two peptide dendrimers of the second generation with the same backbone but with different repeating units: Lys-2Gly or Lys-2Lys, were studied by computer simulation. The full atomic model, molecular dynamics method, and Gromacs package [67] were used. The structure of both dendrimers is shown in Figure 1. Both dendrimers have a core (marked by green color in Figure 1), a backbone (black), and terminal groups (red). The difference between two dendrimers is the bulky charged side groups of inserted 2Lys spacers (marked by violet) in Lys-2Lys dendrimer. Simulations were performed for each dendrimer in water with the explicit Cl-counterions. The number of those counterions (see Table 1) was equal to the number of charged groups in the dendrimer.
The molecular weight M of the Lys-2Lys dendrimer is essentially greater than M of the Lys-2Gly dendrimer (see Table 1) due to the massive side groups (marked by violet color in Figure 1) of the inserted 2Lys spacers. The charge of the Lys-2Lys dendrimer ( Q b a r e = +44) with the additional charge of 2Lys insertions ( Q i n s = +28, because each inserted lysine residue N i n s = 28 has a charge of the side NH 3 group equal to +1) was also essentially larger than the charge of Lys-2Gly dendrimer ( Q b a r e = +16) with 2Gly insertions ( Q i n s = 0, because each of the glycine residues N i n s = 28 has no charge). Both dendrimers have the same numbers of terminal lysine groups, and their charges are equal to N e n d = 16 and Q e n d = +16, respectively (see Table 1).
The AMBER-99SB-ildn force field [68] was used in simulation. The potential energy of the system includes the deformation energy of the covalent bonds, the valence and the dihedral angles (including the improper dihedrals that maintain a plane conformation of peptide groups), and the energy of the van der Waals and electrostatic interactions. We used several computer programs, which were elaborated in previous papers, on MD [69,70,71] and BD simulations of dendrimers and dendrigrafts [72,73], linear polymers [74,75,76,77], polysaccharides [78], and peptides [79], as well as linear polyelectrolytes [80,81,82,83,84,85,86], for numerical calculations the properties of peptide dendrimers.
Calculations for each system included the structure optimization in vacuum, the initial equilibration using short MD simulations, and the long productive MD simulation run. The initial equilibration of both systems consisted of three stages: (1) the energy minimization of the system (a dendrimer with counterions in water) using the gradient descent method with a maximum number of steps of 50,000; (2) three runs of initial molecular dynamics simulation in the NVT-ensemble, where integration steps of the runs were 0.02, 0.2, and 2 fs, each run included 50,000, 50,000 and 500,000 steps respectively; and (3) one run of initial molecular dynamics simulation for 10 ns in NPT-ensemble where integration step was 1 fs. The second stage of initial equilibration was carried out in a cubic periodic cell with a fixed size. At this stage the temperature T = 310 K was maintained by the modified Berendsen thermostat [87] with a time constant of τ = 0.4 ps. Moreover, the cubic periodic cell was used for the third stage of the initial equilibration. The pressure of 1 atm was maintained by the Berendsen barostat with the time constant τ = 0.5 ps. As a result, the systems with solvated Lys-2Lys and Lys-2Gly dendrimers were prepared. The characteristics of both dendrimers are shown in Table 1.
The productive run was performed by the molecular dynamics method with an integration step of 1 fs. Simulation was performed in the NPT ensemble. Constant temperatures of 280, 290, 300, 310, 320, and 340 K were maintained by the Nose–Hoover thermostat [88] with the time constant τ = 0.4 ps. A constant pressure of 1 bar was maintained by the Parrinello–Rahman barostat [89] with τ = 0.5 ps and with compressibility of water 4.9 × 10 5 , 4.7 × 10 5 , 4.5 × 10 5 , 4.4 × 10 5 , 4.4 × 10 5 , 4.4 × 10 5 , and 4.4 × 10 5 bar 1 at temperature 280, 290, 300, 310, 320, and 340 K, respectively [90]. Each system was simulated for 250 ns and the all atomic coordinates were recorded after each 100 fs.

3. Results and Discussion

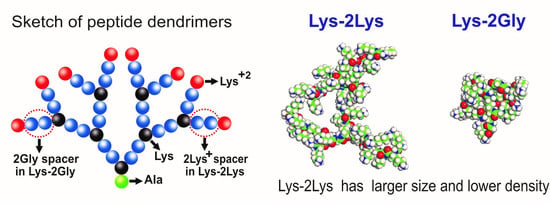
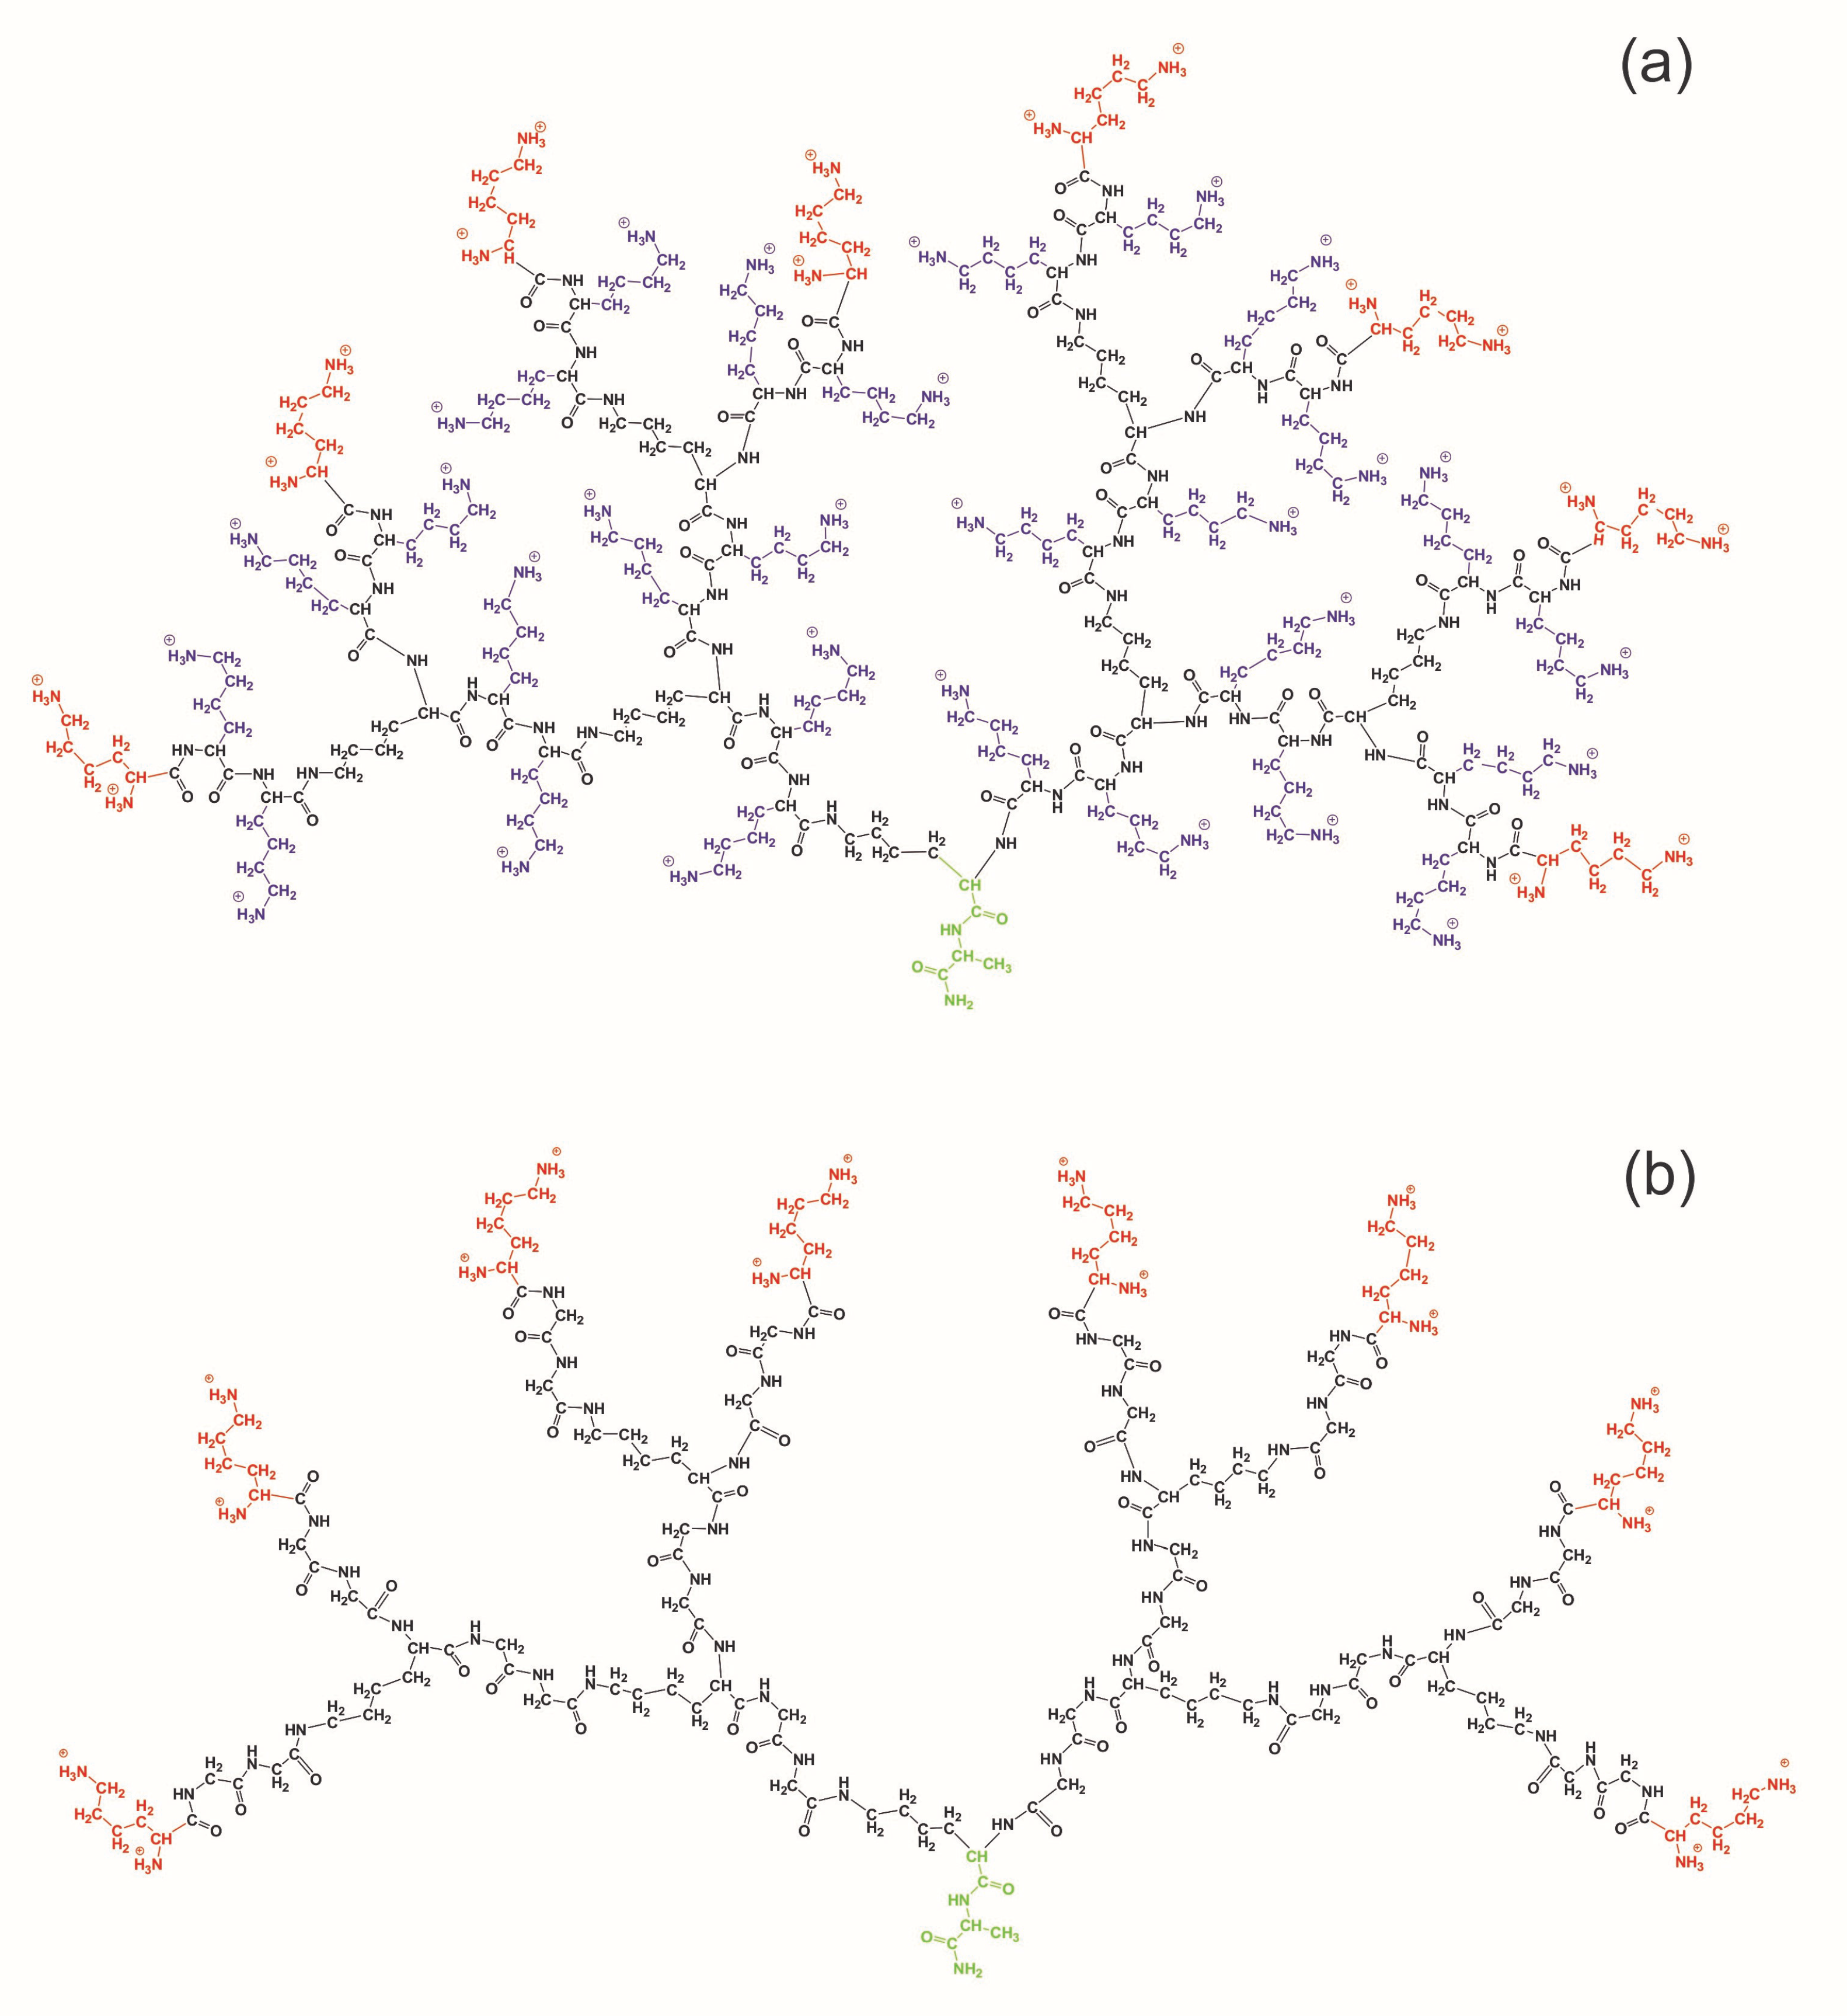
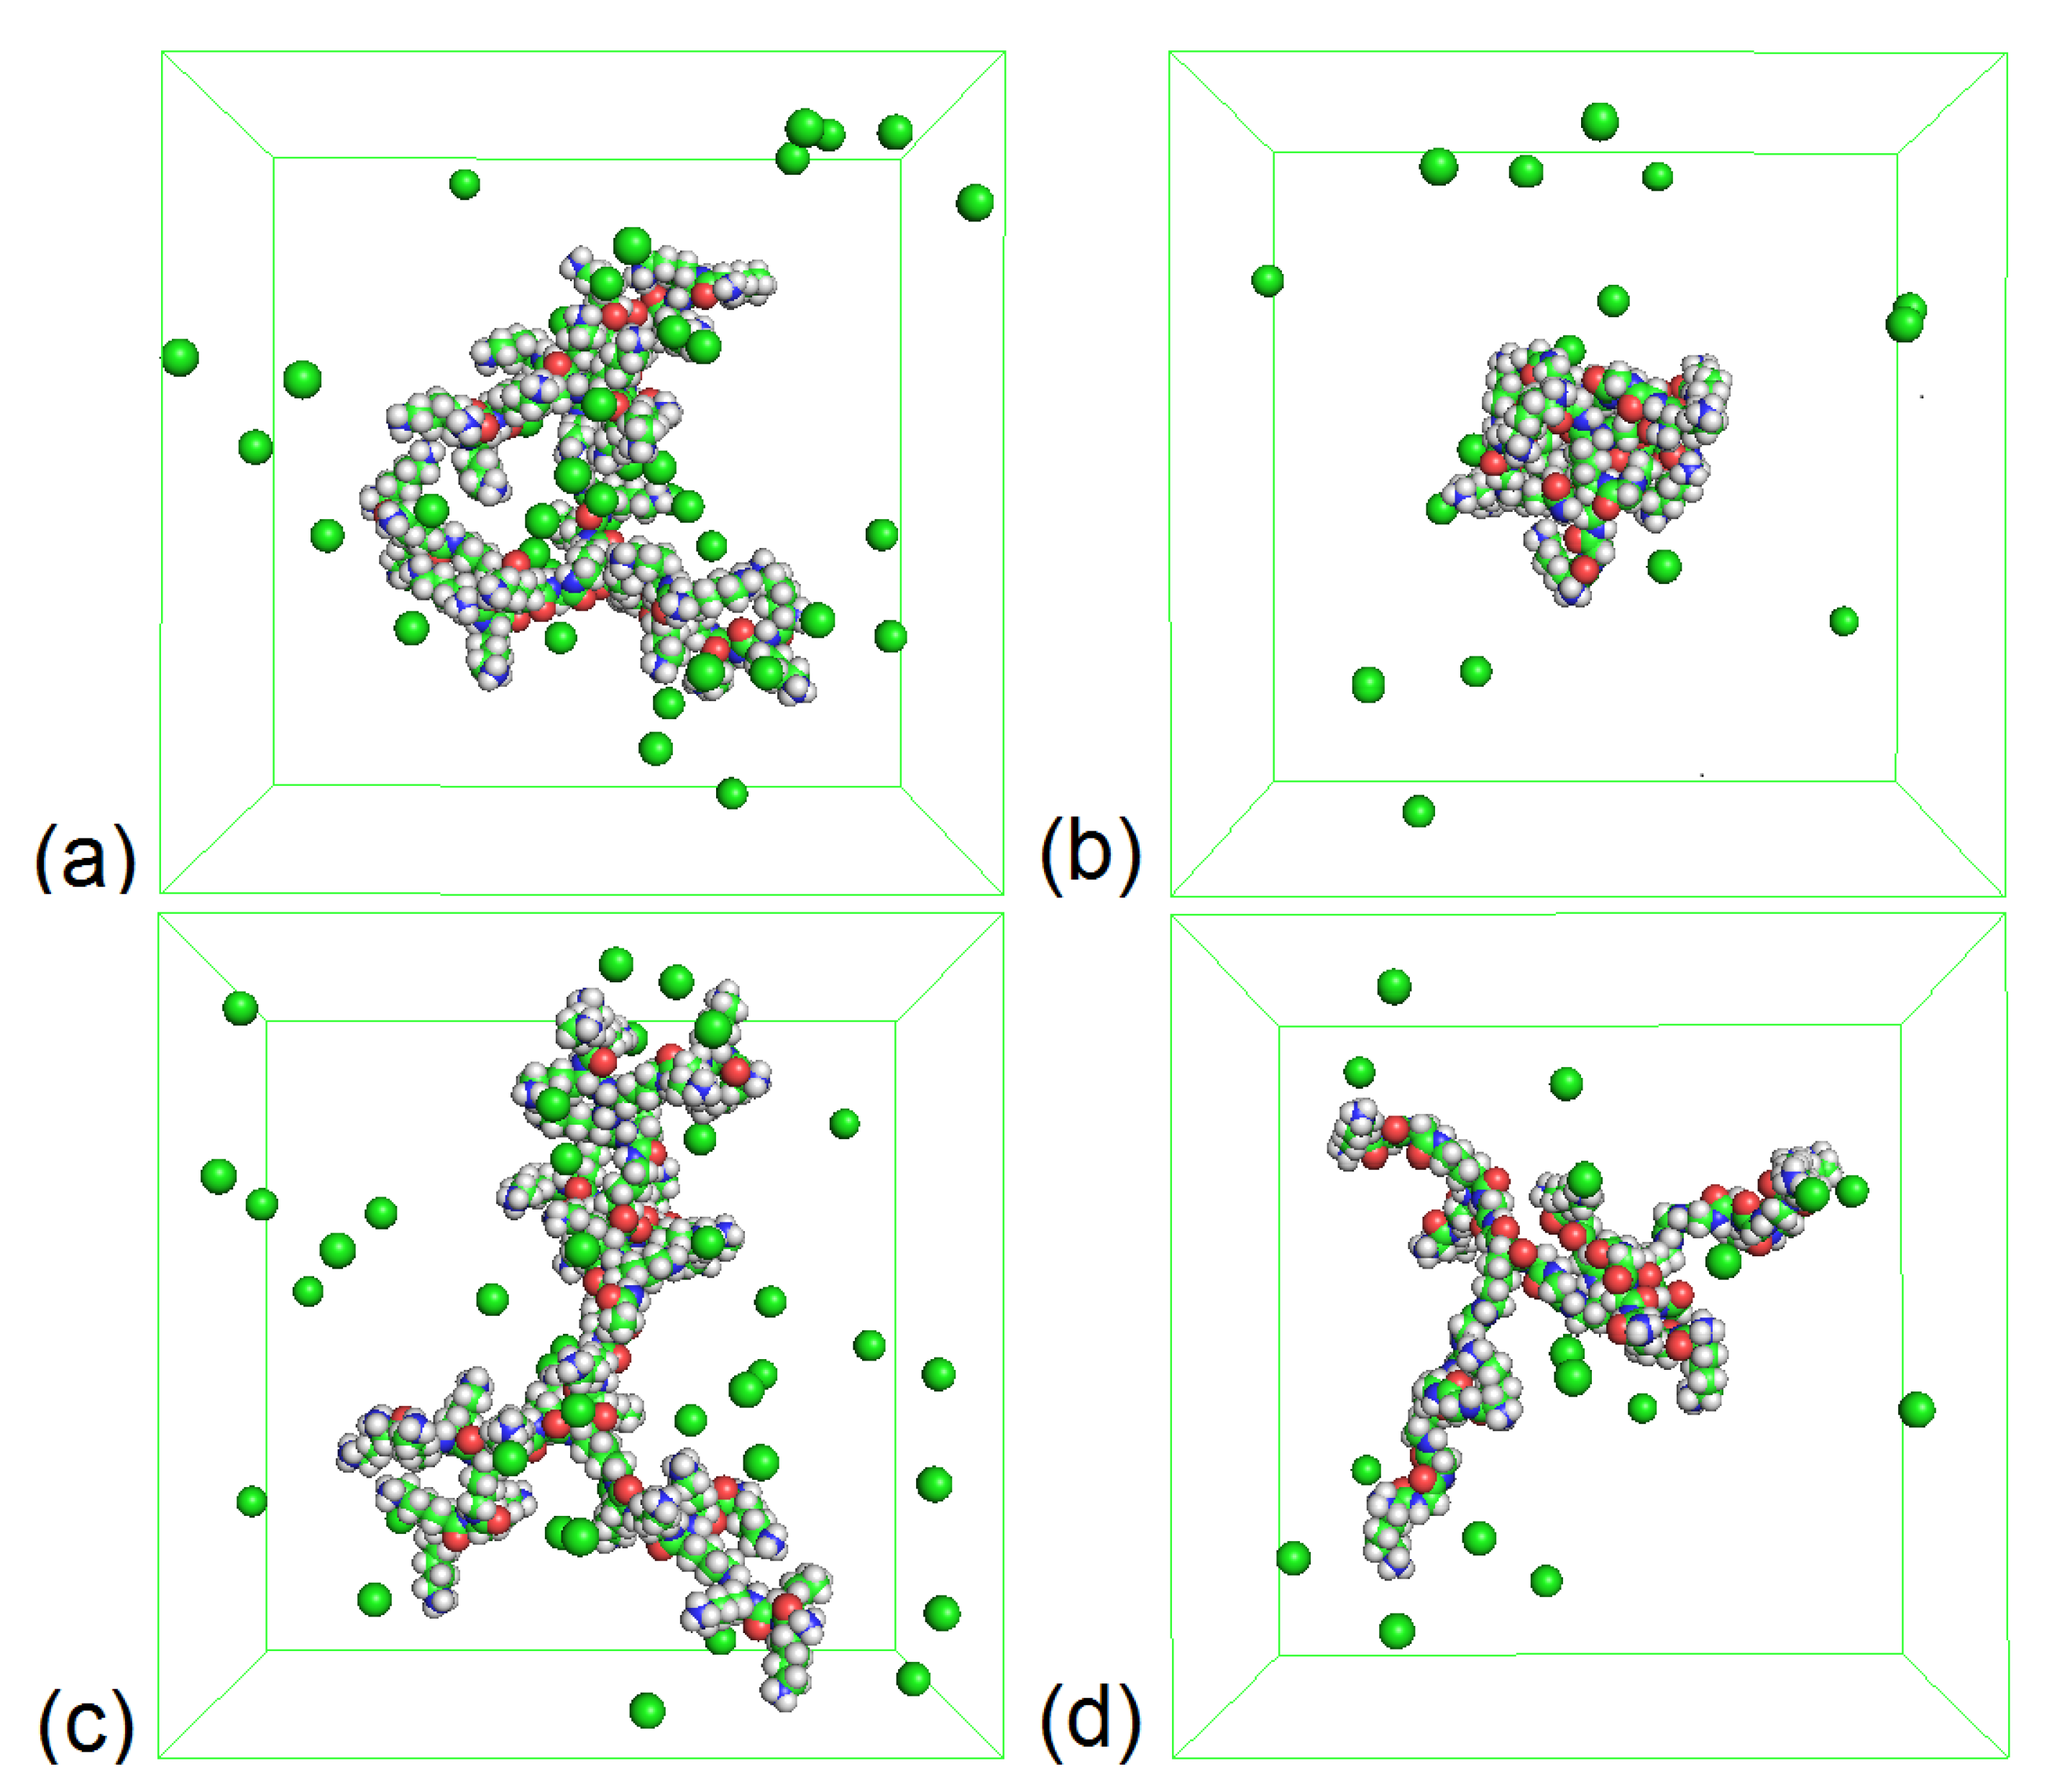
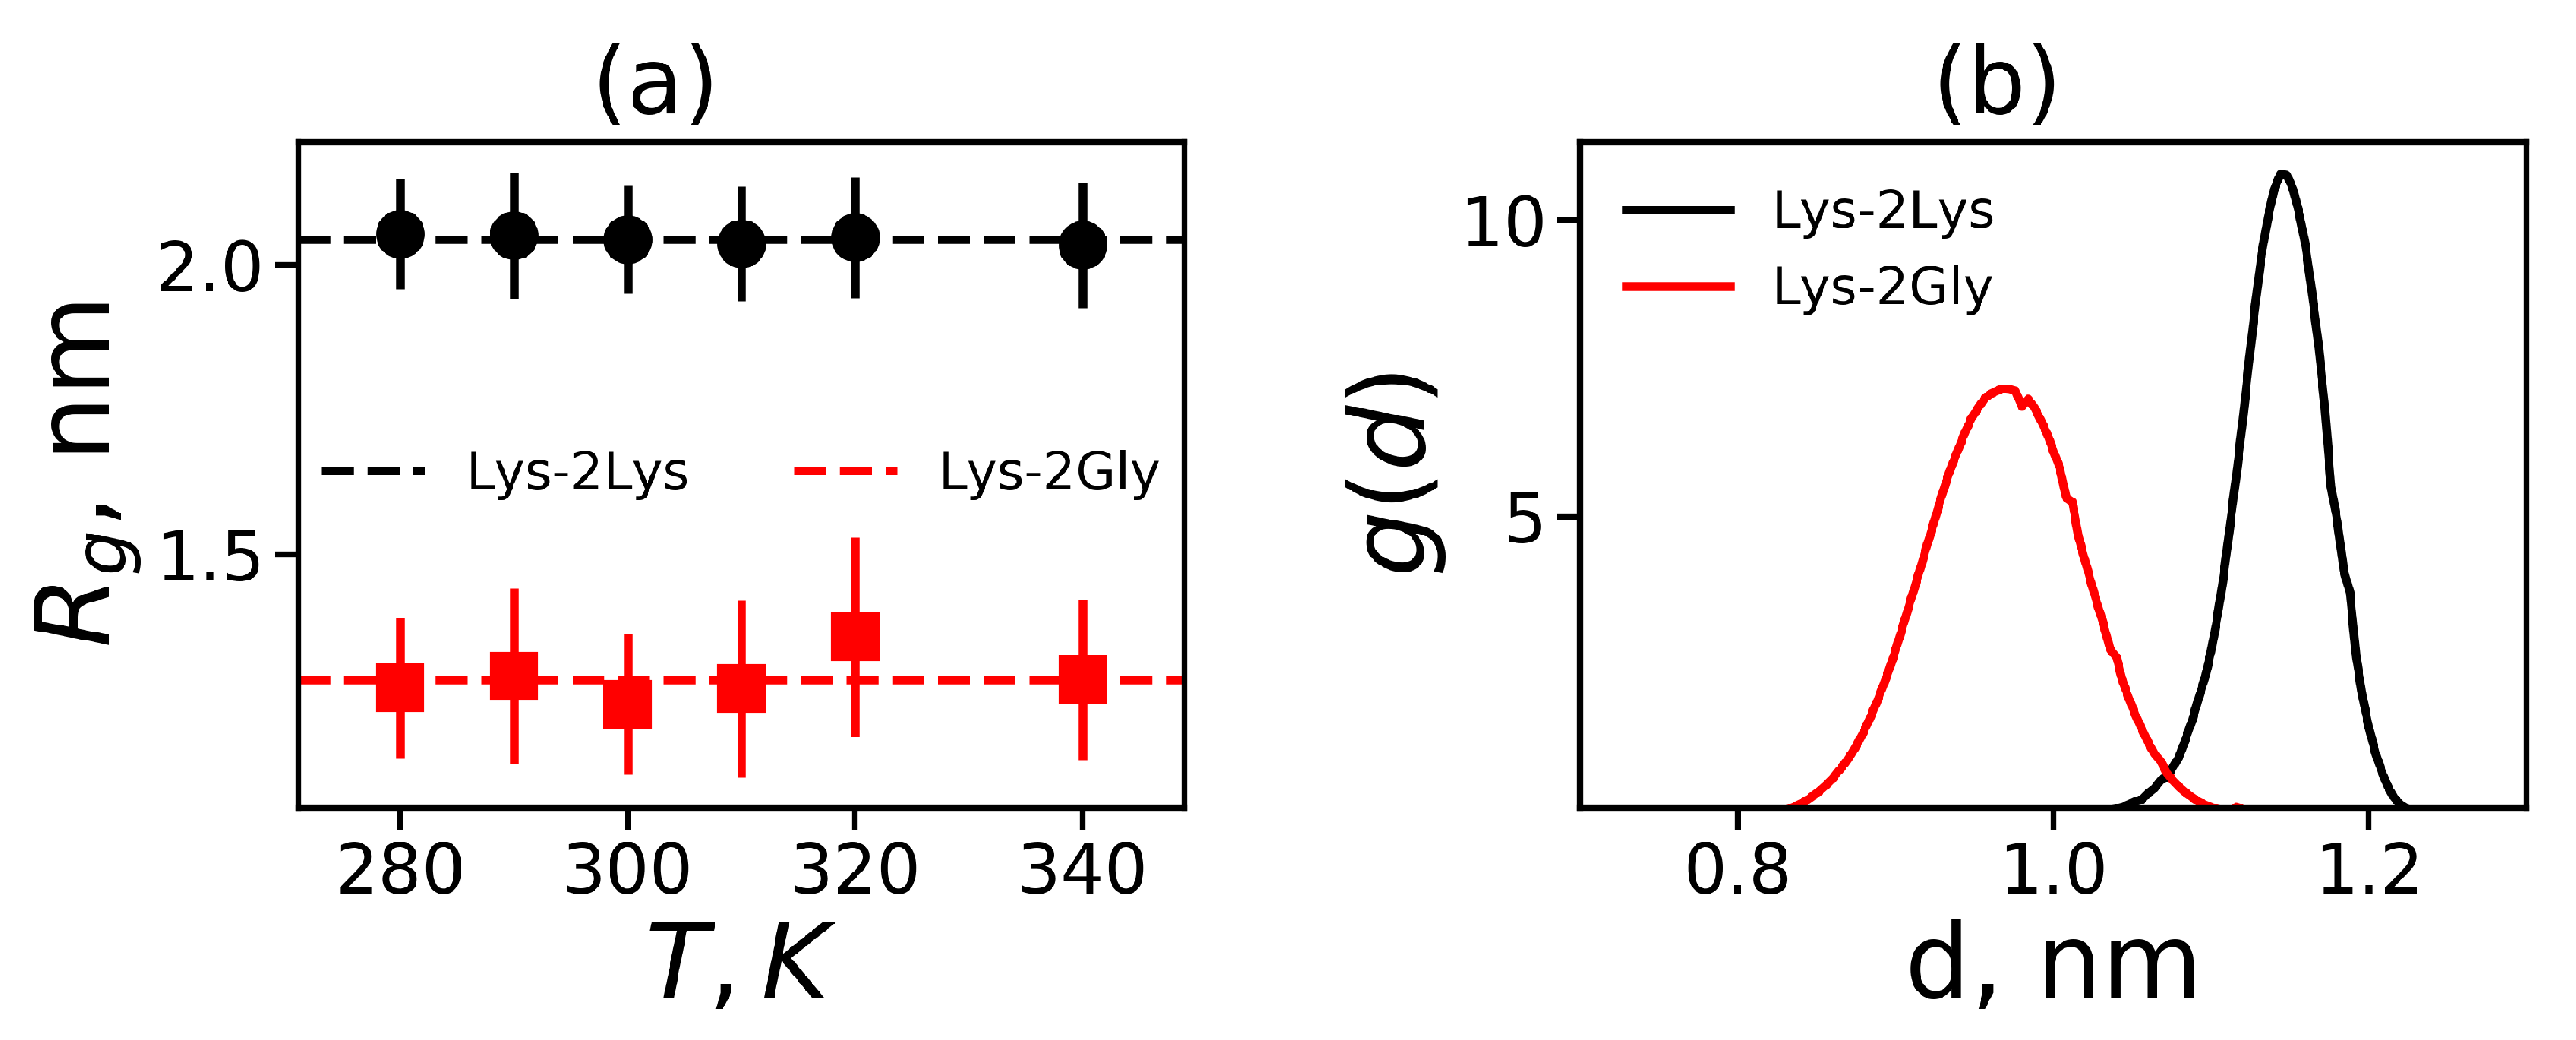
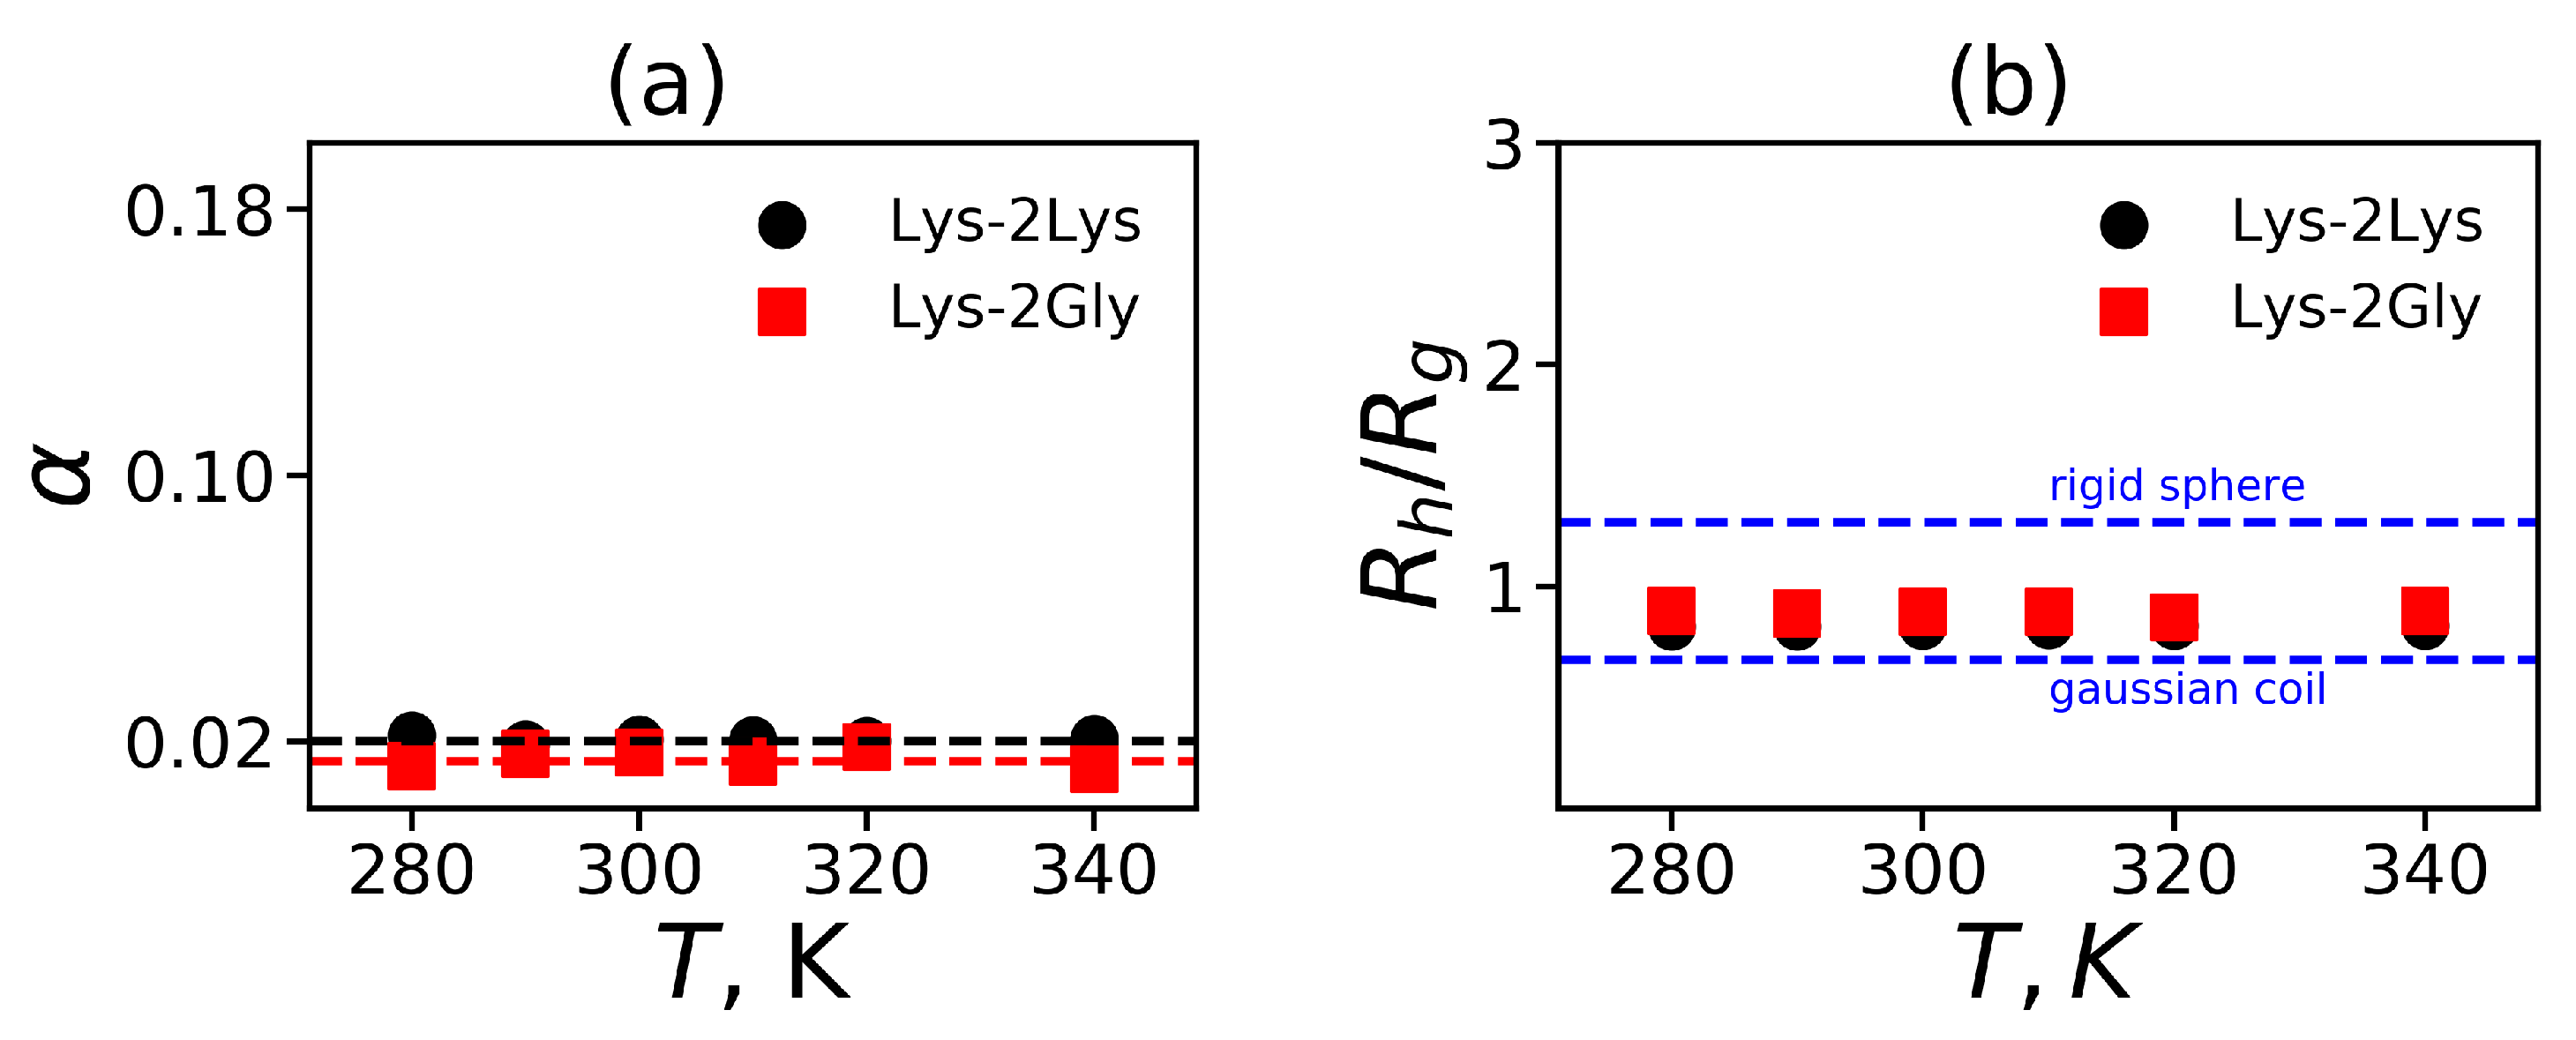
3.1. The Global Characteristics

The characteristic size of a dendrimer can be estimated as a mean-squared gyration radius,
R g = 1 M i m i r i 2 1 / 2 ,
where M , m i are the molecular masses of the dendrimers and its i-th atom correspondingly and r i is the distance from the i-th atom to the center of mass of the dendrimer. The dependence of the mean-squared gyration radius R g on time for both dendrimers at temperature T = 310 K (the average temperature of a human body) is represented in Figure 2.
Figure 2 demonstrates that the sizes of both dendrimers fluctuate, but their average values and magnitudes of fluctuation do not change with time. It indicates that the dendrimers are close to equilibrium state. The mean square size for Lys-2Lys is close to 2.0 nm and for Lys2Gly it is equal 1.35 nm, thus their ratio is close to 1.5. This result is in agreement with the experimental data [63]. The variation of size of the Lys-2Lys dendrimer occurs between 1.7 nm and 2.3 nm, while the size of the Lys-2Gly dendrimer is in the range of 0.9 to 1.8 nm, i.e., the magnitudes of fluctuations are 0.6 nm and 0.9 nm, respectively. Thus, the relative fluctuations (the ratio of fluctuation to the average size of each dendrimer is equal to 0.6/2.0 = 0.30 and 0.9/1.35 = 0.67, correspondingly). This means that the relative fluctuations of the size for Lys-2Gly dendrimers with 2Gly spacers are more than two times (0.67/0.3) greater than for dendrimers with 2Lys spacers.
To demonstrate the differences of fluctuations of the dendrimer sizes, we display in Figure 3 the snapshots of the systems at temperature T = 310 K. In Figure 3, the conformations of dendrimers under consideration at minimum ( min R g ( t ) ) and maximum ( max R g ( t ) ) sizes are presented. We can see that Lys-2Gly essentially has a more compact structure than Lys-2Lys in this limit. The conformation of Lys-2Lys at maximum size (Figure 3c) is swollen and extended unlike its conformation at minimal size (Figure 3a). In the case of Lys-2Gly, the conformation maximal size (Figure 3d) is much more swollen in comparison to its conformation at minimal size (Figure 3b). However, Lys-2Gly with 2Gly spacers has an essentially greater conformational freedom than Lys-2Lys with 2Lys spacers. This result has been expected from the results presented in Figure 2.
The timescale of characteristic fluctuations of the dendrimer size as well as of the rotational motion of the dendrimer as a whole can be estimated from the autocorrelation function (ACF) of the square of the gyration radius R g ,
C R g 2 ( t ) = R g 2 ( τ ) × R g 2 ( τ + t ) R g 2 2 R g 4 R g 2 2
and the first-order orientational autocorrelation function (1st order ACF) for vector from C α in lysine in the core to the C α in the terminal lysines:
P 1 r o t ( t ) = r ( t ) , r ( 0 ) r ( t ) r ( 0 )
Examples of the time dependencies of these ACFs are presented in Figure 4 at temperature T = 310 K.
According to Figure 4a,b, the orientational ACFs have slower time decays than the ACFs for the square of the dendrimer size. The functions P 1 r o t ( t ) and C R g ( t ) decay slower for the Lys-2Lys dendrimer than for Lys-2Gly. The characteristic relaxation times τ r o t P 1 ( P 1 ( τ r o t P 1 ) = 1 / e ) obtained at different temperatures from the orientational ACFs are presented in Table 2. These times decrease with an increase of temperature. The values of all times are between 1 to 15 ns, i.e., much smaller than the total time of simulation (250 ns). Thus, the total simulation time is enough to get the well-equilibrated systems. The lysine dendrimers [29] at room temperature have the rotation of a dendrimer as a whole equal to 2.4 ns that it is comparable with the τ r o t P 1 = 2.8 ns for Lys-2Gly and more than 3 times lower than τ r o t P 1 for Lys-2Lys. The characteristic times for Lys-2Lys at all temperatures are greater than for Lys-2Gly. This result confirms that the Lys-2Gly is more compact at all temperatures than Lys-2Lys.
To study the temperature dependences of dendrimer size for both dendrimers we plotted in Figure 5a the gyration radius R g for Lys-2Lys and Lys-2Gly dendrimers as a function of temperature. According to Figure 5a, the gyration radius R g does not change with temperature for both dendrimers. The average values of R g for these dendrimers are depicted by dashed lines in Figure 5a. The size of Lys-2Lys ( R g 2 nm) is approximately 1.5 times larger than the size of Lys-2Gly ( R g 1.35 nm). The size of Lys-2Gly is also close to the size of the usual (without insertion of 2Lys or 2Gly spacers) Lys-dendrimer ( R g = 1.2 nm) simulated in the recent paper [31].
Thus, despite the same contour lengths of paths from the first branching point to the terminal lysines of both dendrimers, the Lys-2Lys is much more swollen at all temperatures than the Lys-2Gly dendrimer. These paths consist of spacers between the neighboring branching points. In our dendrimers of the second generation there are 2Lys or 2Gly spacers inserted into the 0th, 1st, and 2nd subgenerations. We plotted in Figure 5b the distribution g ( d ) of all these spacer mean square end-to-end distances d averaged through all subgenerations for each dendrimer. It is easy to see that 2Gly spacers in Lys-2Gly have a maximum of g ( d ) at smaller d, but its distribution is wider, in agreement with the results of Figure 2. This means that the differences between the gyration radii of both dendrimers can be explained by the differences of the spacer characteristics: the mean square lengths and the magnitudes of length fluctuations. The last characteristic is connected with the flexibility of the spacers. This result is in agreement with the smaller characteristic ratio for the end-to-end distances [91] and the bending energies [92] of linear polyglycine in comparison with linear polylysine peptides. Moreover, this is confirmed by the wide use of short flexible glycine linkers [93] for chemical attaching of the bioactive molecules to nanocontainers (linear peptides and dendrimers) for delivery to the target cells or organs.
Such a difference in the values and fluctuations of the dendrimer sizes, as well as in the spacer lengths might indicate that these dendrimers have different shapes. Moreover, the local images of dendrimers with the smallest and largest R g (see Figure 3) also demonstrate that dendrimers in these states have different shapes. To check the average shape of our dendrimers, we can use the approximation of the dendrimer as a 3D ellipsoid with semi-axes corresponding to eigenvalues I x , I y , and I z of the dendrimer’s gyration tensor [94]:
A μ ν = 1 N i = 1 N μ i μ c ν i ν c , μ , ν = x , y , z
where ( x i , y i , z i ) and ( x c , y c , z c ) are coordinates of the i-th bead and the center of mass, respectively. The main axes of the tensor allow calculation of the asphericity parameter α [95,96,97]:
α = 1 3 I x I y + I x I z + I y I z I x + I y + I z 2
The value of α is between 0 (for a sphere) and 1 (an extremely elongated ellipsoid). Simulation of different dendrimers shows [95,98,99] that the dendrimers of small generations have an ellipsoidal shape, but their shape becomes more and more spherical with increasing generation number. Figure 6a shows the average value of α as a function of the temperature T for Lys-2Lys and Lys-2Gly dendrimers. It is easy to see that α is almost constant and very similar for both dendrimers. The small values of α (~0.02) indicate that these dendrimers have almost spherical shapes. Interestingly, the lysine dendrimer of the same generation without insertion of 2Lys or 2Gly spacers at room temperature [31] has α ~ 0.2 , i.e., it is an order of magnitude larger than the values obtained in this study for Lys-2Lys and Lys-2Gly dendrimers.
As our dendrimers have a spherical shape, we can apply to them different theories elaborated for spherical molecules. In particular, we can calculate for our dendrimers the hydrodynamic radius R h , the ratio R h / R g , and radial density profile. The values of R h / R g are different for different models. For example, the Gaussian coil (the penetrable sphere) model [100] has the lowest value of R h / R g = 0.67 . The upper limit case is the impenetrable sphere (the homogeneous rigid sphere) with value R h / R g = 1.29 [100]. To calculate the hydrodynamic radius of our dendrimers R h from MD simulation we can use the Kirkwood approximation [101,102]:
R h 1 = r i j 1 i j ,
where r i j is the distance between two atoms i and j. The ratio R h / R g as a function from temperature is shown in Figure 6b for both dendrimers. The two limiting cases (for the Gaussian coil and for the rigid sphere) are shown by dashed lines too. We evaluated the ratio R h / R g and obtained that it was equal to 0.83 for Lys-2Lys and 0.89 for Lys-2Gly dendrimers at T = 310 K (see Table 3). Both values were between theoretical boundaries for penetrable and rigid spheres. This result is in agreement with the experimental study of the ratio R h / R g for usual lysine dendrimers (without insertion of 2Lys or 2Gly spacers) of different generations in dimethylformamide solvent [25]. We would like to note that the ratio R h / R g should increase with an increasing number of generations [25,32] as dendrimer behavior will approach the behavior of a rigid sphere.
The three characteristic sizes of a dendrimer (see Table 3) at T = 310 K (the average body temperature) are 5 / 3 R g (in approximation a dendrimer as the rigid sphere), and R e is the mean square distance r i from the ends to the center of mass of the dendrimer:
R e = 1 N t i = 1 N t r i 2 1 / 2 ,
and the effective radius R m a x (will be defined below). For both dendrimers, the values of R m a x are larger than other characteristic sizes. For Lys-2Lys, the 5 / 3 R g is close to R e , which is a very usual situation for dendrimers. In the case of Lys-2Gly, the R e is larger than the 5 / 3 R g , meaning that the terminal groups are more often located on the periphery of the dendrimer.

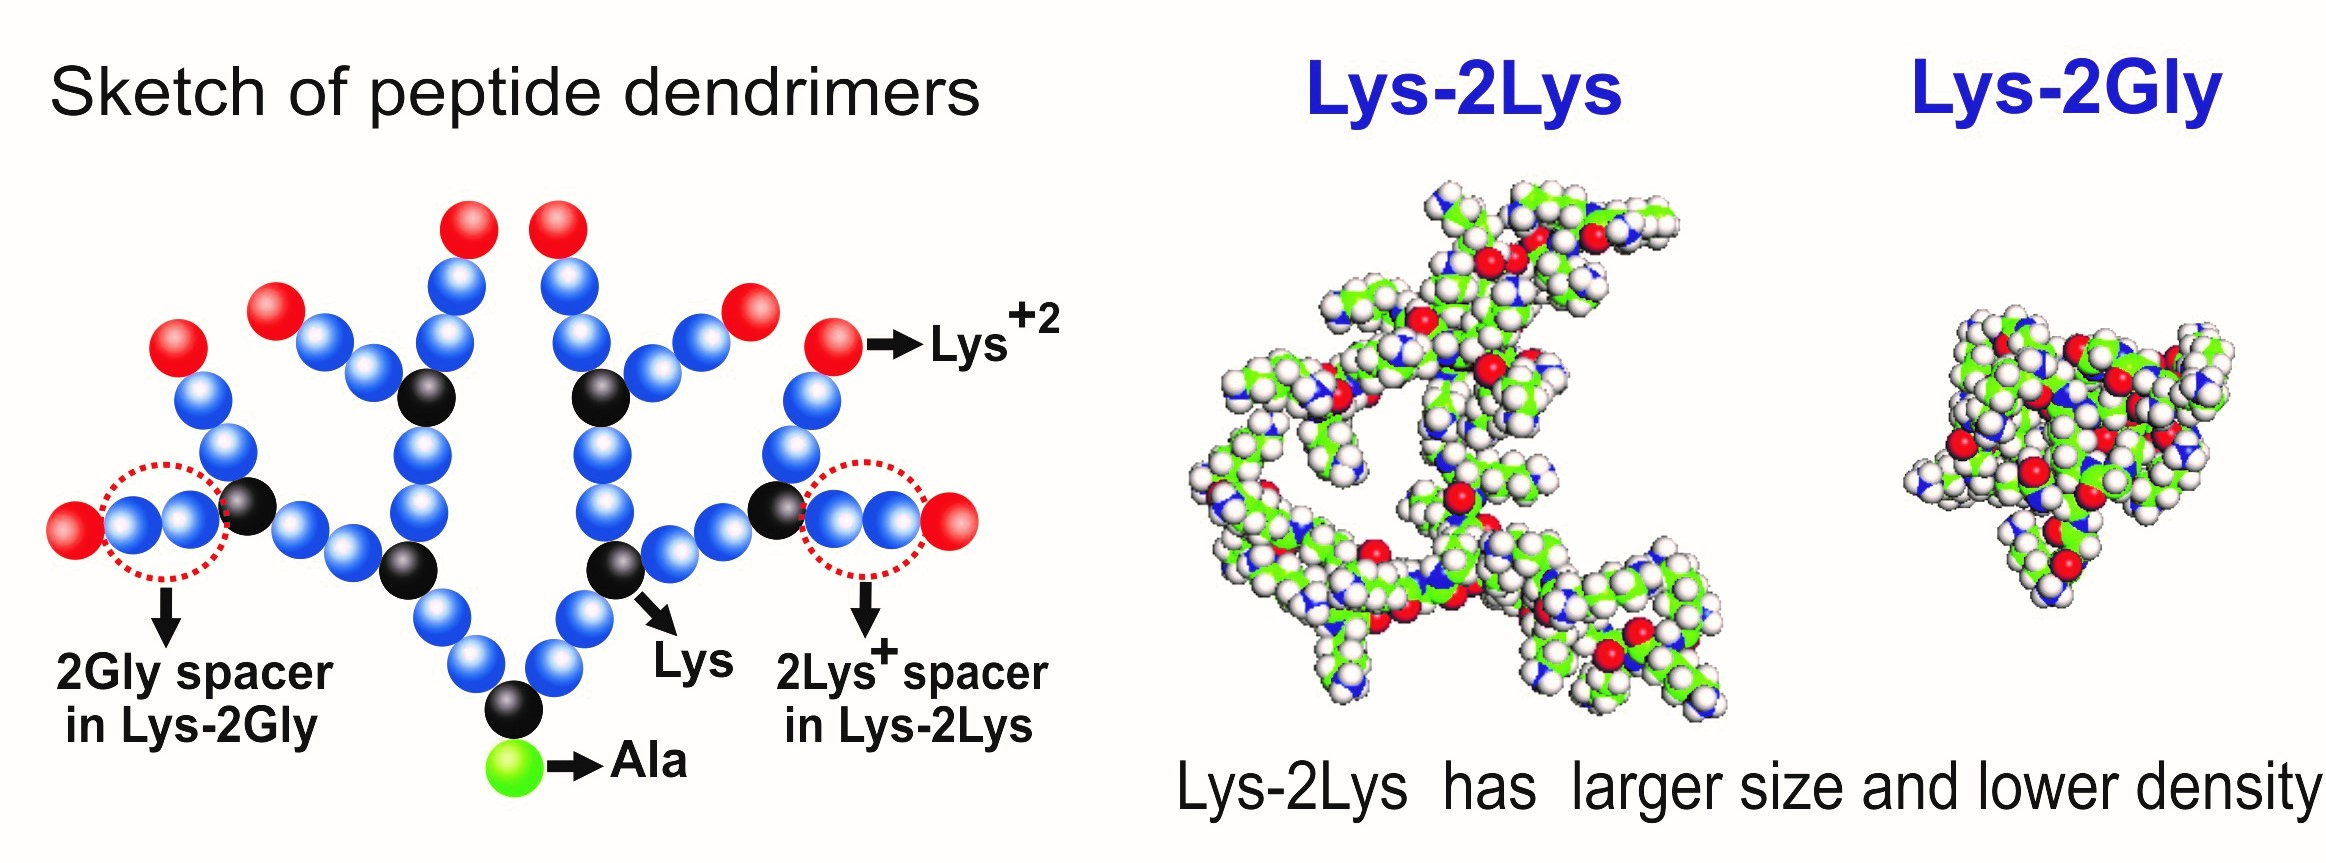
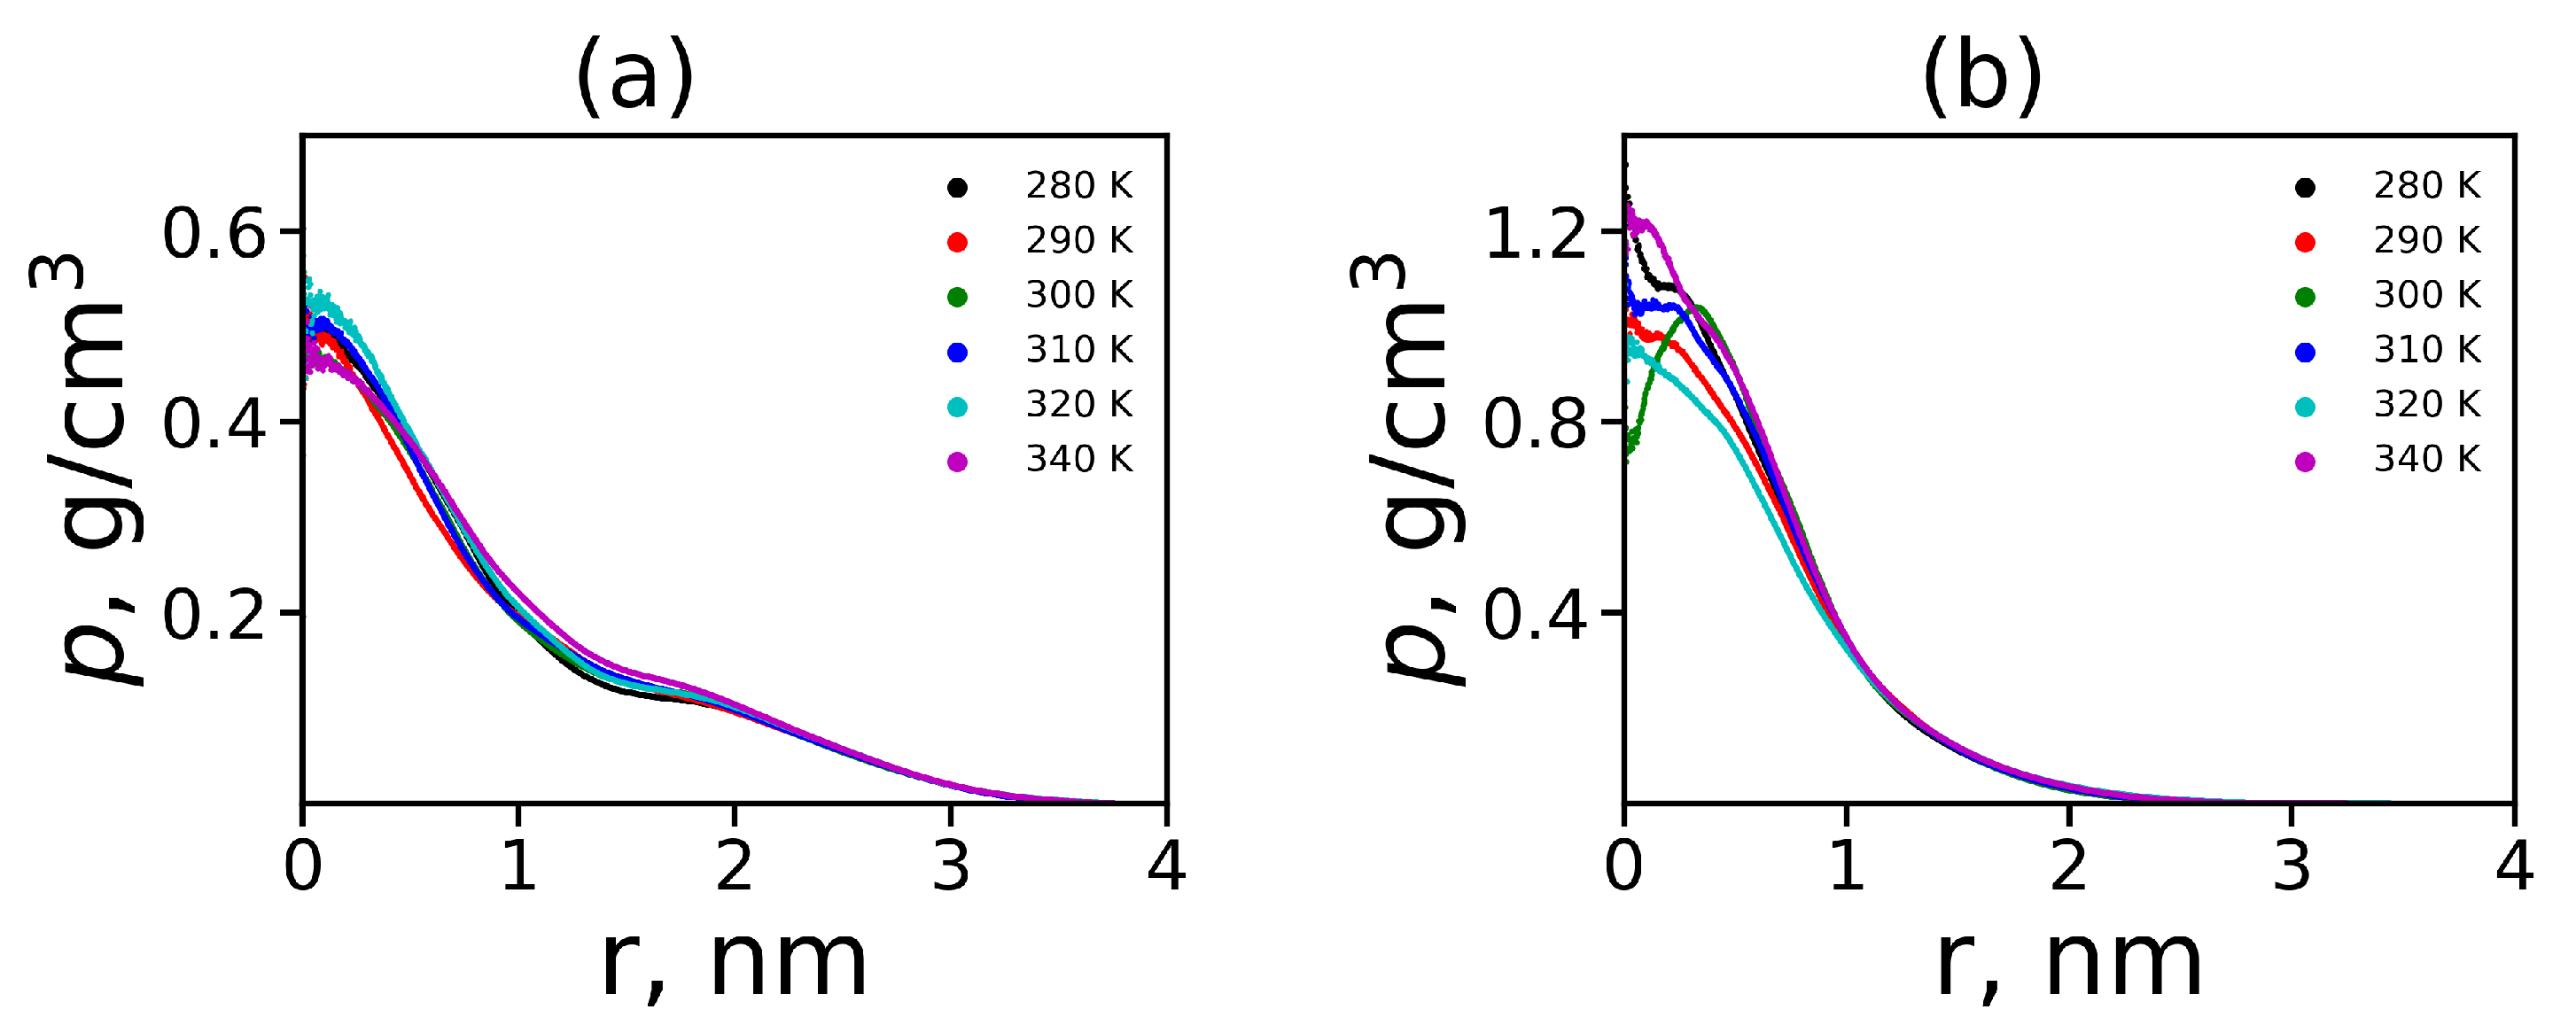
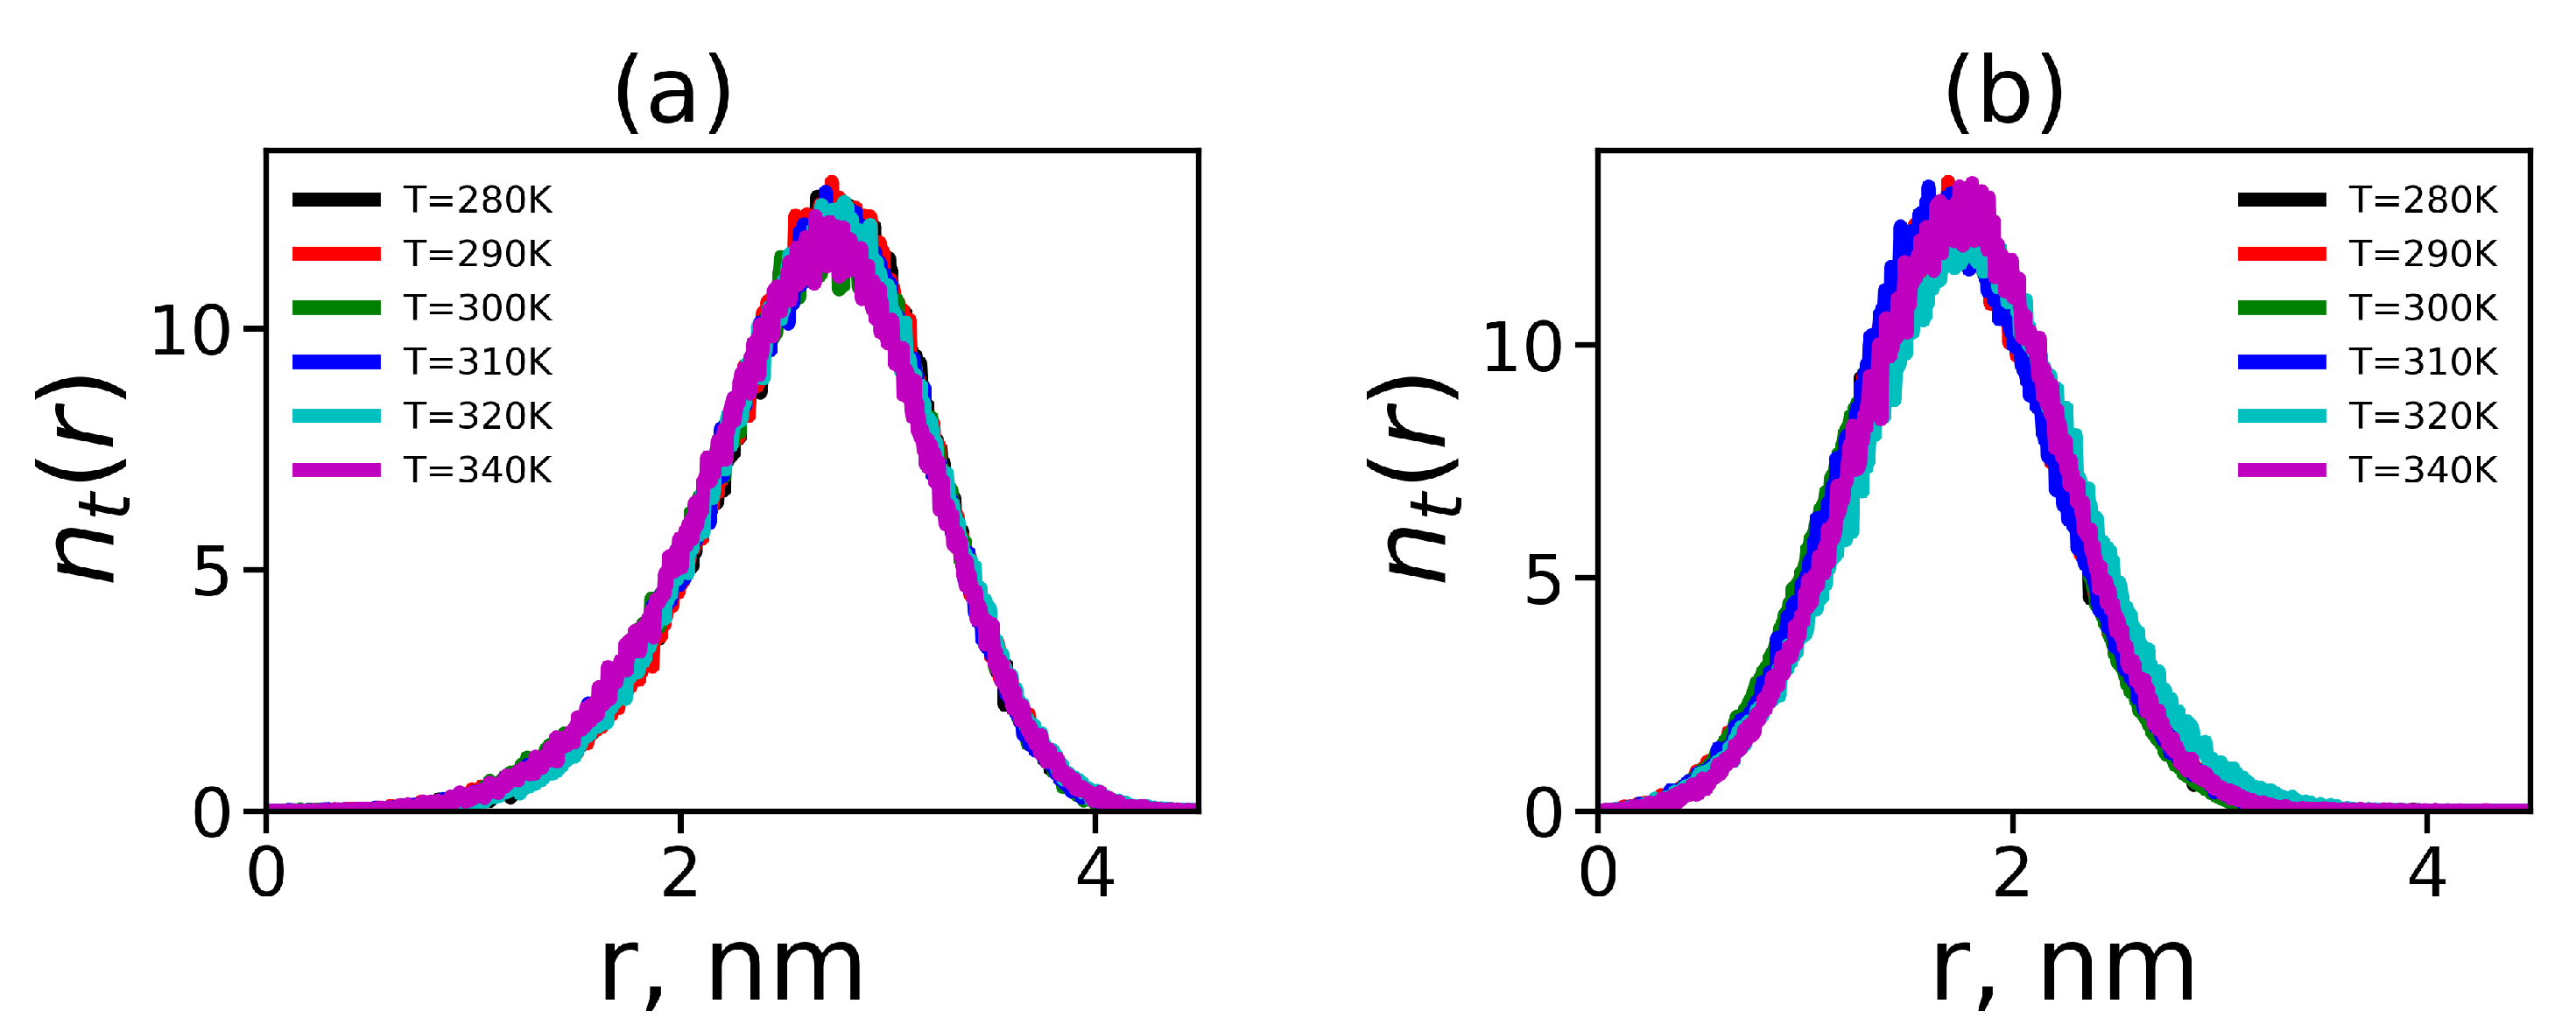
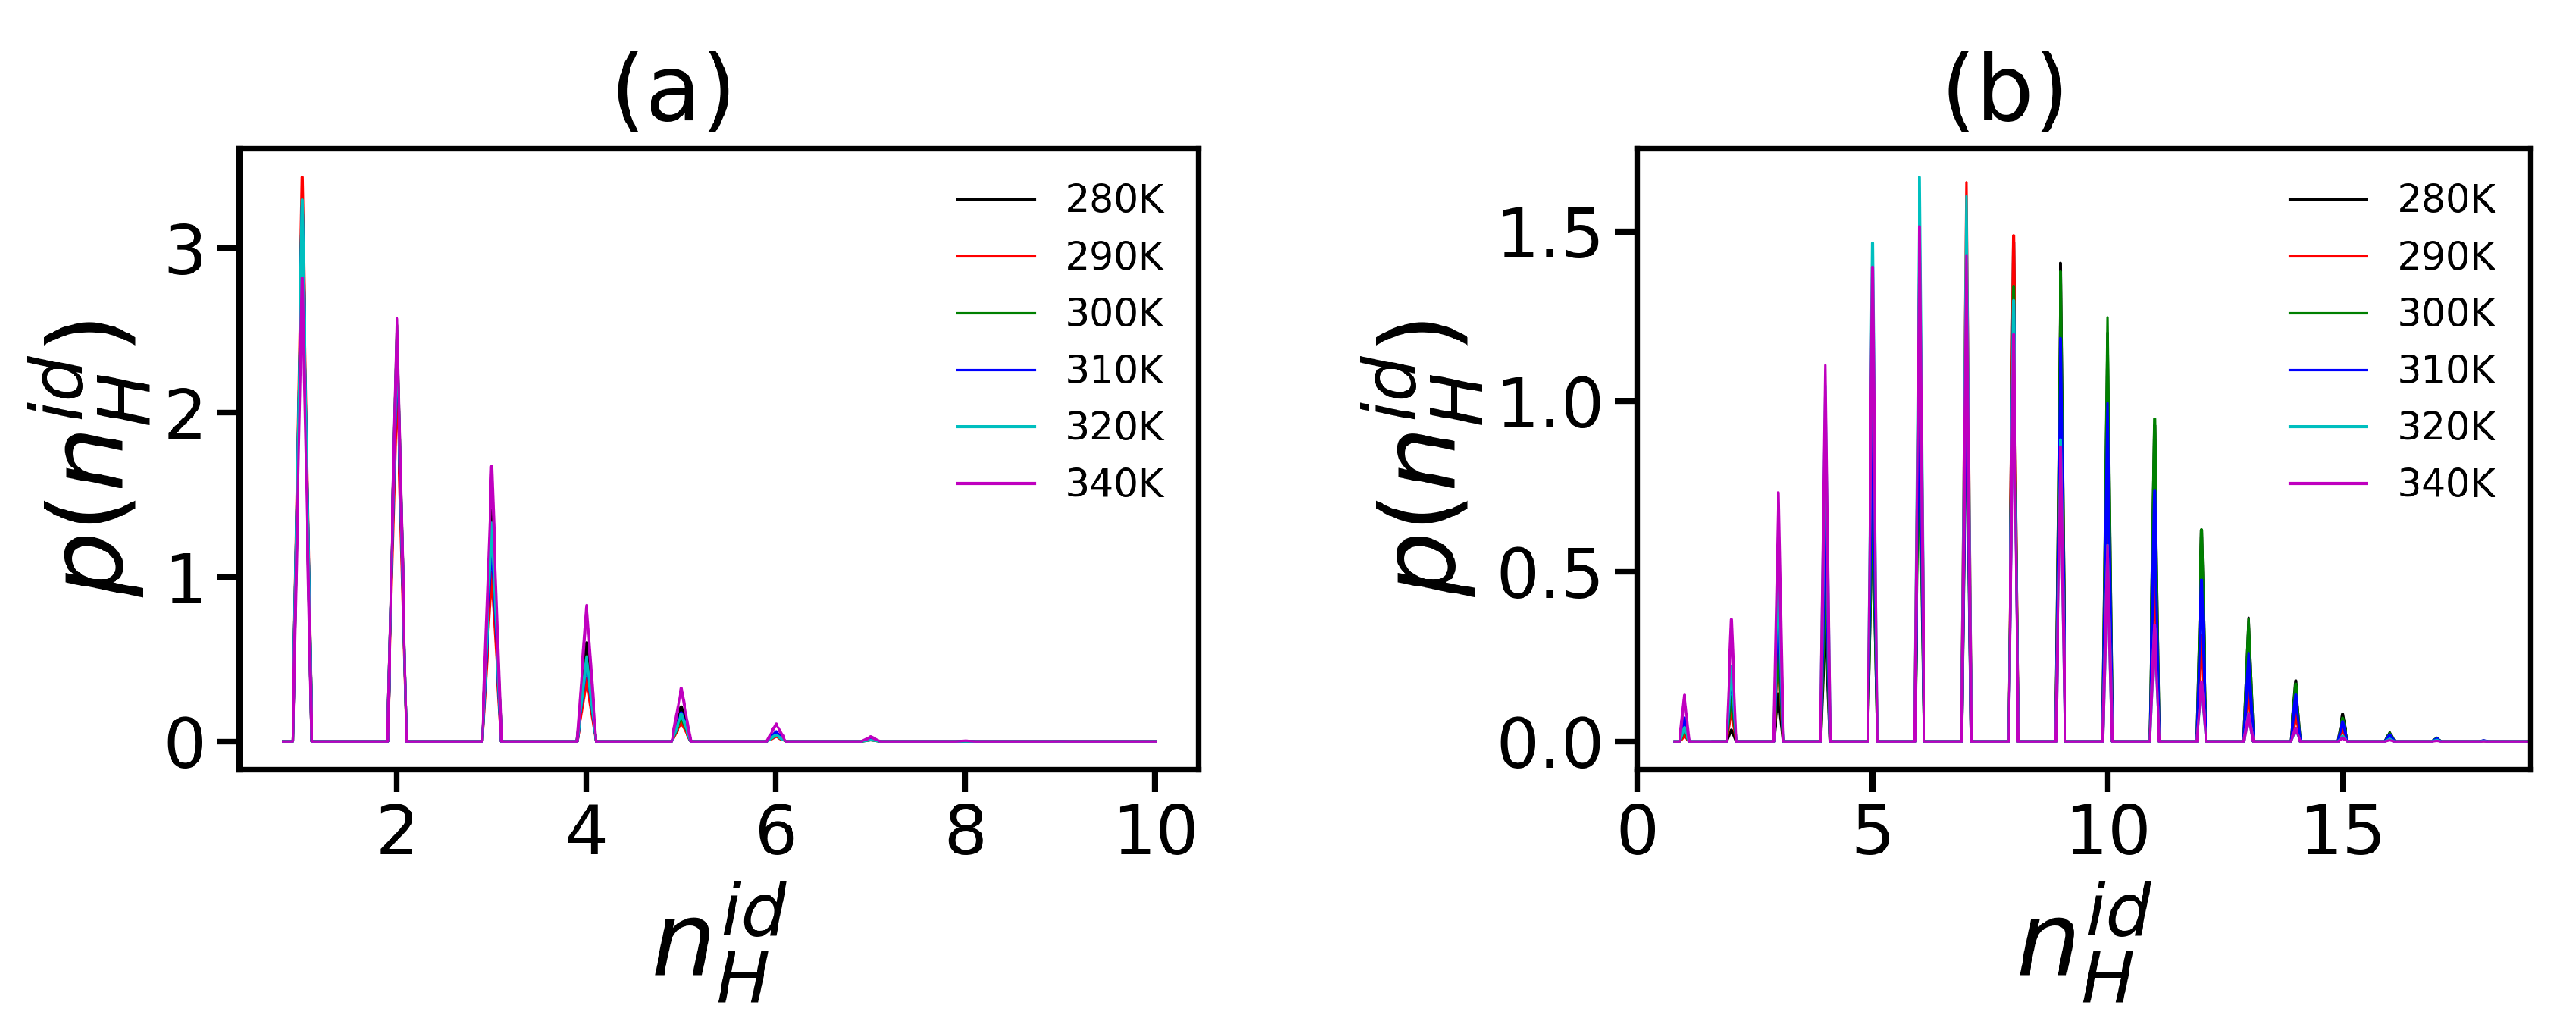
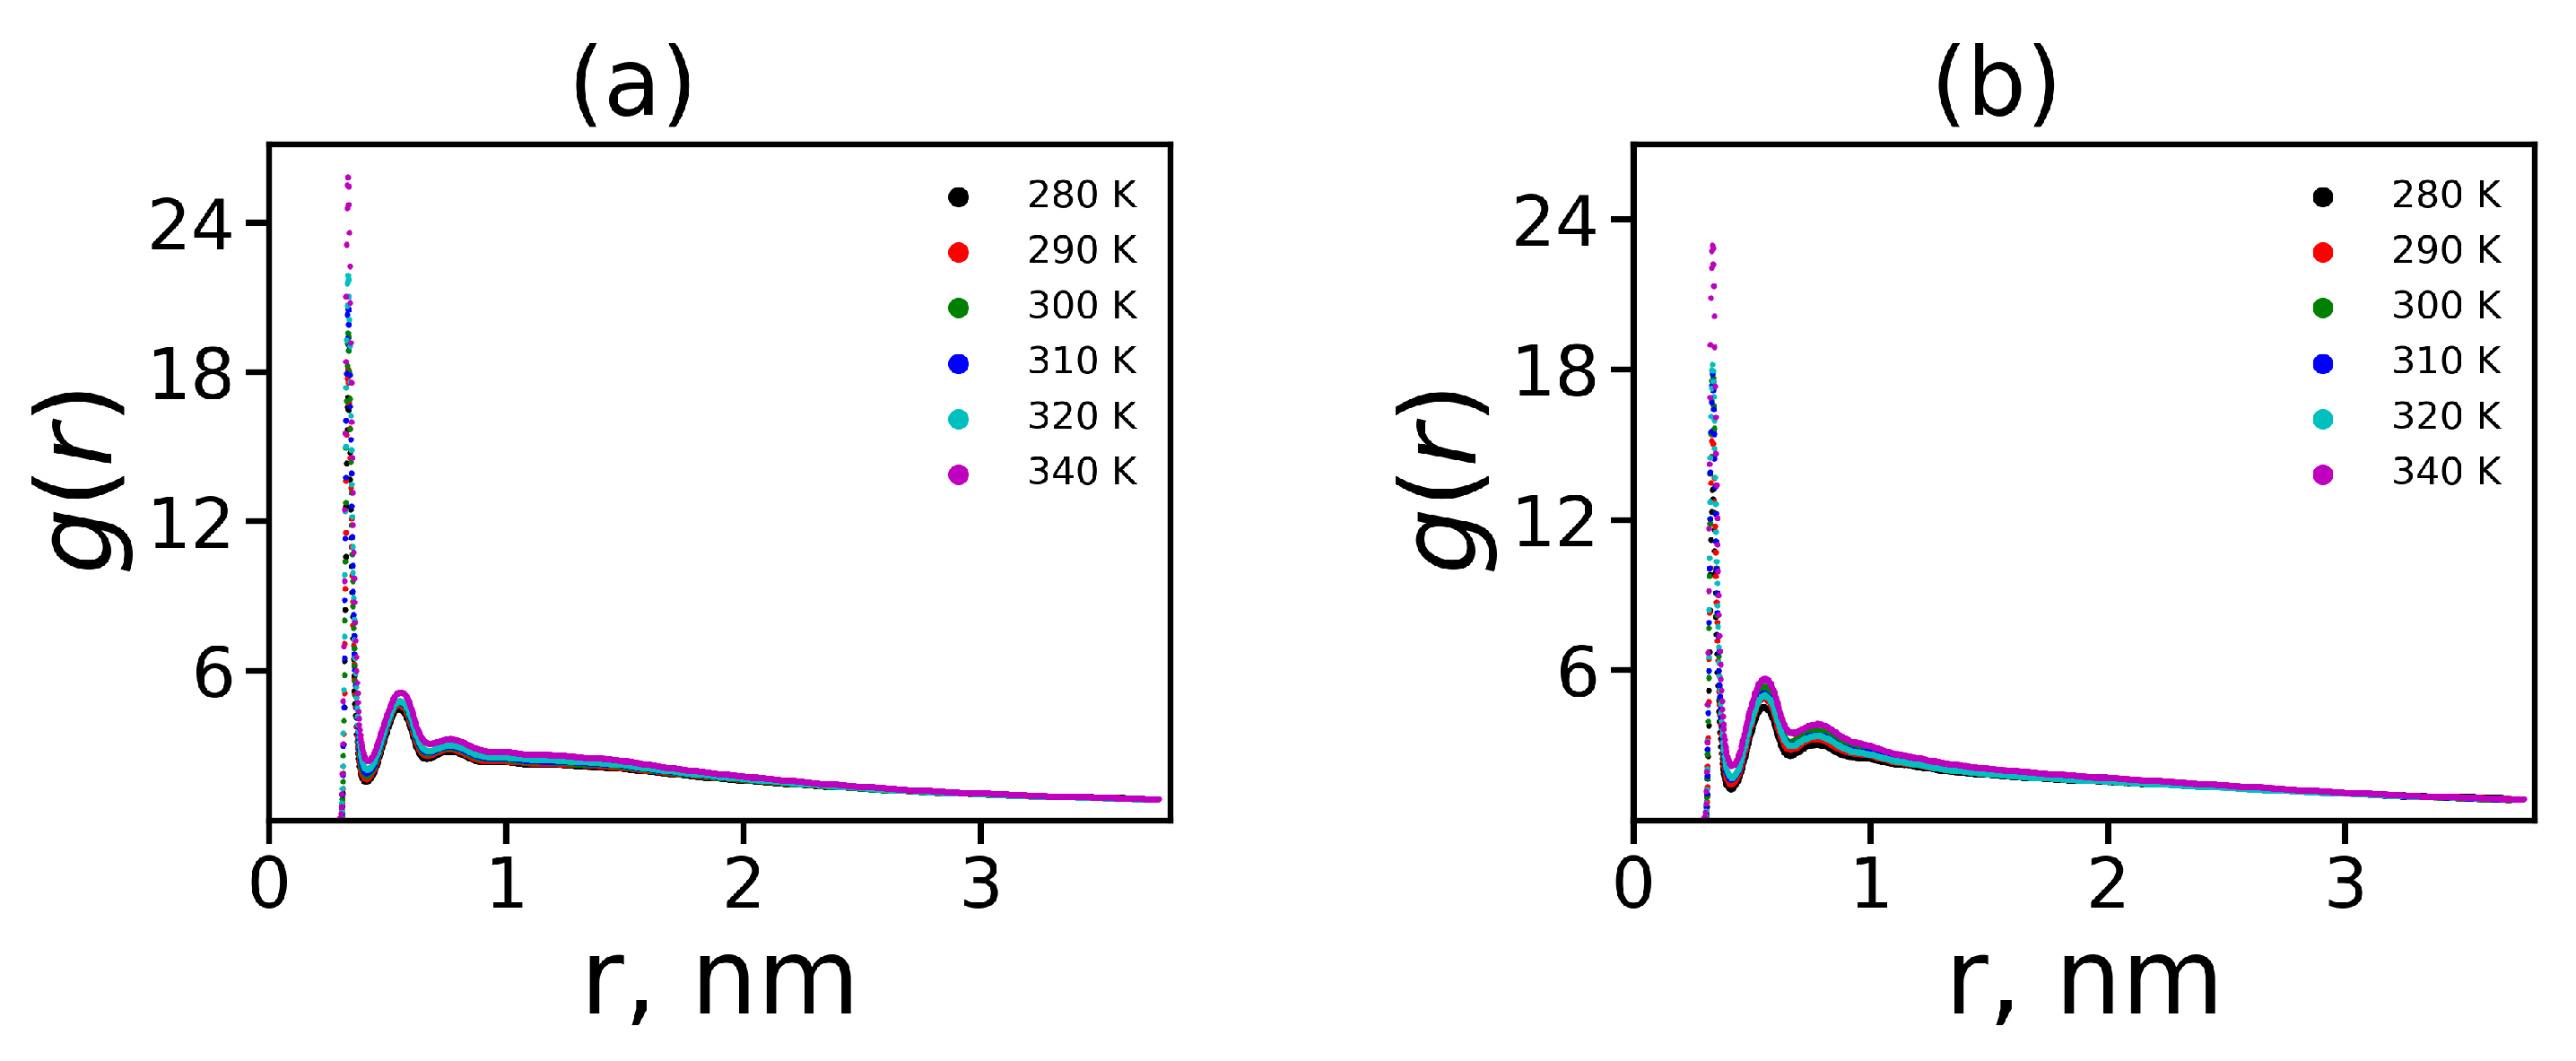
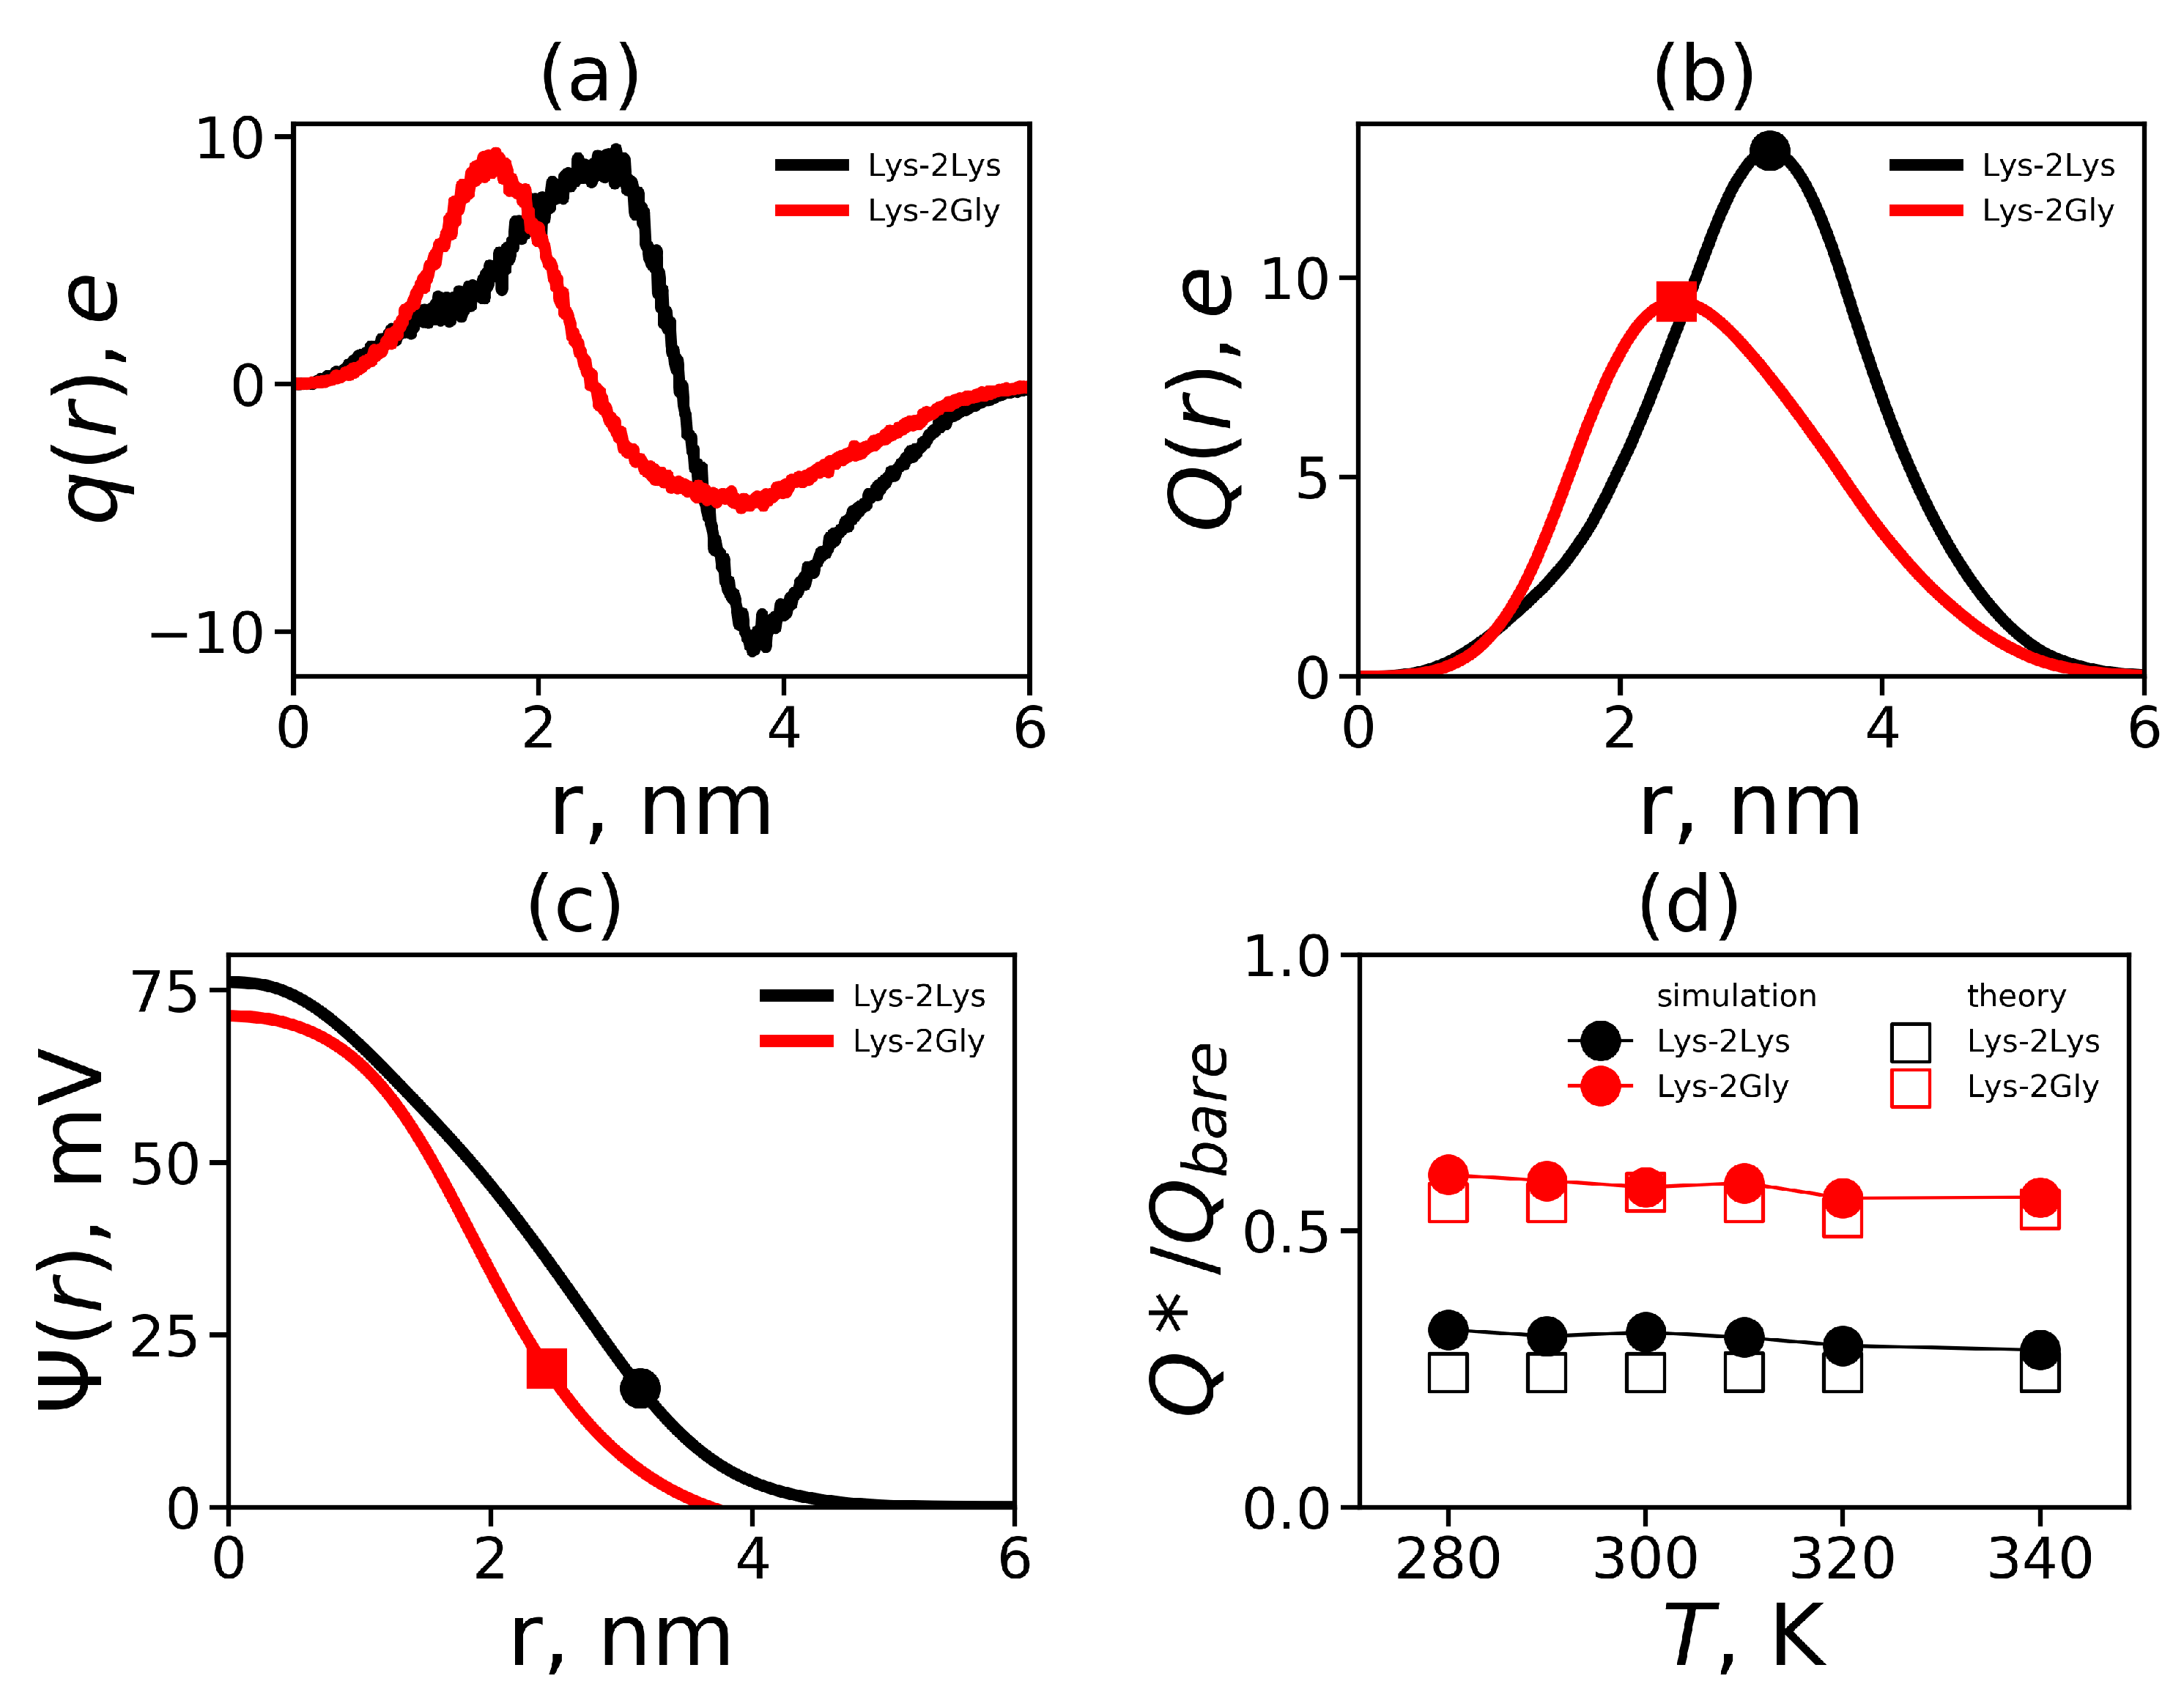
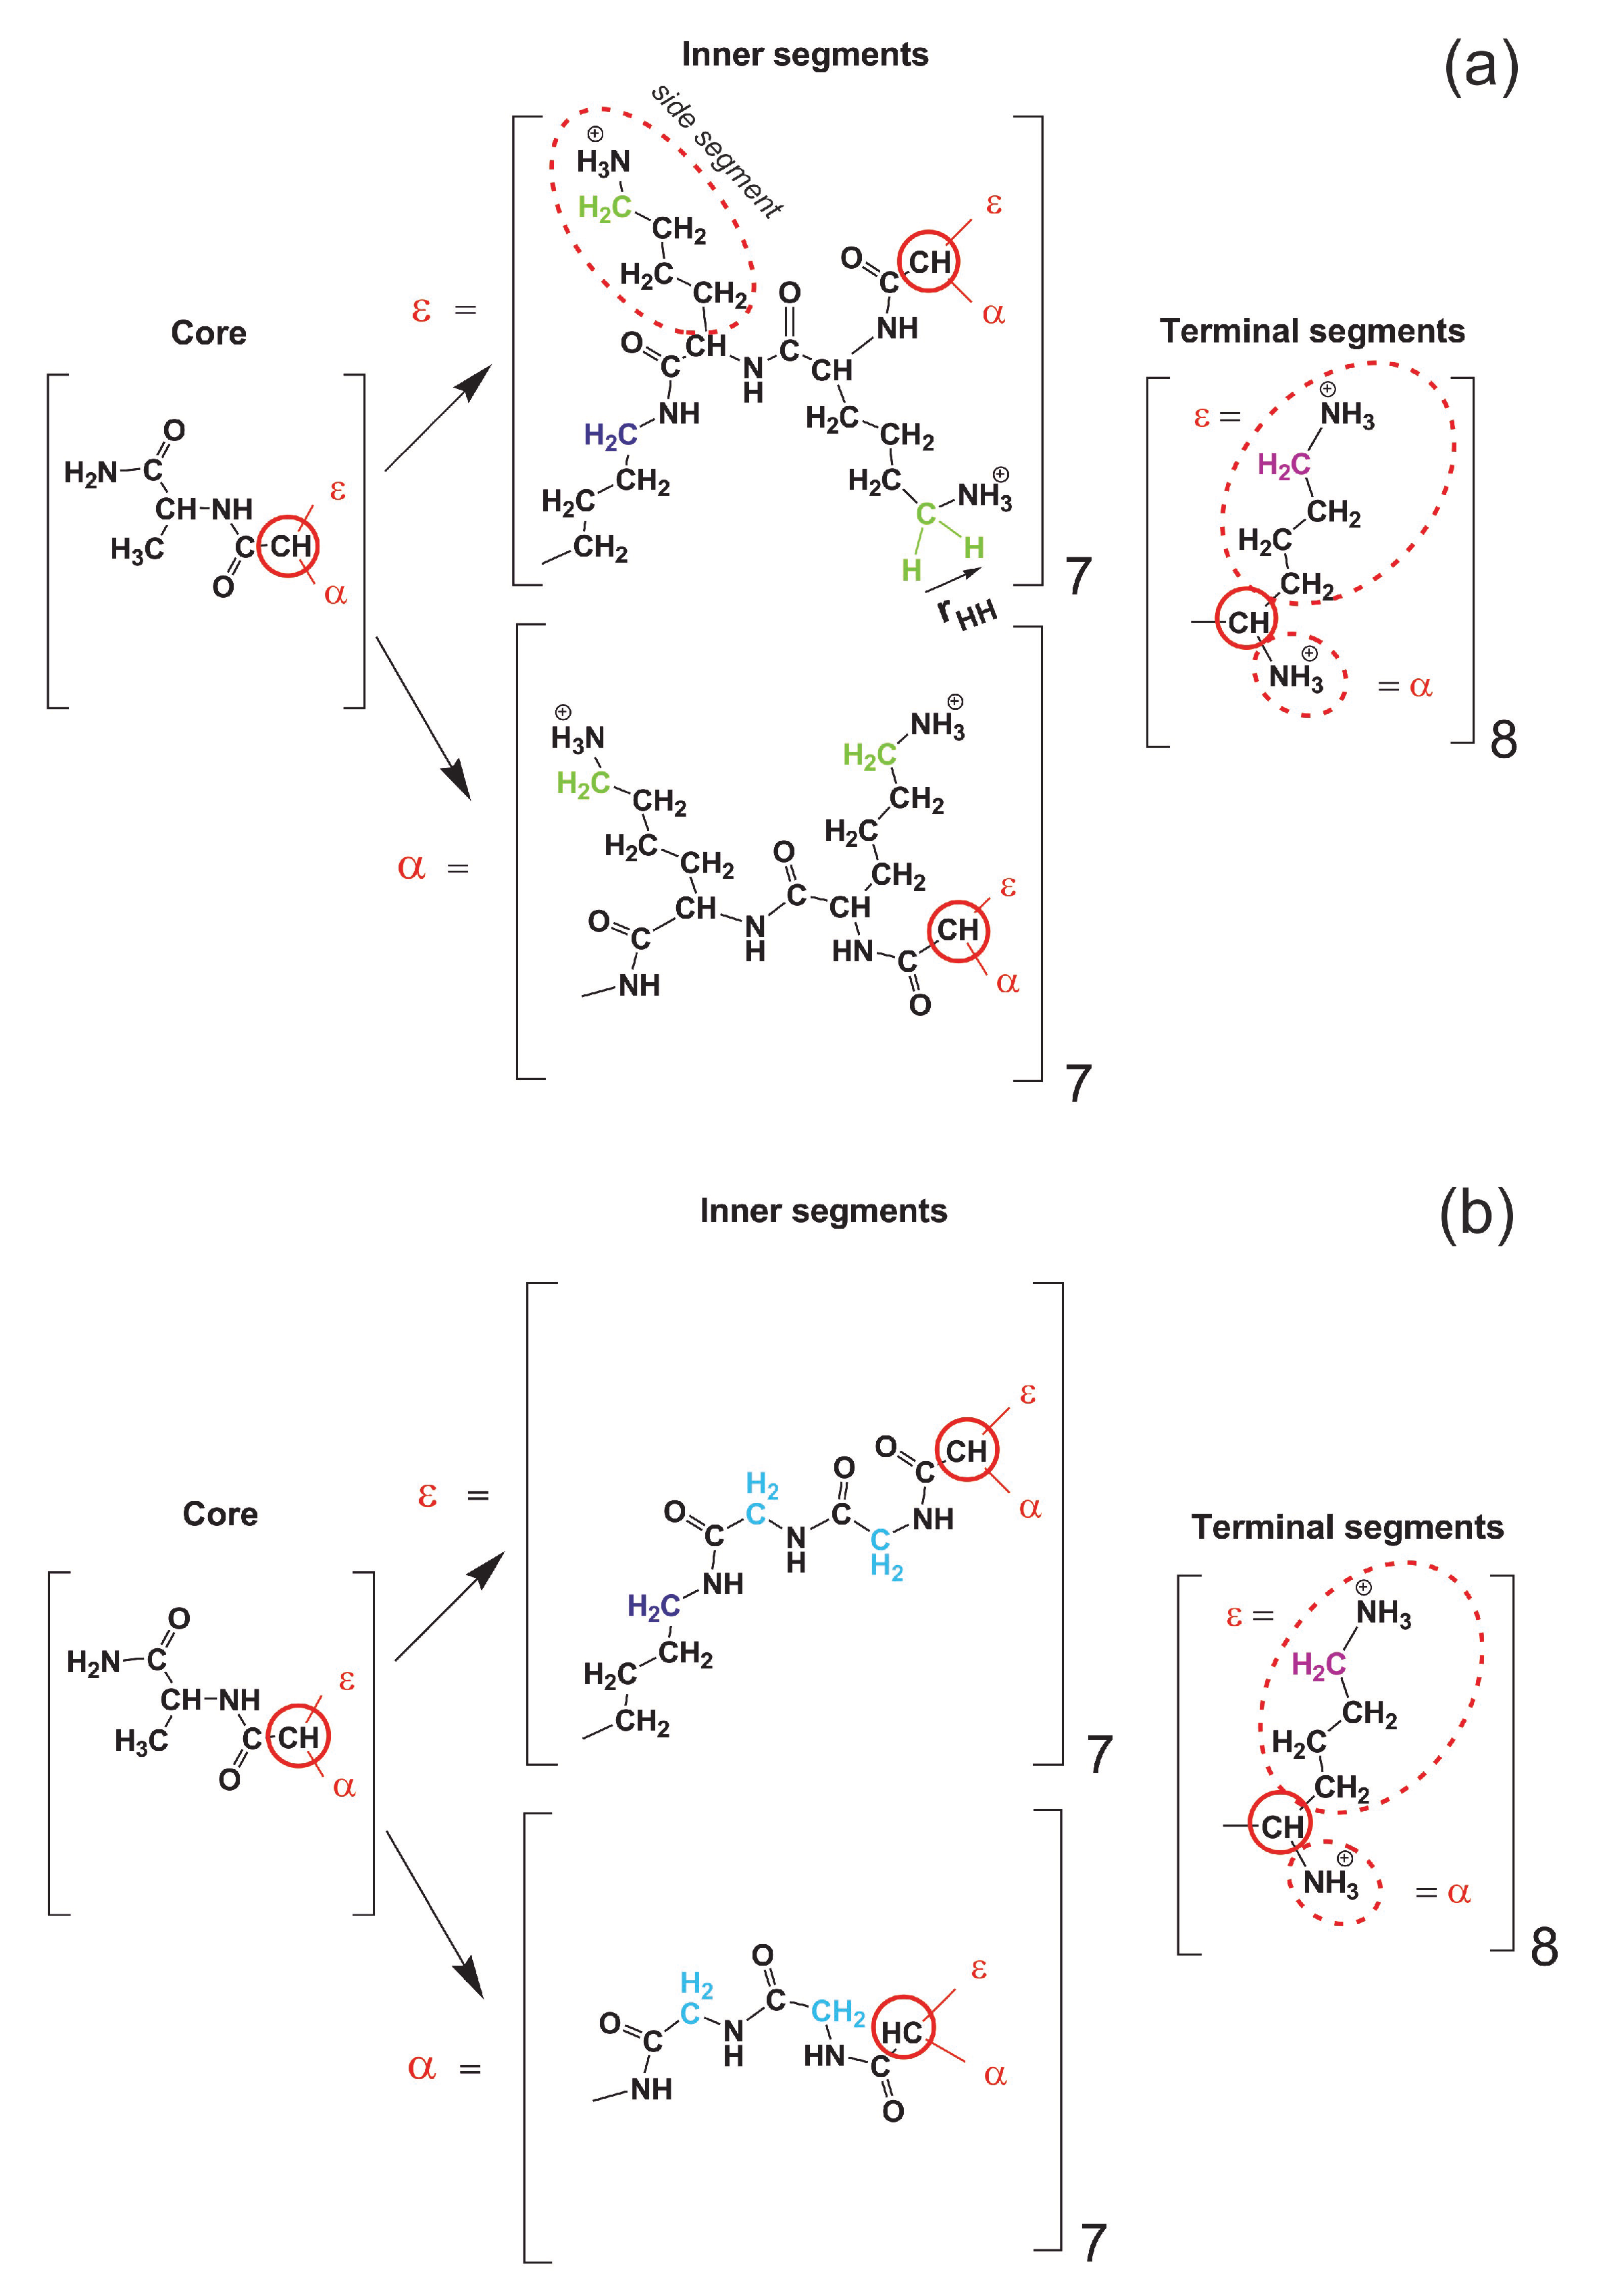
3.2. The Local Structure

We have shown earlier that both dendrimers have a spherical shape. For such objects the local internal structure is well described by the radial density distribution function (RDF) of atoms relative to the center of mass of the dendrimer (a density profile) ρ ( r ) :
ρ ( r ) = 1 4 π r 2 i m i δ r r i
where r ( r i ) is the distance (from i-th atom) to the center of mass. The density profiles are shown in Figure 7. The radial distributions for Lys-2Lys are practically independent of temperature. For Lys-2Gly, the temperature affects the density profile in the area of the dendrimer center, but does not affect the overall shape of RDF. In general, the Lys-2Lys dendrimer has a looser structure and a density in the center about two times (0.5 instead of 1.0) less than the Lys-2Gly dendrimer. However, the decrease in density with distance r from the center in the Lys-2Lys dendrimer does not occur quickly as in the Lys-2Gly dendrimer. This behavior correlates with a larger size of the Lys-2Lys dendrimer in contrast to the Lys-2Gly dendrimer. The shape of the density profile of the Lys-2Gly dendrimer is also close to that one of the usual lysine dendrimer [31].
In each terminal lysine, marked by red color in Figure 1, there are two charged NH 3 + terminal groups. The radial distributions of the number n t ( r ) of these nitrogens in all terminal groups for Lys-2Lys and Lys-2Gly dendrimers at different temperatures are shown in Figure 8. This function for both dendrimers is practically independent of temperature. The radial distribution n t ( r ) for Lys-2Lys (see Figure 8a) has an asymmetric shape and is shifted to the right (to larger distances r from the center of mass of the dendrimer) compared to the distribution for Lys-2Gly that has (see Figure 8b) an almost symmetrical shape. The shape of n t ( r ) for Lys-2Gly is close to the shape for the usual lysine dendrimer at room temperature [31]. The positions of maxima correspond to the distances between the core and the terminal groups R e in these dendrimers (see Table 3).
The density profiles and the radial distributions of terminal nitrogens for these dendrimers confirm that the Lys-2Lys dendrimer is swollen and stretched more than the Lys-2Gly dendrimer. It is due to the strong electrostatic interactions of the charged 2Lys spacers inside the Lys-2Lys dendrimer.
Hydrogen bonds exist between the donor and acceptor groups [103,104,105,106]. The presence of hydrogen bonds is determined by simulation using the coordinates of donor and acceptor according to two rules: the maximum distance between the donor and the acceptor should be less than 0.35 nm, and the angle between the donor and acceptor bonds should be less than 30° [106]. The average distribution of the number of intra-dendrimer hydrogen bonds is depicted in Figure 9.
We obtained that these distributions had a subtle dependence on temperature for both dendrimers. At the same time, there is an essential difference between the shape of these functions for our dendrimers at all temperatures. For Lys-2Lys, it is a decreasing function, while for Lys-2Gly it has a fairly symmetrical shape. The average number of hydrogen bonds is less than two for Lys-2Lys, in comparison with more than seven bonds for Lys-2Gly (see Table 4). This difference can be explained by the fact that Lys-2Lys is more swollen, stretched, and rigid than the compact and flexible Lys-2Gly dendrimer. Therefore, it is much more difficult for donors and acceptors in Lys-2Lys to meet each other and form a hydrogen bond. Moreover, the average number of dendrimer–water hydrogen bonds (see Table 4) is essentially larger in Lys-2Lys in comparison with Lys-2Gly, equal to 179 and 100, respectively.
It is important to note that electrostatic interactions contribute to the formation of ion pairs. The interactions between charged groups of dendrimer (NH 3 + ) and counterions can be characterized by the binary distribution function g ( r ) for distance r between these ion pairs. Figure 10 shows these characteristics for both dendrimers at different temperature. It is easy to see that there is some dependence on the temperature of the value of the first peak g ( r ) , but the overall shape of this dependence almost does not change with temperature. The first peak corresponds to the minimal distance between the charged groups of the dendrimer and ions, i.e., this region corresponds to the formation of ion pairs. Lys-2Lys has a slightly higher peak than Lys-2Gly. This means that Lys-2Lys has more ion pairs than Lys-2Gly because the first system has more charges and counterions. We estimated the number of ion pairs n i o n p a i r s more accurately by numerical integration over the region of the first peak (see Table 4). The number of ion pairs in Lys-2Lys is on average 8 times larger than in Lys-2Gly. The second peak corresponds to the distance between counterions and the neighboring oppositely charged groups of the dendrimer.
In addition, the counterions come into contact with the dendrimer trying to lower their bare charge Q b a r e . To evaluate how the total charge is distributed in the system due to the redistribution of counterions between the solution and the dendrimer interior, we can calculate the radial distribution of the total charge q ( r ) (the charge distribution) in the system:
q ( r ) = n + ( r ) + n ( r )
where n + ( r ) is the positive charge distribution of NH 3 + -groups of dendrimers and n ( r ) is negative charge distribution of counterions. The integration of the charge distribution q ( r ) over the simulation cell is equal to zero, confirming the electroneutrality of the simulation system.
The charge distribution q ( r ) is plotted in Figure 11a for the Lys-2Lys and the Lys-2Gly dendrimers. This function for both dendrimers has a maximum due to the positive charges of the dendrimers and a minimum due to the counterion shells around them. The charge distribution obtained in our simulations corresponds to the classical double layer structure, which has been observed for dendrimers in many studies [107,108]. It is interesting that the values in maximum are approximately the same in the case of Lys-2Lys and Lys-2Gly dendrimers. At the same time, the positions of the maximum and minimum are shifted to greater radial distance r for Lys-2Lys dendrimer.
The cumulative charge distribution Q ( r ) is the integral characteristic of the charge distribution q ( r ) . It can be calculated from Equation (10), where the integral has the variable upper limit
Q ( r ) = 0 r q ( x ) d x
The cumulative charge in layer r corresponds to the total charge from the center of the system to the layer r. The cumulative charge distributions Q ( r ) for the considered dendrimers are depicted in Figure 11b. For Lys-2Lys, the absolute value of the maximum is larger, and its position is more shifted from the center of mass compared to for Lys-2Gly. The maxima of these distributions correspond to the effective charge Q * , and the positions of maxima (marked with dots in Figure 11b) correspond to the effective radius R m a x . In general, the distribution Q ( r ) for Lys-2Gly is very similar in shape, position, and the value of maximum to the usual lysine dendrimer [31].
Our dendrimers can be represented as charged macroions. To evaluate the electrostatic interactions inside and outside such a system, we can consider the distribution of the electrostatic potential Ψ ( r ) , which can be calculated from the Poisson equation
Δ ψ = k q ( r ) ,
Here, ψ ( r ) = e / k B T Ψ ( r ) is the dimensionless electrostatic potential, and k = 4 π λ B / d r is the dimensionless factor ( d r [nm] is r increment), where λ B is the Bjerrum length ( 0.7 nm for the water medium at room temperature):
λ B = e 2 4 π ϵ ϵ 0 k B T
where e is the elementary charge, ϵ is the relative dielectric permittivity of water ( ϵ 80 ), ϵ 0 is the dielectric permittivity of vacuum, k B is the Boltzmann constant, and T is the actual temperature.
In the case of the spherical symmetry, the Poisson equation (Equation (11)) can be presented in a simple form of the differential equation
d 2 ψ ( r ) d r 2 + 2 r d ψ ( r ) d r = k q ( r )
This equation can be solved numerically, for example, by the method of successive approximations.
To solve Equation (13), we used boundary condition ψ ( D ) = 0 (the electrostatic potential is zero in the simulation cell edge). Moreover, we plotted the electrostatic potentials for both dendrimers at T = 310 K in Figure 11c. The points on the curves indicate the effective radius R m a x , after which the diffusion layer begins. We have used this approximation to estimate the ζ potential, which works quite well in the free-salt case [109]. The distribution of ψ ( r ) for Lys-2Lys is on average higher than that for Lys-2Gly, because Lys-2Gly has a smaller effective radius R m a x . The value of the ζ potential for the last one is higher (see Table 4). The ζ potential for the lower values (less 25.4 mV [110]) is proportional to the surface charge density σ = Q * / 4 π R m a x 2 [110]. In other words, the lower value of σ corresponds to the lower value of the zeta potential (see Table 4).
It is possible to calculate the degree of a recharge dendrimer due to the penetration of counterions into the dendrimer interior using the ratio Q * / Q b a r e . As the considered dendrimers have a spherical shape, they can be represented like soft charged (penetrable) spheres (charged macroions). The ratio Q * / Q b a r e can be calculated from the theoretical considerations. We used the analytical theory [111] for calculation an effective charge Q * of the soft charged sphere with the radius R and the bare charge Q:
Q * = R λ B 1 2 ν ln Q Q * 1 D 3 R 3 1
where the coefficient ν = 3 / 5 (for a diluted solution). As mentioned above, the Lys-2Lys and Lys-2Gly have spherical shapes (see Figure 6a) and can be considered as charged spheres with a radius of R = R m a x (the position of the maximum of the cumulative charge distribution Q ( r ) ) and a bare charge of Q b a r e (see Table 1). Then, the radius D = 3 1 / 2 a c e l l / 2 , where a c e l l is the average size of a simulation cell (see Table 1).
Figure 11d demonstrates the ratios Q * / Q b a r e obtained using the theoretical predictions for Q * and also the values Q * / Q b a r e obtained from simulation using the maximum of the cumulative charge Q * = Q m a x as a function of temperature. Thus, the simulation results are close to the theoretical predictions in Equation (14). A similar good agreement was obtained in MD simulation of usual lysine dendrimer [31]. The ratio Q * / Q b a r e is the same for the Lys-2Gly and the usual lysine dendrimers of the second generation at T = 300 K [31]. The osmotic ions do not form ion pairs with charged groups of a dendrimer. Moreover, they are freely distributed in the dendrimer interior causing osmotic pressure, which leads to the stretching the dendrimer. The average number of osmotic ions n o s m o t i c i o n s can be calculated from the following equation.
n o s m o t i c i o n s = Q b a r e Q * n i o n p a i r s
The average numbers of osmotic ions n o s m o t i c i o n s at T = 310 K were equal to 25.13 for Lys-2Lys and 5.94 for Lys-2Gly (Table 4). In other words, the number of free counterions inside Lys-2Lys is 4.2 times larger than inside Lys-2Gly.

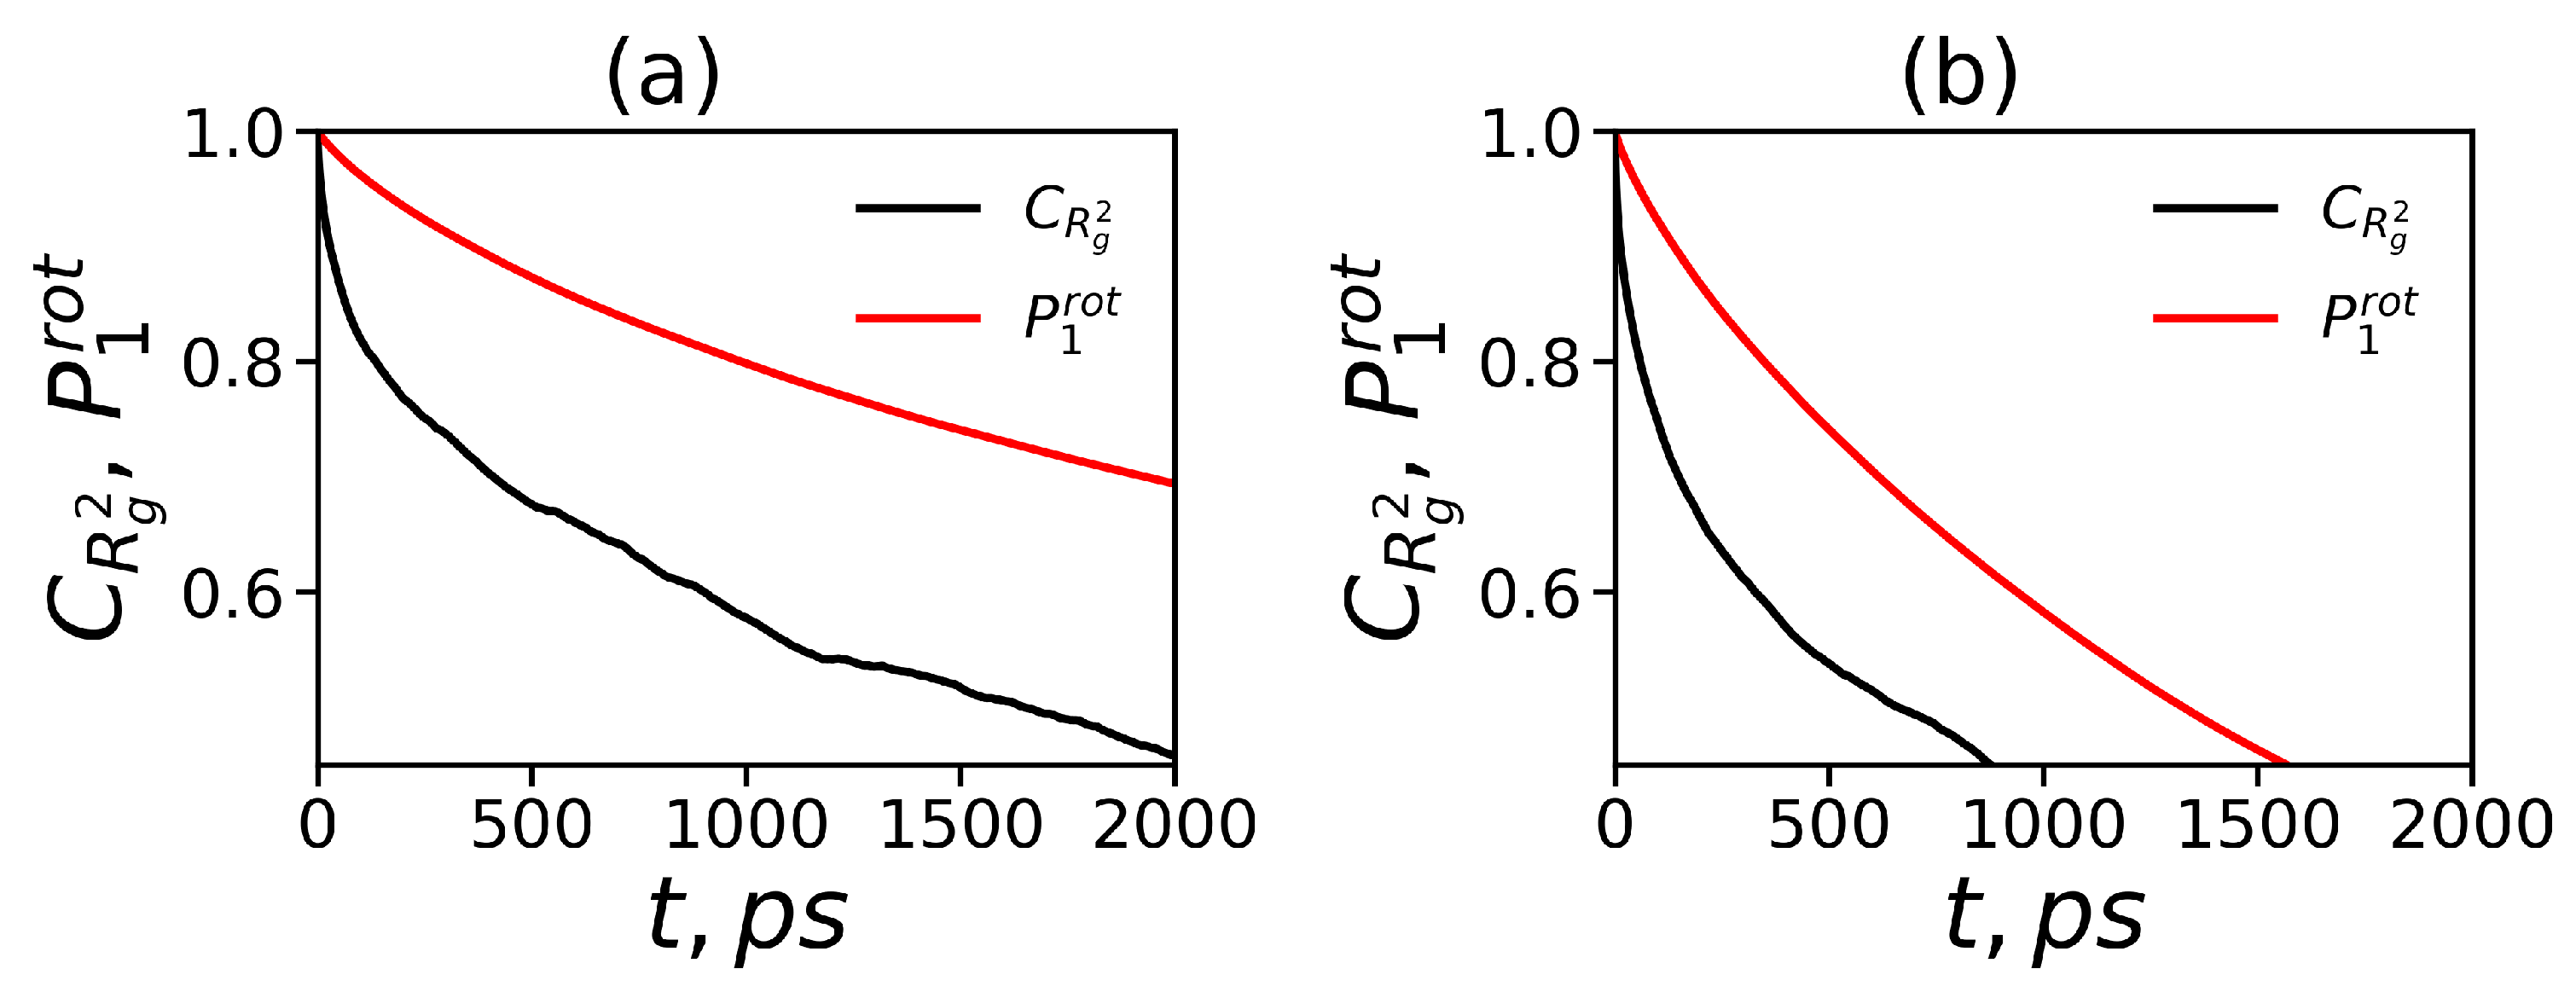
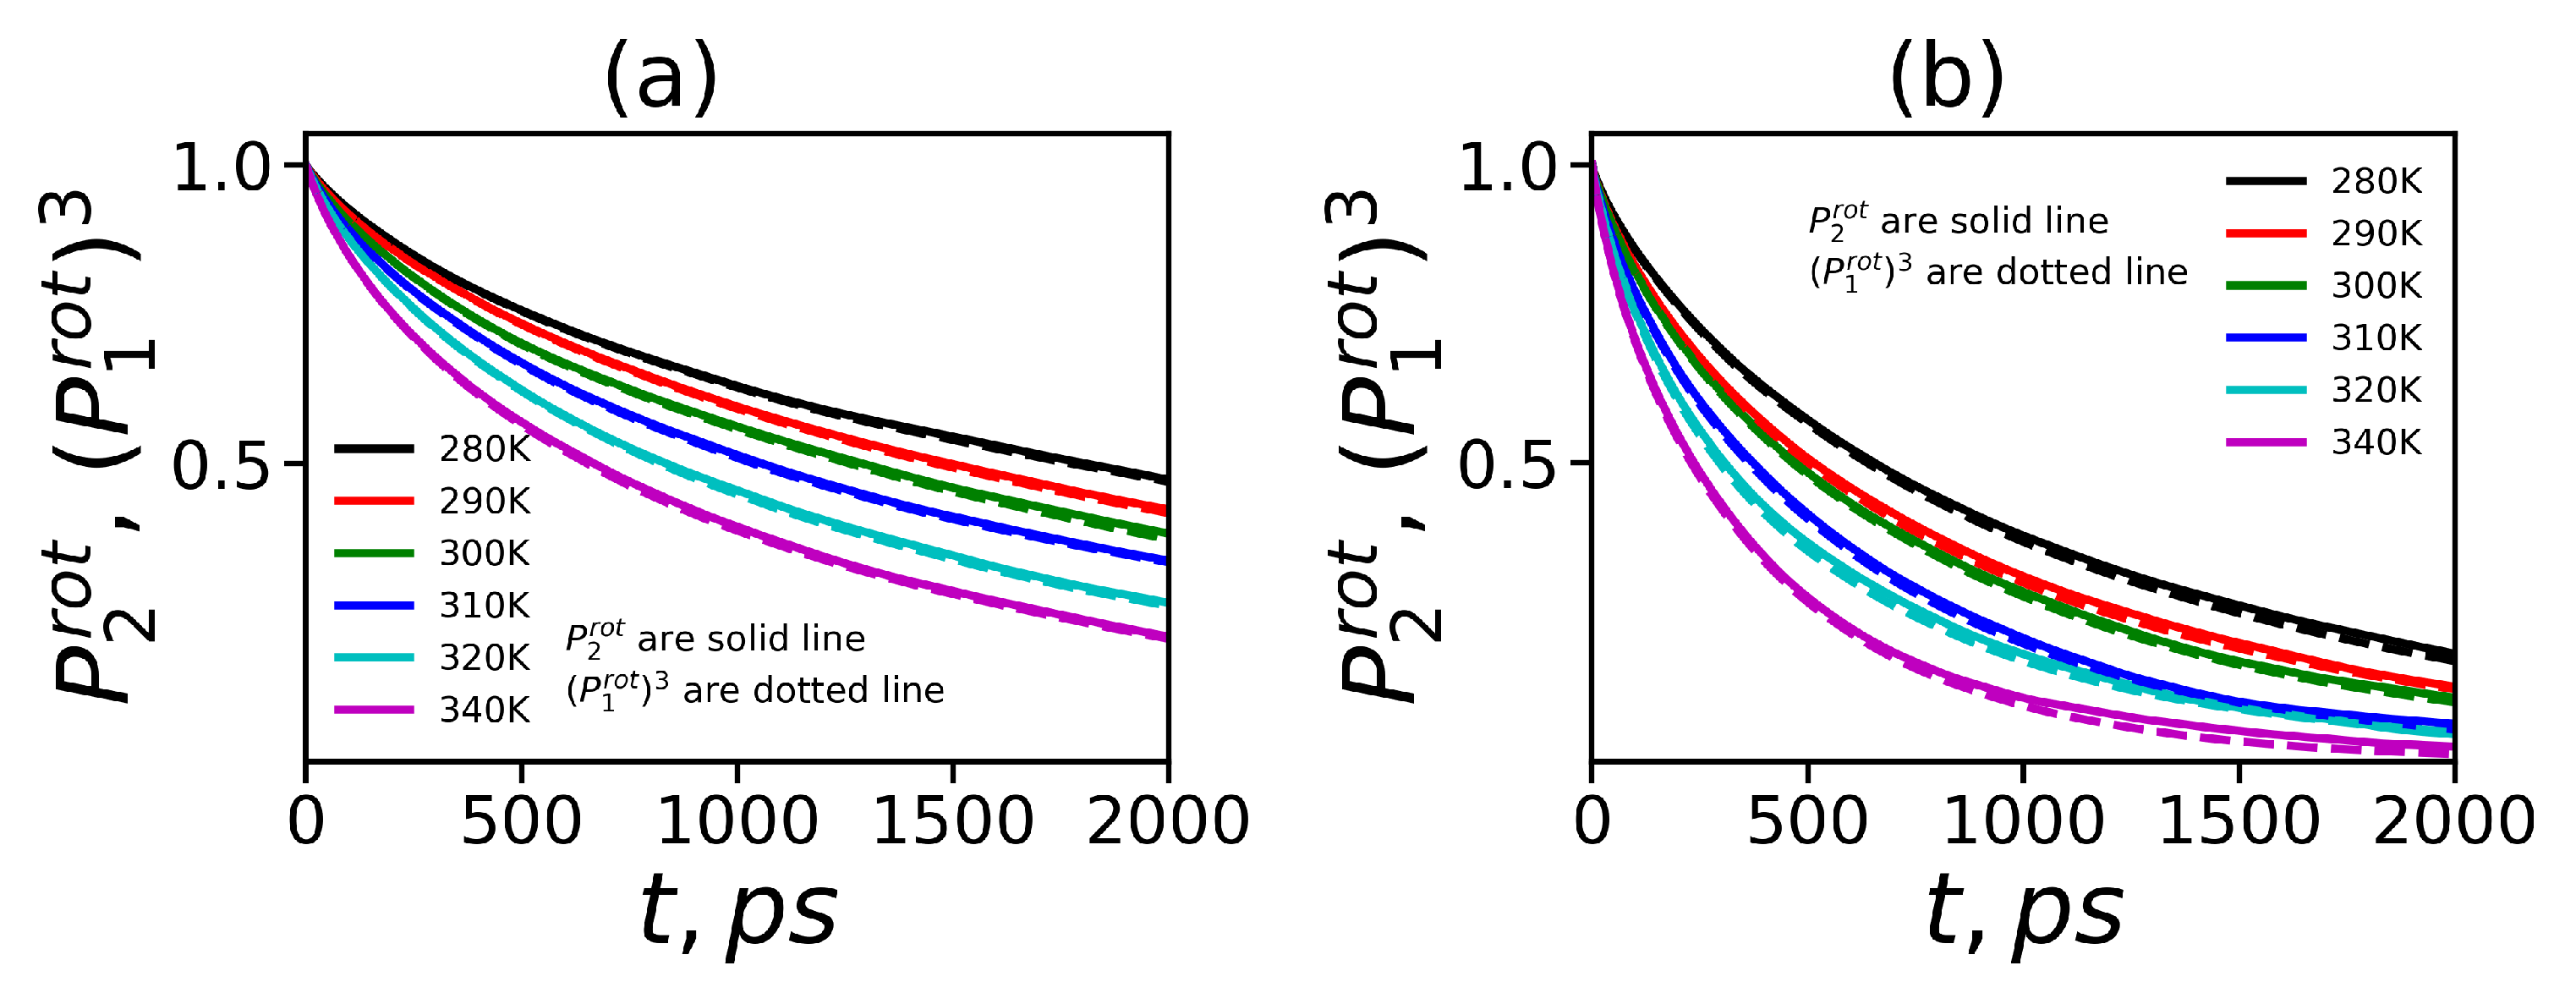
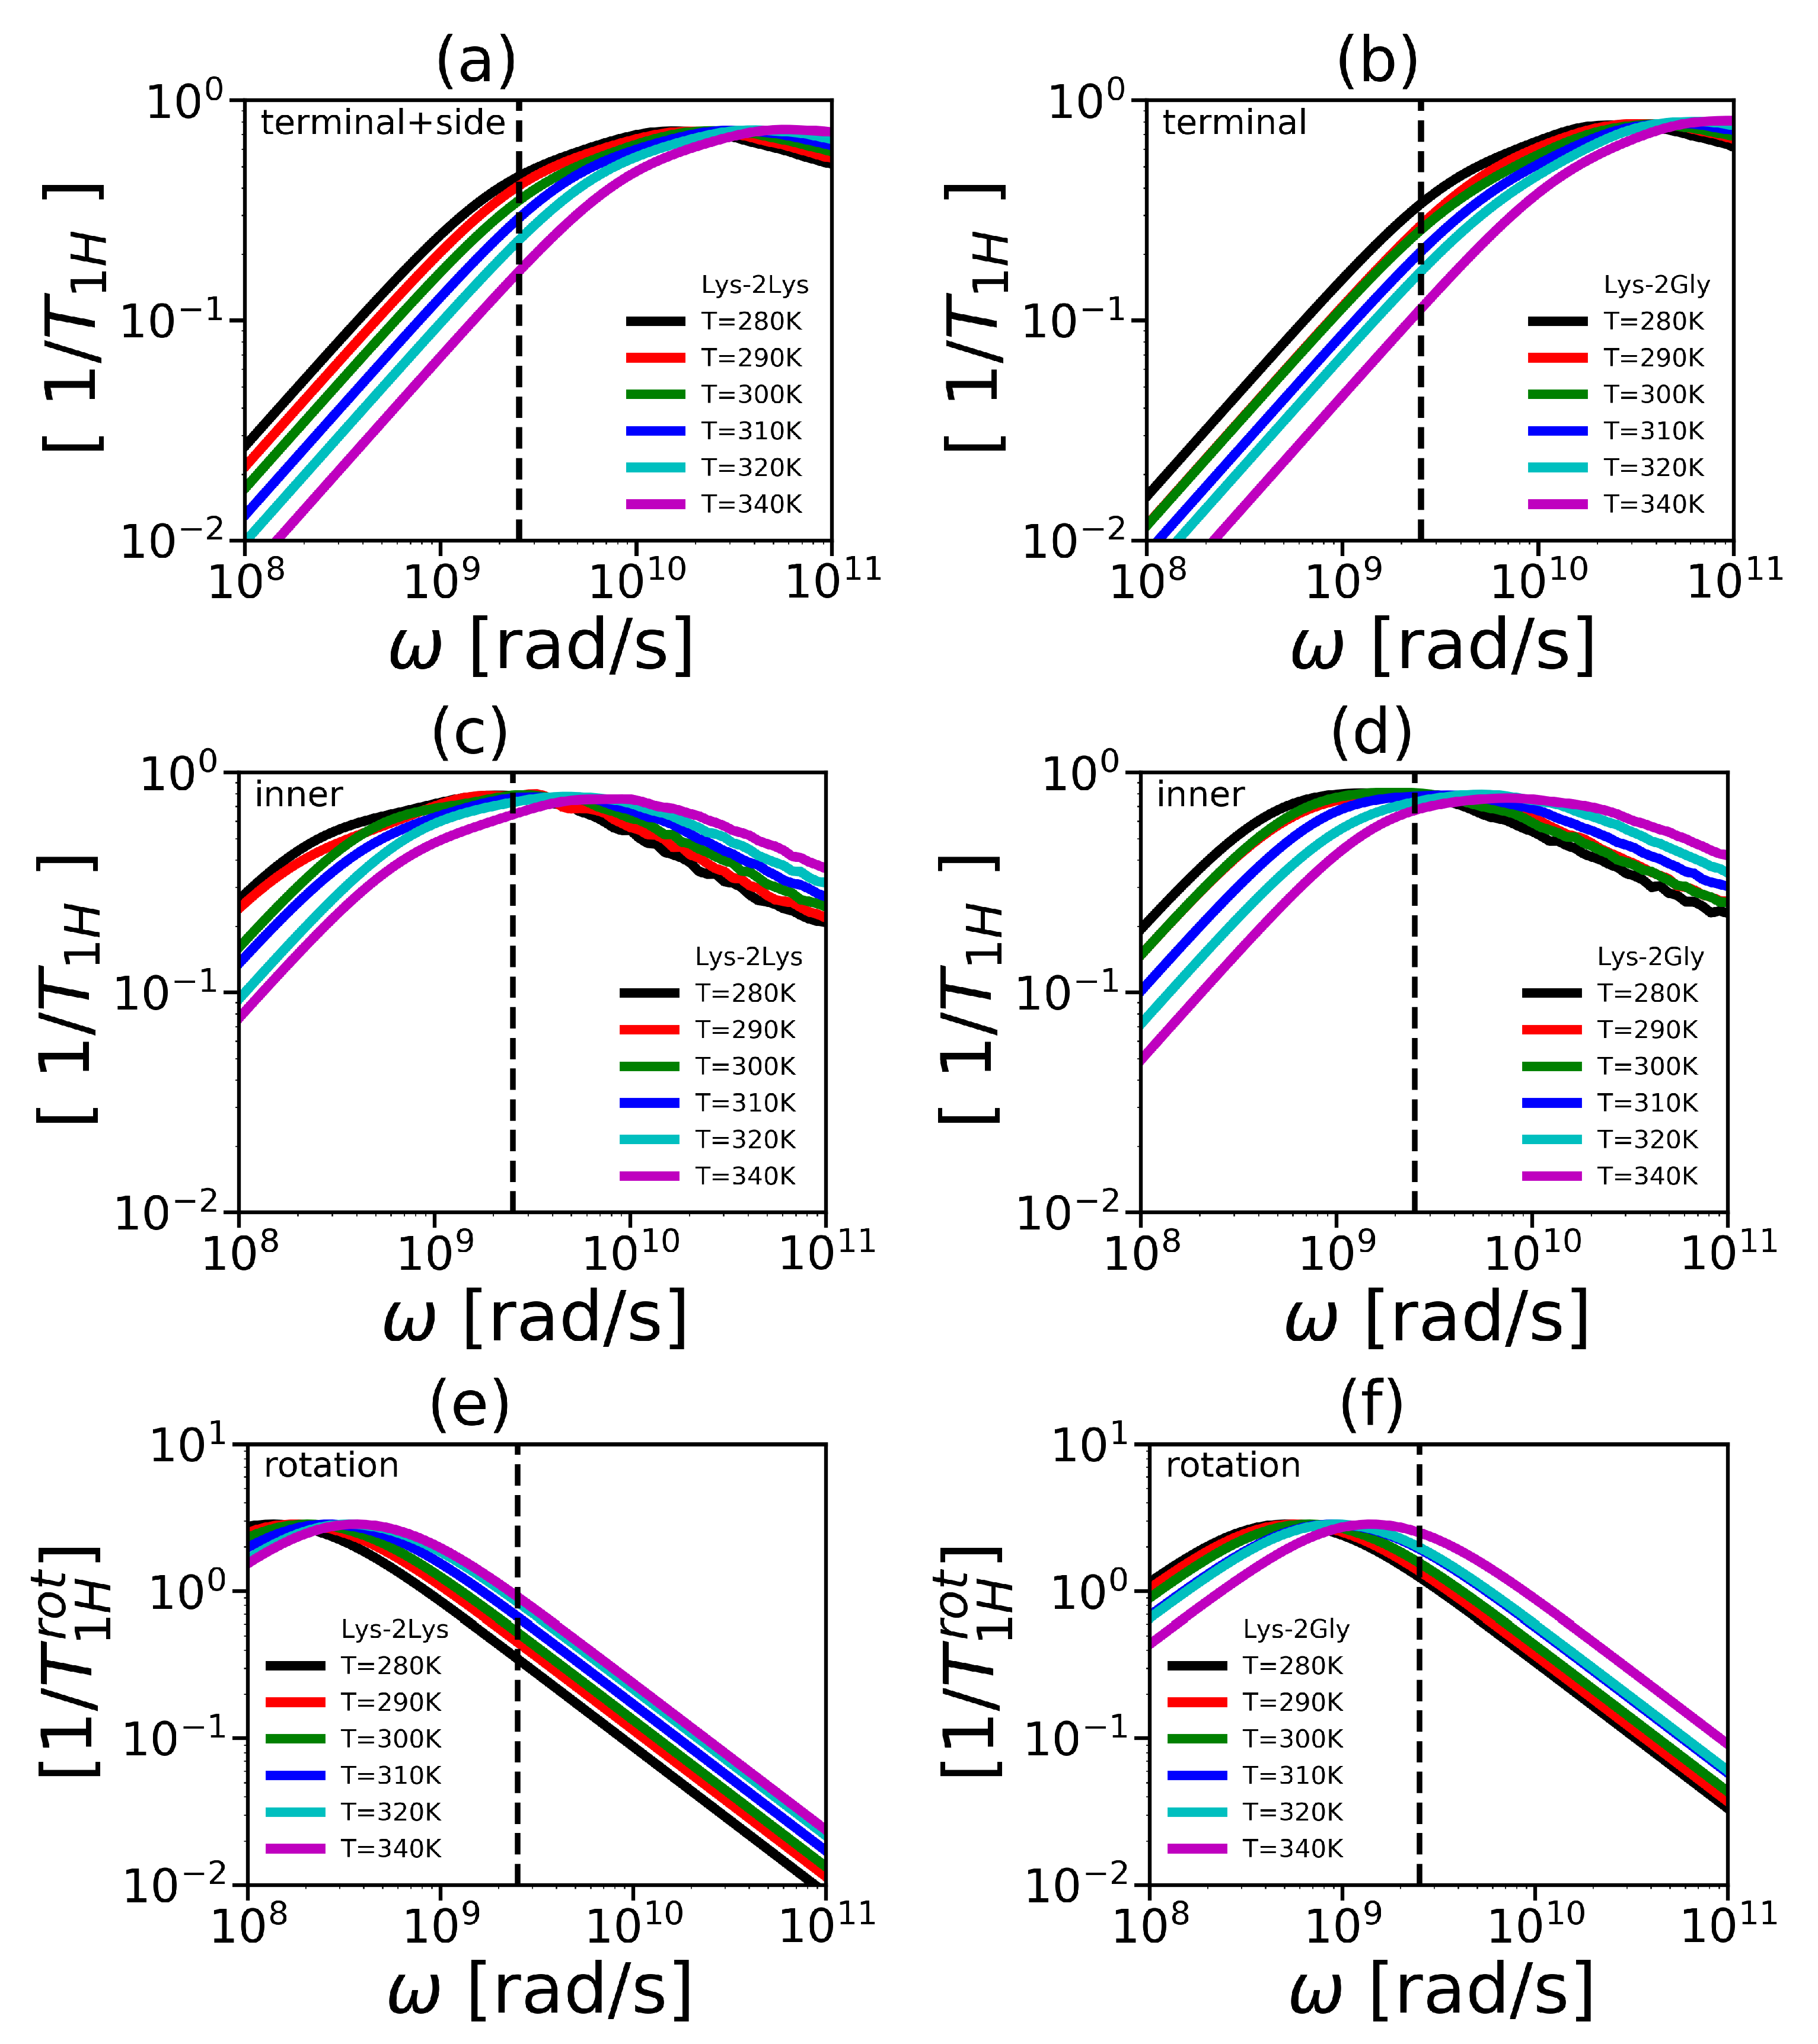
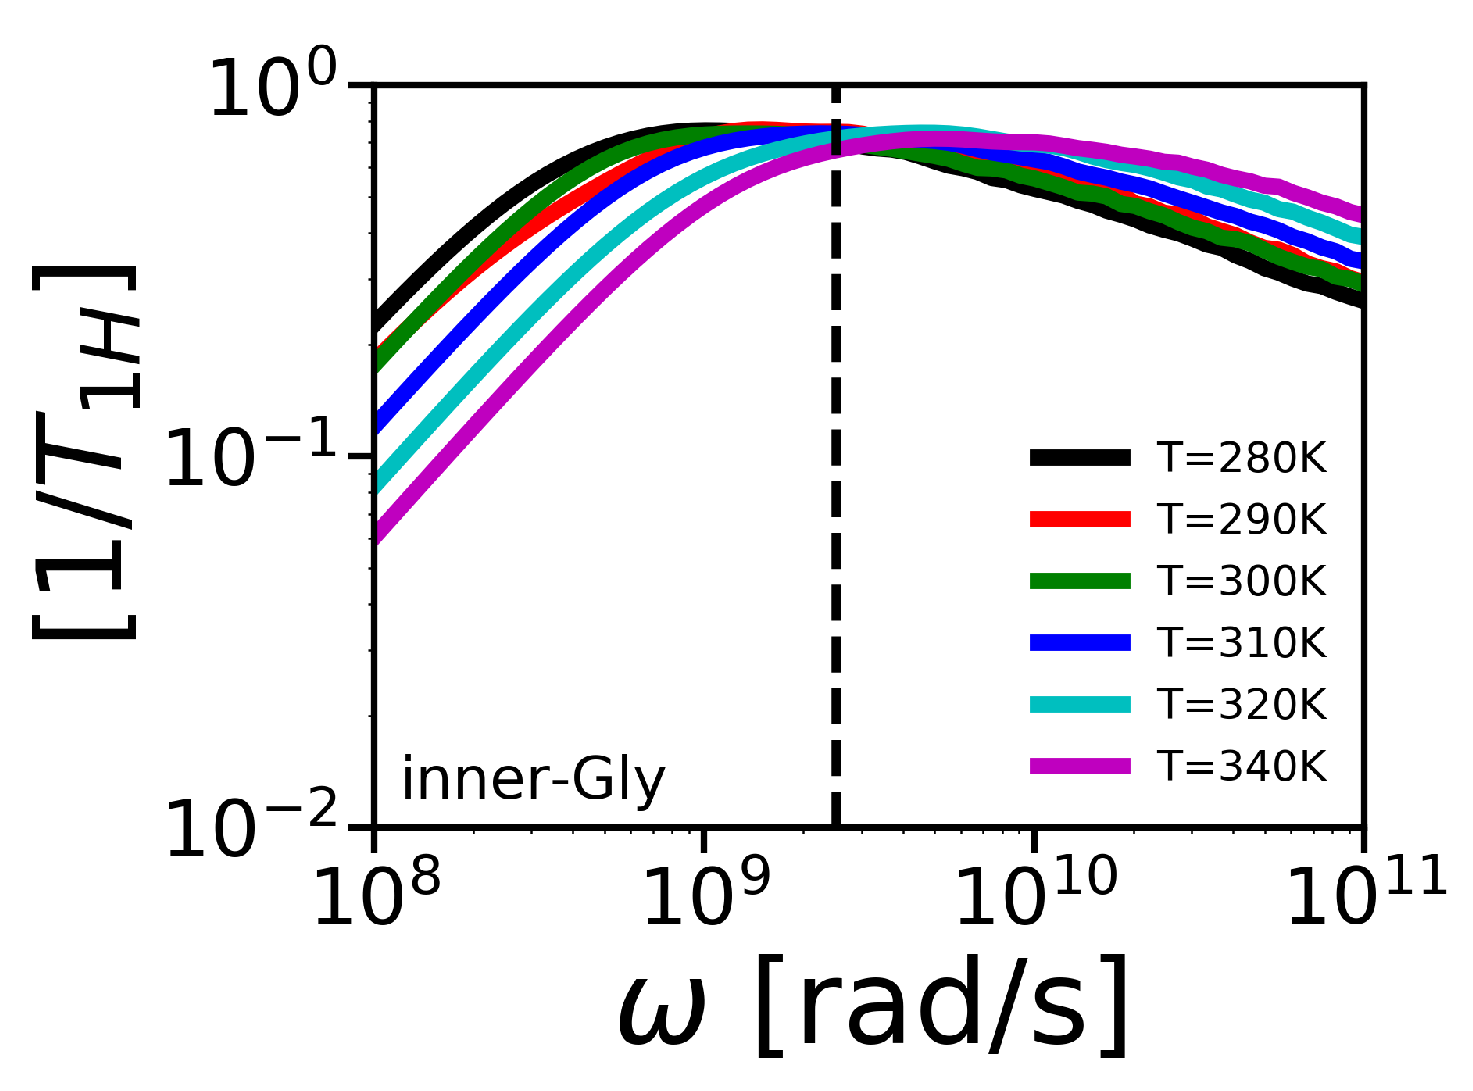
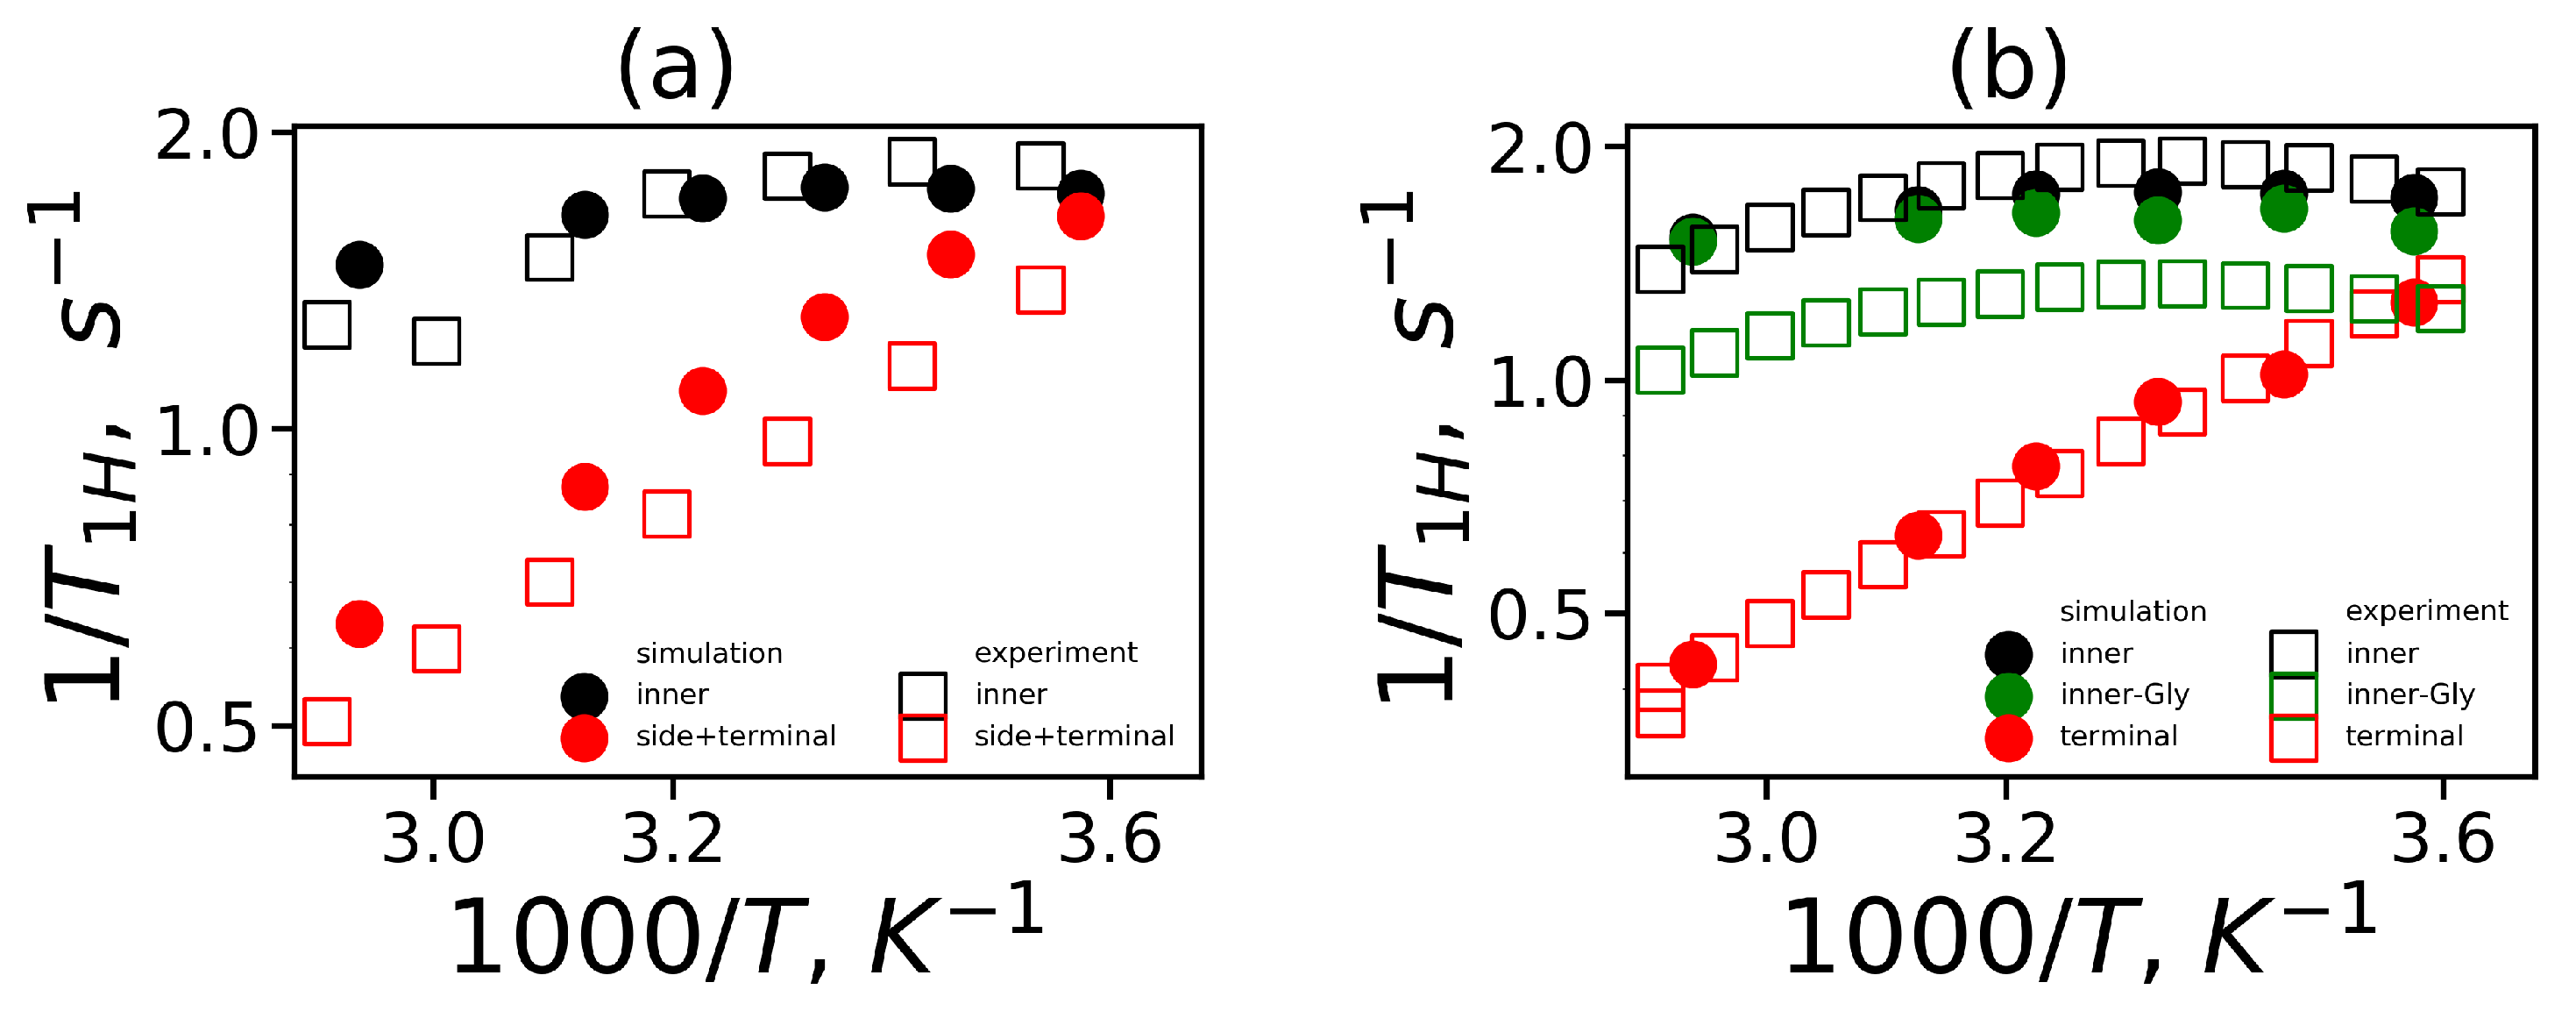
3.3. Orientational Mobility and NMR Relaxation

In this section, we describe the results of the calculations of orientational mobility of different vectors inside each dendrimer including core-to-end vectors (averaged over all paths from the center of the dendrimer to its ends) and HH vectors in different CH 2 groups. Two main types of CH 2 groups were considered: (1) the CH 2 groups connected with NH groups are in the backbone and named as “inner” CH 2 groups; (2) the CH 2 groups are connected with NH 3 + groups are in the terminal segments and named as “terminal” CH 2 groups. In Lys-2Lys there are also additional CH 2 groups connected with NH 3 + groups in side segments of 2Lys spacers (marked in green in Figure 12a), and we named them as “side” CH 2 groups. In Lys-2Gly there are two CH 2 groups in the main chain of each inserted 2Gly spacer (marked by light blue in Figure 12b), and we named them as “inner-Gly” CH 2 groups.
The rotation of the dendrimer as a whole is usually characterized through the mobility of the core-to-ends vector, which can be estimated from the second-order ACF:
P 2 ( t ) = 3 2 r ( t ) r ( 0 ) 2 r ( t ) 2 r ( 0 ) 2 1 2
Here, we use core-to-end vectors that started in the C α atom of core lysine to C α atom in terminal lysines. The averaging × in the Equation (16) means averaging over all core-to-end vectors and over considered time.
There is a simple relationship [112] between the 1st order and 2nd order ACFs for a single rigid bond:
P 2 ( t ) = P 1 ( t ) 3
In several papers on the simulation of dendrimers (see, for example, in [29]) it has been shown that this equation is also valid for the orientational mobility of dendrimer as a whole. Here, we examine the relation Equation (17) for the core-to-end vectors of our dendrimers. Figure 13a,b demonstrates that this relation is valid for both dendrimers at all temperatures. Using the relationship in Equation (17) we evaluated the characteristic time of P 2 r o t ( t ) :
τ r o t = τ r o t P 1 3
To obtain characteristics of NMR relaxation of CH 2 groups in our dendrimers we have computed the second-order autocorrelation function P 2 ( t ) (see Equation (16)) for vector r = r H H in different CH 2 groups. We obtained that the decay of this function for both dendrimers is similar for terminal groups (see Figure 14a,b) as well as for inner groups (see Figure 14c,d). At the same time, the ACF or terminal CH 2 groups decays significantly faster than that of the inner CH 2 groups for both dendrimers (see Figure 14a,c vs. Figure 14b,d). This result is in agreement with the prediction of theory for dendrimer molecules [113]. Moreover, we calculated the orientational ACF for side CH 2 groups of the Lys-2Lys dendrimer (see Figure 14e) and for inner-Gly CH 2 groups of the Lys-2Gly dendrimer (see Figure 14f). The behavior of the P 2 function for the side CH 2 groups is very similar to the behavior of the terminal groups of Lys-2Lys (Figure 14a,e). In contrast, the relaxation of the inner-Gly CH 2 groups (see Figure 14f) is similar to relaxation of the inner CH 2 groups (see Figure 14b) of the Lys-2Gly dendrimer.
The reduced spin-lattice relaxation time 1 / T 1 H in the susceptibility representation is one of the characteristics of the mobility of groups. This parameter is connected with the spectral densities J ( ω ) and J ( 2 ω ) by the following relation [114,115],
1 T 1 H ω = ω J ω + 4 J 2 ω
where ω is the angular frequency of NMR spectrometer; the spectral density J ω can be calculated from the cosine Fourier transformation:
J ω = 2 0 P 2 ( t ) cos ω t d t
The reduced spin-lattice relaxation rate 1 / T 1 H is shown in Figure 15. We combined the side and terminal groups in Lys-2Lys into one group—“terminal+side” (see Figure 15a) as a similar procedure was used in NMR [63]. Furthermore, there was not a significant difference between them in our simulation. The frequency dependencies of 1 / T 1 H for the terminal group for Lys-2Gly (see Figure 15b) and inner groups of both dendrimers (see Figure 15c,d) are presented in Figure 15.
According to Equations (19) and (20), the 1 / T 1 H functions can be computed through ACFs P 2 ( t ) . Note that the numerical procedure for the calculation of ACFs P 2 ( t ) functions is described in Appendix [29]. The resulting function was combined with two parts: 1 P 2 ( t ) P c u t ( P c u t = 0.04, 0.05, 0.05, and 0.08 for terminal, side, inner-Gly, and inner groups, respectively) and P c u t exp ( t τ t a i l / τ t a i l ) . Here, τ t a i l is determined from the exponential slope of the P 2 ( t ) function at n a p p r o x points ( n a p p r o x = 100, 100, 100, and 1000 for the terminal, side, inner-Gly, and inner groups, respectively) to the value P c u t by least square method. We have ensured that the resulting function decays to 1 × 10 5 .
To estimate the contribution of rotation of a dendrimer as a whole to the mobility of CH 2 groups we also calculated the 1 / T 1 H r o t function for the core-to-end vector. P 2 r o t ( t ) is the linear combination of the decreasing exponential functions. Due to the rotation of a dendrimer as a whole, τ r o t makes the dominant contribution, and we can use the single exponential approximation for calculation of P 2 r o t ( t ) :
P 2 r o t ( t ) exp t τ r o t
The cosine Fourier transformation (see Equation (20)) of P 2 r o t ( t ) has a simple form:
J r o t ( ω ) = 2 × τ r o t 1 + ω τ r o t 2
and the reduced spin-lattice relaxation time 1 / T 1 H r o t for the core-to-end vector can be expressed as
1 / T 1 H r o t ω = 2 ω τ r o t 1 + ω τ r o t 2 + 4 × τ r o t 1 + 4 ω τ r o t 2
Note that this result for 1 / T 1 H r o t is valid if the rotation of a dendrimer as a whole is the only one process contributing to NMR relaxation. The frequency dependencies of 1 / T 1 H r o t functions are plotted in Figure 15e,f. The mobility of inner-Gly CH 2 group is presented in Figure 16.
The important parameter of 1 / T 1 H is the position of the maximum ω m a x . An increase in temperature shifts the position of ω m a x to the low-frequency region. It means an acceleration of orientational mobility with temperature. The positions of maxima of 1 / T 1 H allow us to compare the mobility of different groups. For terminal CH 2 groups of both dendrimers, ω m a x are located at higher frequencies in comparison the positions of ω m a x for inner CH 2 groups. It demonstrates that inner groups have lower mobility than the terminal groups. This fact is typical for dendrimers [113] including lysine dendrimers [29]. Note that the positions of ω m a x are similar for the Lys-2Lys and the Lys-2Gly dendrimers. Interestingly, the rotation of a dendrimer as a whole has significantly different relaxation time for both dendrimers (see Table 2). In Figure 15e,f, the function 1 / T 1 H r o t is presented for illustration. It can be seen from Figure 15 that the ω m a x of 1 / T 1 H r o t is close to ω m a x of 1 / T 1 H for inner CH 2 groups of Lys-2Gly. Therefore, we suppose that the rotation of a dendrimer as a whole makes the main contribution to NMR relaxation of the inner groups of Lys-2Gly. It should be noted that a similar result has been recently obtained for poly(propylene imine) dendrimers in a compact conformation (i.e., similar to Lys-2Gly) by MD simulations [116]. It was shown that the position of ω m a x practically coincides with the rotation of a dendrimer as a whole for all inner segments.
The frequency dependencies of 1 / T 1 H at different temperatures make it possible to calculate the corresponding temperature dependencies. We extracted temperature points from 1 / T 1 H at ω H / 2 π = 400 MHz (see dashed vertical line in Figure 15a–d and Figure 16a,b) to compare with the experimental 1 / T 1 H , obtained by NMR, using the following equation,
1 T 1 H = A 0 ω H 1 T 1 H
where A 0 is the constant determined by quantum chemistry parameters and does not depend on frequency or temperature. The theoretical value of A 0 for CH 2 groups A 0 t h e o r y is equal to 0.56 × 10 10 s 2 . At the same time, a fitting parameter A 0 is often used (see, for example, in [29]). For calculation of the temperature dependence of 1 / T 1 H we used A 0 t h e o r y for all CH 2 groups except CH 2 groups in terminal+side groups of Lys-2Lys and terminal groups of Lys-2Gly (for which the value A 0 = 0.88 × 10 10 s 2 was used). The temperature dependencies of 1 / T 1 H for different CH 2 groups in Lys-2Lys and Lys-2Gly dendrimers are plotted in Figure 17a,b.
The experimental points [63] are depicted in these graphs too. As it can be seen from Figure 17, our results have a good agreement with the experiment. It is interesting to note that a calibration parameters are not used to fit the calculation results for inner and inner-Gly CH 2 groups with the experimental data. The calibration parameter was used only for CH 2 groups in terminal+side groups of Lys-2Lys and terminal groups of Lys-2Gly.
In general, the frequency dependencies of 1 / T 1 H and the temperature ones indicate that the terminal and side CH 2 groups have higher mobility than the inner CH 2 groups. The dependence of 1 / T 1 H for inner-Gly groups is similar to 1 / T 1 H for inner groups because both CH 2 groups located in the backbone of the dendrimer. These results were obtained by simulation and NMR (see Figure 17). Thus, the orientation mobility of the NMR group in the segment between branching points practically does not depend on the location of this group in the segment. This conclusion confirms the possibility of using the coarse-grained models for qualitative study of local orientational mobility in dendrimers. Such models were used in the analytical theory [117,118,119,120,121] and in simulations [33,122,123,124,125].

4. Conclusions

Lysine-based dendrimers with double lysine and glycine linear spacers inserted between neighboring branching points of a usual lysine dendrimer were simulated by molecular dynamics method in the wide interval of temperatures (from 280 to 340 K). It was shown that the size and internal structure of both dendrimers practically do not depend on temperature. The Lys-2Lys dendrimer has more stretched spacers, and as a result it has the larger size in comparison with the Lys-2Gly dendrimer. Lys-2Lys has a lower density and contains more water and counterion molecules in its interior. This leads to a greater number of hydrogen bonds between the dendrimer and water as well as to a large number of ion pairs between charged dendrimer groups and counterions. The relative effective charge Q * / Q b a r e is twice as large in Lys-2Lys than in Lys-2Gly. It is worth noting that the relative charge slightly decreases with temperature, and rearrangements are observed in the inner regions of the dendrimers. The larger surface of the Lys-2Lys dendrimer leads to greater surface charge density σ and lower ζ potential of this dendrimer.
Dynamic characteristics have been studied as well. It has been shown that the Lys-2Lys dendrimer rotates more slowly than Lys-2Gly. At the same time, the local orientational mobility of the CH 2 (-N) groups in inner and terminal segments in Lys-2Lys is close to the local orientational mobility of those groups in Lys-2Gly, and comparable to the mobility of CH 2 groups in a usual lysine dendrimer. The dependencies of the spin-lattice relaxation rate for terminal and inner CH 2 groups were compared with each other and with the experimental NMR data. It has been shown that the mobility of terminal groups is essentially larger than the mobility of inner groups. A good agreement between simulation and experimental data for both types of CH 2 groups was obtained. However, the calibration parameter A 0 for 1 / T 1 H of terminal groups is larger than its theoretical value. The mobility of inner-Gly CH 2 groups was studied also. The spin-lattice relaxation rates of the same groups in both dendrimers are similar, and their values at all temperatures are very close to experimental values.
In general, the large and charged side groups of 2Lys spacers in the Lys-2Lys dendrimer lead to larger size and smaller fluctuations of this dendrimer in comparison with the Lys-2Gly dendrimer, but they almost do not affect the local internal mobility of the same groups in dendrimers.
The synthesis, NMR properties [63], and biomedical applications [57] of peptide dendrimers with Lys2Lys and Lys2Gly repeating units were published by us in recent years. These two dendrimers were chosen because they have a total positive charge large enough (+16 and +44, correspondingly) for complexation with negatively charged DNA and RNA molecules for application in gene delivery. The Lys-2Lys dendrimer has a larger charge which is good for complexation, but it has a rather rigid backbone that could limit its conformational rearrangement in the complexes with RNA or DNA. As the Lys-2Gly dendrimer has a smaller charge, it should have a greater internal conformational mobility because 2Gly spacers between branching points are much more flexible than the rigid 2Lys spacers in the first dendrimer. Moreover, due to this reason, the branches of the Lys-2Gly dendrimer could better rearrange around RNA and DNA molecules providing better contact with them.
In the future, we plan to continue theoretical and experimental studies of these dendrimer structures of the high generations and the peptide dendrimers with other amino acid compositions.

Author Contributions

Conceptualization, V.V.B., O.V.S., I.M.N., and D.A.M.; methodology, V.V.B., O.V.S., I.M.N., N.N.S., A.V.P., and D.A.M.; software, S.E.M., V.V.B., N.N.S., and O.V.S.; validation, V.V.B., N.N.S., and A.V.P.; formal analysis, S.E.M., V.V.B., and O.V.S.; investigation, V.V.B., O.V.S., and I.M.N.; resources, I.M.N. and D.A.M.; data curation, I.M.N. and D.A.M.; writing—original draft preparation, S.E.M., V.V.B., O.V.S., I.M.N., and D.A.M.; writing—review and editing V.V.B., O.V.S., I.M.N., N.N.S., A.V.P., and D.A.M.; visualization S.E.M., V.V.B., O.V.S., and N.N.S.; supervision, I.M.N., A.V.P., and D.A.M.; project administration, D.A.M.; funding acquisition, D.A.M. All authors have read and agreed to the published version of the manuscript.

Funding

This research was funded by the Russian Foundation for Basic Research (grants No. 19-03-00715). I.M.N. and O.V.S. were supported by grant 08-08 of the Government of Russian Federation.

Acknowledgments

This work is supported by the Russian Foundation for Basic Research (grants No. 19-03-00715). I.M.N. and O.V.S. were supported by grant 08-08 of the Government of Russian Federation. The research is carried out using the equipment of the shared research facilities of HPC computing resources at Lomonosov Moscow State University [126] and Computer Resources Center of Saint Petersburg State University.

Conflicts of Interest

The authors declare no conflict of interest.

References

  1. Buhleier, E.; Wehner, E.; Vogtle, F. “Cascade” and “nonskid-chain-like” syntheses of molecular cavity topologies. Synthesis 1978, 78, 155–158. [Google Scholar] [CrossRef]
  2. Frechet, M.J.; Tomalia, D.A. (Eds.) Dendrimers and Other Dendritic Polymer, 1st ed.; Wiley: London, UK, 2001. [Google Scholar] [CrossRef]
  3. Bourne, N.; Stanberry, L.R.; Kern, E.R.; Holan, G.; Matthews, B.; Bernstein, D.I. Dendrimers, a new class of candidate topical microbicides with activity against herpes simplex virus infection. Antimicrob. Agents Chemother. 2000, 44, 2471–2474. [Google Scholar] [CrossRef] [PubMed] [Green Version]
  4. Sherje, A.P.; Jadhav, M.; Dravyakar, B.R.; Kadam, D. Dendrimers: A versatile nanocarrier for drug delivery and targeting. Int. J. Pharm. 2018, 548, 707–720. [Google Scholar] [CrossRef] [PubMed]
  5. Madaan, K.; Kumar, S.; Poonia, N.; Lather, V.; Pandita, D. Dendrimers in drug delivery and targeting: Drug-dendrimer interactions and toxicity issues. J. Pharm. Bioallied Sci. 2014, 6, 139–150. [Google Scholar] [CrossRef] [PubMed]
  6. Bielinska, A.; Kukowska-Latallo, J.F.; Johnson, J.; Tomalia, D.A.; Baker, J.R., Jr. Regulation of in vitro gene expression using antisense oligonucleotides or antisense expression plasmids transfected using starburst PAMAM dendrimers. Nucleic Acids Res. 1996, 24, 2176–2182. [Google Scholar] [CrossRef] [Green Version]
  7. Dutta, T.; Jain, N.K.; McMillan, N.A.; Parekh, H.S. Dendrimer nanocarriers as versatile vectors in gene delivery. Nanomedicine 2010, 6, 25–34. [Google Scholar] [CrossRef]
  8. Ionov, M.; Lazniewska, J.; Dzmitruk, V.; Halets, I.; Loznikova, S.; Novopashina, D.; Apartsin, E.; Krasheninina, O.; Venyaminova, A.; Milowska, K.; et al. Anticancer siRNA cocktails as a novel tool to treat cancer cells. Part (A). Mechanisms of interaction. Int. J. Pharm. 2015, 485, 261–269. [Google Scholar] [CrossRef]
  9. Dzmitruk, V.; Szulc, A.; Shcharbin, D.; Janaszewska, A.; Shcharbina, N.; Lazniewska, J.; Novopashina, D.; Buyanova, M.; Ionov, M.; Klajnert-Maculewicz, B.; et al. Anticancer siRNA cocktails as a novel tool to treat cancer cells. Part (B). Efficiency of pharmacological action. Int. J. Pharm. 2015, 485. [Google Scholar] [CrossRef]
  10. Yamamoto, K.; Imaoka, T.; Tanabe, M.; Kambe, T. New Horizon of Nanoparticle and Cluster Catalysis with Dendrimers. Chem. Rev. 2020, 120, 1397–1437. [Google Scholar] [CrossRef]
  11. Denkewalter, R.G.; Kolc, J.; Lukasavage, W.J. Preparation of Lysine Based Macromolecular Highly Branched Compound. U.S. Patent No. 4 (360), 646, 6 April 1979. [Google Scholar]
  12. Denkewalter, R.G.; Kolc, J.; Lukasavage, W.J. Macromolecular Highly Branched Homogeneous Compound Based on Lysine Units. U.S. Patent No. 4 (289), 872, 15 September 1981. [Google Scholar]
  13. Vlasov, G.P.; Korol’kov, V.I.; Pankova, G.A.; Tarasenko, I.I.; Baranov, A.N.; Glazkov, P.B.; Kiselev, A.V.; Ostapenko, O.V.; Lesina, E.A.; Baranov, V.S. Lysine Dendrimers and Their Starburst Polymer Derivatives: Possible Application for DNA Compaction and in vitro Delivery of Genetic Constructs. Russ. J. Bioorg. Chem. 2004, 30, 12. [Google Scholar] [CrossRef]
  14. McCarthy, T.D.; Karellas, P.; Henderson, S.A.; Giannis, M.; O’Keefe, D.F.; Heery, G.; Paull, J.; Matthews, B.R.; Holan, G. Dendrimers as drugs: Discovery and preclinical and clinical development of dendrimer-based microbicides for HIV and STI prevention. Mol. Pharm. 2005, 2, 312–318. [Google Scholar] [CrossRef] [PubMed]
  15. Patri, A.K.; Majoros, I.J.; Baker, J.R. Dendritic polymer macromolecular carriers for drug delivery. Curr. Opin. Chem. Biol. 2002, 6, 466–471. [Google Scholar] [CrossRef]
  16. Fox, M.E.; Guillaudeu, S.; Frechet, J.M.; Jerger, K.; Macaraeg, N.; Szoka, F.C. Synthesis and in vivo antitumor efficacy of PEGylated poly (l-lysine) dendrimer-camptothecin conjugates. Mol. Pharm. 2009, 6, 1562–1572. [Google Scholar] [CrossRef] [PubMed] [Green Version]
  17. Kaminskas, L.M.; Kelly, B.D.; McLeod, V.M.; Sberna, G.; Owen, D.J.; Boyd, B.J.; Porter, C.J. Characterisation and tumour targeting of PEGylated polylysine dendrimers bearing doxorubicin via a pH labile linker. J. Control. Release 2011, 152, 241–248. [Google Scholar] [CrossRef]
  18. Al-Jamal, K.; Al-Jamal, W.; Wang, J.; Rubio, N.; Buddle, J.; Gathercole, D.; Zloh, M.; Kestrels, K. Cationic poly-L-lysine dendrimer complexes doxorubicin and delays tumor growth in vitro and in vivo. ACS Nano 2013, 7, 1905–1917. [Google Scholar] [CrossRef]
  19. Ohsaki, M.; Okuda, T.; Wada, A.; Hirayama, T.; Niidome, T.; Aoyagi, H. In vitro gene transfection using dendritic poly (L-lysine). Bioconjug. Chem. 2002, 13, 510–517. [Google Scholar] [CrossRef]
  20. Okuda, T.; Kidoaki, S.; Ohsaki, M.; Koyama, Y.; Yoshikawa, K.; Niidome, T.; Aoyagi, H. Time-dependent complex formation of dendritic poly (L-lysine) with plasmid DNA and correlation with in vitro transfection efficiencies. Org. Biomol. Chem. 2003, 1, 1270–1273. [Google Scholar] [CrossRef]
  21. Cong, H.; Wang, K.; Zhou, Z.; Yang, J.; Piao, Y.; Yu, B.; Shen, Y.; Zhou, Z. Tuning the Brightness and Photostability of Organic Dots for Multivalent Targeted Cancer Imaging and Surgery. ACS Nano 2020, 14, 5887–5900. [Google Scholar] [CrossRef]
  22. Al-Jamal, K.T.; Akerman, S.; Podesta, J.E.; Yilmazer, A.; Turton, J.A.; Bianco, A.; Vargesson, N.; Kanthou, C.; Florence, A.T.; Tozer, G.M.; et al. Systemic antiangiogenic activity of cationic poly-l-lysine dendrimer delays tumor growth. Proc. Natl. Acad. Sci. USA 2010, 107, 3966–3971. [Google Scholar] [CrossRef] [Green Version]
  23. Boyd, B.J.; Kaminskas, L.M.; Karellas, P.; Krippner, G.; Lessene, R.; Porter, C.J. Cationic poly-l-lysine dendrimers: Pharmacokinetics, biodistribution, and evidence for metabolism and bioresorption after intravenous administration to rats. Mol. Pharm. 2006, 3, 614–627. [Google Scholar] [CrossRef]
  24. Isaksson, K.; Akerberg, D.; Posaric-Bauden, M.; Andersson, R.; Tingstedt, B. In vivo toxicity and biodistribution of intraperitoneal and intravenous poly-l-lysine and poly-l-lysine/poly-l-glutamate in rats. J. Mater. Sci. Mater. Med. 2014, 25, 1293–1299. [Google Scholar] [CrossRef]
  25. Aharoni, S.M.; Crosby, C.R., III; Walsh, E.K. Size and solution properties of globular tert-butyloxycarbonyl-poly(α,ϵ-l-lysine). Macromolecules 1982, 15, 1093–1098. [Google Scholar] [CrossRef]
  26. Aharoni, S.; Murthy, M. Spherical non-draining BOC-poly-(α,ϵ-l-lysine) macromolecules SAX and viscous study. Polym. Commun. 1983, 24, 132. [Google Scholar]
  27. Neelov, I.; Falkovich, S.; Markelov, D.; Paci, E.; Darinskii, A.; Tenhu, H. Molecular Dynamics of Lysine Dendrimers. Computer Simulation and NMR. In Dendrimers in Biomedical Applications; Royal Society of Chemistry: London, UK, 2013; pp. 99–114. [Google Scholar] [CrossRef]
  28. Neelov, I.; Markelov, D.; Falkovich, S.; Ilyash, M.; Okrugin, B.; Darinskii, A. Mathematical simulation of lysine dendrimers. Temperature dependencies. Polym. Sci. Ser. C 2013, 55, 154–161. [Google Scholar] [CrossRef]
  29. Markelov, D.A.; Falkovich, S.G.; Neelov, I.M.; Ilyash, M.Y.; Matveev, V.V.; Lahderanta, E.; Ingman, P.; Darinskii, A.A. Molecular dynamics simulation of spin–lattice NMR relaxation in poly-l-lysine dendrimers: Manifestation of the semiflexibility effect. Phys. Chem. Chem. Phys. 2015, 17, 3214–3226. [Google Scholar] [CrossRef] [PubMed] [Green Version]
  30. Roberts, B.P.; Scanlon, M.J.; Krippner, G.Y.; Chalmers, D.K. Molecular Dynamics of Poly(l-lysine) Dendrimers with Naphthalene Disulfonate Caps. Macromolecules 2009, 42, 2775–2783. [Google Scholar] [CrossRef]
  31. Falkovich, S.; Markelov, D.; Neelov, I.; Darinskii, A. Are structural properties of dendrimers sensitive to the symmetry of branching? Computer simulation of lysine dendrimers. J. Chem. Phys. 2013, 139, 064903. [Google Scholar] [CrossRef]
  32. Shavykin, O.; Mikhailov, I.; Darinskii, A.; Neelov, I.; Leermakers, F. Effect of an asymmetry of branching on structural characteristics of dendrimers revealed by Brownian dynamics simulations. Polymer 2018, 146, 256–266. [Google Scholar] [CrossRef]
  33. Shavykin, O.; Neelov, I.; Darinskii, A. Is the Manifestation of the Local Dynamics in the Spin-Lattice NMR Relaxation in Dendrimers Sensitive to Excluded Volume Interactions. Phys. Chem. Chem. Phys. 2016, 18, 24307–24317. [Google Scholar] [CrossRef] [Green Version]
  34. Dalakoglou, G.; Karatasos, K.; Lyulin, S.; Larin, S.; Darinskii, A.; Lyulin, A. Conformational Effects in Non-Stoichiometric Complexes of Two Hyperbranched Molecules with a Linear Polyelectrolyte. Polymers 2002, 4, 240–255. [Google Scholar] [CrossRef] [Green Version]
  35. Shavykin, O.V.; Leermakers, F.A.; Neelov, I.M.; Darinskii, A.A. Self-Assembly of Lysine-Based Dendritic Surfactants Modeled by the Self-Consistent Field Approach. Langmuir 2018, 34, 1613–1626. [Google Scholar] [CrossRef]
  36. Rao, C.; Tam, J.P. Synthesis of peptide dendrimer. J. Am. Chem. Soc. 1994, 116, 6975–6976. [Google Scholar] [CrossRef]
  37. Tam, J.P. Synthetic peptide vaccine design: Synthesis and properties of a high-density multiple antigenic peptide system. Proc. Natl. Acad. Sci. USA 1988, 85, 5409–5413. [Google Scholar] [CrossRef] [Green Version]
  38. Vlasov, G.; Tarasenko, I.; Valueva, S.; Kipper, A.; Tarabukina, E.; Filippov, A.; Avdeeva, E.; Vorob’ev, V.I. Hyperbranched Poly(l-lysine) Containing Additional Amino Acids or Their Oligomers Between Branching Points: Synthesis and Structure. Polym. Sci. Ser. A 2005, 47, 422–429. [Google Scholar] [CrossRef]
  39. Crespo, L.; Sanclimens, G.; Pons, M.; Giralt, E.; Royo, M.; Albericio, F. Peptide and amide bond-containing dendrimers. Chem. Rev. 2005, 105, 1663–1682. [Google Scholar] [CrossRef]
  40. Choi, J.S.; Nam, K.; Park, J.y.; Kim, J.B.; Lee, J.K.; Park, J.S. Enhanced Transfection Efficiency of PAMAM Dendrimer by Surface Modification with l-Arginine. J. Control. Release 2004, 99, 445–456. [Google Scholar] [CrossRef]
  41. Aldawsari, H.; Raj, B.S.; Edrada-Ebel, R.; Blatchford, D.R.; Tate, R.J.; Tetley, L.; Dufès, C. Enhanced gene expression in tumors after intravenous administration of arginine-, lysine- and leucine-bearing polyethylenimine polyplex. Nanomed. Nanotechnol. Biol. Med. 2011, 7, 615–623. [Google Scholar] [CrossRef]
  42. Delort, E.; Darbre, T.; Reymond, J.L. A strong positive dendritic effect in a peptide dendrimer-catalyzed ester hydrolysis reaction. J. Am. Chem. Soc. 2004, 126, 15642–15643. [Google Scholar] [CrossRef]
  43. Darbre, T.; Reymond, J.L. Peptide dendrimers as artificial enzymes, receptors, and drug-delivery agents. Acc. Chem. Res. 2006, 39, 925–934. [Google Scholar] [CrossRef]
  44. Javor, S.; Delort, E.; Darbre, T.; Reymond, J.L. A peptide dendrimer enzyme model with a single catalytic site at the core. J. Am. Chem. Soc. 2007, 129, 13238–13246. [Google Scholar] [CrossRef]
  45. Polcyn, P.; Zielinska, P.; Zimnicka, M.; Troc, A.; Kalicki, P.; Solecka, J.; Laskowska, A.; Urbanczyk-Lipkowska, Z. Novel antimicrobial peptide dendrimers with amphiphilic surface and their interactions with phospholipids—Insights from mass spectrometry. Molecules 2013, 18, 7120–7144. [Google Scholar] [CrossRef] [Green Version]
  46. Pires, J.; Siriwardena, T.; Stach, M.; Tinguely, R.; Kasraian, S.; Luzzaro, F.; Leib, S.; Darbre, T.; Reymond, J.L.; Endimiani, A. In Vitro Activity of the Novel Antimicrobial Peptide Dendrimer G3KL against Multidrug-Resistant Acinetobacter baumannii and Pseudomonas aeruginosa. Antimicrob. Agents Chemother. 2015, 59, 7915–7918. [Google Scholar] [CrossRef] [Green Version]
  47. Klajnert, B.; Janiszewska, J.; Urbanczyk-Lipkowska, Z.; Bryszewska, M.; Shcharbin, D.; Labieniec, M. Biological properties of low molecular mass peptide dendrimers. Int. J. Pharm. 2006, 309, 208–217. [Google Scholar] [CrossRef]
  48. Manikkath, J.; Hegde, A.R.; Kalthur, G.; Parekh, H.S.; Mutalik, S. Influence of peptide dendrimers and sonophoresis on the transdermal delivery of ketoprofen. Int. J. Pharm. 2017, 521, 110–119. [Google Scholar] [CrossRef] [Green Version]
  49. Santos, S.; Gonzaga, R.; Silva, J.; Savino, D.; Prieto, D.; Shikay, J.; Silva, R.; Paulo, L.; Ferreira, E.; Giarolla, J. Peptide dendrimers: Drug/gene delivery and other approaches. Can. J. Chem. 2017, 95, 907–916. [Google Scholar] [CrossRef] [Green Version]
  50. Yang, J.; Zhang, Q.; Chang, H.; Cheng, Y. Surface-engineered dendrimers in gene delivery. Chem. Rev. 2015, 115, 5274–5300. [Google Scholar] [CrossRef]
  51. Kwok, A.; Eggimann, G.; Reymond, J.; Darbre, T.; Hollfelder, F. Peptide dendrimer/lipid hybrid systems are efficient DNA transfection reagents: Structure-activity relationships highlight the role of charge distribution across dendrimer generations. ACS Nano 2013, 7, 4668–4682. [Google Scholar] [CrossRef]
  52. Kwok, A.; Eggimann, G.; Heitz, M.; Reymond, J.L.; Hollfelder, F.; Darbre, T.; Darbre, T. Efficient Transfection of siRNA by Peptide Dendrimer–Lipid Conjugates. Chem. Biol. Chem. 2016, 17, 2223–2229. [Google Scholar] [CrossRef] [Green Version]
  53. Mannisto, M.; Vanderkerken, S.; Toncheva, V.; Elomaa, M.; Ruponen, M.; Schacht, E.; Urtti, A. Structure–activity relationships of poly (l-lysines): Effects of pegylation and molecular shape on physicochemical and biological properties in gene delivery. J. Control. Release 2002, 83, 169–182. [Google Scholar] [CrossRef]
  54. Luo, K.; Li, C.; Wang, G.; Nie, Y.; He, B.; Wu, Y.; Gu, Z. Peptide dendrimers as efficient and biocompatible gene delivery vectors: Synthesis and in vitro characterization. J. Control. Release 2011, 155, 77–87. [Google Scholar] [CrossRef]
  55. Luo, K.; Li, C.; Li, L.; She, W.; Wang, G.; Gu, Z. Arginine functionalized peptide dendrimers as potential gene delivery vehicles. Biomaterials 2012, 33, 4917–4927. [Google Scholar] [CrossRef]
  56. Rewatkar, P.V.; Parekh, H.S.; Parat, M.O. Molecular determinants of the cellular entry of asymmetric peptide dendrimers and role of caveolae. PLoS ONE 2016, 11, e0147491. [Google Scholar] [CrossRef] [PubMed]
  57. Gorzkiewicz, M.; Konopka, M.; Janaszewska, A.; Tarasenko, I.I.; Sheveleva, N.N.; Gajek, A.; Neelov, I.M.; Klajnert-Maculewicz, B. Application of new lysine-based peptide dendrimers D3K2 and D3G2 for gene delivery: Specific cytotoxicity to cancer cells and transfection in vitro. Bioorg. Chem. 2020, 95, 103504. [Google Scholar] [CrossRef] [PubMed]
  58. Gorzkiewicz, M.; Kopec, O.; Janaszewska, A.; Konopka, M.; Pedziwiatr-Werbicka, E.; Tarasenko, I.I.; Bezrodnyi, V.V.; Neelov, I.M.; Klajnert-Maculewicz, B. Poly(lysine) Dendrimers Form Complexes with siRNA and Provide Its Efficient Uptake by Myeloid Cells: Model Studies for Therapeutic Nucleic Acid Delivery. Int. J. Mol. Sci. 2020, 21, 3138. [Google Scholar] [CrossRef]
  59. Mikhailov, I.; Darinskii, A. Does symmetry of branching affect the properties of dendrimers? Polym. Sci. Ser. A 2014, 56, 534–544. [Google Scholar] [CrossRef]
  60. Filipe, L.C.S.; Machuqueiro, M.; Darbre, T.; Baptista, A.M. Exploring the Structural Properties of Positively Charged Peptide Dendrimers. J. Phys. Chem. B 2016, 120, 11323–11330. [Google Scholar] [CrossRef] [Green Version]
  61. Filipe, L.C.S.; Campos, S.R.R.; Machuqueiro, M.; Darbre, T.; Baptista, A.M. Structuring peptide dendrimers through pH modulation and substrate binding. J. Phys. Chem. B 2016, 120, 10138–10152. [Google Scholar] [CrossRef]
  62. Okrugin, B.; Neelov, I.; Leermakers, F.M.; Borisov, O. Structure of asymmetrical peptide dendrimers: Insights given by self-consistent field theory. Polymer 2017, 125, 292–302. [Google Scholar] [CrossRef]
  63. Sheveleva, N.N.; Markelov, D.A.; Vovk, M.A.; Mikhailova, M.E.; Tarasenko, I.I.; Neelov, I.M.; Lahderanta, E. NMR studies of excluded volume interactions in peptide dendrimers. Sci. Rep. 2018, 8, 8916. [Google Scholar] [CrossRef] [Green Version]
  64. Sheveleva, N.N.; Markelov, D.A.; Vovk, M.A.; Mikhailova, M.E.; Tarasenko, I.I.; Tolstoy, P.M.; Neelov, I.M.; Lähderanta, E. Lysine-based dendrimer with double arginine residues. RSC Adv. 2019, 9, 18018–18026. [Google Scholar] [CrossRef] [Green Version]
  65. Sheveleva, N.N.; Markelov, D.A.; Vovk, M.A.; Tarasenko, I.I.; Mikhailova, M.E.; Ilyash, M.Y.; Neelov, I.M.; Lahderanta, E. Stable Deuterium Labeling of Histidine-Rich Lysine-Based Dendrimers. Molecules 2019, 24, 2481. [Google Scholar] [CrossRef] [PubMed] [Green Version]
  66. Yevlampieva, N.; Dobrodumov, A.; Nazarova, O.; Okatova, O.; Cottet, H. Hydrodynamic Behavior of Dendrigraft Polylysines in Water and Dimethylformamide. Polymers 2012, 4, 20–31. [Google Scholar] [CrossRef]
  67. Abraham, M.J.; Murtola, T.; Schulz, R.; Pall, S.; Smith, J.C.; Hess, B.; Lindahl, E. GROMACS: High performance molecular simulations through multi-level parallelism from laptops to supercomputers. Software X 2015, 1–2, 19–25. [Google Scholar] [CrossRef] [Green Version]
  68. Lindorff-Larsen, K.; Piana, S.; Palmo, K.; Maragakis, P.; Klepeis, J.L.; Dror, R.O.; Shaw, D.E. Improved side-chain torsion potentials for the Amber ff99SB protein force field. Proteins 2010, 78, 1950–1958. [Google Scholar] [CrossRef] [Green Version]
  69. Mazo, M.A.; Shamaev, M.Y.; Balabaev, N.K.; Darinskii, A.A.; Neelov, I.M. Conformational mobility of carbosilane dendrimer: Molecular dynamics simulation. Phys. Chem. Chem. Phys. 2004, 6, 1285–1289. [Google Scholar] [CrossRef]
  70. Kurbatov, A.O.; Balabaev, N.K.; Kramarenko, E.Y. A Comparative Study of Intramolecular Mobility of Single Siloxane and Carbosilane Dendrimers via Molecular Dynamics Simulations. Polymers 2018, 10, 838. [Google Scholar] [CrossRef] [Green Version]
  71. Okrugin, B.; Ilyash, M.; Markelov, D.; Neelov, I. Lysine dendrigraft nanocontainers. Influence of topology on their size and internal structure. Pharmaceutics 2018, 10, 129. [Google Scholar] [CrossRef] [Green Version]
  72. Neelov, I.; Adolf, D. Brownian dynamics simulations of dendrimers under elongational flow: Bead-rod model with hydrodynamic interactions. Macromolecules 2003, 36, 6914–6924. [Google Scholar] [CrossRef]
  73. Neelov, I.; Adolf, D. Brownian dynamics simulation of hyperbranched polymers under elongational flow. Phys. Chem. B 2004, 108, 7627–7636. [Google Scholar] [CrossRef]
  74. Darinsky, A.; Lyulin, A.; Neelov, I. Computer simulations of molecular motion in liquid crystals by the method of Brownian dynamics. Macromol. Theory Simul. 1993, 2, 523–530. [Google Scholar] [CrossRef]
  75. Darinskii, A.; Gotlib, Y.; Lyulin, A.; Neyelov, L. Computer simulation of local dynamics of a polymer chain in the orienting field of the LC type. Vysokomol. Soedin. Ser. A 1991, 33, 1211–1220. [Google Scholar] [CrossRef]
  76. Darinskii, A.; Gotlib, Y.; Lukyanov, M.; Lyulin, A.; Neelov, I. Computer simulation of the molecular motion in LC and oriented polymers. In Application of Scattering Methods to the Dynamics of Polymer Systems; Ewen, B., Fischer, E., Fytas, G., Eds.; Progress in Colloid & Polymer Science; Springer: Berlin, Germany, 1993; Volume 91, pp. 13–15. [Google Scholar] [CrossRef]
  77. Neelov, I.M.; Binder, K. Brownian dynamics of grafted polymer chains: Time-dependent properties. Macromol. Theory Simul. 1995, 4, 1063–1084. [Google Scholar] [CrossRef]
  78. Neelov, I.; Adolf, D.; McLeish, T.; Paci, E. Molecular dynamics simulation of dextran extension by constant force in single molecule AFM. Biophys. J. 2006, 91, 3579–3588. [Google Scholar] [CrossRef] [Green Version]
  79. Gowdy, J.; Batchelor, M.; Neelov, I.; Paci, E. Nonexponential kinetics of loop formation in proteins and peptides: A signature of rugged free energy landscapes? J. Phys. Chem. B 2017, 121, 9518–9525. [Google Scholar] [CrossRef] [PubMed] [Green Version]
  80. Ennari, J.; Elomaa, M.; Neelov, I.; Sundholm, F. Modeling of water-free and water containing solid polyelectrolytes. Polymer 2000, 41, 985–990. [Google Scholar] [CrossRef]
  81. Ennari, J.; Neelov, I.; Sundholm, F. Molecular dynamics simulation of the PEO sulfonic acid anion in water. Comput. Theor. Polym. Sci. 2000, 10, 403–410. [Google Scholar] [CrossRef]
  82. Ennari, J.; Neelov, I.; Sundholm, F. Simulation of a PEO based solid polyelectrolyte, comparison of the CMM and the Ewald summation method. Polymer 2000, 41, 2149–2155. [Google Scholar] [CrossRef]
  83. Ennari, J.; Neelov, I.; Sundholm, F. Molecular dynamics simulation of the structure of PEO based solid polymer electrolytes. Polymer 2000, 41, 4057–4063. [Google Scholar] [CrossRef]
  84. Ennari, J.; Neelov, I.; Sundholm, F. Estimation of the ion conductivity of a PEO-based polyelectrolyte system by molecular modeling. Polymer 2001, 42, 8043–8050. [Google Scholar] [CrossRef]
  85. Ennari, J.; Neelov, I.; Sunholm, F. Modelling of gas transport properties of polymer electrolytes containing various amounts of water. Polymer 2004, 45, 4171–4179. [Google Scholar] [CrossRef]
  86. Neelov, I.; Adolf, D.; Lyulin, A.; Davies, G. Brownian dynamics simulation of linear polymers under elongational flow: Bead–rod model with hydrodynamic interactions. J. Chem. Phys. 2002, 117, 4030–4041. [Google Scholar] [CrossRef] [Green Version]
  87. Berendsen, H.; Postma, J.; DiNola, A.; Haak, J. Molecular dynamics with coupling to an external bath. J. Chem. Phys. 1984, 81, 3684–3690. [Google Scholar] [CrossRef] [Green Version]
  88. Evans, D.; Holian, B.L. The Nose–Hoover thermostat. J. Chem. Phys. 1985, 83, 4069. [Google Scholar] [CrossRef]
  89. Parrinello, M.; Rahman, A. Polymorphic transitions in single crystals: A new molecular dynamics method. J. Appl. Phys. 1982, 52, 7182. [Google Scholar] [CrossRef]
  90. Kell, G.S. Isothermal Compressibility of liquid Water at 1 Atm. J. Chem. Eng. Data 1970, 15, 119–122. [Google Scholar] [CrossRef]
  91. Rosmalen, M.; Krom, M.; Merkx, M. Tuning the Flexibility of Glycine-Serine Linkers To Allow Rational Design of Multidomain Proteins. Biochemistry 2017, 56, 6565–6574. [Google Scholar] [CrossRef]
  92. Shaitan, K.; Mikhailyuk, M.; Leont’ev, K.; Saraikin, S.; Belyakov, A.A. Molecular dynamics of bending fluctuations of the elements of protein secondary structure. Biophysics 2002, 47, 411–419. [Google Scholar]
  93. Klein, J.; Jiang, S.; Galimidi, R.; Keeffe, J.R.; Bjorkman, P. Design and characterization of structured protein linkers with differing flexibilities. Protein Eng. Des. Sel. 2014, 27, 325–330. [Google Scholar] [CrossRef]
  94. Landau, L.D.; Lifshitz, E.M. The Course of Theoretical Physics. Mechanics, 3rd ed.; Butterworth-Heinemann: Oxford, UK, 1976; Volume 1, p. 224. [Google Scholar] [CrossRef]
  95. Klos, J.; Sommer, J. Properties of Dendrimers with Flexible Spacer-Chains: A Monte Carlo Study. Macromolecules 2009, 42, 4878–4886. [Google Scholar] [CrossRef]
  96. Theodorou, D.N.; Suter, U.W. Shape of unperturbed linear polymers: Polypropylene. Macromolecules 1985, 18, 1206–1214. [Google Scholar] [CrossRef]
  97. Rudnick, G.; Gaspari, G. The aspherity of random walks. J. Phys. A 1986, 4, L191. [Google Scholar] [CrossRef]
  98. Maiti, P.; Cagin, T.; Wang, G.; Goddard, W. Structure of PAMAM Dendrimers: Generations 1 through 11. Macromolecules 2004, 37, 6236–6254. [Google Scholar] [CrossRef]
  99. Zacharopoulos, N.; Economou, I. Morphology and Organization of Poly(propylene imine) Dendrimers in the Melt from Molecular Dynamics Simulation. Macromolecules 2002, 35, 1814–1821. [Google Scholar] [CrossRef]
  100. Burchard, W. Solution Properties of Branched Macromolecules. In Advances in Polymer Science; Springer: Berlin, Germany, 1999; Volume 143, pp. 113–194. [Google Scholar] [CrossRef]
  101. Nygaard, M.; Kragelund, B.B.; Papaleo, E.; Lindorff-Larsen, K. An Efficient Method for Estimating the Hydrodynamic Radius of Disordered Protein Conformations. Biophys. J. 2017, 113, 550–557. [Google Scholar] [CrossRef] [Green Version]
  102. Kirkwood, J.G. The general theory of irreversible processes in solutions of macromolecules. J. Polym. Sci. Polym. Phys. Ed. 1954, 12, 1–14. [Google Scholar] [CrossRef]
  103. Kollman, P.A.; Allen, L.C. Theory of the hydrogen bond. Chem. Rev. 1972, 72, 283–303. [Google Scholar] [CrossRef]
  104. Jeffrey, G.A.; Saenger, W. (Eds.) Hydrogen Bonding in Biological Structures, 1st ed.; Springer: Berlin/Heidelberg, Germany, 1991; p. 569. [Google Scholar] [CrossRef]
  105. Arunan, E.; Desiraju, G.R.; Klein, R.A.; Sadlej, J.; Scheiner, S.; Alkorta, I.; Clary, D.C.; Crabtree, R.H.; Dannenberg, J.J.; Hobza, P.; et al. Definition of the hydrogen bond (IUPAC Recommendations 2011). Pure Appl. Chem. 2011, 83. [Google Scholar] [CrossRef]
  106. Martinho, N.; Silva, L.; Florindo, H.; Brocchini, S.; Zloh, M.; Barata, T. Rational design of novel, fluorescent, tagged glutamic acid dendrimers with different terminal groups and in silico analysis of their properties. Int. J. Nanomed. 2017, 112, 7053–7073. [Google Scholar] [CrossRef] [Green Version]
  107. Xu, X.; Ran, Q.; Haag, R.; Ballauff, M.; Dzubiella, J. Charged Dendrimers Revisited: Effective Charge and Surface Potential of Dendritic Polyglycerol Sulfate. Macromolecules 2017, 50, 4759–4769. [Google Scholar] [CrossRef] [Green Version]
  108. Klos, J.S. The Poisson-Boltzmann-Flory Approach to Charged Dendrimers: Effect of Generation and Spacer Length. Macromolecules 2019, 52, 3625–3635. [Google Scholar] [CrossRef]
  109. Delgado, A.V.; Gonzalez-Caballero, F.; Hunter, R.J.; Koopal, L.K.; Lyklema, J. Measurement and interpretation of electrokinetic phenomena. Pure Appl. Chem. 2005, 77, 1753–1805. [Google Scholar] [CrossRef] [Green Version]
  110. Ohshima, H. Theory of Colloid and Interfacial Electric Phenomena. Interface Science and Technology; Academic Press: Cambridge, MA, USA, 2006; Volume 12, p. 473. [Google Scholar] [CrossRef]
  111. Wolterink, J.K.; Leermakers, F.A.; Fleer, G.J.; Koopal, L.K.; Zhulina, E.B.; Borisov, O.V. Screening in Solutions of Star-Branched Polyelectrolytes. Macromolecules 1999, 32, 2365. [Google Scholar] [CrossRef]
  112. Gotlib, Y.Y.; Balabaev, N.K.; Darinskii, A.A.; Neelov, I.M. Investigation of Local Motions in Polymers by the Method of Molecular Dynamics. Macromolecules 1980, 13, 602–608. [Google Scholar] [CrossRef]
  113. Markelov, D.; Dolgushev, M.; Lahderanta, E. NMR Relaxation in Dendrimers. Annu. Rep. NMR Spectrosc. 2017, 91, 1–66. [Google Scholar] [CrossRef]
  114. Kimmich, R. (Ed.) NMR—Tomography, Diffusometry, Relaxometry; Springer: Germany, Berlin, 1997. [Google Scholar] [CrossRef]
  115. Kruk, D.; Herrmann, A.; Rossler, E.A. Field-Cycling NMR Relaxometry of Viscous Liquids and Polymers. Prog. Nucl. Magn. Reson. Spectrosc. 2012, 63, 33–64. [Google Scholar] [CrossRef]
  116. Gupta, S.; Biswas, P. Orientational Relaxation of Poly(propylene imine) Dendrimers at Different pH. J. Phys. Chem. 2020. [Google Scholar] [CrossRef]
  117. Gotlib, Y.; Markelov, D. Permittivity of a dendrimer containing polar groups. Polym. Sci. Ser. A 2004, 46, 815–832. [Google Scholar] [CrossRef]
  118. Gotlib, Y.Y.; Markelov, D.A. Theory of Orientational Relaxation of Individual Specified Units in a Dendrimer. Polym. Sci. Ser. A 2007, 49, 1137–1154. [Google Scholar] [CrossRef]
  119. Markelov, D.A.; Dolgushev, M.; Gotlib, Y.Y.; Blumen, A. NMR relaxation of the orientation of single segments in semiflexible dendrimers. J. Chem. Phys. 2014, 140, 244904. [Google Scholar] [CrossRef] [Green Version]
  120. Grimm, J.; Dolgushev, M. Dynamics of internally functionalized dendrimers. Phys. Chem. Chem. Phys. 2016, 18, 19050–19061. [Google Scholar] [CrossRef] [Green Version]
  121. Sheveleva, N.N.; Dolgushev, M.; Lähderanta, E.; Markelov, D.A. NMR Relaxation of Functionalized Dendrimers. Macromolecules 2019, 52, 9766–9772. [Google Scholar] [CrossRef]
  122. Markelov, D.A.; Lyulin, S.V.; Gotlib, Y.Y.; Lyulin, A.V.; Matveev, V.V.; Lahderanta, E.; Darinskii, A.A. Orientational mobility and relaxation spectra of dendrimers: Theory and computer simulation. J. Chem. Phys. 2009, 130, 044907. [Google Scholar] [CrossRef] [PubMed] [Green Version]
  123. Markelov, D.A.; Gotlib, Y.Y.; Darinskii, A.A.; Lyulin, A.V.; Lyulin, S.V. Local Orientational Mobility in Dendrimers. Theory and Computer-Aided Simulation. Polym. Sci. Ser. A 2009, 51, 331–339. [Google Scholar] [CrossRef]
  124. Karatasos, K.; Adolf, D.; Davies, G. Statics and dynamics of model dendrimers as studied by molecular dynamics simulations. J. Chem. Phys. 2001, 115, 5310–5318. [Google Scholar] [CrossRef] [Green Version]
  125. Karatasos, K.; Lyulin, A. Local polymer dynamics under strong connectivity constraints: The dendrimer case. J. Chem. Phys. 2006, 15, 184907. [Google Scholar] [CrossRef] [PubMed] [Green Version]
  126. Sadovnichy, V.; Tikhonravov, A.; Voevodin, V.; Opanasenko, V. “Lomonosov”: Supercomputing at Moscow State University. In Contemporary High Performance Computing: From Petascale toward Exascale; Chapman and Hall/CRC: London, UK, 2013; pp. 283–307. [Google Scholar] [CrossRef]
Figure 1. Chemical structure of Lys-2Lys (a) and Lys-2Gly (b) dendrimers. Cores of both dendrimers are marked by green color, backbones by black color, and terminal lysines by red color. The difference between the two dendrimers is the side segments of the Lys-2Lys dendrimer marked by violet color.
Polymers 12 01657 g001
Figure 2. The time evolution of the mean-squared gyration radius R g ( t ) for (a) Lys-2Lys and (b) Lys-2Gly dendrimers at temperature T = 310 K.
Polymers 12 01657 g002
Figure 3. The snapshots of dendrimers at minimal value of R g : (a) Lys-2Lys (at 69.7 ns, see Figure 2a) and (b) Lys-2Gly (at 155.4 ns, see Figure 2b), and at maximal R g : (c) Lys-2Lys (at 137.3 ns, see Figure 2a) and (d) Lys-2Gly (at 78.1 ns, see Figure 2b) at T = 310 K.
Polymers 12 01657 g003
Figure 4. The autocorrelation functions (ACFs): the normalized ACF C R g 2 ( t ) of the square of the gyration radius R g and the orientational ACF P 1 r o t ( t ) at T = 310 K for (a) Lys-2Lys and (b) Lys-2Gly.
Polymers 12 01657 g004
Figure 5. (a) The mean square gyration radius R g as a function of temperature; (b) the distribution g ( d ) of a spacer length d between the neighboring branching points of the dendrimers at the average body temperature for both dendrimers.
Polymers 12 01657 g005
Figure 6. (a) The shape anisotropy α and (b) the characteristic ratio of hydrodynamic radius in Kirkwood approximation to the gyration radius R h / R g ; two theoretical limits are depicted on the graph: the Gaussian coil and the rigid sphere.
Polymers 12 01657 g006
Figure 7. The radial distribution function of density for (a) Lys-2Lys and (b) Lys-2Gly dendrimers at different temperatures.
Polymers 12 01657 g007
Figure 8. The radial distribution of the number of N atoms in terminal NH 3 + groups for (a) Lys-2Lys dendrimer and (b) Lys-2Gly dendrimer.
Polymers 12 01657 g008
Figure 9. The distribution function of the number of intra-dendrimer hydrogen bonds at different temperatures for (a) Lys-2Lys and (b) Lys-2Gly dendrimers.
Polymers 12 01657 g009
Figure 10. The radial distribution function of ion pairs Cl -N + at different temperatures for lysine-based dendrimers (a) Lys-2Lys and (b) Lys-2Gly.
Polymers 12 01657 g010
Figure 11. The radial distribution of (a) the total charge q ( r ) , (b) the cumulative charge Q ( r ) , and (c) the electrostatic potential at T = 310 K for both dendrimers. (d) The relative effective charge Q * / Q b a r e as a function of temperatures for the Lys-2Lys and the Lys-2Gly dendrimers.
Polymers 12 01657 g011
Figure 12. The structures of (a) the Lys-2Lys and (b) the Lys-2Gly dendrimers. Red circles show the CH-branching points in the core, inner, and terminal segments. The inner and terminal CH 2 groups are marked in blue and magenta colors, respectively. In Lys-2Lys, there are CH 2 groups in side segments of 2Lys spacers marked in green. In Lys-2Gly, there are CH 2 groups in each inserted 2Gly spacer marked by light blue. HH vector ( r H H ) is shown for one CH 2 group.
Polymers 12 01657 g012
Figure 13. The autocorrelation functions P 2 r o t and P 1 r o t 3 for the core-to-end vector of (a) Lys-2Lys and (b) Lys-2Gly dendrimers.
Polymers 12 01657 g013
Figure 14. The time dependencies of P 2 ( t ) for terminal CH 2 groups of (a) Lys-2Lys and (b) Lys-2Gly, for the inner CH 2 group of (c) Lys-2Lys and (d) Lys-2Gly, (e) for the side CH 2 group of Lys-2Lys, and (f) for inner-Gly CH 2 groups of Lys-2Gly.
Polymers 12 01657 g014
Figure 15. Frequency dependencies of 1 / T 1 H in the susceptibility representation of (a) terminal+side CH 2 groups in Lys-2Lys, (b) terminal CH 2 groups in Lys-2Lys Lys-2Gly, inner CH 2 groups in (c) Lys-2Lys and (d) Lys-2Gly, and the core-to-end vector in (e) Lys-2Lys and (f) Lys-2Gly. The vertical line represents to the frequency ( ω H / 2 π = 400 MHz), which corresponds to the spectrometer used in [63].
Polymers 12 01657 g015
Figure 16. Frequency dependencies of 1 / T 1 H of inner-Gly CH 2 groups in Lys-2Gly. The vertical line corresponds to the frequency ω H / 2 π = 400 MHz of the spectrometer used in [63].
Polymers 12 01657 g016
Figure 17. The spin-lattice 1 H NMR relaxation rate 1 / T 1 H at the fixed frequency ω H / 2 π = 400 MHz as a function of inverse temperature 1000 / T for (a) Lys-2Lys and (b) Lys-2Gly dendrimers calculated from MD simulation. The experimental points [63] are also depicted in the graph.
Polymers 12 01657 g017
Table 1. The characteristics of Lys-2Lys and Lys-2Gly dendrimers: the molecular mass of dendrimer M and dendrimer charge Q b a r e , number N e n d and charge Q e n d of terminal groups as well as number N i n s and charge Q i n s of inserted amino acid residues, the total number N H 2 O of water molecules in systems, and the average size a c e l l of the simulation cell.
DendrimerM (g/mol) Q bare (e) N end Q end (e) N ins Q ins (e) N H 2 0 a cell (nm)
Lys-2Lys5695.08+4416+1628+2813,2287.5
Lys-2Gly3675.44+1616+1628013,3967.5
Table 2. The characteristic times τ r o t P 1 (ns) of the rotation of Lys-2Lys and Lys-2Gly dendrimers as a whole.
TemperatureLys-2LysLys-2Gly
280 K13.73.6
290 K10.53.2
300 K9.02.8
310 K7.02.1
320 K5.52.0
340 K5.11.3
Table 3. The global properties of Lys-2Lys and Lys-2Gly dendrimers: the mean square gyration radius R g , the hydrodynamic radius R h in Kirkwood approximation, the characteristic ratio R h / R g , the approximation 5 / 3 R g of dendrimer boundary, the effective radius R m a x , and the shape anisotropy α at T = 310 K.
Dendrimer R g [nm] R h [nm] R h / R g 5 / 3 R g [nm] R e [nm] R max [nm] α
Lys-2Lys2.041.680.832.632.713.140.02
Lys-2Gly1.271.120.891.641.932.430.01
Table 4. The local characteristics of Lys-2Lys and Lys-2Gly dendrimers: the average number of inter-dendrimer ( n H i d ) and water–dendrimer ( n H d w ) hydrogen bonds, the average number of ion pairs n i o n p a i r s between charged groups in dendrimer and counterions, the effective dendrimer charge Q * , the relative effective dendrimer charge Q * / Q b a r e , the surface charge density σ , and ζ potential at T = 310 K (the average body temperature).
Dendrimer n H id n H dw n ion pairs Q * (e) Q * / Q bare σ (e/nm 2 ) ζ (mV)
Lys-2Lys1.52179.175.6913.180.300.1117.27
Lys-2Gly7.68100.680.679.390.590.1320.03

