Graphene Nanoplatelets for the Development of Reinforced PLA–PCL Electrospun Fibers as the Next-Generation of Biomedical Mats


 ,
, 
 ,
, 
 ,
, 
Abstract

1. Introduction
2. Materials and Methods
2.1. Materials
2.2. Electrospinning Process
2.3. Characterization of PLA–PCL/GNPs Blends
2.4. Electrospun Matrices Characterization
2.4.1. Morphology
2.4.2. Differential Scanning Calorimetry Analysis
2.5. Biologic Study: Cell Adhesion and Proliferation on Electrospun Matrices
2.6. In Vitro Degradation Study
2.6.1. Fluid Uptake and Mass Loss
2.6.2. PLA–PCL Molecular Weight Determination
2.6.3. Cytotoxicity of Mats Degradation Products
2.7. Mechanical Properties
2.8. Thermal Conductivity
2.9. Statistical Analysis
3. Results
3.1. Characterization of PLA–PCL/GNPs Blends
3.2. Electrospun Matrices Characterization
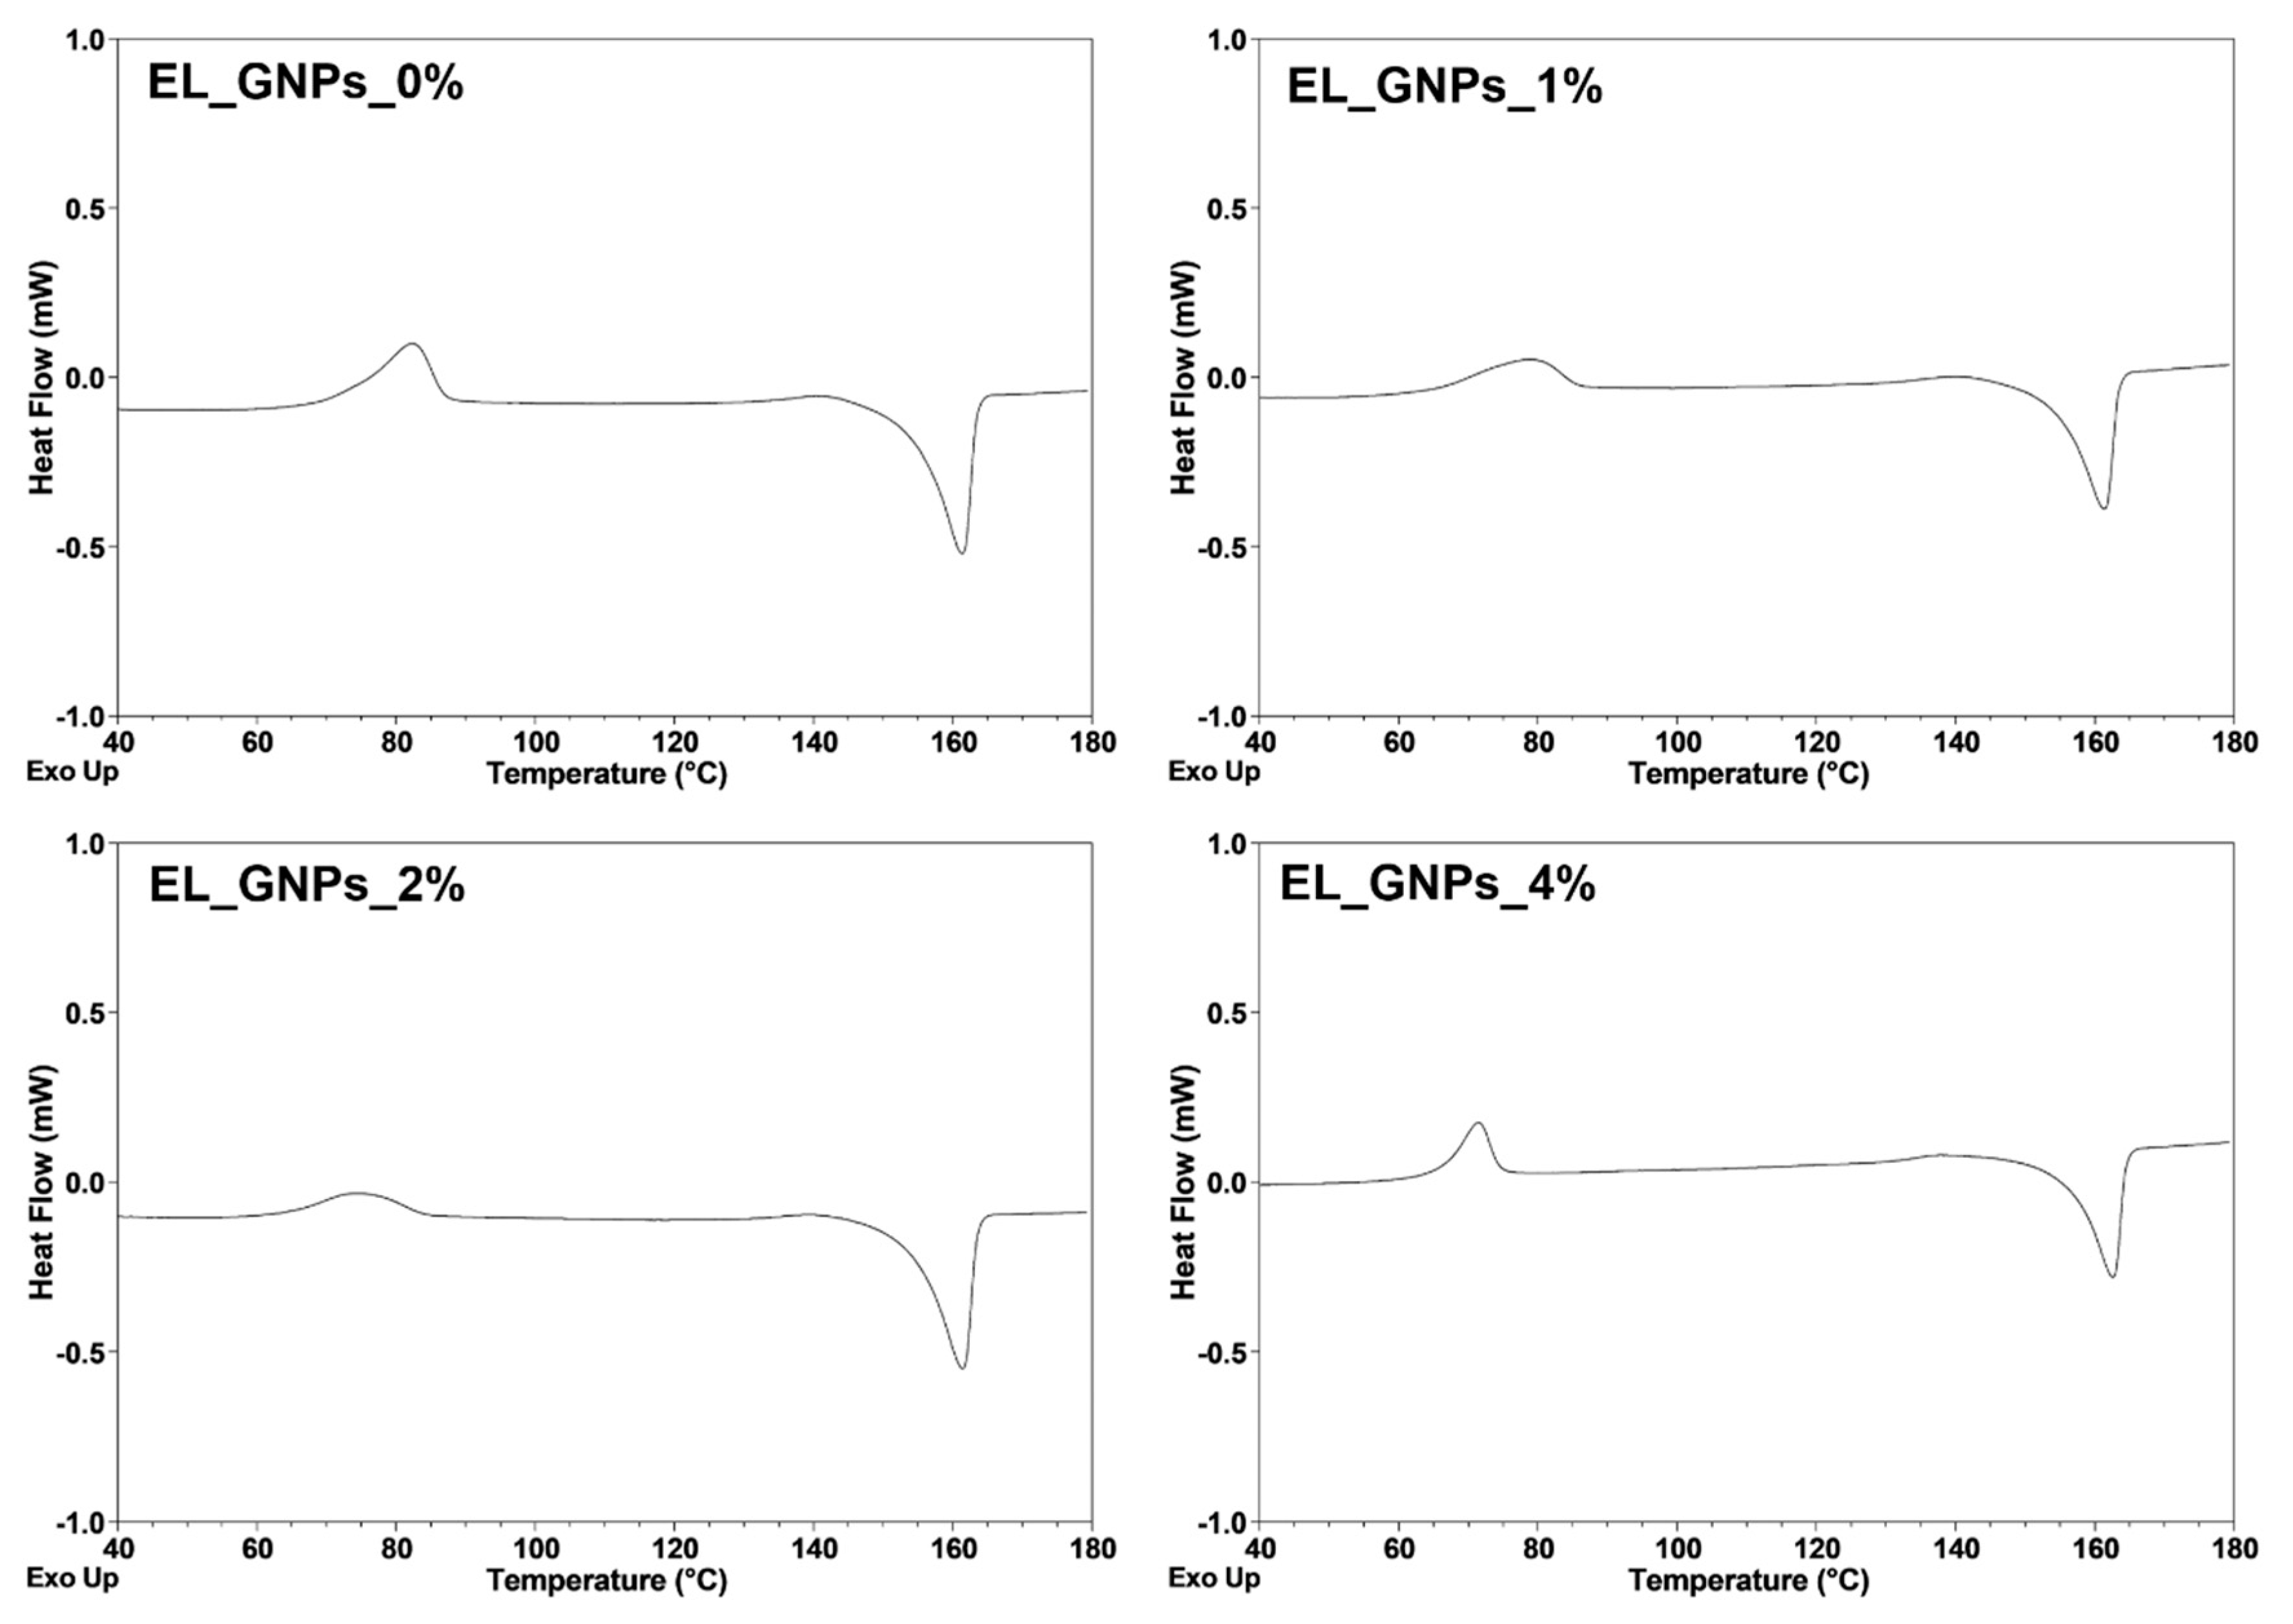
Differential Scanning Calorimetry Analysis
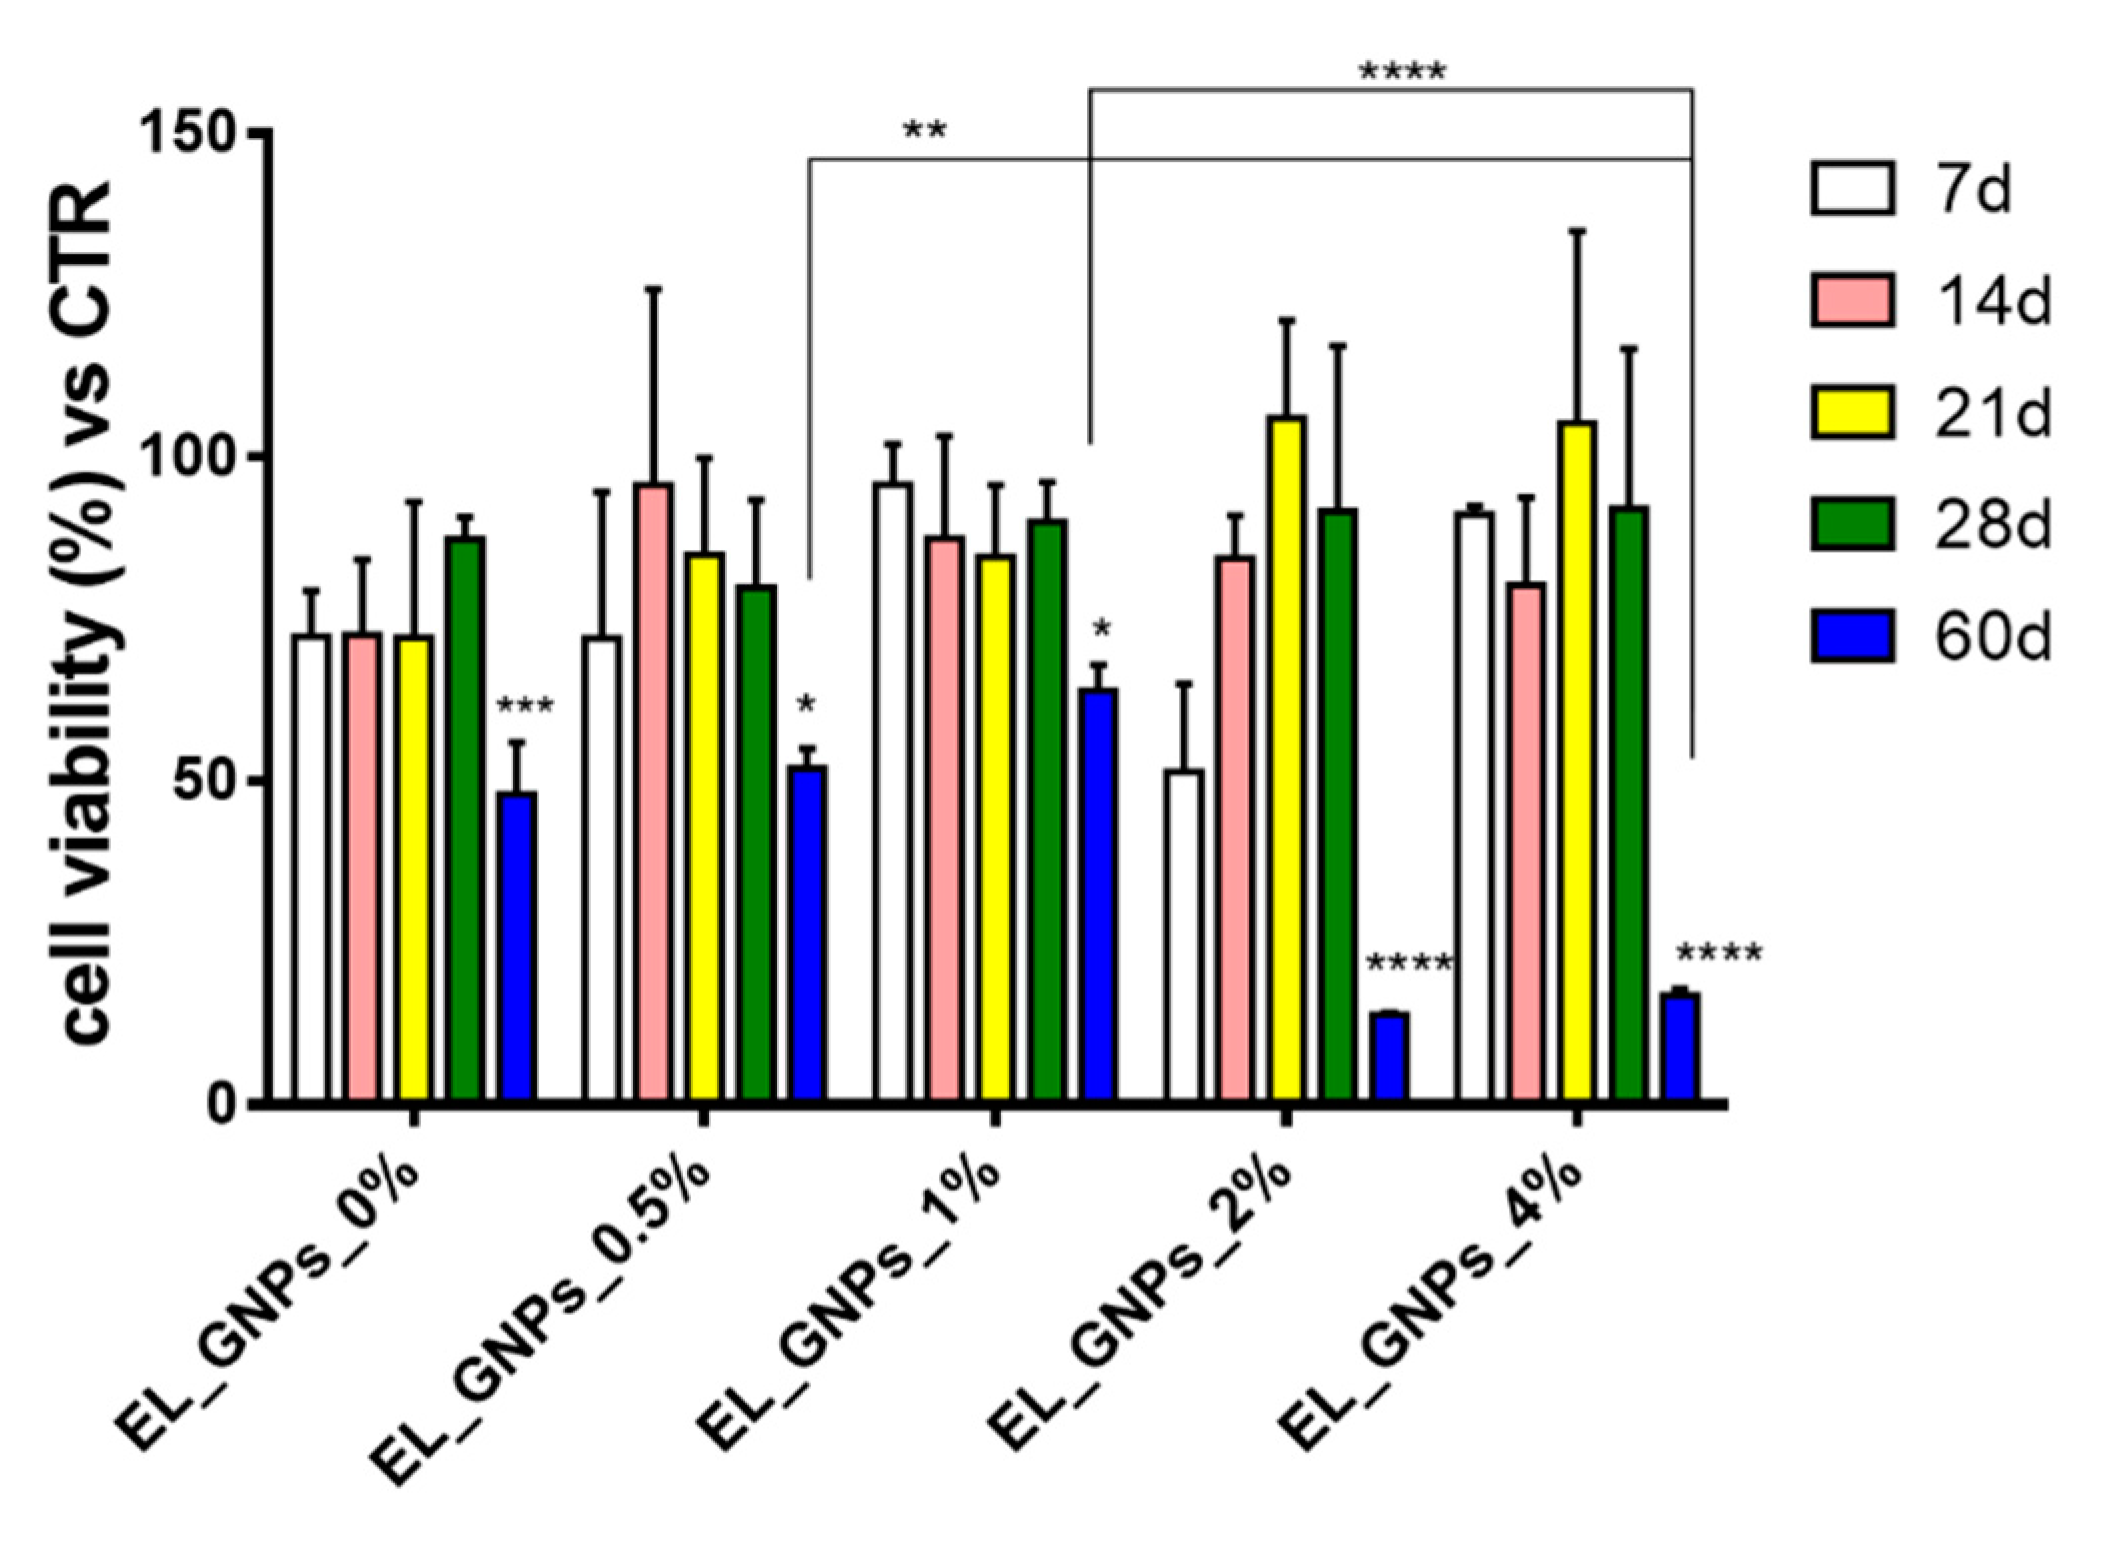
3.3. Biologic Study: Cell Adhesion and Proliferation on Composite Electrospun Matrices
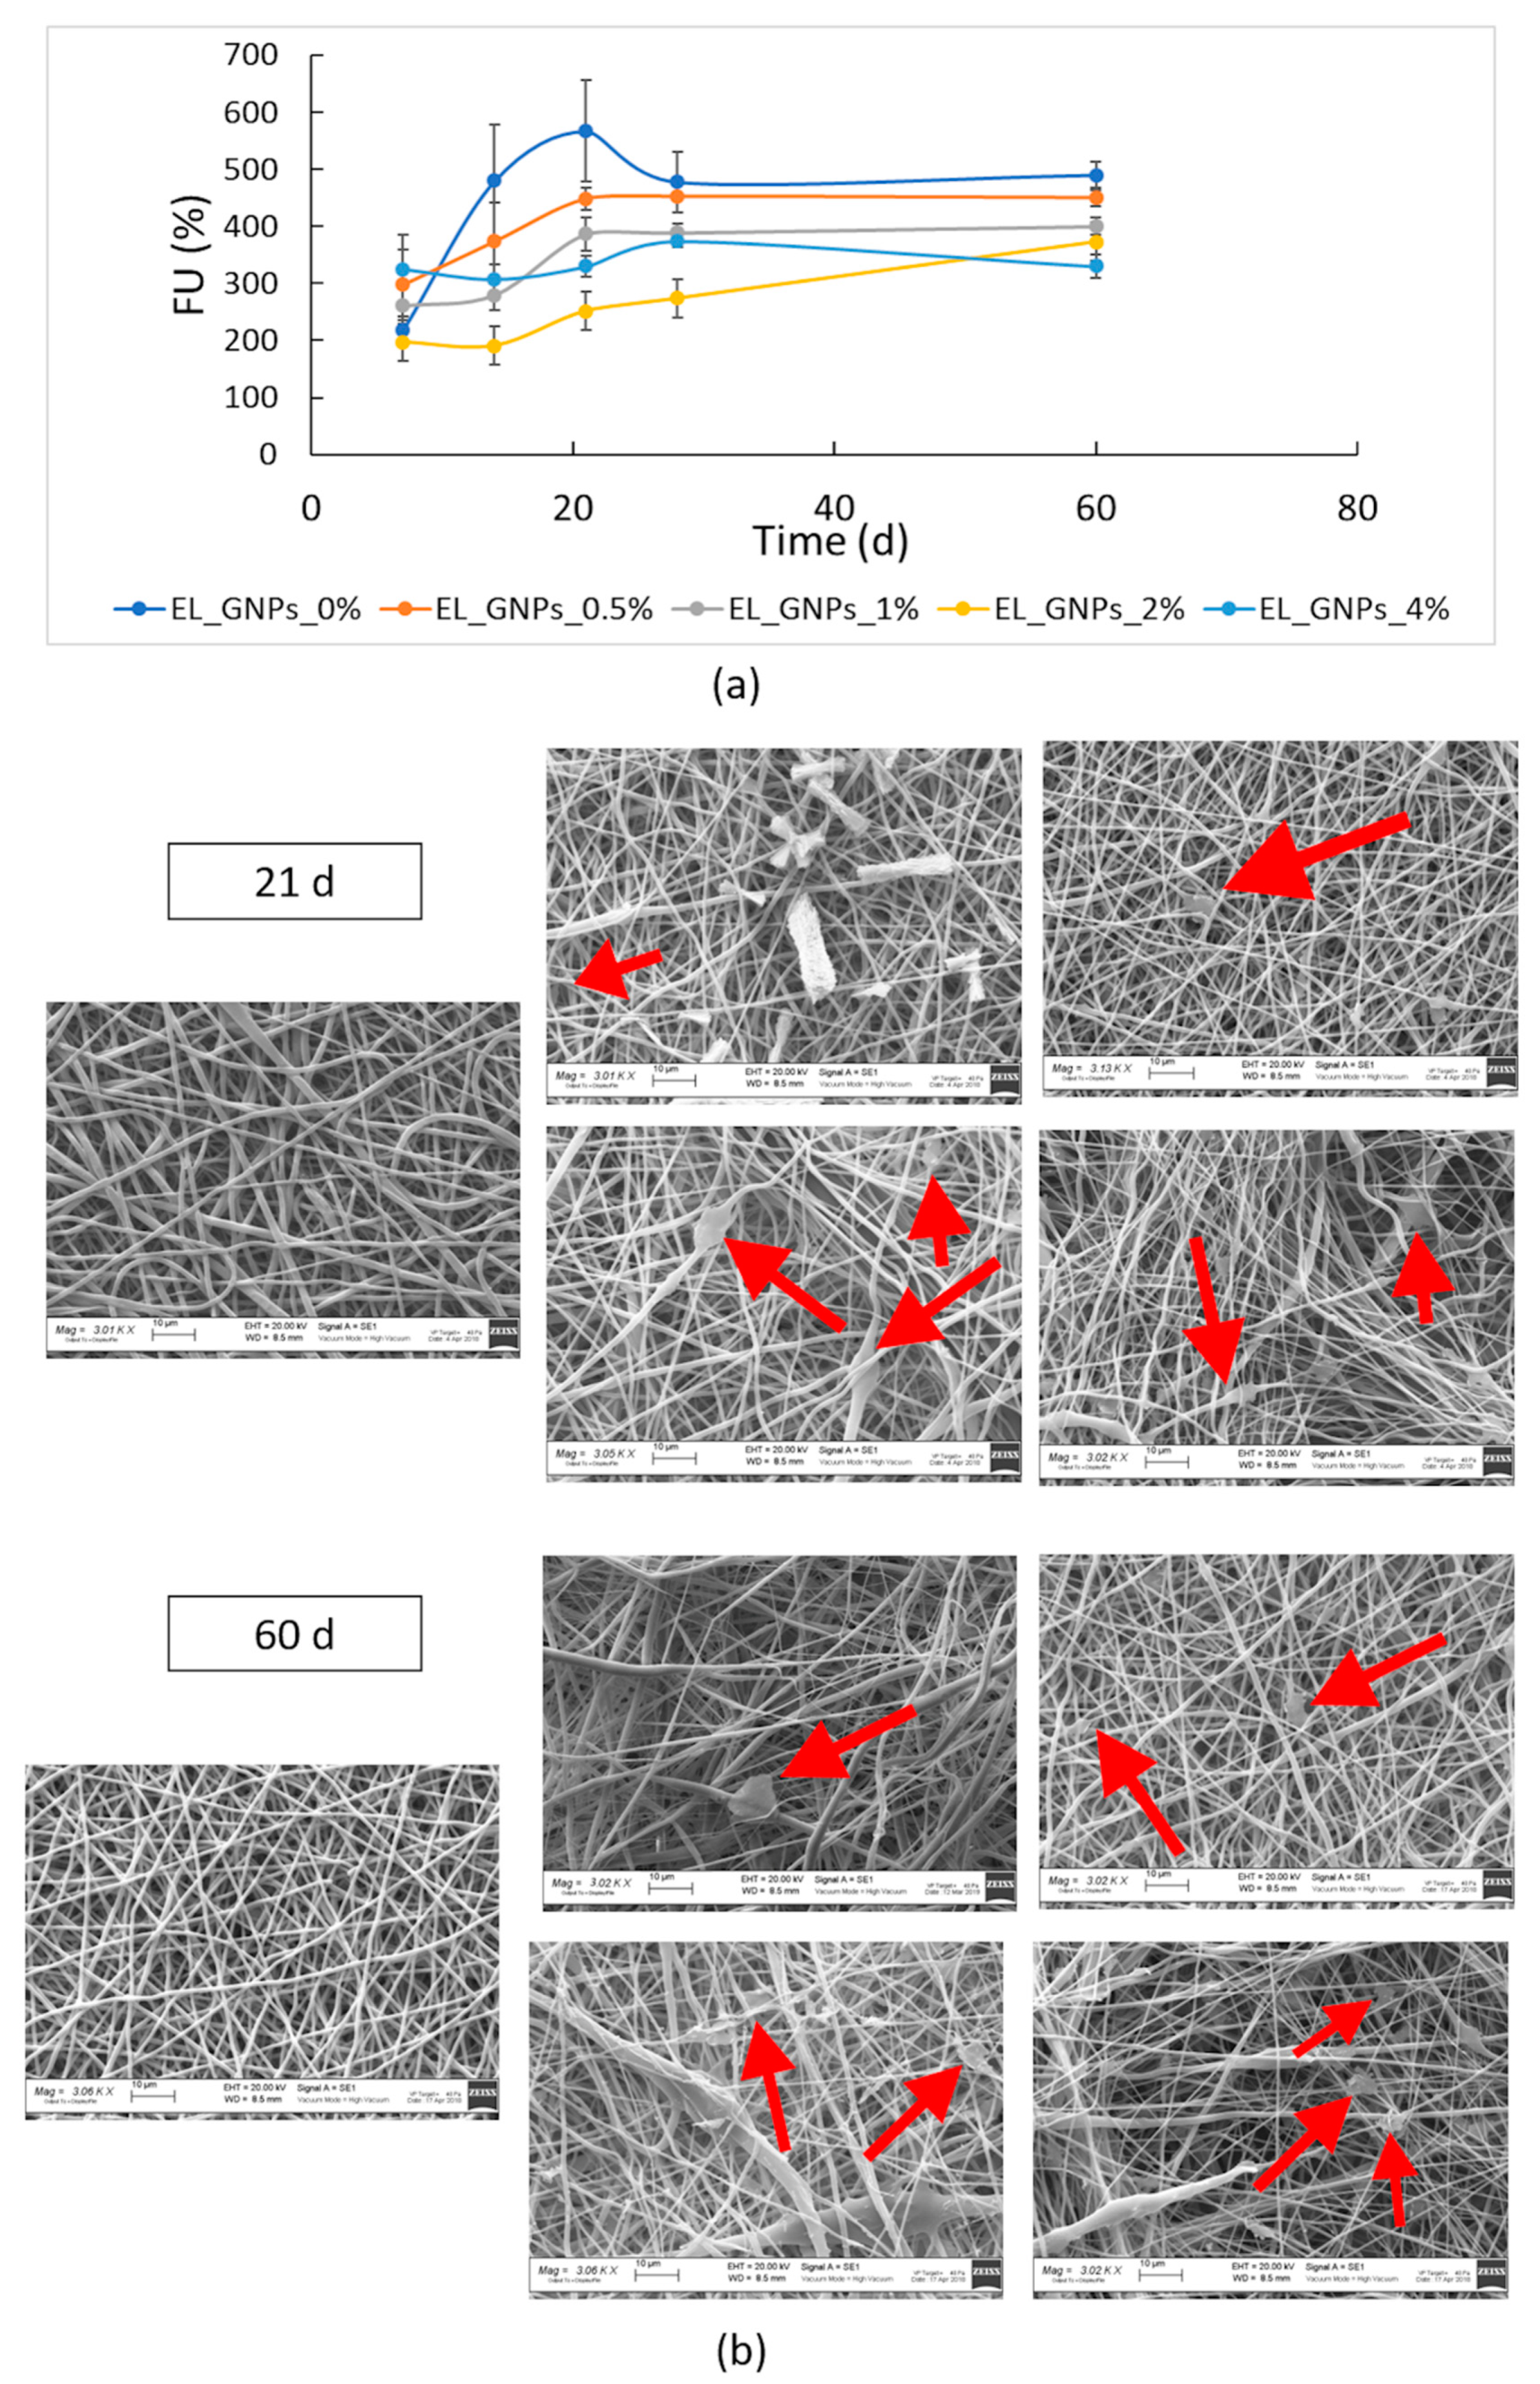
3.4. In Vitro Degradation Study
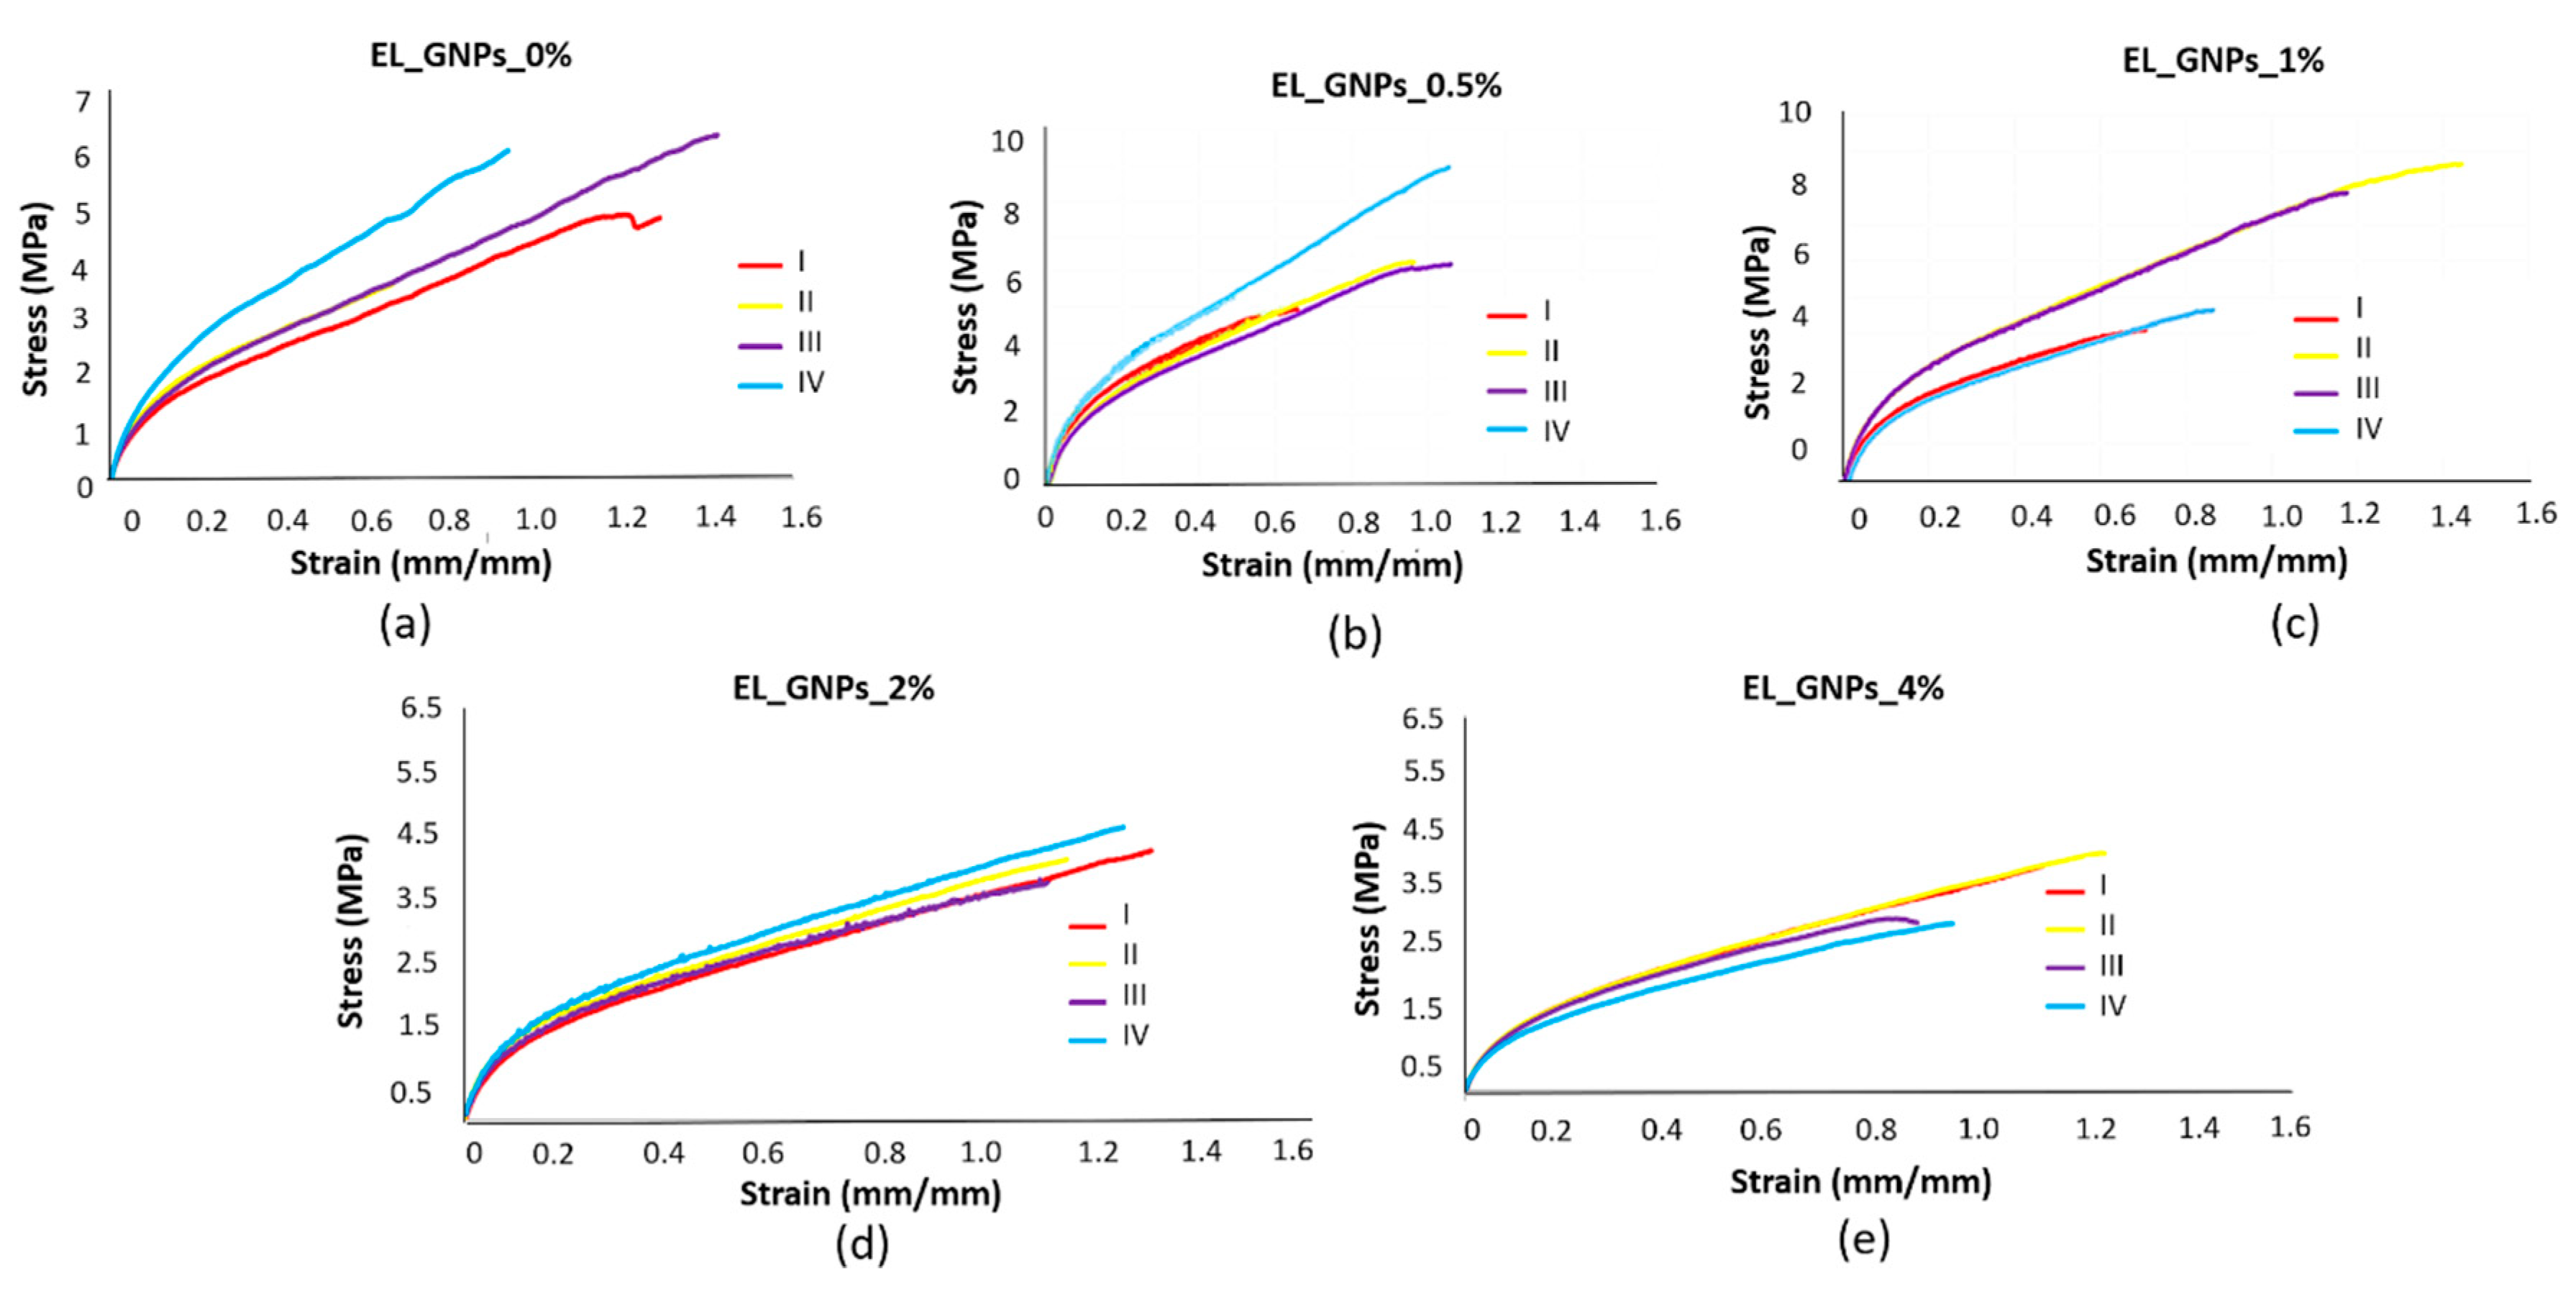
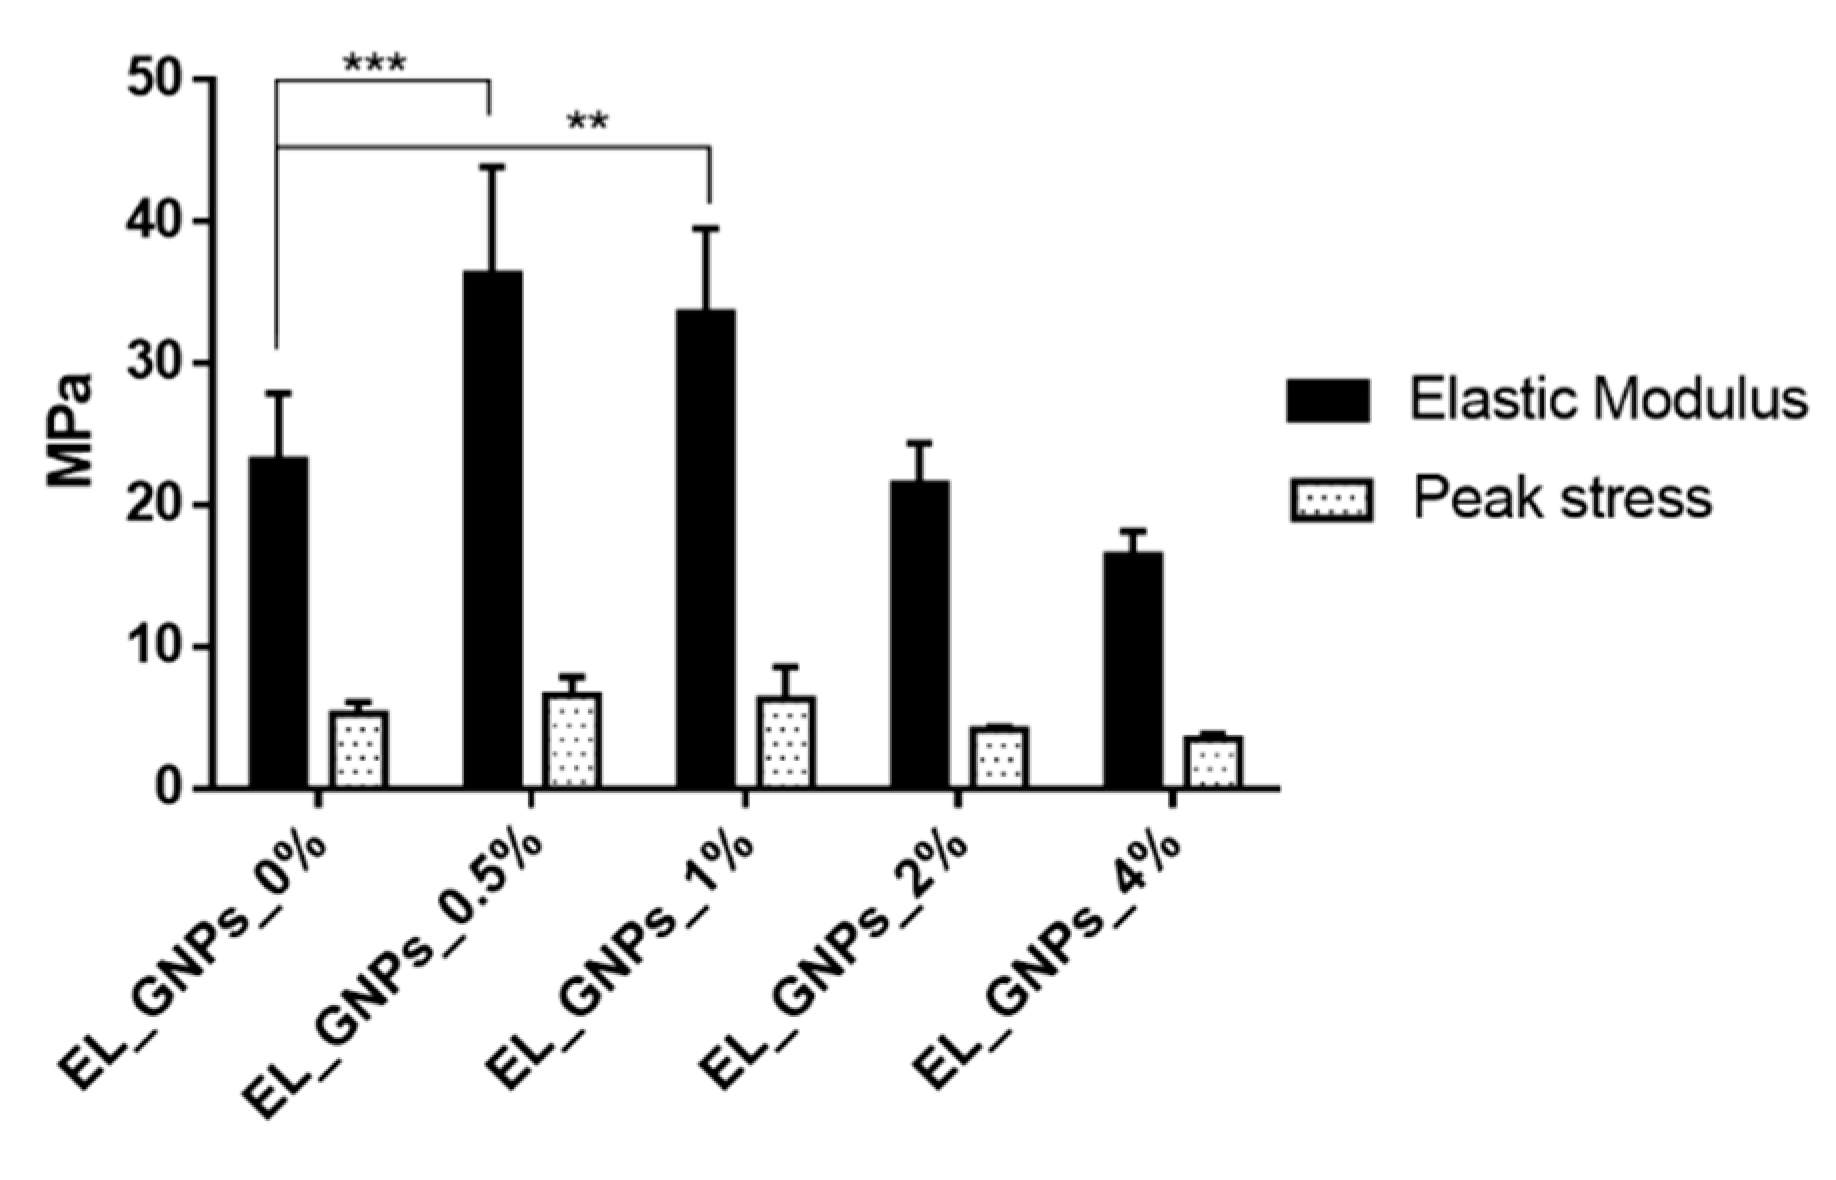
3.5. Mechanical Properties
3.6. Thermal Conductivity
4. Conclusions
Author Contributions
Funding
Acknowledgments
Conflicts of Interest
References
- Xue, J.; Wu, T.; Dai, Y.; Xia, Y. Electrospinning and Electrospun Nanofibers: Methods, Materials, and Applications. Chem. Rev. 2019, 119, 5298–5415. [Google Scholar] [CrossRef]
- Balamurugan, R.; Sundarrajan, S.; Ramakrishna, S. Recent trends in nanofibrous membranes and their suitability for air and water filtrations. Membranes 2011, 1, 232–248. [Google Scholar] [CrossRef]
- Baji, A.; Agarwal, K.; Oopath, S. Emerging Developments in the Use of Electrospun Fibers and Membranes for Protective Clothing Applications. Polymers 2020, 12, 492. [Google Scholar] [CrossRef]
- Schmate, D.; Costa, J.; de Morais, M. A novel nanocomposite for food packaging developed by electrospinning and electrospraying. Food Packag. Shelf Life 2019, 20, 100314. [Google Scholar] [CrossRef]
- Agarwal, S.; Greiner, A.; Wendorff, J. Functional materials by electrospinning of polymers. Prog. Polym. Sci. 2013, 38, 963–991. [Google Scholar] [CrossRef]
- Sapountzi, E.; Braiek, M.; Chateaux, J.; Jaffrezic-Renault, N.; Lagarde, F. Recent Advances in Electrospun Nanofiber Interfaces for Biosensing Devices. Sensors 2017, 17, 1887. [Google Scholar] [CrossRef] [PubMed]
- Pisani, S.; Croce, S.; Chiesa, E.; Dorati, R.; Lenta, E.; Genta, I.; Bruni, G.; Mauramati, S.; Benazzo, A.; Cobianchi, L.; et al. Tissue Engineered Esophageal Patch by Mesenchymal Stromal Cells: Optimization of Electrospun Patch Engineering. Int. J. Mol. Sci. 2020, 21, 1764. [Google Scholar] [CrossRef] [PubMed]
- Jiang, T.; Carbone, E.; Lo, K.; Laurencin, C. Electrospinning of polymer nanofibers for tissue regeneration. Prog. Polym. Sci. 2015, 46, 1–24. [Google Scholar] [CrossRef]
- Ashbaugh, A.; Jiang, X.; Zheng, J.; Tsai, A.; Kim, W.; Thompson, J.; Miller, R.; Shahbazian, J.; Wang, Y.; Dillen, C.; et al. Polymeric nanofiber coating with tunable combinatorial antibiotic delivery prevents biofilm-associated infection in vivo. Proc. Natl. Acad. Sci. USA 2016, 113, E6919–E6928. [Google Scholar] [CrossRef] [PubMed]
- Pisani, S.; Dorati, R.; Chiesa, E.; Genta, I.; Modena, T.; Bruni, G.; Grisoli, P.; Conti, B. Release Profile of Gentamicin Sulfate from Polylactide-. Pharmaceutics 2019, 11, 161. [Google Scholar] [CrossRef]
- Zhu, M.; Xiong, R.; Huang, C. Bio-based and photocrosslinked electrospun antibacterial nanofibrous membranes for air filtration. Carbohydr. Polym. 2019, 205, 55–62. [Google Scholar] [CrossRef] [PubMed]
- Zhang, H.; Hua, D.; Huang, C.; Samal, S.; Xiong, R.; Sauvage, F.; Braeckmans, K.; Remaut, K.; De Smedt, S. Materials and Technologies to Combat Counterfeiting of Pharmaceuticals: Current and Future Problem Tackling. Adv. Mater. 2020, 32. [Google Scholar] [CrossRef] [PubMed]
- Yang, G.; Li, X.; He, Y.; Ma, J.; Ni, G.; Zhou, S. From nano to micro to macro: Electrospun hierarchically structured polymeric fibers for biomedical applications. Prog. Polym. Sci. 2018, 81, 80–113. [Google Scholar] [CrossRef]
- Kishan, A.; Cosgriff-Hernandez, E. Recent advancements in electrospinning design for tissue engineering applications: A review. J. Biomed. Mater. Res. Part A 2017, 105, 2892–2905. [Google Scholar] [CrossRef] [PubMed]
- Manavitehrani, I.; Fathi, A.; Badr, H.; Daly, S.; Shirazi, A.; Dehghani, F. Biomedical Applications of Biodegradable Polyesters. Polymers 2016, 8, 20. [Google Scholar] [CrossRef]
- Seyednejad, H.; Ghassemi, A.; van Nostrum, C.; Vermonden, T.; Hennink, W. Functional aliphatic polyesters for biomedical and pharmaceutical applications. J. Control. Release 2011, 152, 168–176. [Google Scholar] [CrossRef]
- Boland, E.; Pawlowski, K.; Barnes, C.; Simpson, D.; Wnek, G.; Bowlin, G.; Reneker, D.; Fong, H. Electrospinning of bioresorbable polymers for tissue engineering scaffolds. Polym. Nanofibers 2006, 918, 188–204. [Google Scholar]
- Dorati, R.; Colonna, C.; Serra, M.; Genta, I.; Modena, T.; Pavanetto, F.; Perugini, P.; Conti, B. Gamma-irradiation of PEGd,lPLA and PEG-PLGA multiblock copolymers: I. Effect of irradiation doses. AAPS Pharmscitech 2008, 9, 718–725. [Google Scholar] [CrossRef]
- Woodruff, M.; Hutmacher, D. The return of a forgotten polymer-Polycaprolactone in the 21st century. Prog. Polym. Sci. 2010, 35, 1217–1256. [Google Scholar] [CrossRef]
- Dash, T.; Konkimalla, V. Poly-epsilon-caprolactone based formulations for drug delivery and tissue engineering: A review. J. Control. Release 2012, 158, 15–33. [Google Scholar] [CrossRef]
- Gao, S.; Tang, G.; Hua, D.; Xiong, R.; Han, J.; Jiang, S.; Zhang, Q.; Huang, C. Stimuli-responsive bio-based polymeric systems and their applications. J. Mater. Chem. B 2019, 7, 709–729. [Google Scholar] [CrossRef] [PubMed]
- Auras, R.; Harte, B.; Selke, S. An overview of polylactides as packaging materials. Macromol. Biosci. 2004, 4, 835–864. [Google Scholar] [CrossRef] [PubMed]
- Cipitria, A.; Skelton, A.; Dargaville, T.; Dalton, P.; Hutmacher, D. Design, fabrication and characterization of PCL electrospun scaffolds-a review. J. Mater. Chem. 2011, 21, 9419–9453. [Google Scholar] [CrossRef]
- Herrero-Herrero, M.; Gomez-Tejedor, J.; Valles-Lluch, A. PLA/PCL electrospun membranes of tailored fibres diameter as drug delivery systems. Eur. Polym. J. 2018, 99, 445–455. [Google Scholar] [CrossRef]
- Yao, Q.; Cosme, J.; Xu, T.; Miszuk, J.; Picciani, P.; Fong, H.; Sun, H. Three dimensional electrospun PCL/PLA blend nanofibrous scaffolds with significantly improved stem cells osteogenic differentiation and cranial bone formation. Biomaterials 2017, 115, 115–127. [Google Scholar] [CrossRef] [PubMed]
- Fortelny, I.; Ujcic, A.; Fambri, L.; Slouf, M. Phase Structure, Compatibility, and Toughness of PLA/PCL Blends: A Review. Front. Mater. 2019, 6, 206. [Google Scholar] [CrossRef]
- Chung, C.; Kim, Y.K.; Shin, D.; Ryoo, S.R.; Hong, B.H.; Min, D.H. Biomedical applications of graphene and graphene oxide. Acc. Chem. Res. 2013, 46, 2211–2224. [Google Scholar] [CrossRef]
- Bayer, I. Thermomechanical Properties of Polylactic Acid-Graphene Composites: A State-of-the-Art Review for Biomedical Applications. Materials 2017, 10, 748. [Google Scholar] [CrossRef]
- Wan, C.; Chen, B. Poly(epsilon-caprolactone)/graphene oxide biocomposites: Mechanical properties and bioactivity. Biomed. Mater. 2011, 6, 055010. [Google Scholar] [CrossRef]
- Wu, D.; Samanta, A.; Srivastava, R.; Hakkarainen, M. Nano-Graphene Oxide Functionalized Bioactive Poly(lactic acid) and Poly(epsilon-caprolactone) Nanofibrous Scaffolds. Materials 2018, 11, 566. [Google Scholar] [CrossRef]
- Kenry; Lee, W.C.; Loh, K.P.; Lim, C.T. When stem cells meet graphene: Opportunities and challenges in regenerative medicine. Biomaterials 2018, 155, 236–250. [Google Scholar] [CrossRef] [PubMed]
- Kelnar, I.; Zhigunov, A.; Kapralkova, L.; Fortelny, I.; Dybal, J.; Kratochvil, J.; Nevoralova, M.; Hricova, M.; Ithunova, V. Facile preparation of biocompatible poly (lactic acid)-reinforced poly(epsilon-caprolactone) fibers via graphite nanoplatelets -aided melt spinning. J. Mech. Behav. Biomed. Mater. 2018, 84, 108–115. [Google Scholar] [CrossRef] [PubMed]
- Zhao, X.; Luo, J.; Fang, C.; Xiong, J. Investigation of polylactide/poly(epsilon-caprolactone)/multi-walled carbon nanotubes electrospun nanofibers with surface texture. RSC Adv. 2015, 5, 99179–99187. [Google Scholar] [CrossRef]
- Wang, X.; Gao, Y.; Li, X.; Xu, Y.; Jiang, J.; Hou, J.; Li, Q.; Turng, L. Selective localization of graphene oxide in electrospun polylactic acid/poly(epsilon-caprolactone) blended nanofibers. Polym. Test. 2017, 59, 396–403. [Google Scholar] [CrossRef]
- Pisani, S.; Dorati, R.; Conti, B.; Modena, T.; Bruni, G.; Genta, I. Design of copolymer PLA-PCL electrospun matrix for biomedical applications. React. Funct. Polym. 2018, 124, 77–89. [Google Scholar] [CrossRef]
- Cesareo, G.; Parrini, M.R.; Rizzi, L.G. Continuous Process For Preparing Pristine Graphene Nanoplatelets. WO 2015/193267, EP063397, 23 December 2015. [Google Scholar]
- Dorati, R.; Pisani, S.; Maffeis, G.; Conti, B.; Modena, T.; Chiesa, E.; Bruni, G.; Musazzi, U.; Genta, I. Study on hydrophilicity and degradability of chitosan/polylactide-co-polycaprolactone nanofibre blend electrospun membrane. Carbohydr. Polym. 2018, 199, 150–160. [Google Scholar] [CrossRef]
- Pakravan, M.; Heuzey, M.; Ajji, A. A fundamental study of chitosan/PEO electrospinning. Polymer 2011, 52, 4813–4824. [Google Scholar] [CrossRef]
- Kolbuk, D.; Guimond-Lischer, S.; Sajkiewicz, P.; Maniura-Weber, K.; Fortunato, G. The Effect of Selected Electrospinning Parameters on Molecular Structure of Polycaprolactone Nanofibers. Int. J. Polym. Mater. Polym. Biomater. 2015, 64, 365–377. [Google Scholar] [CrossRef]
- Lu, C.; Chen, P.; Li, J.; Zhang, Y. Computer simulation of electrospinning. Part I. Effect of solvent in electrospinning. Polymer 2006, 47, 915–921. [Google Scholar] [CrossRef]
- Reneker, D.; Yarin, A. Electrospinning jets and polymer nanofibers. Polymer 2008, 49, 2387–2425. [Google Scholar] [CrossRef]
- Matsumoto, H.; Imaizumi, S.; Konosu, Y.; Ashizawa, M.; Minagawa, M.; Tanioka, A.; Lu, W.; Tour, J.M. Electrospun composite nanofiber yarns containing oriented graphene nanoribbons. ACS Appl. Mater. Interfaces 2013, 5, 6225–6231. [Google Scholar] [CrossRef] [PubMed]
- Wu, D.; Cheng, Y.; Feng, S.; Yao, Z.; Zhang, M. Crystallization Behavior of Polylactide/Graphene Composites. Ind. Eng. Chem. Res. 2013, 52, 6731–6739. [Google Scholar] [CrossRef]
- Fernandez, J.; Larranaga, A.; Etxeberria, A.; Sarasua, J. Effects of chain microstructures and derived crystallization capability on hydrolytic degradation of poly(L-lactide/epsilon-caprolactone) copolymers. Polym. Degrad. Stab. 2013, 98, 481–489. [Google Scholar] [CrossRef]
- Wu, L.; Ding, J. Effects of porosity and pore size on in vitro degradation of three-dimensional porous poly(D,L-lactide-co-glycolide) scaffolds for tissue engineering. J. Biomed. Mater. Res. Part A 2005, 75A, 767–777. [Google Scholar] [CrossRef]
- Taylor, L.; Curthoys, N. Glutamine metabolism - Role in acid-base balance. Biochem. Mol. Biol. Educ. 2004, 32, 291–304. [Google Scholar] [CrossRef]
- Vriezen, N.; Romein, B.; Luyben, K.; vanDijken, J. Effects of glutamine supply on growth and metabolism of mammalian cells in chemostat culture. Biotechnol. Bioeng. 1997, 54, 272–286. [Google Scholar] [CrossRef]
- Huang, J.; Zhu, Y.; Xu, L.; Chen, J.; Jiang, W.; Nie, X. Massive enhancement in the thermal conductivity of polymer composites by trapping graphene at the interface of a polymer blend. Compos. Sci. Technol. 2016, 129, 160–165. [Google Scholar] [CrossRef]
- Spinelli, G.; Lamberti, P.; Tucci, V.; Kotsilkova, R.; Ivanov, E.; Menseidov, D.; Naddeo, C.; Romano, V.; Guadagno, L.; Adami, R.; et al. Nanocarbon/Poly(Lactic) Acid for 3D Printing: Effect of Fillers Content on Electromagnetic and Thermal Properties. Materials 2019, 12, 2369. [Google Scholar] [CrossRef]


| Mats Code | GNPs Content (wt %) | Specimens |
|---|---|---|
| EL_GNPs_0% | - |  |
| EL_GNPs_0.5% | 0.5 |  |
| EL_GNPs_1% | 1 |  |
| EL_GNPs_2% | 2 |  |
| EL_GNPs_4% | 4 |  |
| Samples | Tcc (°C) | Tm (°C) | ΔHcc (J/g) | ΔHm (J/g) |
|---|---|---|---|---|
| EL_GNP_0% | 66.24 ± 0.33 | 156.20 ± 0.29 | 9.00 ± 0.47 | 26.13 ± 1.13 |
| EL_GNP_1% | 72.53 ± 0.40 | 154.27 ± 0.11 | 11.98 ± 0.56 | 22.14 ± 1.01 |
| EL_GNP_2% | 64.79 ± 0.31 | 154.16 ± 0.35 | 9.50 ± 0.51 | 22.48 ± 0.89 |
| EL_GNP_4% | 63.69 ± 0.60 | 154.33 ± 0.16 | 6.32 ± 0.44 | 21.28 ± 0.79 |
| Samples | KMw | t1/2 (days) | R2 |
|---|---|---|---|
| EL_GNPs_0% | 0.0116 | 59.75 | 0.92 |
| EL_GNPs_0.5% | 0.0105 | 66.01 | 0.95 |
| EL_GNPs_1% | 0.0101 | 68.62 | 0.94 |
| EL_GNPs_2% | 0.0090 | 77.02 | 0.94 |
| EL_GNPs_4% | 0.0089 | 77.88 | 0.95 |
| Samples | Incubation Time | ||||
|---|---|---|---|---|---|
| 7 d | 14 d | 21 d | 28 d | 60 d | |
| EL_GNP_0% | 8.15 ± 0.03 | 8.18 ± 0.02 | 8.27 ± 0.02 | 8.21± 0.07 | 8.29 ± 0.03 |
| EL_GNP_0.5% | 8.04 ± 0.05 | 8.01 ± 0.01 | 8.30 ± 0.10 | 8.06 ± 0.06 | 8.31 ± 0.10 |
| EL_GNP_1% | 8.01 ± 0.02 | 8.04 ± 0.01 | 8.26 ± 0.04 | 8.05 ± 0.03 | 8.20 ± 0.03 |
| EL_GNP_2% | 8.09 ± 0.01 | 8.11 ± 0.07 | 8.36 ± 0.05 | 8.12 ± 0.04 | 8.37 ± 0.02 |
| EL_GNP4% | 8.07 ± 0.02 | 8.07 ± 0.04 | 8.30 ± 0.03 | 8.12 ± 0.07 | 8.41 ± 0.05 |
© 2020 by the authors. Licensee MDPI, Basel, Switzerland. This article is an open access article distributed under the terms and conditions of the Creative Commons Attribution (CC BY) license (http://creativecommons.org/licenses/by/4.0/).
Share and Cite
Chiesa, E.; Dorati, R.; Pisani, S.; Bruni, G.; Rizzi, L.G.; Conti, B.; Modena, T.; Genta, I. Graphene Nanoplatelets for the Development of Reinforced PLA–PCL Electrospun Fibers as the Next-Generation of Biomedical Mats. Polymers 2020, 12, 1390. https://doi.org/10.3390/polym12061390
Chiesa E, Dorati R, Pisani S, Bruni G, Rizzi LG, Conti B, Modena T, Genta I. Graphene Nanoplatelets for the Development of Reinforced PLA–PCL Electrospun Fibers as the Next-Generation of Biomedical Mats. Polymers. 2020; 12(6):1390. https://doi.org/10.3390/polym12061390
Chicago/Turabian StyleChiesa, Enrica, Rossella Dorati, Silvia Pisani, Giovanna Bruni, Laura G. Rizzi, Bice Conti, Tiziana Modena, and Ida Genta. 2020. "Graphene Nanoplatelets for the Development of Reinforced PLA–PCL Electrospun Fibers as the Next-Generation of Biomedical Mats" Polymers 12, no. 6: 1390. https://doi.org/10.3390/polym12061390
APA StyleChiesa, E., Dorati, R., Pisani, S., Bruni, G., Rizzi, L. G., Conti, B., Modena, T., & Genta, I. (2020). Graphene Nanoplatelets for the Development of Reinforced PLA–PCL Electrospun Fibers as the Next-Generation of Biomedical Mats. Polymers, 12(6), 1390. https://doi.org/10.3390/polym12061390