Article

Validation of a Novel Potentiometric Method Based on a Polymeric PVC Membrane Sensor Integrated with Tailored Receptors for the Antileukemia Drug Cytarabine

by
Ayman H. Kamel
1,
Abd El-Galil E. Amr
2,3,*,
Nashwa H. Ashmawy
1,
Hoda R. Galal
4,
Abdulrahman A. Almehizia
2,
Teraze A. Youssef
1,
Mohamed A. Al-Omar
2 and
Ahmed Y. A. Sayed
2
1
Chemistry Department, Faculty of Science, Ain Shams University, P.O. Cairo 11566, Egypt
2
Pharmaceutical Chemistry Department, Drug Exploration & Development Chair (DEDC), College of Pharmacy, King Saud University, Riyadh 11451, Saudi Arabia
3
Applied Organic Chemistry Department, National Research Center, Dokki, Giza 12622, Egypt
4
Inorganic Chemistry Department, National Research Center, Dokki, Giza 12622, Egypt
*
Author to whom correspondence should be addressed.
Polymers 2020, 12(6), 1343; https://doi.org/10.3390/polym12061343
Submission received: 19 May 2020 / Revised: 6 June 2020 / Accepted: 11 June 2020 / Published: 14 June 2020
(This article belongs to the Section Polymer Applications)

Abstract

:
A simple, rapid and easy method is proposed for the detection of a cytostatic therapeutic drug, cytarabine, in real samples. The method is based on potentiometric transduction using prepared and characterized new ion-selective electrodes for cytarabine. The electrodes were integrated with novel man-tailored imprinted polymers and used as a sensory element for recognition. The electrodes revealed a remarkable potentiometric response for cytarabine over the linearity range 1.0 × 10⁻⁶–1.0 × 10⁻³ M at pH 2.8–4 with a detection limit of 5.5 × 10⁻⁷ M. The potentiometric response was near-Nernstian, with average slopes of 52.3 ± 1.2 mV/decade. The effect of lipophilic salts and plasticizer types on the potentiometric response was also examined. The electrodes exhibited an enhanced selectivity towards cytarabine over various foreign common ions. Validation and verification of the presented assay method are demonstrated by evaluating the method ruggedness and calculating the detection limit, range of linearity, accuracy (trueness), precision, repeatability (within-day) and reproducibility (between-days). The proposed ion-selective electrodes revealed good performance characteristics and possible application of these electrodes for cytarabine monitoring in different matrices. The electrodes are successfully applied to cytarabine determination in spiked biological fluid samples and in pharmaceutical formulations.

1. Introduction

Cytarabine, or cytosine arabinoside, is a pyrimidine nucleoside antimetabolite that is cytotoxic to a number of cell types. It is widely used for the treatment of acute leucosis, lymphoglanulomatosis, malignant lymphomas, etc. [1,2]. Cytarabine is considered as the main drug used in the treatment of acute leukemia, especially acute non-lymphocytic leukemia, when it is most often taken in combination with thioguanine and anthracycline. It is also given in the treatment of chronic myeloid leukemia and lymphoma, and it has been tried in the treatment of myeloma [3]. The quality of cytarabine preparations can be checked using different methods, including titrimetry [4], UV spectrometry [5,6,7], chemiluminescence [8], polarography [9,10,11,12,13,14], voltammetry [15], high performance liquid chromatography (HPLC) [16,17,18,19,20,21,22,23,24,25,26], gas chromatography (GC)/mass spectrometry [27,28,29], micellar electrokinetic capillary chromatography [30,31] and radioimmune assaying [32,33,34,35,36,37,38,39]. However, most of these methods are considered to have a high cost of use and suffer from limited selectivity and require careful control, whether in reaction conditions or even derivative reactions. These methods also require time-consuming treatment steps, which affect their usefulness for routine analysis. From all of the above, it is recommended to apply potentiometric sensors in the field of pharmaceutical analysis and biomedicine [40,41,42,43,44,45]. These sensors, based on potentiometric transduction, have many advantages, such as providing easy, simple, fast and selective technology to determine the number of different drugs in complex matrices [46,47,48,49,50]. However, with regard to the available literature, no one uses this technique for cytarabine quantification.
Integration of molecularly imprinted polymers (MIPs) in sensing technology enhances the performance of their use. These synthetic receptors have become a very important part in preparing synthetic and strong identification materials. They bring several advantages when coupled in potentiometric electrodes, especially in pharmaceutical analysis. They also offer enhanced selectivity for analytes (drugs) in different pharmaceutical or biological matrices when integrated with potentiometric devices [42,43,44,45,46,47,48,49].
In this work, the preparation, characterization and application of polymeric membrane sensors are presented on the basis of the use of cytarabine biomimetic receptors. The receptors were prepared by imprinting the template cytarabine with methacrylic acid (MAA) and ethylene glycol dimethacrylate (EGDMA) as a functional monomer and ethylene as a crosslinker, respectively. The MIPs were dispersed in a plasticized poly(vinyl chloride) (PVC) matrix membrane. The performance and selectivity characteristics of the proposed ion-selective electrodes (ISEs) were evaluated. Validation of the proposed method was evaluated in terms of linearity, detection limit, trueness, precision, accuracy, within-day repeatability and method ruggedness. The ISEs were successfully applied for cytarabine determination in spiked human serum samples and in pharmaceutical formulations.

2. Materials and Methods

2.1. Apparatus and Materials

All potentiometric measurements were measured and recorded at 25 ± 1 °C with an Orion 720/SA pH/mV meter (Cambridge, MA, USA). The measured potential was performed by immersing the proposed cytarabine electrode with an Ag/AgCl double-junction reference electrode (Orion, model 90-02) filled with a CH3COOLi reference electrode in stirred solutions. All experiments were performed with at least three electrodes. A glass electrode (Ross, Orion 81-02) was used for all subsequent pH measurements. All liquid chromatographic measurements were carried out using high-performance liquid chromatography (HPLC) coupled with a UV/VIS detector (Series 200 Pump, PerkinElmer, Waltham, MA, USA). For surface morphology measurements, scanning electron microscopy (SEM) (JOEL, Osaka, Japan) was used.
Cytosine β-D-arabinofuranoside hydrochloride (cytarabine), methacrylic acid (MAA) (functional monomer), potassium tetrakis (3,5-bis (trifluoromethyl) phenyl) borate (KTFPB) and acetonitrile were purchased from Sigma-Aldrich Inc. (St. Louis, MO, USA). Poly(vinyl chloride) (PVC) (polymeric matrix), ethylene glycol dimethacrylate (EGDMA) (crosslinker), benzoyl peroxide (BPO) (initiator), dioctyl phthalate (DOP), o-nitrophenyl octyl phthalate (o-NPOE), dibutyl sebacate (DBS) and tetrahydrofuran (THF) were obtained from Fluka AG (Buchs, Switzerland).
A 10−3-M cytarabine hydrochloride stock solution was prepared after dissolving 0.0243 g pure cytarabine hydrochloride in 100 mL distilled water. The pH of the solution was adjusted to pH 3.5 using a 30-mM phosphate buffer. Working cytarabine solutions (10−3–10−7 M) were prepared after appropriate dilution of the stock solution, and the pH of each working standard solution was adjusted to pH 3.5 using a 30-mM phosphate solution. The activity coefficients of all cytarabine solutions were calculated using the well-known approximation presented by Debye–Huckel.

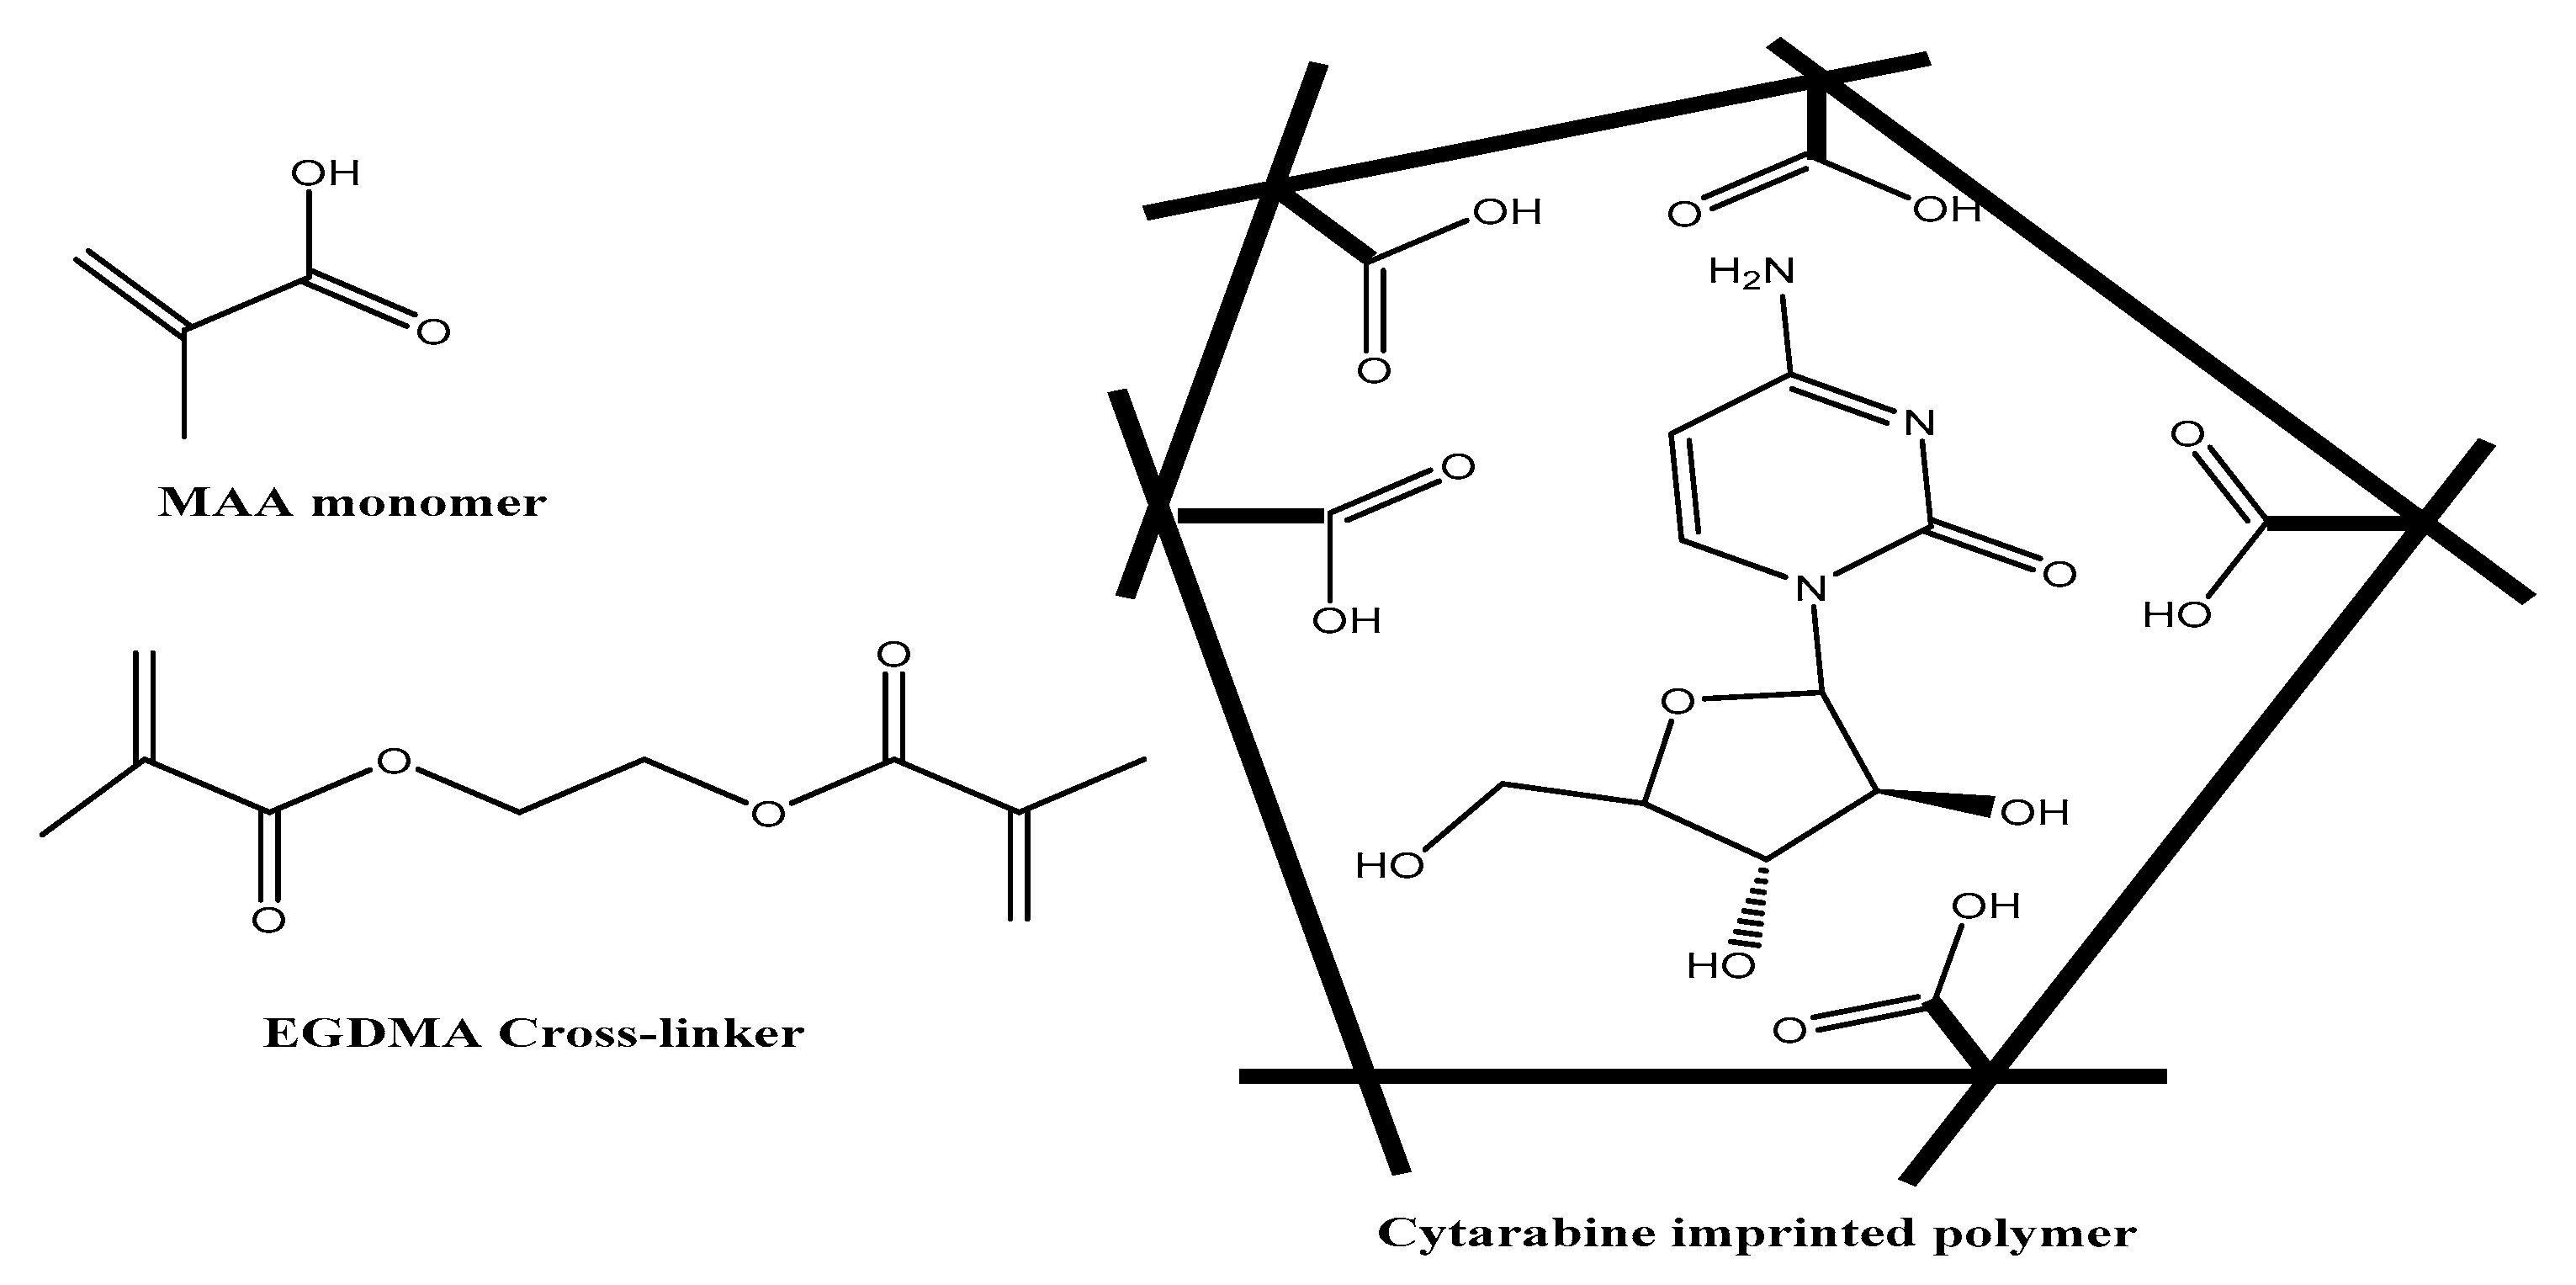
2.2. Synthesis of the Main-Tailored Receptors

The artificial imprinted microbeads (MIPs) were tailored and designed for cytarabine using the thermal precipitation polymerization method. Prior polymerization, template cytarabine (0.5 mmol), MAA (1.5 mmol), EGDMA (1.5 mmol), acetonitrile (10 mL) and BPO (50.0 mg) were mixed together in a 25-mL glass-capped bottle and left for 1 h. For solution homogenization, the mixture was sonicated for 15 min. Dry N2 flow was passed in the solution for 15 min to get rid of the dissolved O2 in the solution. The reaction mixture was closed and maintained in an oil bath at 70 °C for 18 h for complete polymerization. The resulting MIP beads were washed with methanolic solution to remove all un-reacted species. For complete removal of the template from the MIP beads, Soxhlet extraction was carried out using acetic acid/methanol (2:8, v/v). Spectrophotometric measurements were carried out until the absorbance of cytarabine at 277.5 nm was no longer detected in the eluate [51]. The obtained polymers were left for complete dryness at ambient temperature. The non-imprinted polymers (NIPs) were also synthesized in absence of the template under the same conditions used for preparing the MIPs.

2.3. Binding Experiments

To examine the binding affinity of the prepared imprinted receptors towards cytarabine, binding experiments were carried out using Scatchard analysis. An amount of 20.0 mg of either MIP or NIP beads was mixed with 5.0 mL of cytarabine solution at different concentrations (0.02–1 mM) in a 10 mL conical flask. Shaking the polymeric beads in contact with the solution was carried out overnight at room temperature. The solution was centrifuged for 10 min to separate the polymeric beads from the supernatant. The free cytarabine concentration was detected spectrometrically at 277.5 nm. The data obtained were utilized for binding isotherms analysis.

2.4. Sensor Fabrication

An amount of 8.8 mg of either the MIP or NIP beads, 66.5 mg of PVC, 127 mg of the plasticizer (o-NPOE) and 2.2 mg of potassium tetrakis (3,5-bis (trifluoromethyl) phenyl) borate (KTFPB) were thoroughly mixed in a 3-cm diameter petri-dish and dissolved in 3 mL THF. The solvent was left to evaporate slowly at ambient temperature. The formed plastic membrane was sectioned with a cork borer (10 mm diameter) and glued to a PVC tube (~3 cm length, 8 mm i.d.) using THF. The body of the electrode consisted of a plastic tube attached to the PVC tube. This plastic tube was filled with an internal filling solution consisting of 10−3 M cytarabine hydrochloride solution.
Calibration of the proposed ISEs was carried out after transferring 1.0 mL aliquots of 10−3 to 10−6 M aqueous cytarabine hydrochloride solution to a 25-mL beaker, containing 9.0 mL 30 mM acetate solution (pH 3.5), followed by inserting both the cytarabine-PVC membrane sensor and the reference electrode. The obtained potential readings were plotted versus log (cytarabine) concentrations. The constructed calibration plots were used for all subsequent quantifications of unknown cytarabine concentrations.

2.5. Cytarabine Assessment in Pharmaceutical Dosages

Cytarabine was determined using the proposed ISEs in different commercially available drugs: aracytin (100 mg/5 mL, Pharmacia, Egypt), tabine (1000 mg/10 mL, Hikma Pharmaceuticals, Cairo, Egypt) and cytarabine (100 mg/mL, Ramco, Cairo, Egypt). One milliliter from each sample was placed into a 50-mL measuring flask and then completed to the mark with a 30-mM phosphate buffer solution at pH 3.0. The potential readings were recorded for each solution and then compared with the constructed calibration curve for the standard solutions of the pure drug under similar conditions.

2.6. Determination of Cytarabine in Spiked Human Serum

The applicability of the proposed sensors to quantify cytarabine in a complicated matrix was carried out. A human serum was chosen for this matrix and cytarabine was determined in spiked serum samples. An aliquot of human serum (3.0 mL) was placed in a 25-mL glass tube. A total of 9 mL of an ice-cold acetonitrile solution was added to the sample, and then the mixture was left for 5 min before centrifugation at 1000 rpm. The supernatant liquid, without removing any particles, was transferred to a 25-mL beaker and then left on a water bath at 50 °C until the volume was reduced to less than 3 mL. A total of 9 mL of 30 mM acetate buffer solution of pH 3.5 was added to the pretreated human serum sample. The mixture was thoroughly mixed and used for drug measurements. The sensor was immersed in conjunction with the reference electrode in the test solution. The potential readings were recorded after the equilibrium response was reached (10–20 s). The cytarabine concentration was calculated using a calibration graph.

3. Results and Discussion

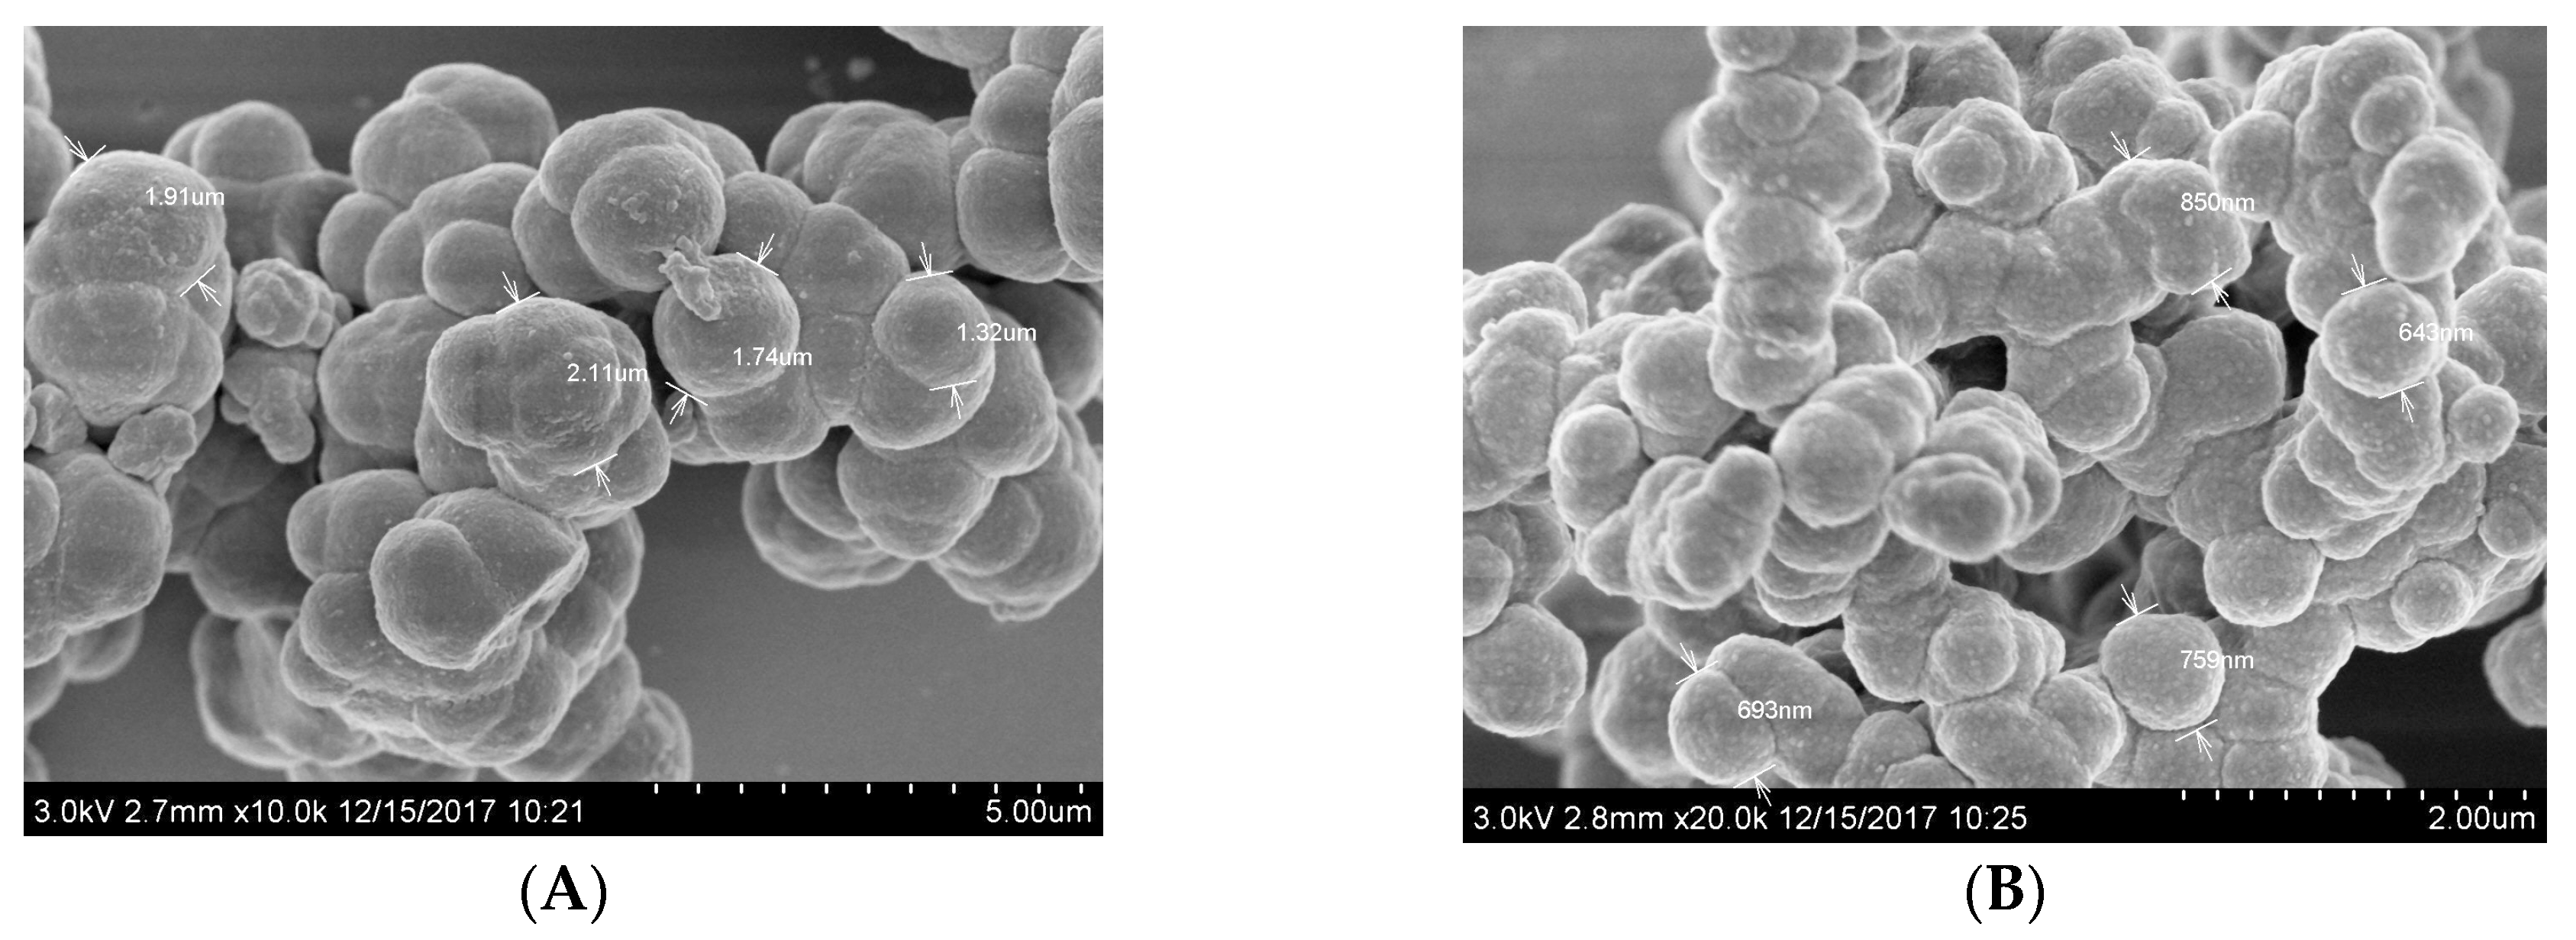
3.1. MIP Characteristics

MIP-based electrochemical sensors come in various configurations that offer control of electrode properties, such as hydrophobic/hydrophilic character, permeability and film thickness. Control of all of these properties is essential for excellent sensor performance. One of the main technical challenges in developing inexpensive MIP-based sensors is to achieve an appropriate interface between the recognition element (MIPs) and the transducer. In most cases, the MIPs should be in close contact with the transducer surface. A schematic presentation of the MIP progressive manufacturing process is shown in Figure 1.
Scanning electron microscopy (SEM, JOEL, Osaka, Japan) was utilized to check the surface morphology of the prepared polymers, either MIPs or NIPs. As shown in Figure 2, the cytarabine imprinted beads in addition to the NIPs were found to be uniform and spherical in shape, with an average diagonal distribution of 1.32–2.11 µm and 0.69–0.85 µm, respectively. This difference in the particle size can be ascribed to the existence of cytarabine molecules as a template. Because of this spherical size and shape, well-obtained beads can propagate into the ISE membrane and reveal a high-binding ability towards the cytarabine molecule. The good distribution of the polymeric beads in the polymeric membrane offers more available recognition and binding sites in the sensing membrane of the sensor and results in a better response performance.

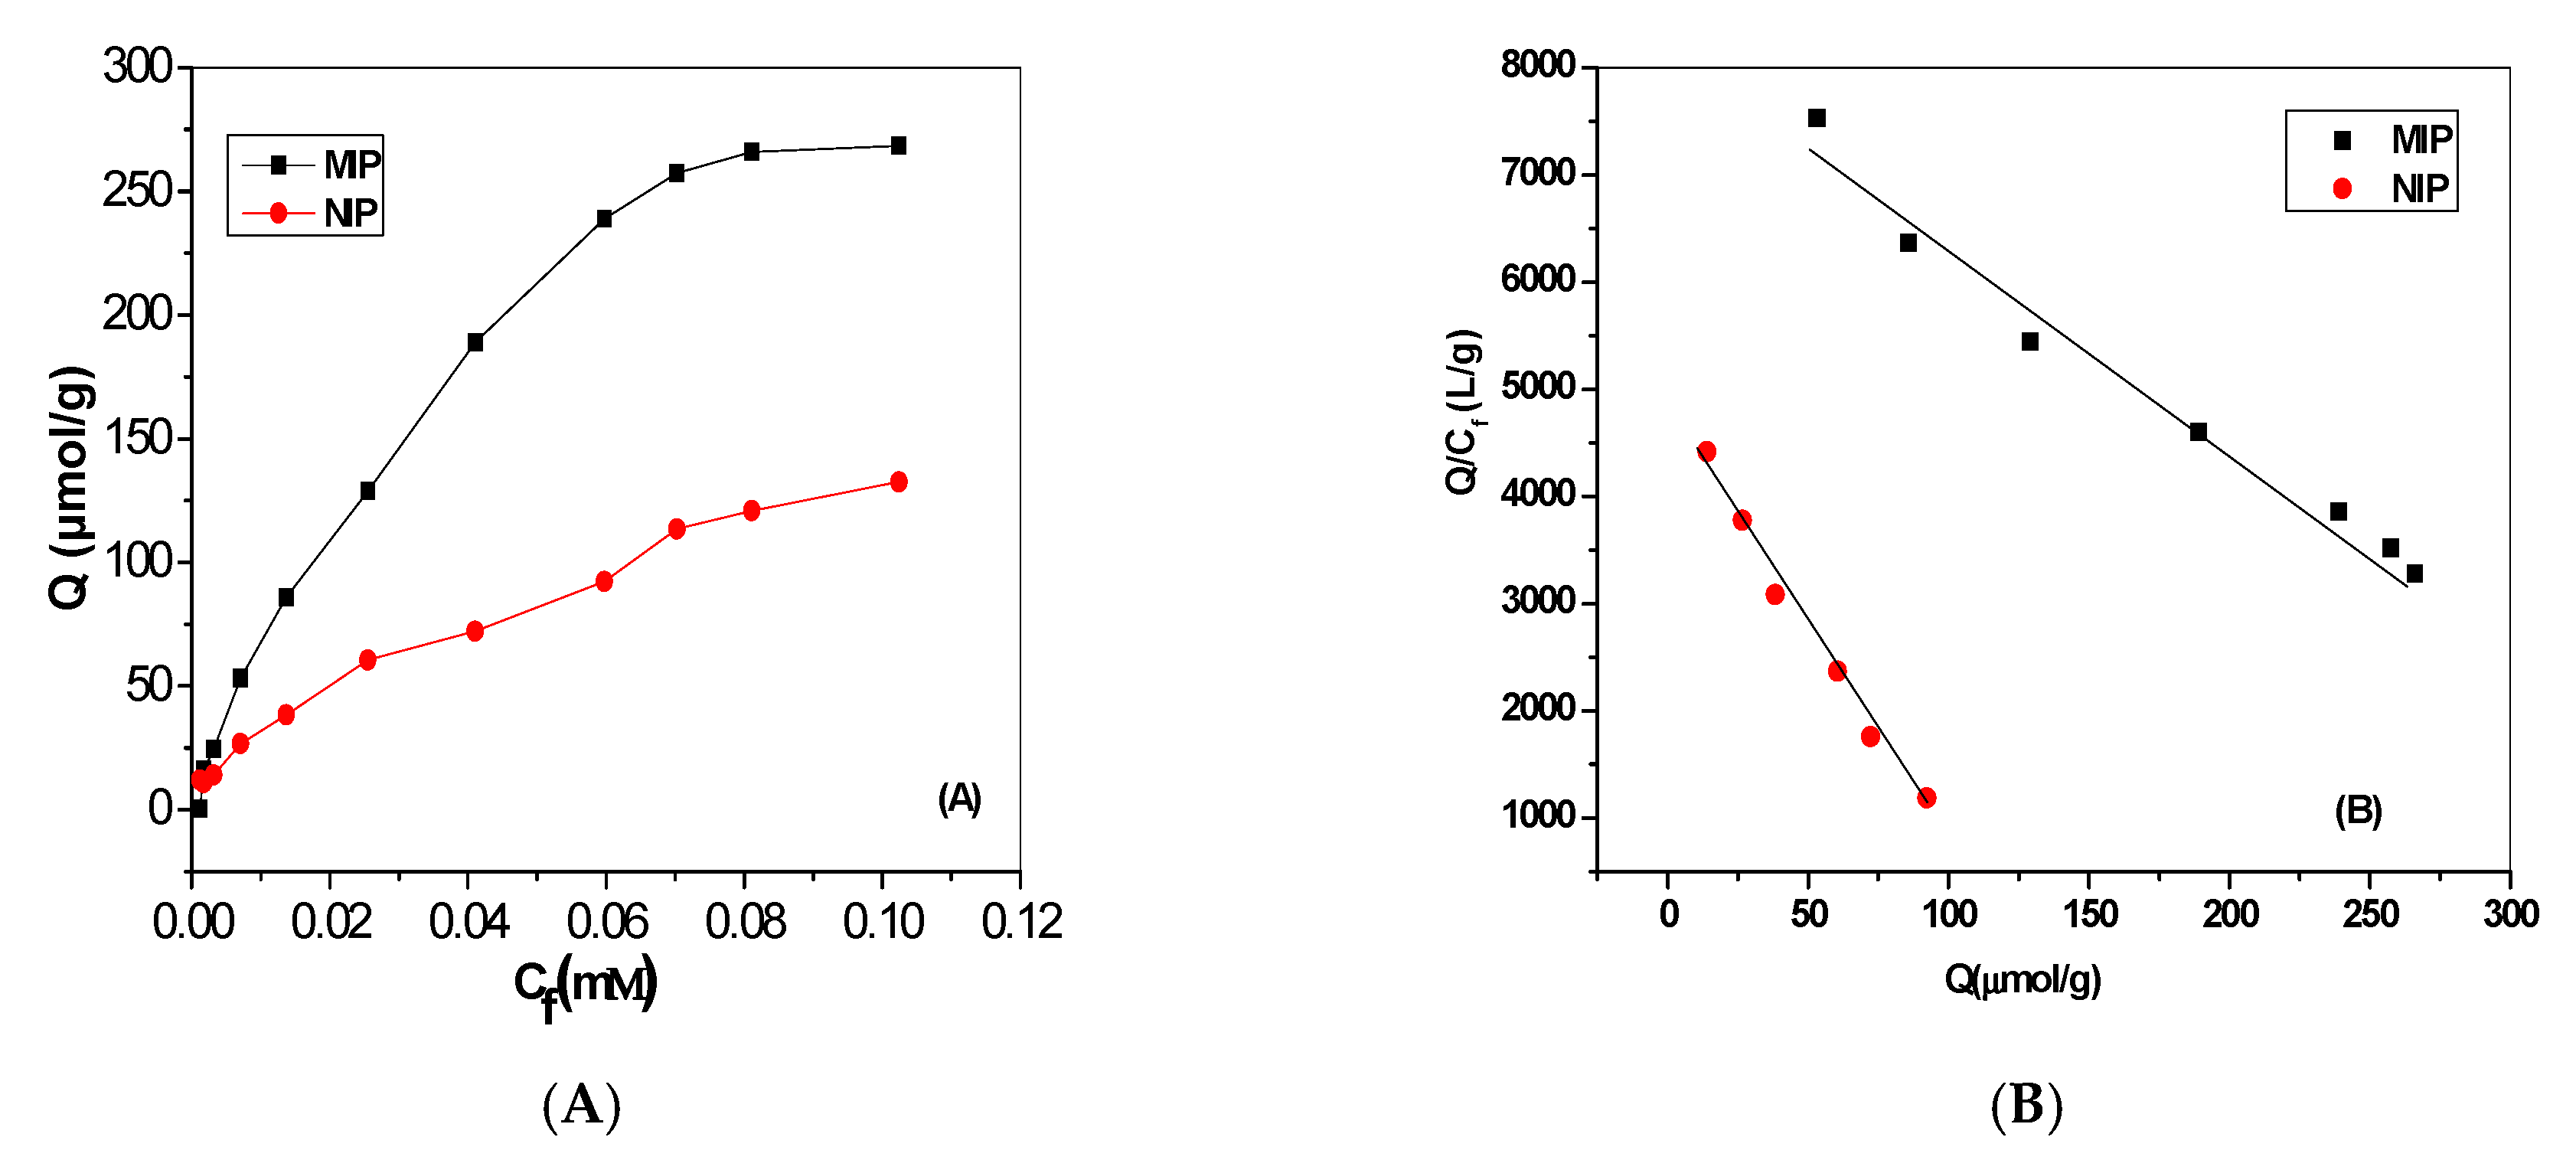
3.2. Binding Features of the Prepared MIPs

The site distribution and binding mode between the prepared MIPs and cytarabine were evaluated using binding experiments. Fixed amounts of the imprinted polymers were incubated with different concentrations of cytarabine until equilibrium was achieved. The binding capacity of the MIPs (Q) was calculated according to Equation (1):
Q = µmol (bound cytarabine)/g(MIP)
The binding capacity at each cytarabine concentration was plotted against the initial cytarabine concentration. As shown in Figure 3A, the binding capacity increased with an increase in the initial concentration of cytarabine until reaching saturation at higher analyte concentrations. Further binding parameters, such as maximum binding capacity (Qmax) and the equilibrium dissociation constant at the binding sites (Kd), were evaluated using the Scatchard equation:
Q/Cfree = (QmaxQ)/Kd
where Cfree is the free cytarabine concentration at equilibrium (mmol/L). As shown in Figure 3B, the Scatchard plot was linear over the entire cytarabine concentration range. This indicates the presence of homogeneous bonding sites. The equilibrium dissociation constants, Kd for both MIP and NIP beads were 0.054 and 0.024 µmol/L, respectively. The apparent maximum amounts, Qmax, for both MIP and NIP beads were found to be 444.9 and 117.7 µmol/g, respectively. From the abovementioned results, the MIPs combined a small dissociation constant with a high-maximum apparent binding capacity, as compared to the NIPs. This confirms the strong binding affinity of the MIPs and their successful use as an ionophore towards cytarabine.

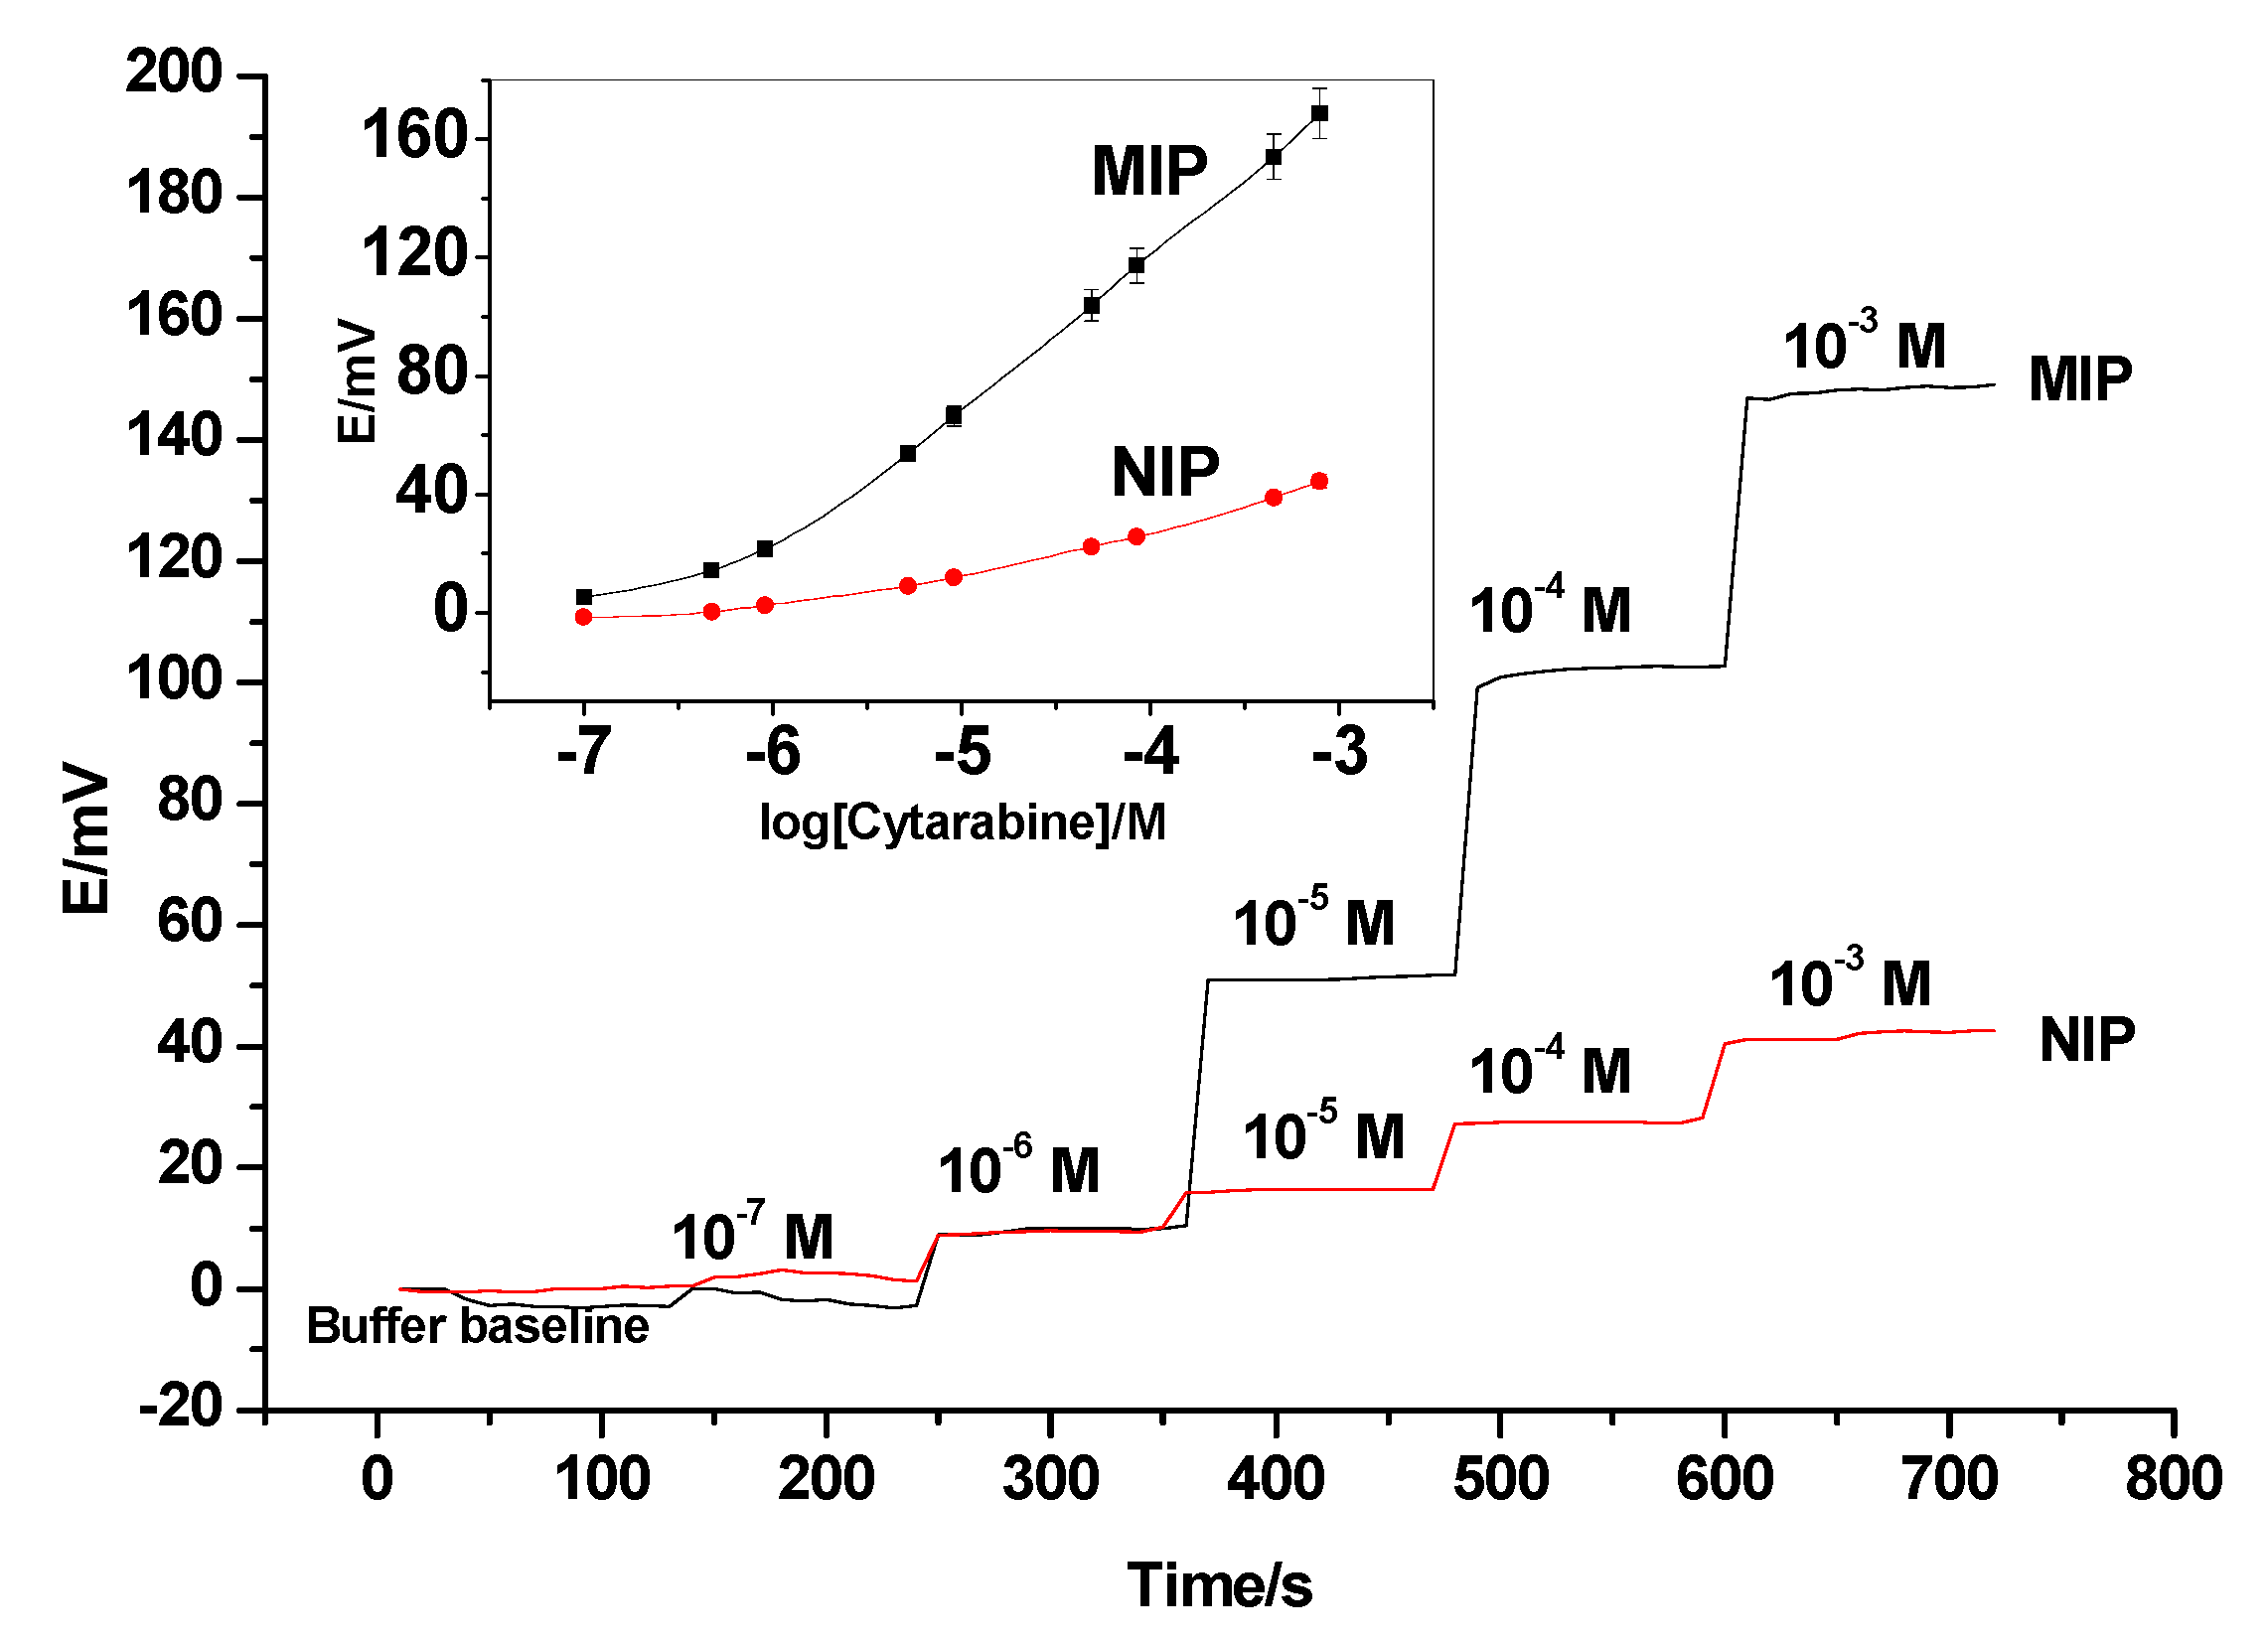
3.3. Response Characteristics of the Proposed Sensors

Liquid-contact cytarabine sensors based on potentiometric transduction were fabricated. The sensing membranes were based on MIP or NIP beads, dispersed in a plasticized PVC polymeric matrix. The designed sensors were characterized for the potentiometric assay of cytarabine according to International Union of Pure and Applied Chemistry (IUPAC) guidelines [52]. Sensors based on MIP beads dispersed in different plasticizers (i.e., o-NPOE, DOP and DBS) from triplicate studies (n = 3) revealed a near-Nernstian slope of 52.3 ± 1.2 (R2 = 0.999), 48.3 ± 1.1 (R2 = 0.998) and 45.6 ± 0.9 (R2 = 0.998) mV/decade, with detection limits of 5.5 × 10⁻⁷, 8.2 × 10⁻⁷ and 1.2 × 10⁻⁶ M, respectively. However, sensors based on non-imprinted polymer (NIP) particles showed no response towards cytarabine due to the lack of binding receptors in the membrane. The sensors revealed a sub-Nernstian slope of 18.4 ± 1.6 (R2 = 0.995) mV/decade, with a detection limit of 3.2 × 10⁻⁶ M. The performance response characteristics are tabulated in Table 1. The obtained potential response of these sensors is shown in Figure 4.

3.4. Method Validation

The quality and consistency of the data obtained were verified by the inserted electrodes according to international standard guidelines for validation of the analytical methods, including ISO/IEC 17025/2017, Association of Official Analytical Chemists (AOAC), United States Pharmacopeia (USP), United States Environmental Protection Agency (US EPA),World Health Organization (WHO) and U.S. Food and Drug Administration (US FDA) [53,54]. Method validation elements were evaluated using six batches (triplicate each) of standard cytarabine solution. These elements include method linearity, limit of detection, trueness (accuracy and bias), standard deviation (precision), robustness and interference study.

3.4.1. Method Linearity and Detection Limit

Method linearity was verified by measuring cytarabine standard solution in the range of about 0.243 to 243.2 μg/mL. From the constructed calibration plot, the linear range was 1.0 × 10⁻³–1.0 × 10⁻⁶ M (243.22–0.243 μg/mL) for the MIP-based membrane sensors. Equation (3) shows the least square analysis of the data:
E (mV) = (52.3 ± 1.2) log [Cytarabine] + (330.5 ± 2.1)
The statistical analysis for the linearity data is tabulated in Table 1. The limit of detection was measured from the intersection of extrapolated linear stable portions of the calibration graph, according to IUPAC guidelines [52]. It was calculated and found to be 5.5 × 10⁻⁷ M (0.13 μg/mL). Examining any fixed or relative bias caused by the proposed electrodes, a simple linear regression of the observed concentrations against the expected values (five points) was performed. No remarkable change in the slopes of the regression lines was observed, and the correlation coefficients (R2) were nearly the same as those of the ideal value of unity (R2 = 0.999). The change in the intercepts was shown to be very small. No systematic difference was recorded between the estimated and expected concentrations within the tested range using the presented method.

3.4.2. Accuracy and Precision

The method accuracy was estimated by spiking a known amount of cytarabine to urine samples as a blank matrix at concentration levels 10–20 μM. All sample solutions were analyzed as per the proposed method in triplicate. The percentages of recovery from the matrix were 99.1%, 98.8% and 98.6% for 10, 15 and 20 μM cytarabine concentrations, respectively.
The term precision demonstrates the repeatability and reproducibility of the method and is expressed as the coefficient of variation (CV). It was achieved by performing six replicate introductions of cytarabine standard solutions (10, 15 and 20 μg/mL) into the proposed system. The relative standard deviations were calculated and found to be 0.7%, 0.9% and 1.1% for each concentration, respectively.

3.4.3. Method Robustness and Ruggedness

Method robustness was evaluated by testing the effect of changing the pH of the test solution and measuring the response time of the proposed electrodes. The effect of the solution pH on the potentiometric response of the presented electrodes was examined. The potential response offered by standard 1.0 × 10⁻⁴ M cytarabine was recorded over a pH range of 2–11. Adjustment of the test solution was carried out using either HCl and/or NaOH solutions. It was noticed that there was no change in the potential response of this concentration over the range of 2.8–4.0. Since the pKa of cytarabine is 4.22 [55], one pH unit below the pKa resulted in 99.9% ionization (protonation) of the drug. At pH 4, the potential response declined with negative drift due to the formation of the free base of the drug. A 30-mM phosphate buffer at pH 3 was used as a solution background for all subsequent measurements.
The dynamic time response of the proposed electrodes was also tested. Stable and constant potential was attained within ~5–10 s for 10−3–10−6 M cytarabine test solutions to reach an approximated 95% equilibrium response (Figure 4). The method ruggedness was examined by performing the analysis using six different electrodes and two different instruments on different days. Repeatability (within-day) and reproducibility (between-days) showed a difference in potential within 2–3 mV. The obtained data showed that the effect of the studied parameters falls within the specified tolerance, and the changes are considered within the method robustness.

3.4.4. Interfering Study

Potentiometric selectivity coefficients (Kpoti,J) of cytarabine sensors were carried out through the modified separate solutions method (MSSM) proposed by Bakker [56]. The selectivity values reflect the preferential interaction of the tailored receptors with cytarabine in a 50-mM phosphate buffer solution of pH 3. The selectivity over various related compounds and inorganic ions (e.g., K+, Na+, Ca2+, Mg2+, fluoxetine, metformine, caffeine, pheniramine, creatine, glutamine, creatinine, histidine and quinine) is presented in Table 2.
Pharmacological excipients, such as glucose, maltose, starch, talc and tween-80 used at a concentration level less than 1000 times above cytarabine, have no effect on the result accuracy obtained by the proposed electrodes.

3.5. Analytical Applications

Cytarabine membrane sensors were successfully introduced to monitor the amount of cytarabine in different pharmaceutical formulations.
It can also be used for routine analysis and quality control/quality assurance during drug manufacture. Potentiometric assaying of cytarabine in triplicate showed results with an average recovery of 99.3% and a mean standard deviation of ±0.5% (Table 3). The data were compared with results obtained by liquid chromatography with detection at 254 nm [57]. An F-test demonstrated that there was no difference between the means and the measured variances of the two outcome groups of the results. The distribution of measurements and the extent of determination under investigation indicate that the results are subject to statistical control.
The sensors were successfully tested monitoring cytarabine in human serum by spiking aliquots of different samples with known amounts of standard cytarabine solution. The recovery results showed an average of 99.1% with a relative standard deviation of ±0.8%. The results obtained for the determination of cytarabine are presented in Table 4.

4. Conclusions

Novel liquid-contact cytarabine potentiometric sensors were designed for the quantification of the antileukemia cytarabine drug in different pharmaceutical formulations. The membrane sensors were based on the use of tailored imprinted polymers as recognition receptors. The prepared MIPs were based on the use of MAA as a functional monomer and EGDMA as a crosslinker. The sensors provided the advantages of rapid response, reasonable selectivity, elimination of premedication or separation steps, low cost, long-term stability, good selectivity and automatic feasibility. Advantages offered using the proposed cytarabine sensor are the low detection limit (5.5 × 10⁻⁷ M), long-life span (8 weeks) and extended linearity range (10−3–10−6 M). The validity of the proposed method was verified by measuring the lowest limit of detection, range, accuracy, precision, repeatability and variability between days. The good performance characteristics obtained demonstrate the applicability to the determination of cytarabine in different drug formulations. The method can be successfully applied for the routine control of pharmaceutical drug solutions without any pre-concentration procedures.

Author Contributions

A.H.K., N.H.A., A.E.-G.E.A. and T.A.Y. conceptualized the study, interpreted the results, carried out the experiments and prepared the manuscript; A.H.K., H.R.G. and A.E.-G.E.A. cooperated in the preparation of the manuscript; N.H.A., A.A.A., M.A.A.-O. and A.Y.A.S. performed the clinical studies. All authors have read and agreed to the published version of the manuscript.

Funding

The authors are grateful to the Deanship of Scientific Research, King Saud University, for funding this work through Research Group Project RGP-172.

Conflicts of Interest

The authors declare no conflicts of interest.

References

  1. Atlas of Drugs; Mir-Onix XXI Century: Mir, Moscow, Russia, 2001. (In Russian)
  2. Elinov, N.P.; Gromova, E.G.; Sinev, D.N. Reference Book of Drugs with Prescriptions; Hippocratus: St. Petersburg, Russia, 1994. (In Russian) [Google Scholar]
  3. Sweetman, S.C. (Ed.) Martindale. The Complete Drug Reference, 33rd ed.; The Pharmaceutical Press: Chicago, IL, USA, 2002; p. 525. [Google Scholar]
  4. Zaharans, V.; Fridmanis, J. Determination of glycol group in nucleic acid components. II. Titrimetric determination of cytarabine by periodate oxidation method. Latvijas Kimijas Zurnals 1994, 2, 203–205. [Google Scholar]
  5. Davidson, A.G.; Hassan, S.M. Assay of benzenoid drugs in tablet and capsule formulations by second-derivative ultraviolet spectrophotometry. J. Pharam. Sci. 1984, 73, 413–416. [Google Scholar] [CrossRef] [PubMed]
  6. Mahrous, M.S.; Abdel-Khalek, M.M.; Daabees, H.G.; Beltagy, Y.A. Use of Differential Spectrophotometry for Determination of Cytarabine and Acyclovir in Their Dosage Forms. Anal. Lett. 1992, 25, 1491–1501. [Google Scholar] [CrossRef]
  7. Subramanian, N.; Murthy, R.S.R. Dos sencillos métodos espectrofotométricos para la determinación de la citarabina y de su formulación inyectable. Ars. Pharm. 2004, 45, 319–334. [Google Scholar]
  8. Chen, X.N.; Zhang, C.X.; Lu, J.R. Flow Injection Chemiluminescence Determination of Cytarabini Hydrochloridum with On-line Electrogenerated Hypochlorite. Fenxi Shiyanshi 2000, 19, 62–64. [Google Scholar]
  9. Marin, D.; Teijeiro, C. Differential pulse polarographic determination of the antineoplastic agent cytarabine and its isomer the nucleoside cytidine. Bioelectrochem. Bioenerg. 1992, 28, 417–424. [Google Scholar] [CrossRef]
  10. Dogrukol-AK, D.; Tuncel, M. Determination of cytarabine in ampoules by certain polarographic techniques. Pharmazie 1994, 49, 928–929. [Google Scholar]
  11. Teijeiro, C.; Marin, D. Electrochemical behaviour of cyclocytidine: Kinetics of its hydrolytic transformation to cytarabine. Bioelectrochem. Bioenerg. 1994, 34, 25–29. [Google Scholar]
  12. Teijeiro, C.; Marin, D. Electrochemical behaviour of the antineoplastic agent cytarabine. J. Electroanal. Chem. Interfacial Electrochem. 1991, 316, 119–131. [Google Scholar] [CrossRef]
  13. Teijeiro, C.; Marin, D. Some aspects of the mechanism of the reduction of the antineoplastic agent cytarabine on a mercury electrode. J. Electroanal. Chem. 1992, 337, 175–179. [Google Scholar] [CrossRef]
  14. Novotny, L.; Vachalkova, A. Polarographic study of cytosine nucleosides. Neoplasma 1993, 40, 369–372. [Google Scholar] [PubMed]
  15. Abd El-Hady, D.; Abdel-Hamid, M.I.; Seliem, M.; Andrisano, M.V.; Abo-El-Maali, N. Osteryoung square wave stripping voltammetry at mercury film electrode for monitoring ultra trace levels of Tarabine PFS and its interaction with ssDNA. J. Pharm. Biomed. Anal. 2004, 34, 879–890. [Google Scholar] [CrossRef] [PubMed]
  16. Pallavicini, M.G.; Mazrimas, J.A. High-performance liquid chromatographic analysis of cytosine arabinoside and metabolites in biological samples. J. Chromatogr. 1980, 183, 449–458. [Google Scholar] [CrossRef]
  17. Plunkett, W.; Chubb, S.; Barlogie, B. Simultaneous determination of 1-beta-D-arabinofuranosyl- cytosine 5′-triphosphate and 3-deazauridine 5′-triphosphate in human leukemia cells by high-performance liquid chromatography. J. Chromatogr. 1980, 221, 425–430. [Google Scholar] [CrossRef]
  18. Linssen, P.; Drenthe-Schonk, A.; Wessels, H.; Haanen, C. Determination of 1-beta-D-arabinofuranosylcytosine and 1-beta-D-arabinofuranosyluracil in human plasma by high-performance liquid chromatography. J. Chromatogr. 1981, 223, 371–378. [Google Scholar] [CrossRef]
  19. Tuncel, M.; Notari, R.E.; Malspeis, L. A Rapid Stability-Indicating HPLC Assay for the Arabinosylcytosine Prodrug, Cyclocytidine. J. Liq. Chromatogr. 1981, 4, 887–896. [Google Scholar] [CrossRef]
  20. Breithaupt, H.; Schick, J. Determination of cytarabine and uracil arabinoside in human plasma and cerebrospinal fluid by high-performance liquid chromatography. J. Chromatogr. 1981, 225, 99–106. [Google Scholar] [CrossRef]
  21. Danks, M.K. Two simple high-performance liquid chromatographic methods for simultaneous determination of 2′-deoxycytidine 5′-triphosphate and cytosine arabinoside 5′-triphosphate concentrations in biological samples. J. Chromatogr. 1982, 233, 141–148. [Google Scholar] [CrossRef]
  22. Linssen, P.; Drenthe-Schonk, A.; Wessels, H.; Wierwinden, G.; Haanen, C. Determination of cytosine arabinoside triphosphate in leukemic cells by isocratic high-performance anion-exchange column chromatography. J. Chromatogr. 1982, 232, 424–429. [Google Scholar] [CrossRef]
  23. Sinkule, J.A.; Evans, W.E. High-performance liquid chromatographic assay for cytosine arabinoside, uracil arabinoside and some related nucleosides. J. Chromatogr. 1983, 274, 87–93. [Google Scholar] [CrossRef]
  24. Hilhorst, M.J.; Hendriks, G.; Van Hout, M.W.J.; Sillén, H.; Van de Merbel, N.C. HPLC–MS/MS method for the determination of cytarabine in human plasma. Bioanalysis 2011, 3, 1603–1611. [Google Scholar] [CrossRef] [PubMed]
  25. Burk, M.; Volmer, M.; Fartash, K.; Schneider, W. Ion-pair liquid chromatography of cytarabine and uracil-arabinoside in human plasma. Arzneimittel-Forschung 1995, 45, 616–619. [Google Scholar] [PubMed]
  26. Hsieh, Y.; Li, F.; Duncan, C.J.G. Supercritical Fluid Chromatography and High-Performance Liquid Chromatography/Tandem Mass Spectrometric Methods for the Determination of Cytarabine in Mouse Plasma. Anal. Chem. 2007, 79, 3856–3861. [Google Scholar] [CrossRef] [PubMed]
  27. Boutagy, J.; Harvey, D.J. Analysis of cytosine arabinoside and related pyrimidine nucleosides by gas chromatography and gas chromatography-mass spectrometry. J. Chromatogr. 1978, 156, 153–166. [Google Scholar] [CrossRef]
  28. Boutagy, J.; Harvey, D.J. Determination of cytosine arabinoside in human plasma by gas chromatography with a nitrogen-sensitive detector and by gas chromatography--mass spectrometry. J. Chromatogr. 1978, 146, 283–296. [Google Scholar] [CrossRef]
  29. Makino, Y.; Matsubara, Y.; Watanabe, K.; Hirobe, M. [The simultaneous determination of Ara-U and Ara-C, urinary metabolites of N4-behenoyl-1-beta-D-arabinofuranosylcytosine by mass fragmentography (author’s transl)]. Yakugaku Zasshi 1982, 102, 49–55. [Google Scholar] [CrossRef] [Green Version]
  30. Abd El-Hady, D.; Abo-El-Maali, N.; Gotti, R.; Andrisano, V. Simultaneous micellar electrokinetic chromatography and liquid chromatography of adriblastina and tarabine PFS Their application to some biological fluids. Talanta 2005, 66, 253–260. [Google Scholar] [CrossRef]
  31. Houze, P.; Deschamps, F.; Dombret, H.; Bousquet, B.; Gourmel, B. Micellar electrokinetic capillary chromatography quantification of cytosine arabinoside and its metabolite, uracil arabinoside, in human serum. J. Chromatogr. 2001, 754, 185–192. [Google Scholar] [CrossRef]
  32. Piall, E.M.; Aherne, G.W.; Marks, V.M. A radioimmunoassay for cytosine arabinoside. Br. J. Cancer 1979, 40, 548–558. [Google Scholar] [CrossRef] [Green Version]
  33. Sato, T.; Morozumi, M.; Kodama, K.; Kuninaka, A.; Yoshino, Y. Sensitive radioimmunoassay for cytarabine and uracil arabinoside in plasma. Cancer Treat. Rep. 1984, 68, 1357–1366. [Google Scholar]
  34. Shimada, N.; Ueda, T.; Yokoshima, T.; Oh-Ishi, J.; Oh-Oka, T. A sensitive and specific radioimmunoassay for 1-beta-D-arabino-furanosylcytosine. Cancer Lett. 1984, 24, 173–178. [Google Scholar] [CrossRef]
  35. Anonymous. Patent to “Yamasa Shoyu Co., Ltd., Japan,”. Japan Patent No. JP 58221168 A2, 22 December 1983. Jpn Kokai Tokkyo Koho. [Google Scholar]
  36. Okabayashi, T.; Moffatt, J.G. Radioimmunoassay of 1-beta-D-arabinofuranosylcytosine. Method Enzymol. 1982, 84, 470–483. [Google Scholar]
  37. Okabayashi, T.; Mihara, S.; Repke, D.B.; Moffatt, J.G. A radioimmunoassay for 1-beta-D-arabinofuranosylcytosine. Cancer Res. 1977, 37, 619–624. [Google Scholar]
  38. Okabayashi, T.; Mihara, S.; Moffatt, J.G. A radioimmunoassay method for 1-beta-D-arabino- furanosyluracil using antibodies directed against 1-beta-D-arabinofuranosylcytosine. Cancer Res. 1977, 37, 625–628. [Google Scholar] [PubMed]
  39. Yamauchi, T.; Ueda, T.; Nakamura, T. A new sensitive method for determination of intracellular 1-beta-D-arabinofuranosylcytosine 5′-triphosphate content in human materials in vivo. Cancer Res. 1996, 56, 1800–1804. [Google Scholar] [PubMed]
  40. Ashmawy, N.H.; Almehizia, A.A.; Youssef, T.A.; El-Galil, E.A.A.; Al-Omar, M.A.; Kamel, A.H. Novel Carbon/PEDOT/PSS-Based screen-printed biosensors for acetylcholine neurotransmitter and acetylcholinesterase detection in human serum. Molecules 2019, 24, 1539. [Google Scholar] [CrossRef] [PubMed] [Green Version]
  41. Guerreiro, J.R.L.; Kamel, A.H.; Sales, M.G.F. FIA potentiometric system based on periodate polymeric membrane sensorsfor the assessment of ascorbic acid in commercial drinks. Food Chem. 2010, 120, 934–939. [Google Scholar] [CrossRef] [Green Version]
  42. Moreira, F.T.C.; Guerreiro, J.R.L.; Vera, L.O.; Azevedo, L.O.V.; Kamel, A.H.; Sales, M.G.F. New potentiometric sensors for the determination of tetracycline in biological samples: Batch and flow mode operations. Anal. Meth. 2010, 2, 2039. [Google Scholar] [CrossRef] [Green Version]
  43. Hassan, S.S.M.; Amr, A.E.; Abd El-Naby, H.; El-Naggar, M.; Kamel, A.H.; Khalifa, N.M. Novel aminoacridine sensors based on molecularly imprinted hybrid polymeric membranes for static and hydrodynamic drug quality control monitoring. Materials 2019, 12, 3327. [Google Scholar] [CrossRef] [Green Version]
  44. Kamel, A.H.; Sayour, H.E.M. Flow-Through Assay of Quinine Using Solid Contact Potentiometric Sensors Based on Molecularly Imprinted Polymers. Electroanalysis 2009, 21, 2701–2708. [Google Scholar] [CrossRef]
  45. Kamel, A.H.; Hassan, A.M.E. solid contact potentiometric sensors based on host-tailored molecularly imprinted polymers for creatine assessment. Int. J. Electrochem. Sci. 2016, 11, 8938–8949. [Google Scholar] [CrossRef]
  46. Kamel, A.H.; Mahmoud, W.H.; Mostafa, M.S. Biomimetic ciprofloxacin sensors made of molecularly imprinted network receptors for potential measurements. Anal. Methods 2011, 3, 957–964. [Google Scholar] [CrossRef]
  47. Kamel, A.H.; Galal, H.R. MIP-Based Biomimetic Sensors for Static and Hydrodynamic Potentiometric Transduction of Sitagliptin in Biological fluids. Int. J. Electrochem. Sci. 2014, 9, 4361–4373. [Google Scholar]
  48. El-Naby, E.H.; Kamel, A.H. Potential transducers based man-tailored biomimetic sensors for selective recognition of dextromethorphan as an antitussive drug. Mater. Sci. Eng. C 2015, 54, 217–224. [Google Scholar] [CrossRef] [PubMed]
  49. Kamel, A.H.; Mohammad, S.G.; Awwad, N.S.; Mohammed, Y.Y. Survey on the Integration of Molecularly Imprinted Polymers as Artificial Receptors in Potentiometric Transducers for pharmaceutical Drugs. Int. J. Electrochem. Sci. 2019, 14, 2085–2124. [Google Scholar] [CrossRef]
  50. Hassan, S.S.M.; Elnemma, E.M.; Mohamed, A.H.K. Novel Biomedical Sensors for Flow Injection Potentiometric Determination of Creatinine in Human Serum. Electroanalysis 2005, 17, 2246–2253. [Google Scholar] [CrossRef]
  51. Murthy, V.S.A.; Rohinib, A.; Pravallikaa, K.E.; Rania, A.P.; Rahaman, S.A. Development and validation of a novel UV-Visible spectrophomtric method for cytarabine in bulk and pharmaceutical dosage forms. Der Pharmacia Lettre 2013, 5, 51–55. [Google Scholar]
  52. Thompson, M.; Ellison, S.L.R.; Wood, R. Harmonized guidelines for single-laboratory validation of methods of analysis (IUPAC Technical Report). Pure Appl. Chem. 2002, 74, 835–855. [Google Scholar] [CrossRef]
  53. Guidelines for Food Testing Laboratories; International Accreditation Service Inc.: Brea, CA, USA, January 2016.
  54. Chandran, S.; Singh, R.S.P. Comparison of various international guidelines for analytical method validation. Pharmazie 2007, 62, 4–14. [Google Scholar]
  55. PubChem. Available online: https://pubchem.ncbi.nlm.nih.gov (accessed on 11 August 2019).
  56. Bakker, E. Determination of improved selectivity coefficients of polymer membrane ion-selective electrodes by conditioning with a discriminated ion. J. Electrochem. Soc. 1996, 143, L83–L85. [Google Scholar] [CrossRef]
  57. U.S. Pharmacopeia. The United States Pharmacopeia, USP 30/The National Formulary, NF 25; U.S. Pharmacopeial Convention, Inc.: Rockville, MD, USA, 2007; p. 1858. [Google Scholar]
Figure 1. Schematic representation of the cytarabine imprinting process.
Polymers 12 01343 g001
Figure 2. SEM images for both (A) cytarabine molecularly imprinted polymer (MIP) and (B) non-imprinted polymer (NIP) beads.
Polymers 12 01343 g002
Figure 3. Binding characteristics of the prepared beads: (A) binding isotherms and (B) Scatchard plot.
Polymers 12 01343 g003
Figure 4. Potentiometric behavior of the cytarabine-membrane-based sensor (time trace and potentiometric response).
Polymers 12 01343 g004
Table 1. Response characteristics of the proposed cytarabine sensors.
ParameterMIP Membrane Based SensorNIP Membrane Based Sensor
o-NPOEDOPDBS
Slope (mV/decade)52.3 ± 1.248.3 ± 1.145.6 ± 0.918.4 ± 1.6
Correlation coefficient (R2)0.9990.9990.9980.995
Detection limit (M)5.5 × 10−78.2 × 10−71.2 × 10−63.2 × 10−6
Linear range (M)1.0 × 10⁻⁶–1.0 × 10−32.8 × 10−6–1.0 × 10−35.0 × 10−6–1.0 × 10−31.0 × 10−5–1.0 × 10⁻³
Working pH range (pH)2.8–4.02.8–4.02.8–4.0-
Response time (s)<10<10<10-
Accuracy (mV%)99.298.698.1-
Precision (mV%)0.71.12.2-
Table 2. Potentiometric selectivity coefficients (log k i , j p o t ) of the cytarabine membrane sensor plasticized with o-nitrophenyl octyl phthalate (o-NPOE) in a 50-mM phosphate solution of pH 3.0.
Interfering Ion−log K pot I, J
Na+5.1
K+4.7
Ca2+5.7
Mg25.8
Fluoxetine5.0
Metformine4.2
Caffeine4.9
Pheniramine4.3
Creatine5.1
Glutamine4.1
Creatinine4.4
Histidine3.8
Quinine3.9
Table 3. Cytarabine assessment in different drug formulations using the cytarabine-membrane-based sensor.
Pharmaceutical Product and SourceNominal Content Taken, mg /mLFound, mg Tablet−1t-Student Test bF-Test b
Proposed MethodMean a (%) ± SDReference Method [57]Mean a (%) ± SD
Aracytin (Pharmacia, Egypt)2020.3101.5 ± 0.420.1100.8 ± 0.61.24.2
Tabine (Hikma pharmaceutical, Egypt)10099.599.5 ± 0.699.999.9 ± 0.13.27.6
Cytarabin (Ramco, Egypt)10098.898.8 ± 0.599.899.8 ± 0.12.33.4
a Mean of triplicate measurements b Student’s t-test and F-test at 95% confidence level values are 4.30 and 19.00, respectively.
Table 4. Cytarabine assessment in human serum using the proposed sensors.
SampleSpiked, μg/mL*Found, μg/mLRecovery, %RSD, %
1109.797.01.1
21514.395.30.8
32020.6103.00.9
* average of 5 measurements.

