Effect of Temperature on the Mechanical Properties and Polymerization Kinetics of Polyamide-6 Composites


Abstract
:
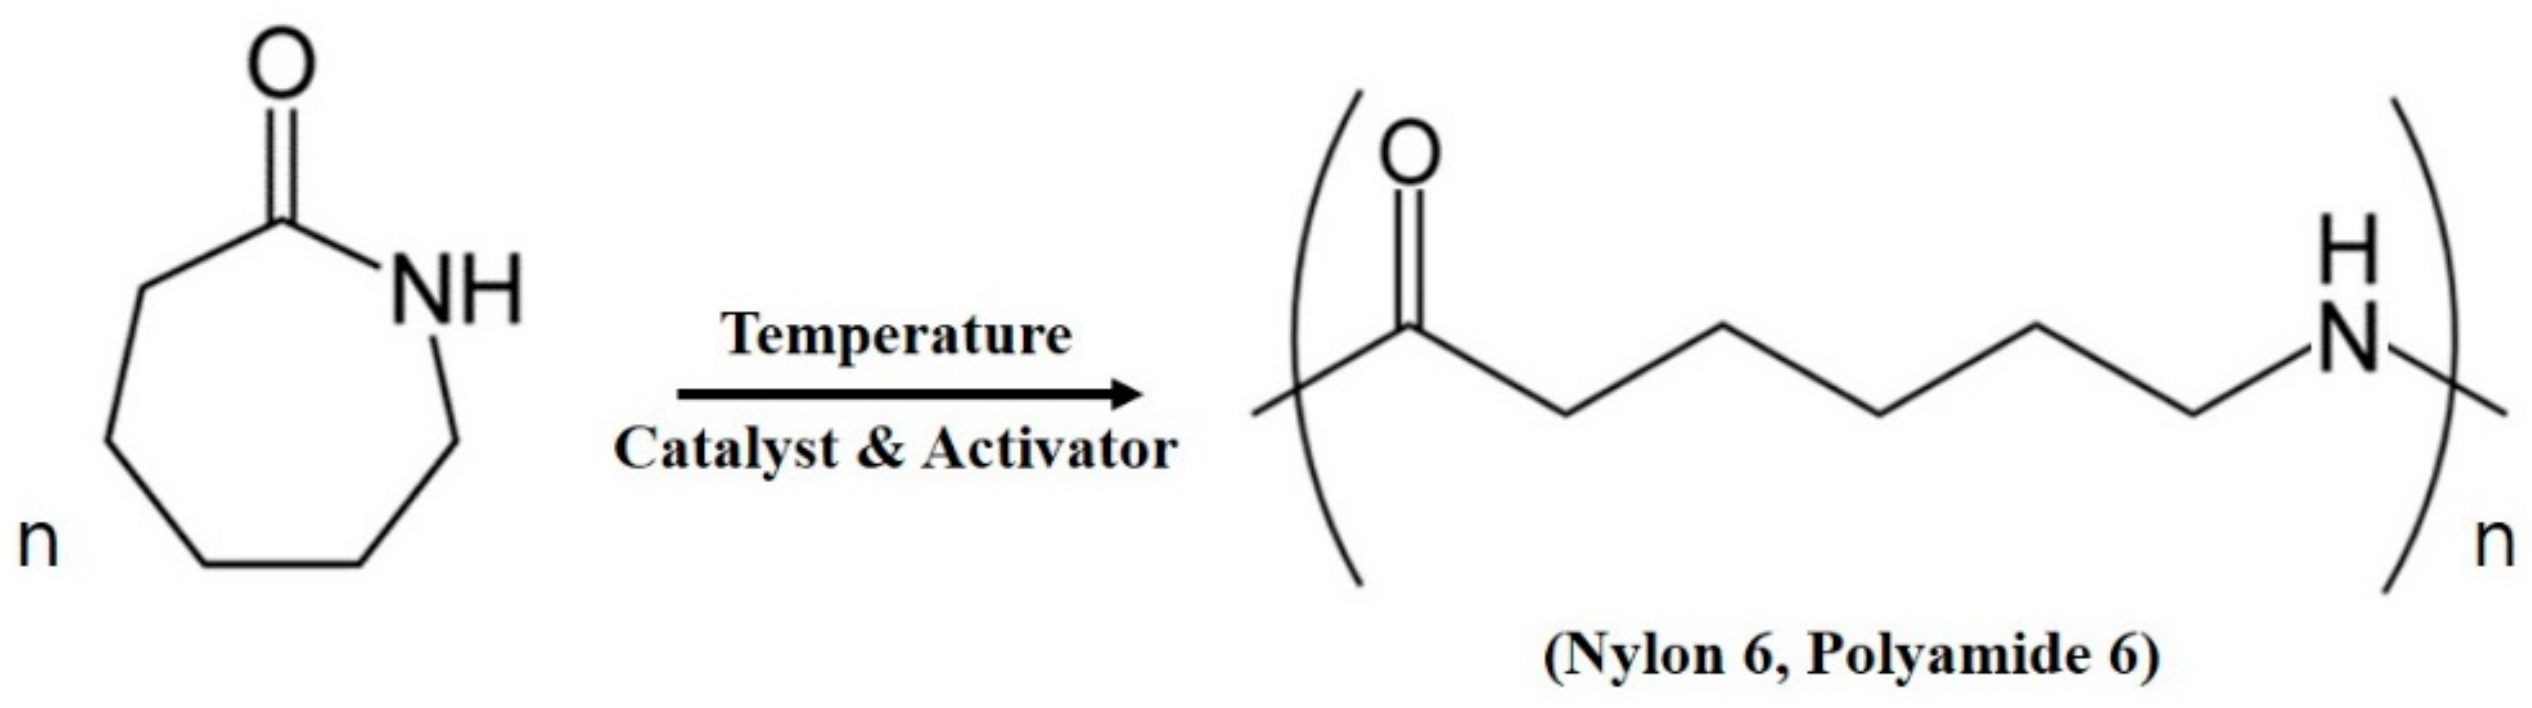
1. Introduction
2. Materials and Methods
2.1. Materials
2.2. Experimental Procedures
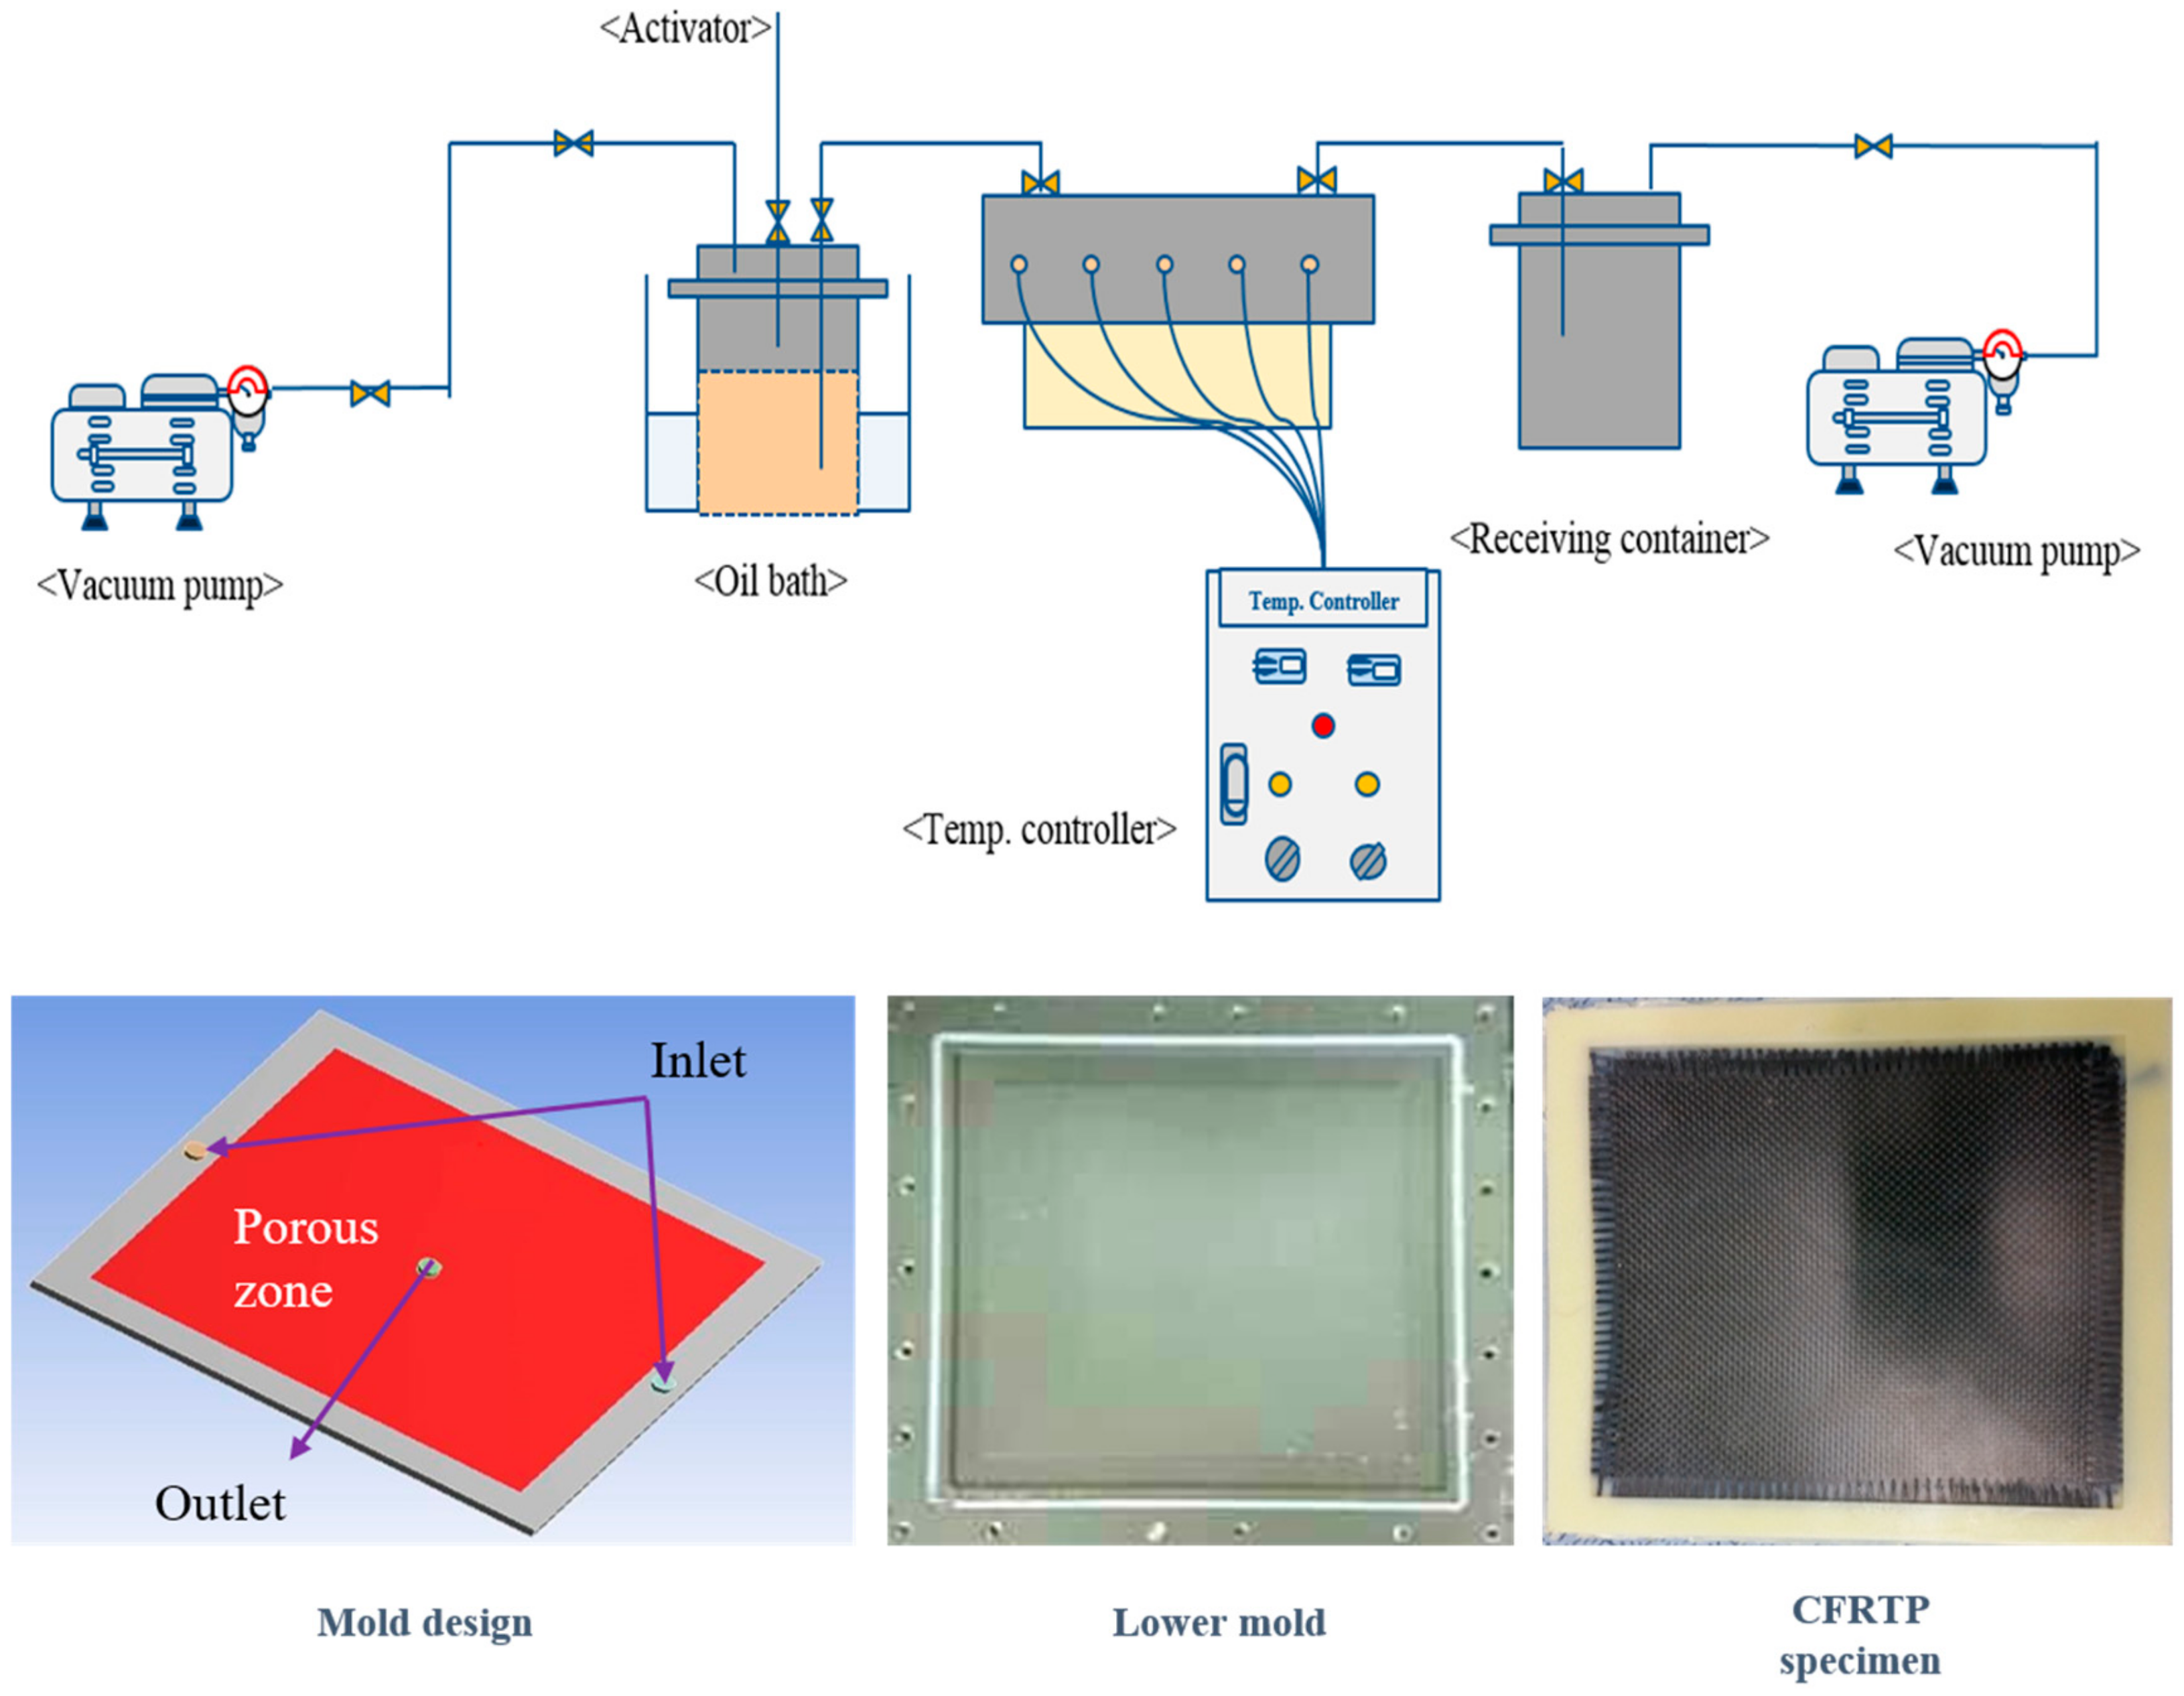
2.2.1. Composite Specimen Prepared Using VARTM
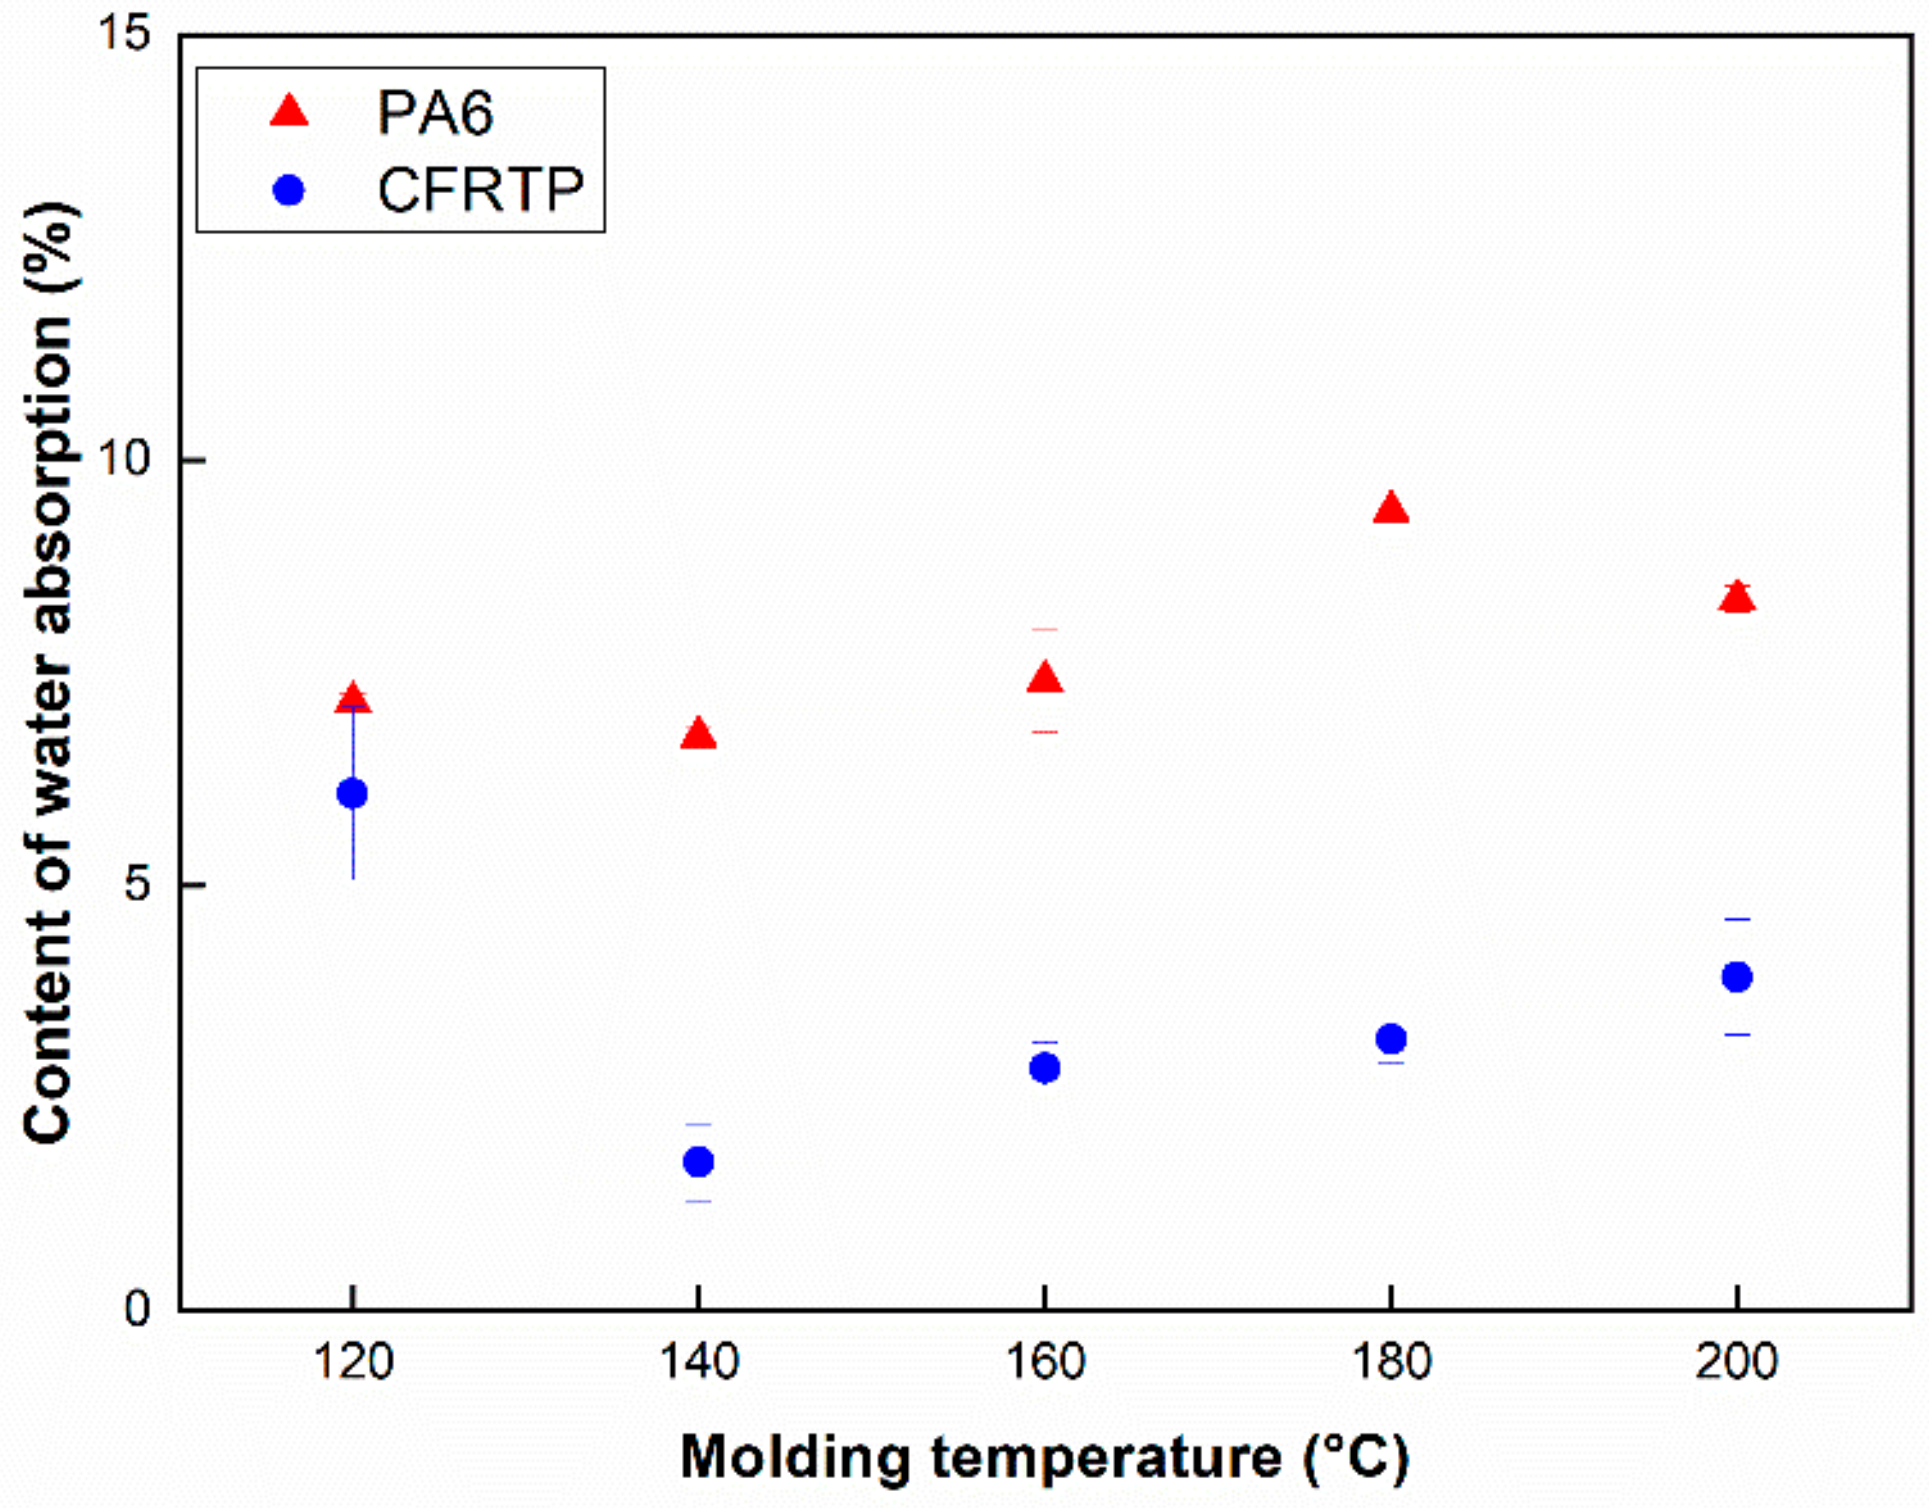
2.2.2. Degree of Polymerization and Measurement of Water Absorption
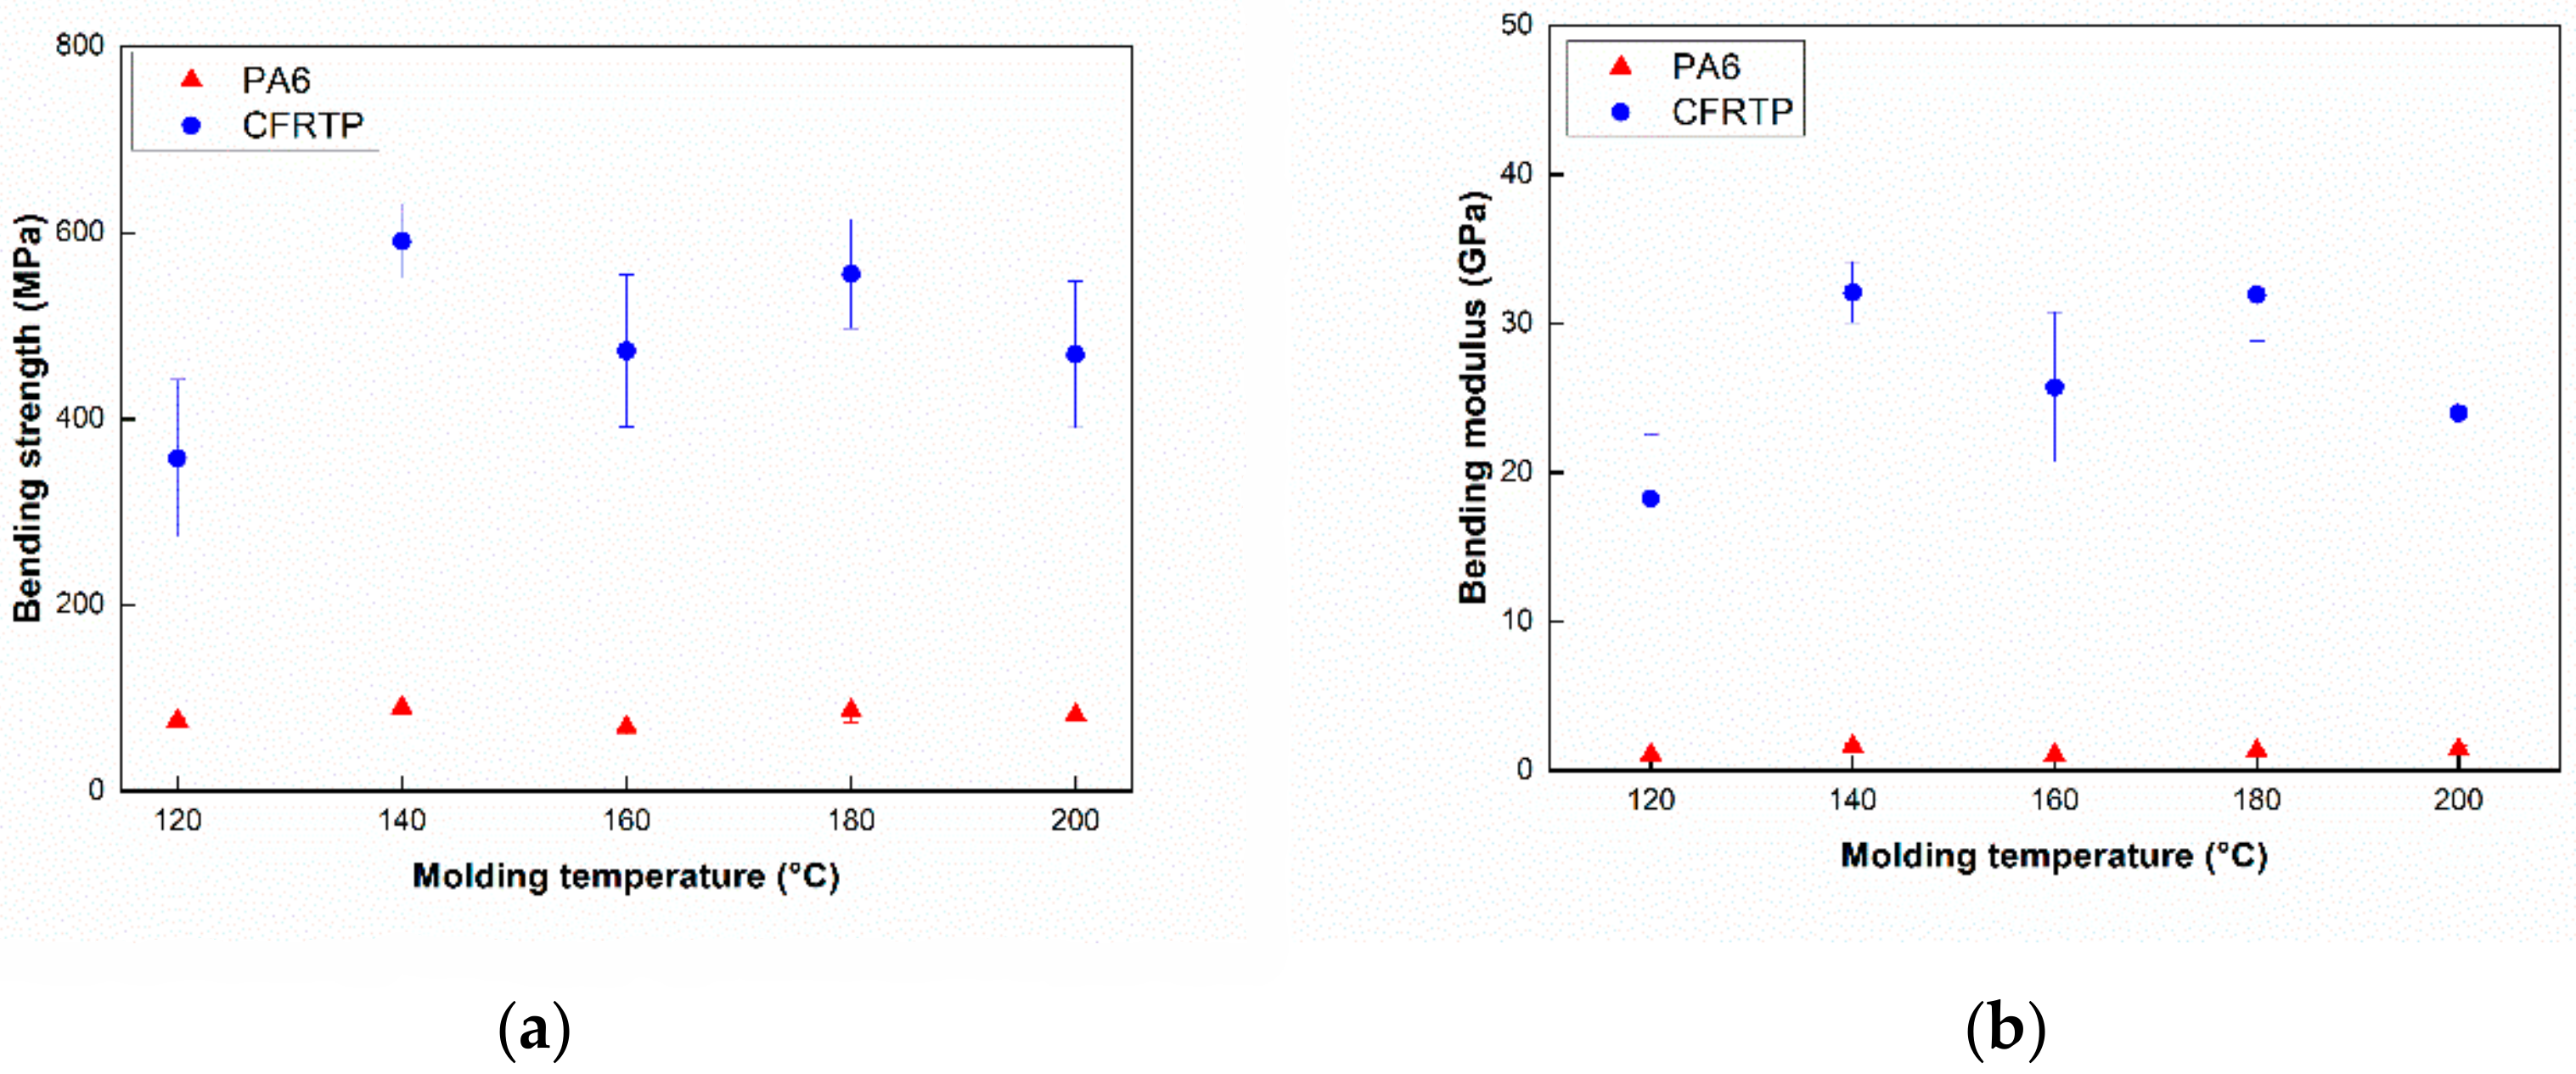
2.2.3. Three Point Bending and Impact Test
2.2.4. SEM Observation
2.2.5. DSC Measurement
3. Results and Discussion
3.1. Measurement of Content of Unreacted Monomer and Water Absorption
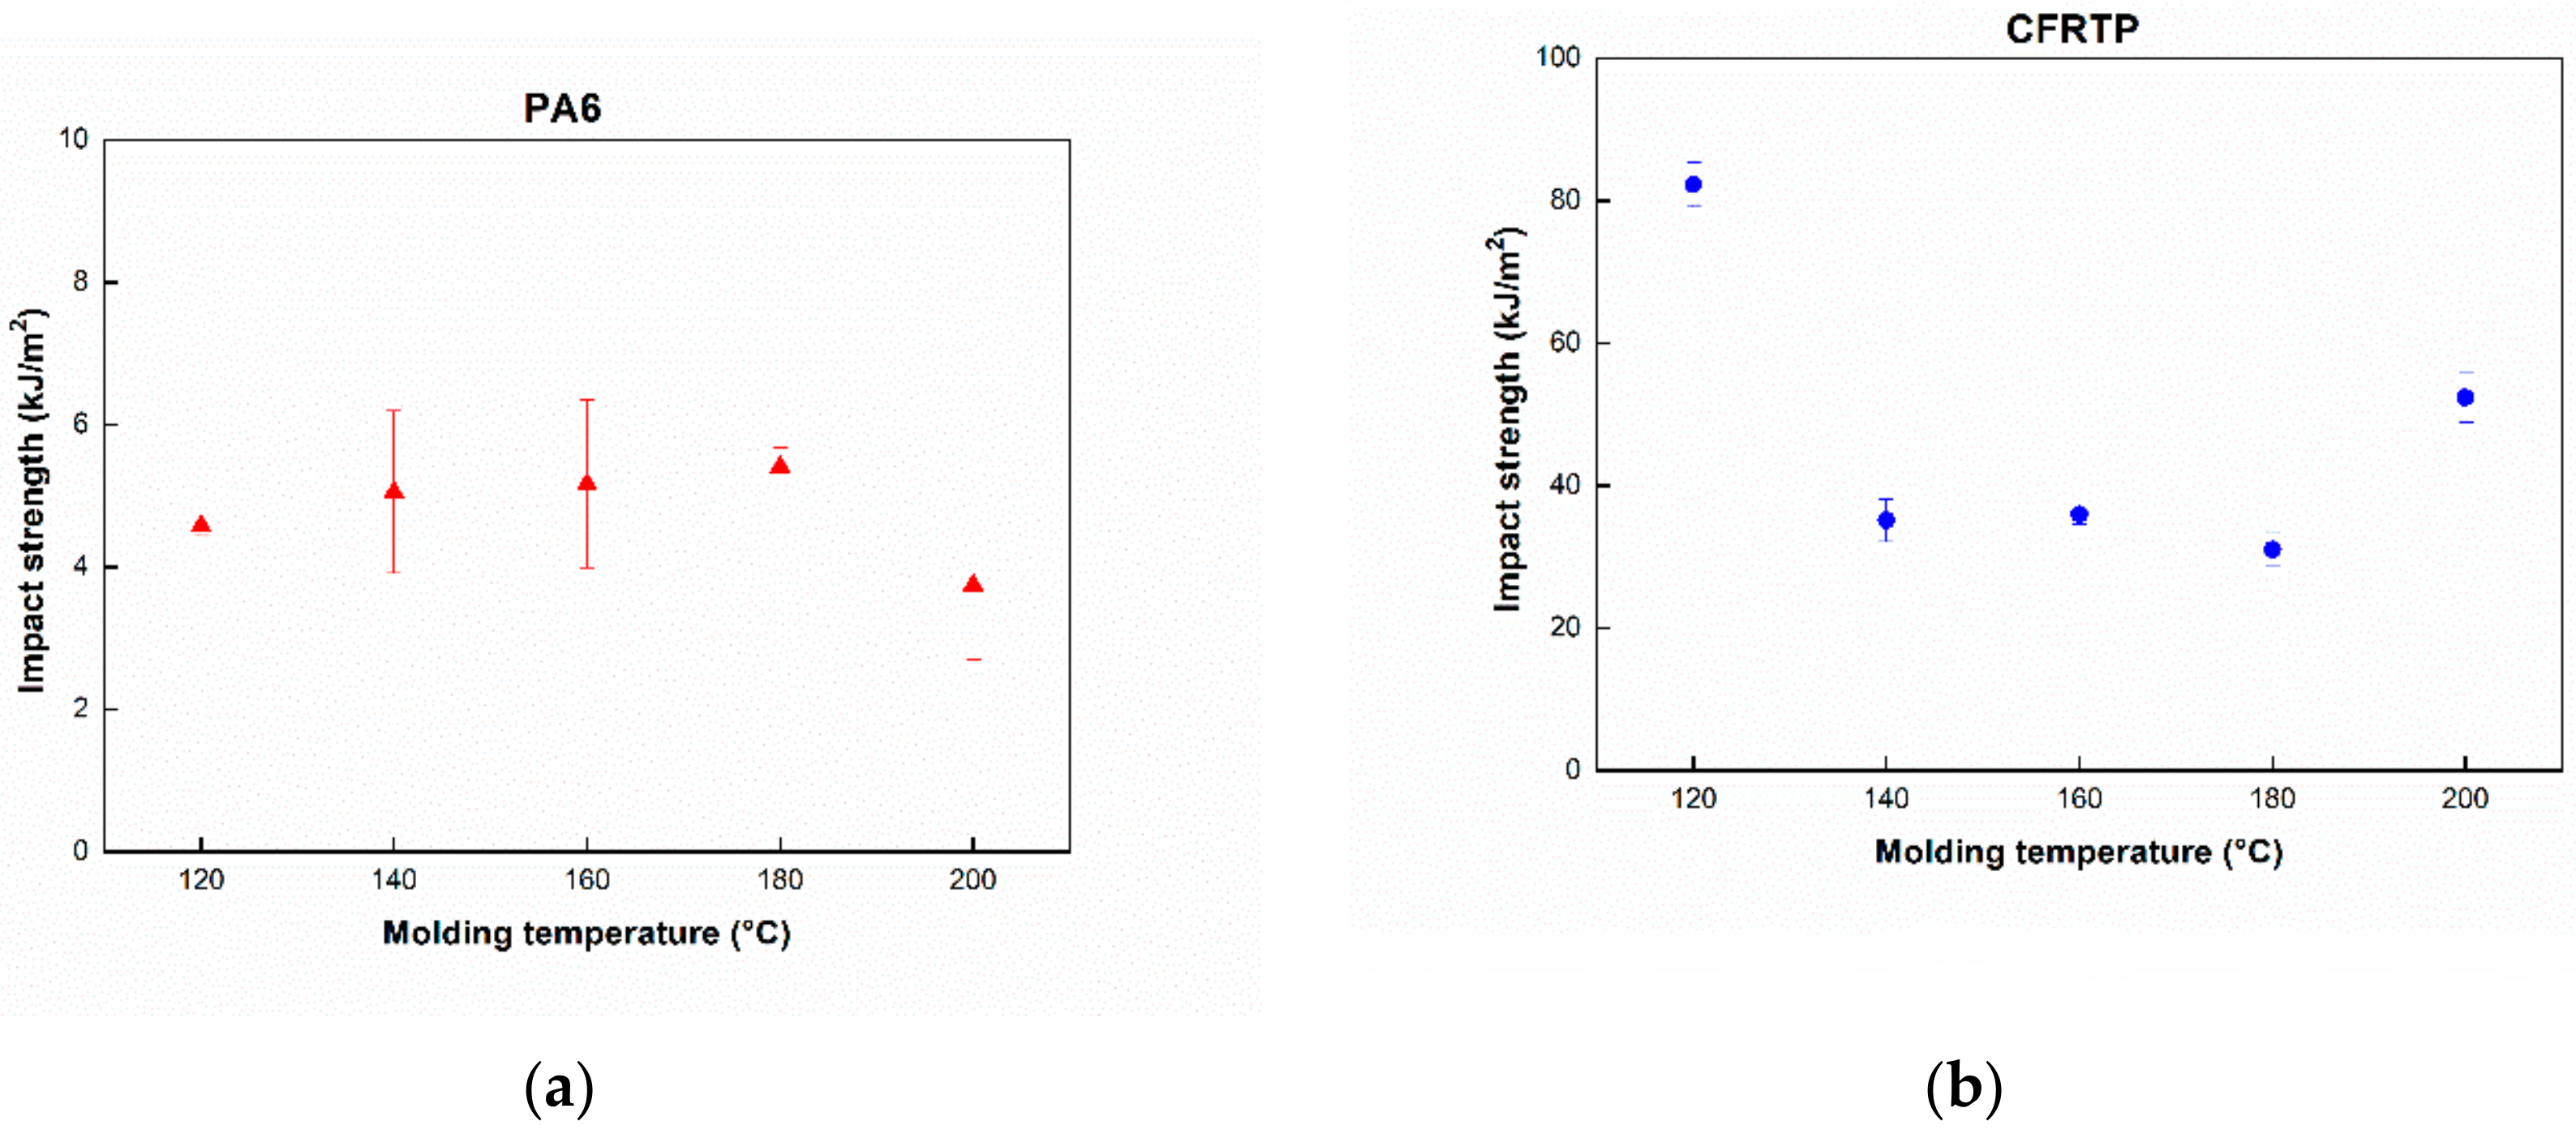
3.2. Three Point Bending and Impact Test
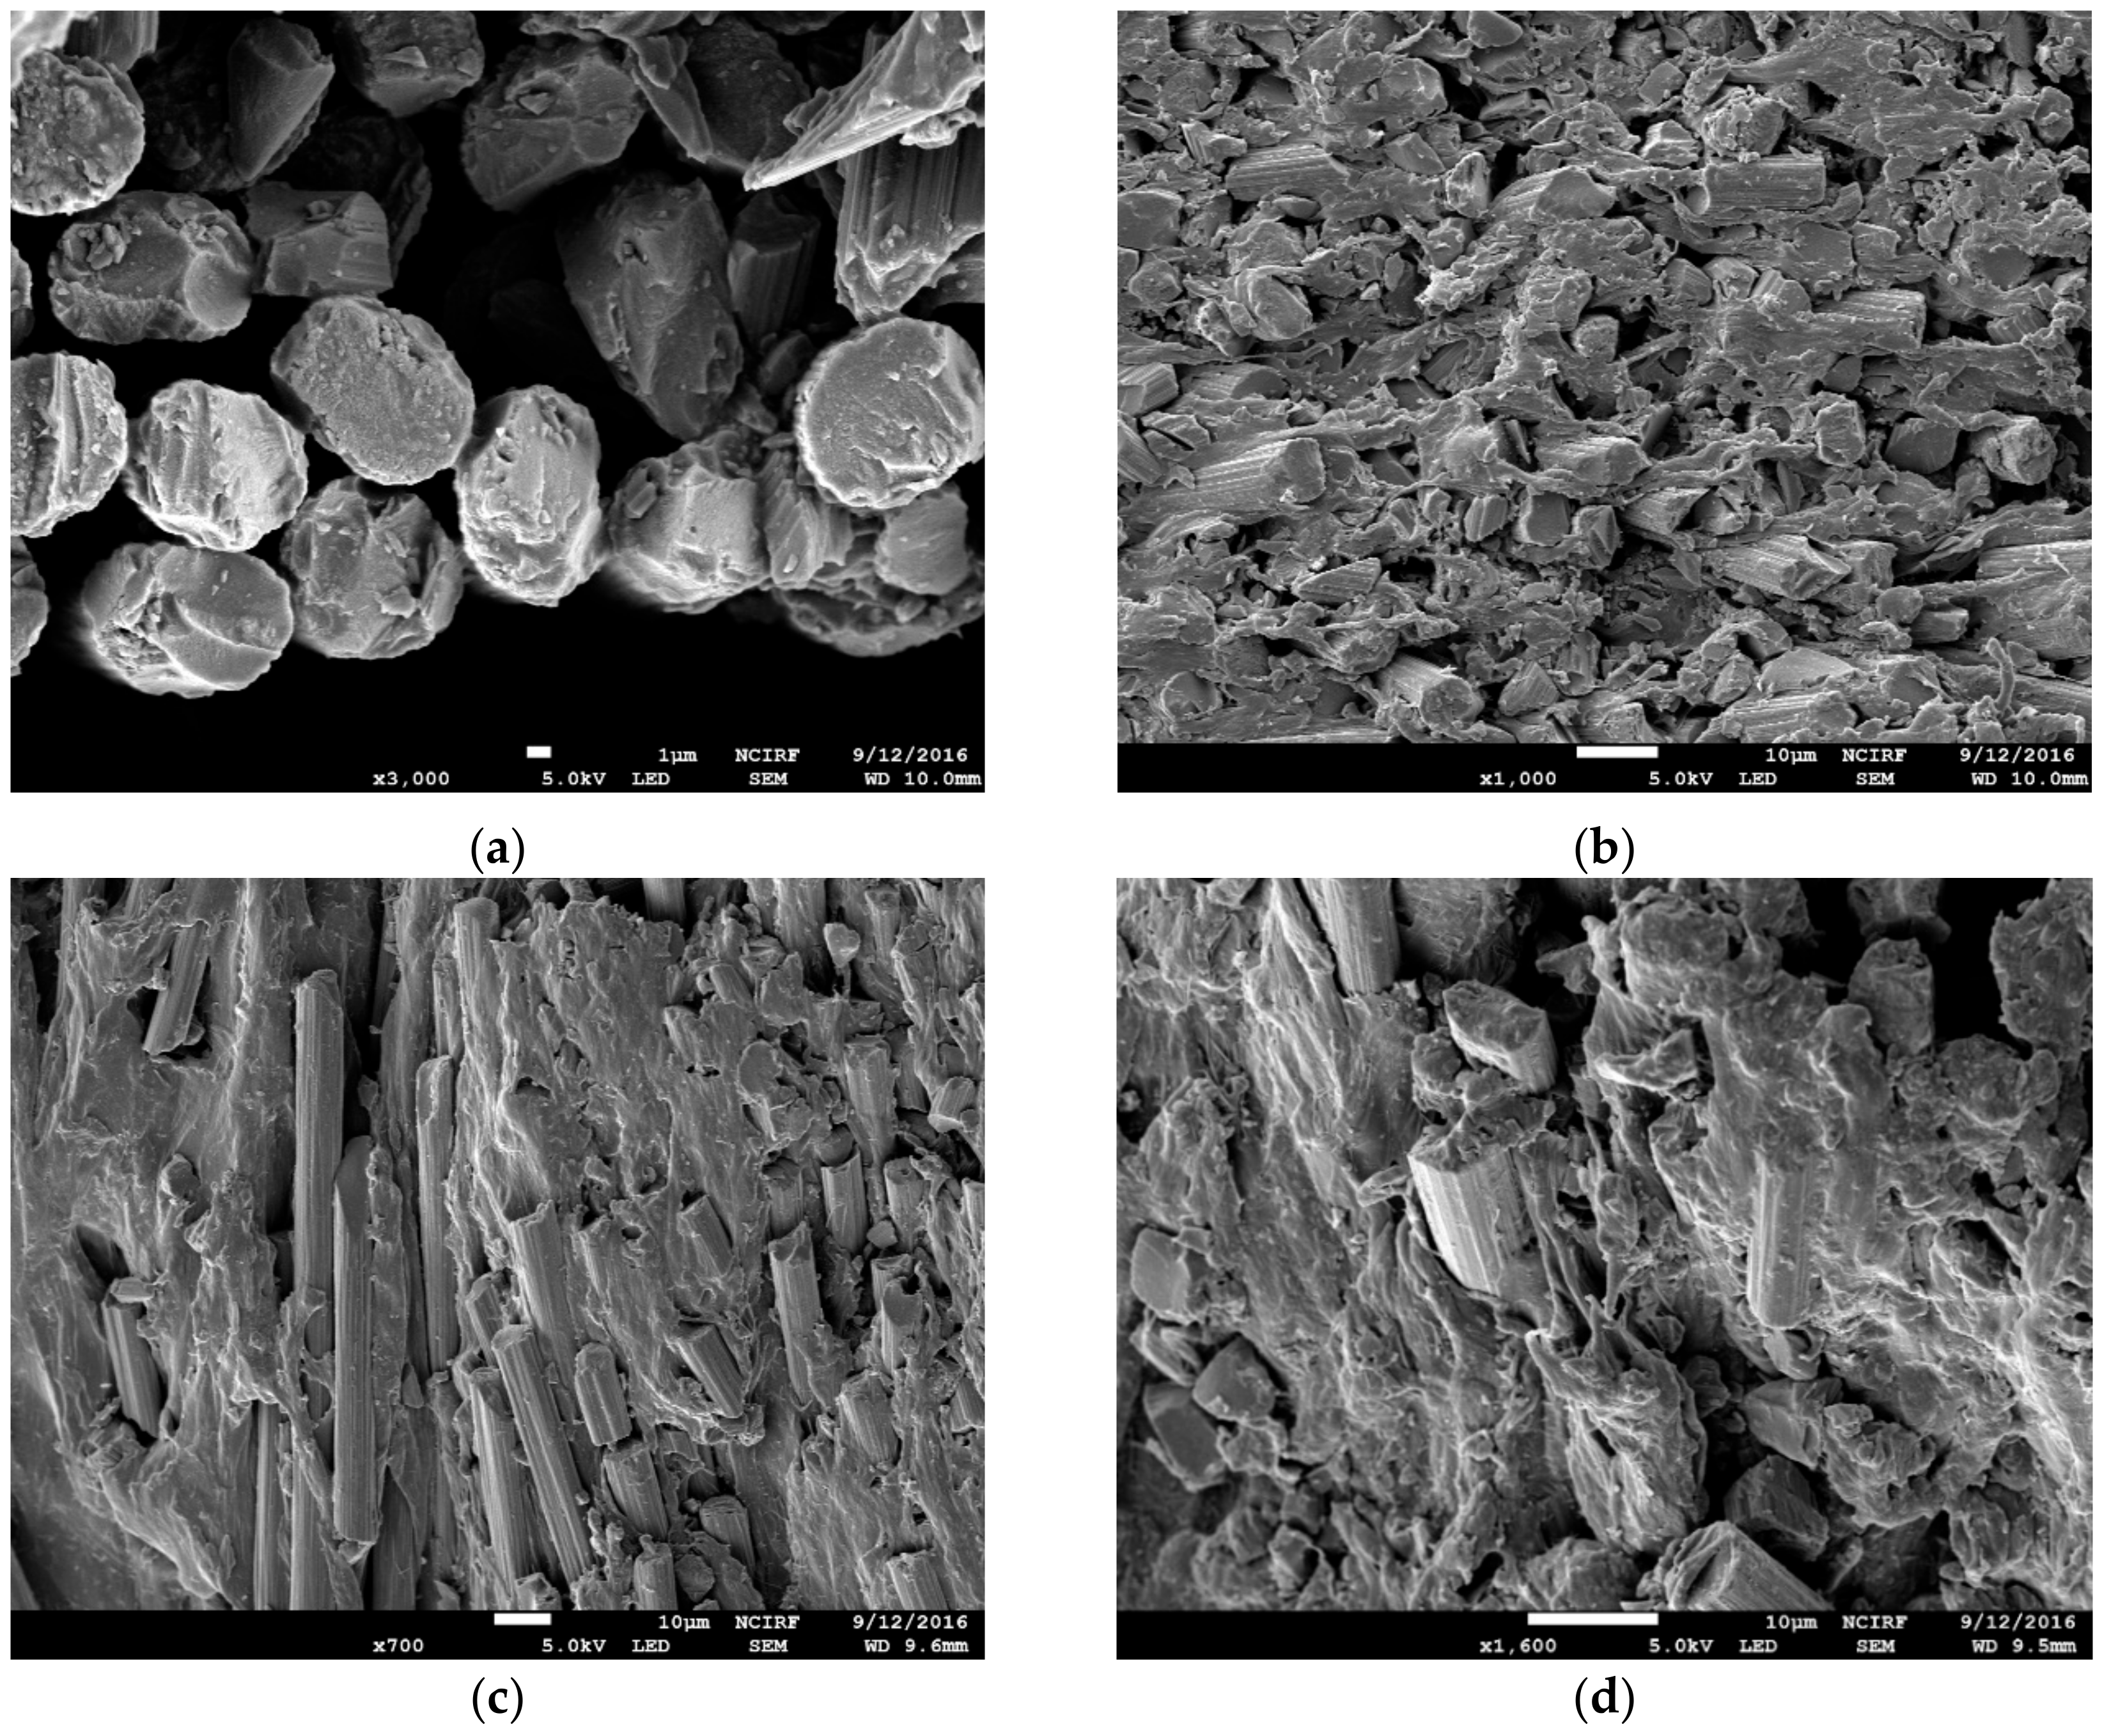
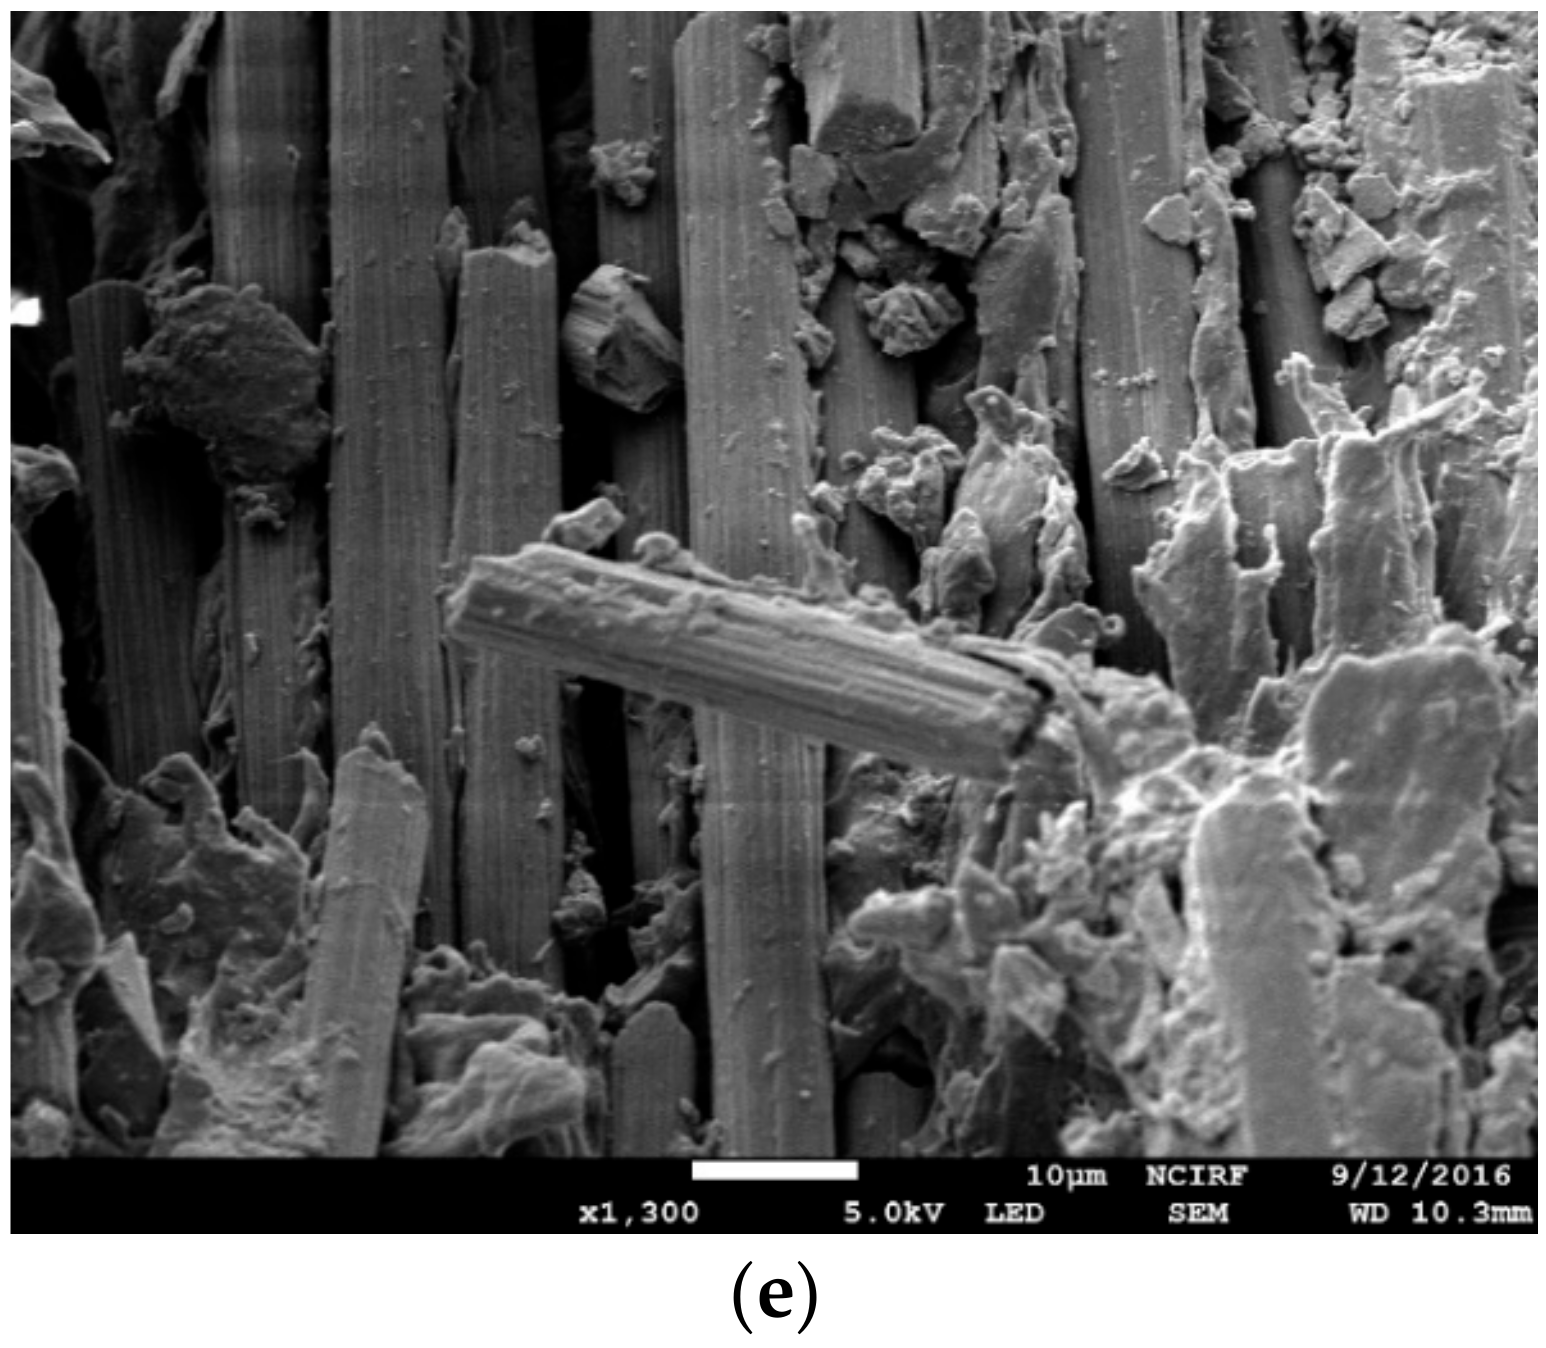
3.3. Scanning Electron Microscopy Observation
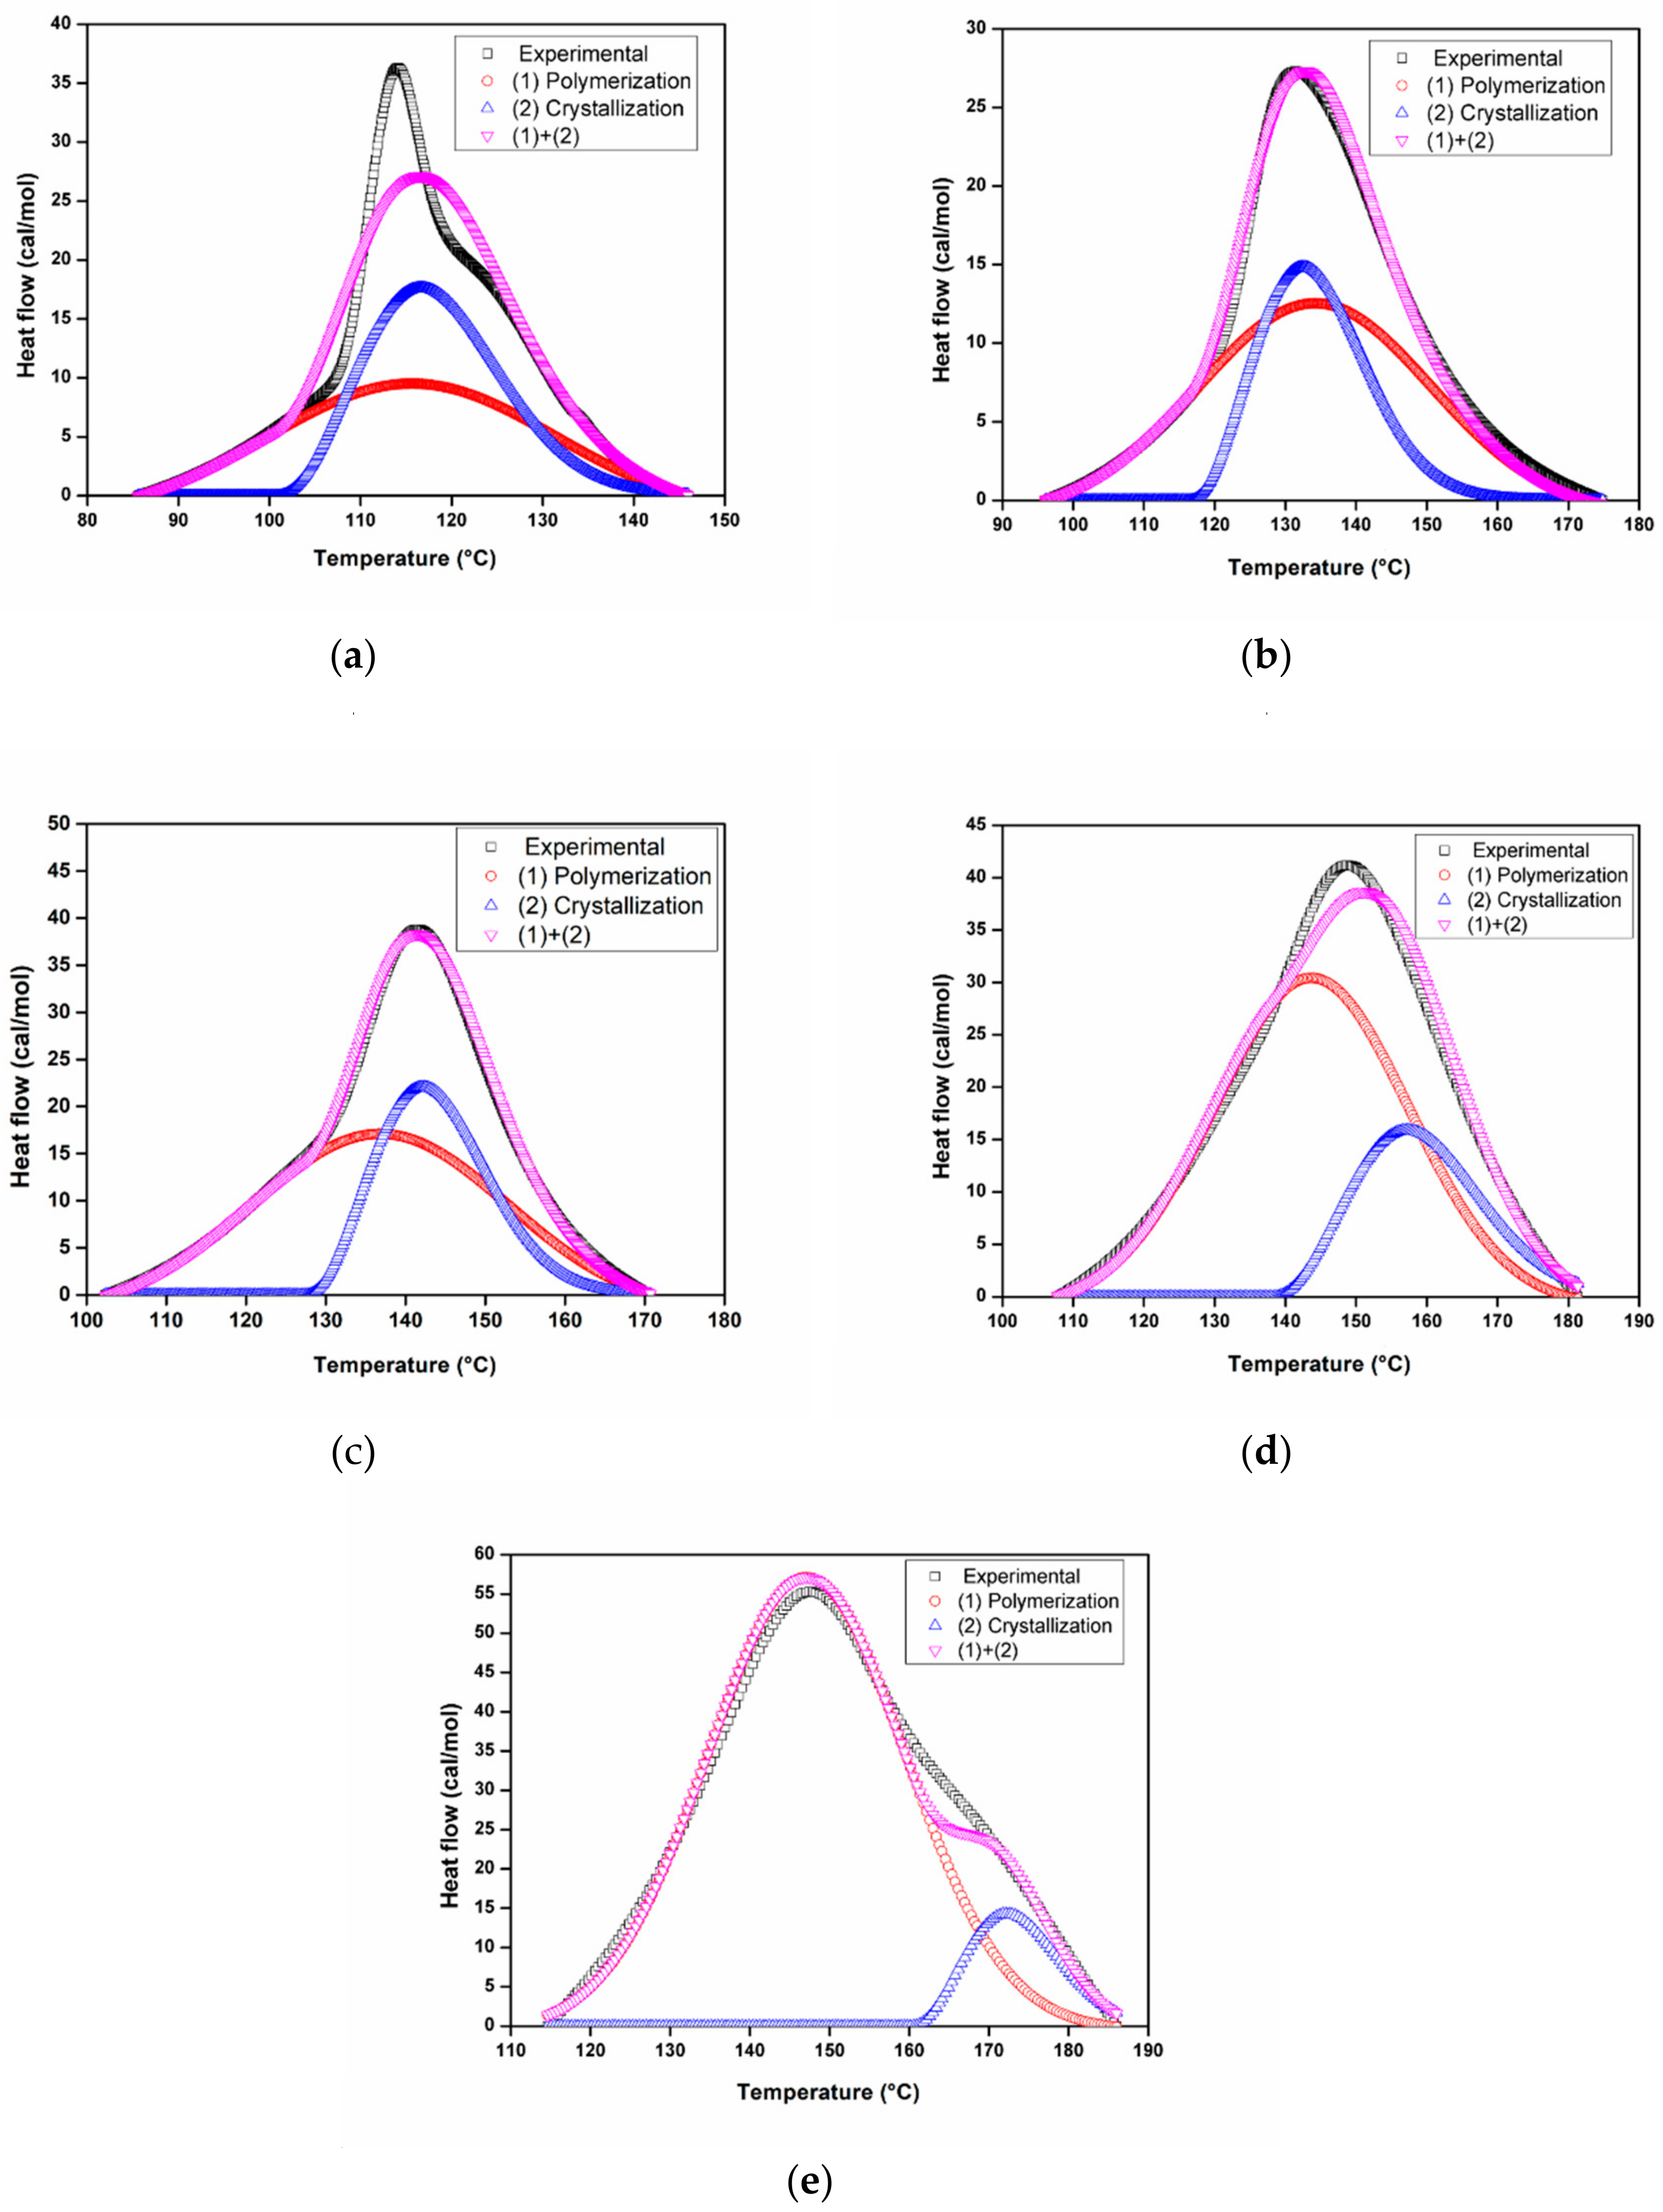
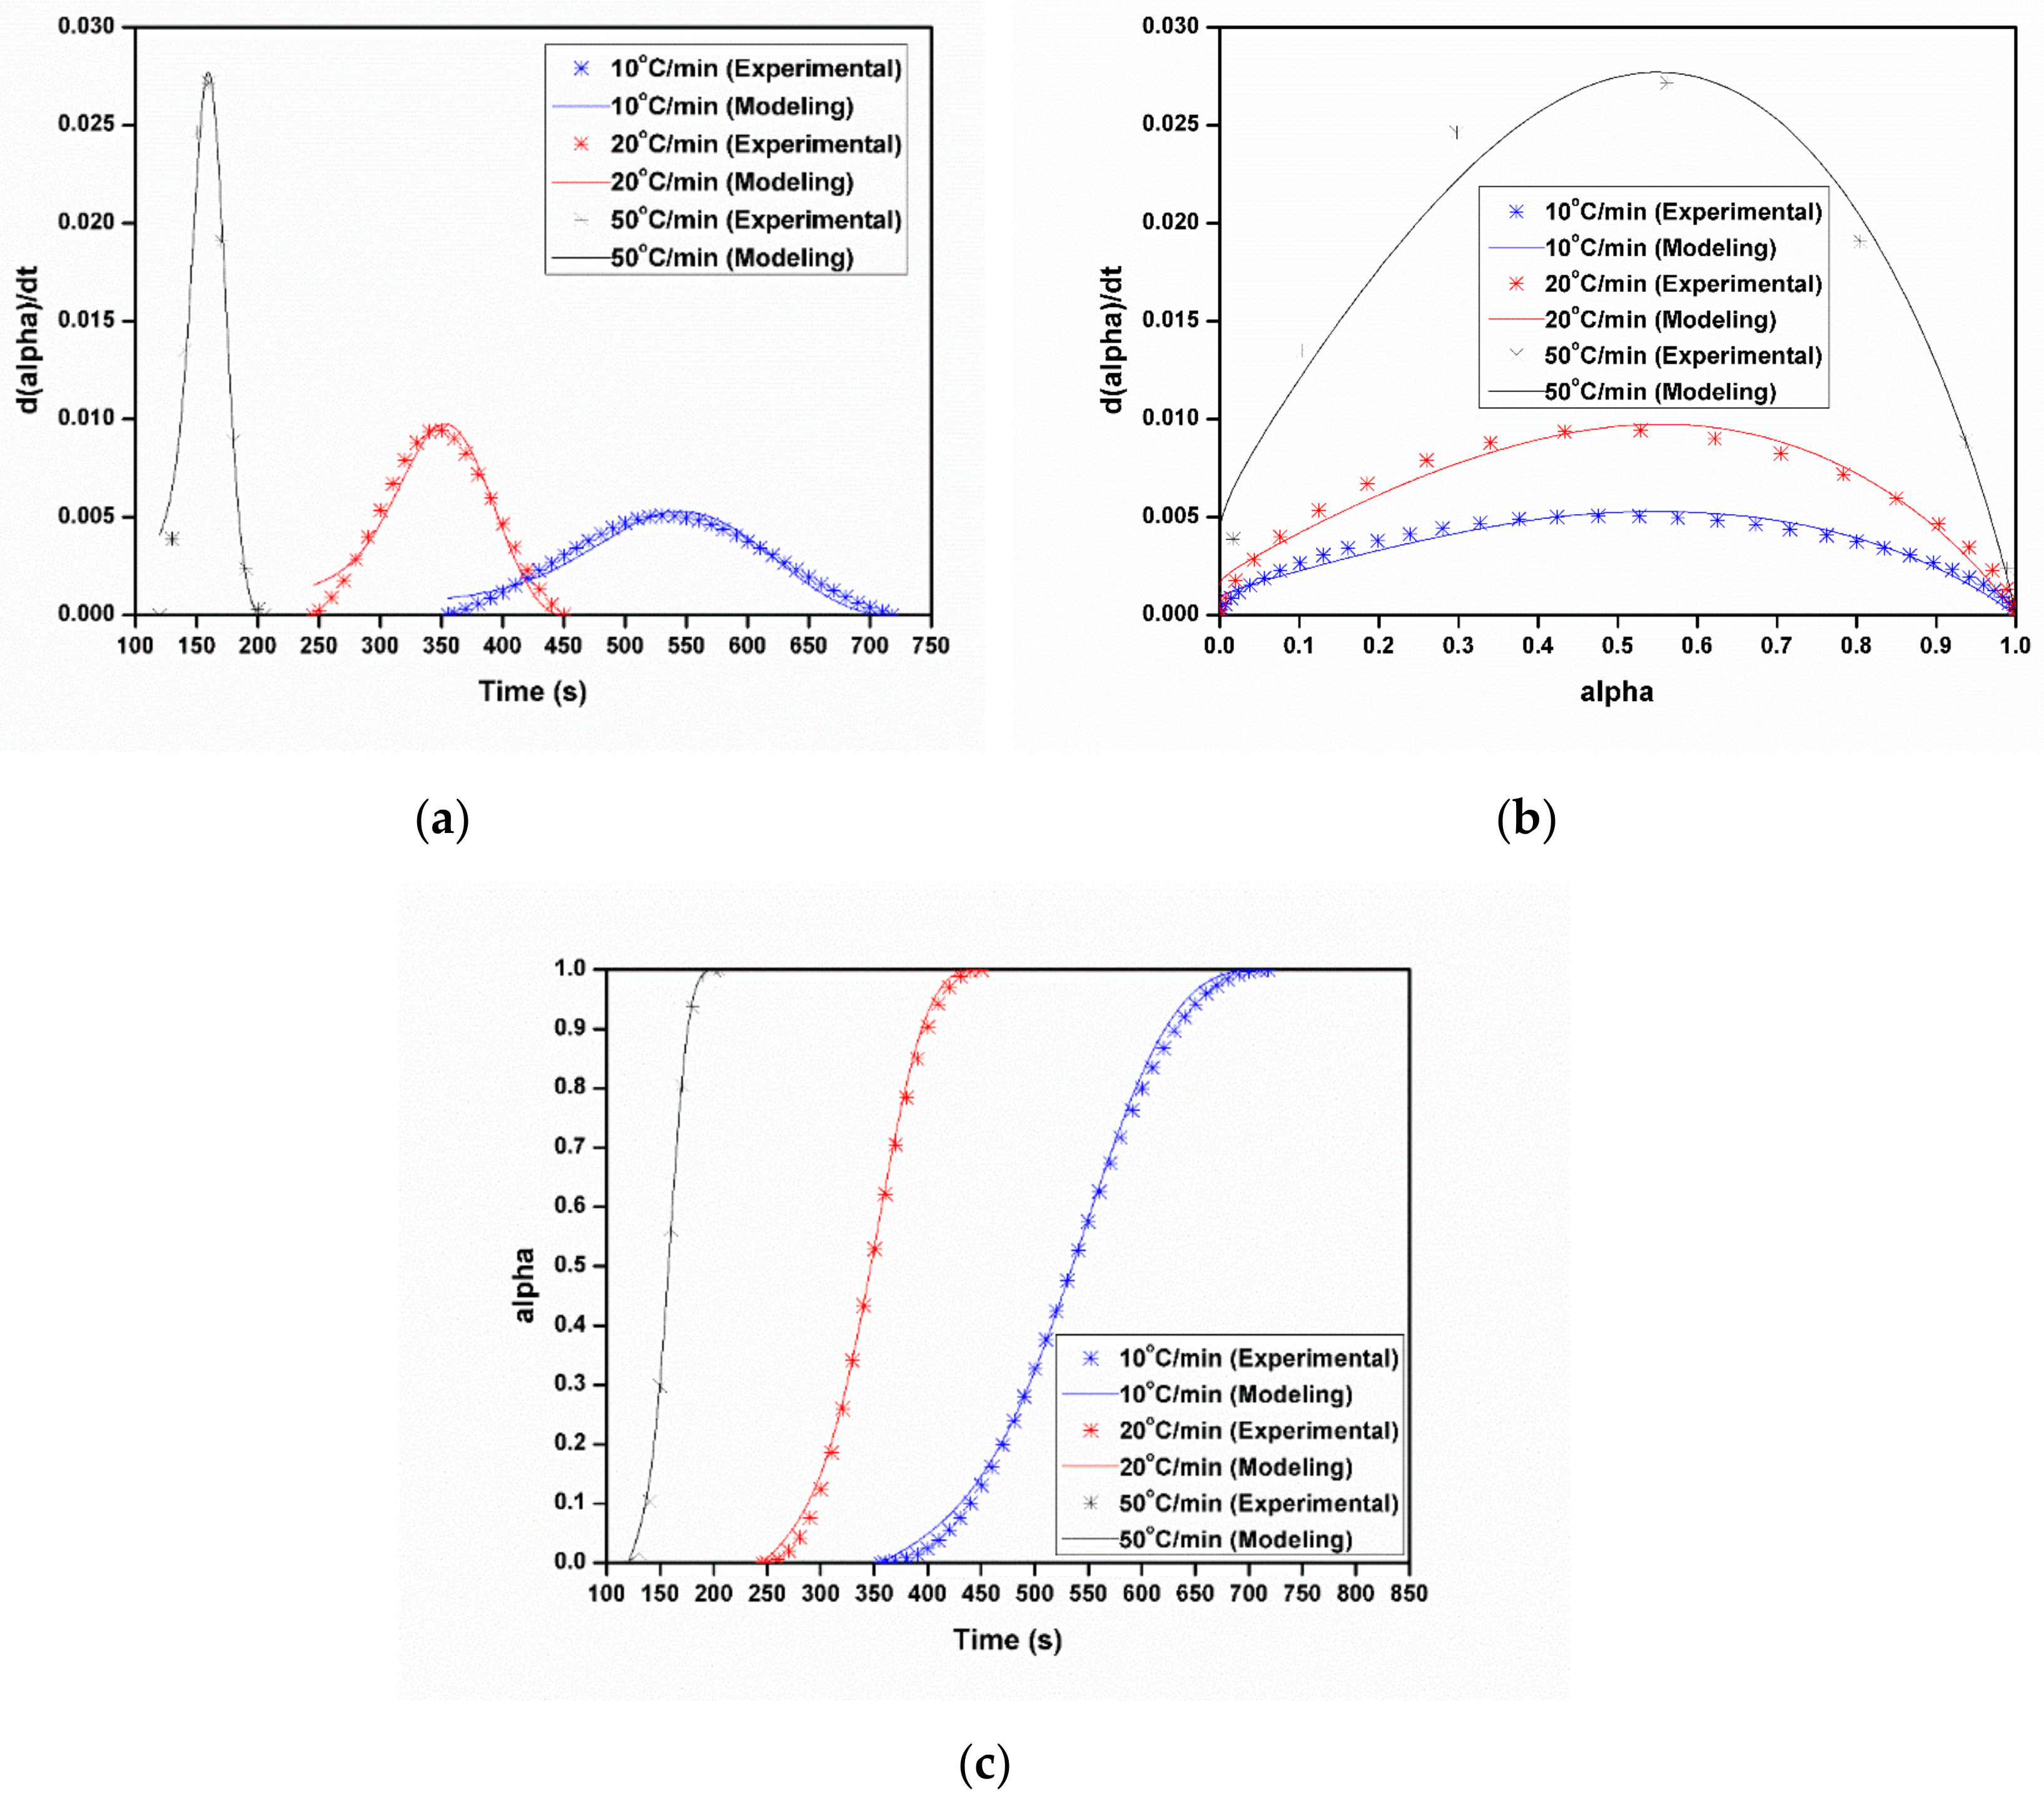
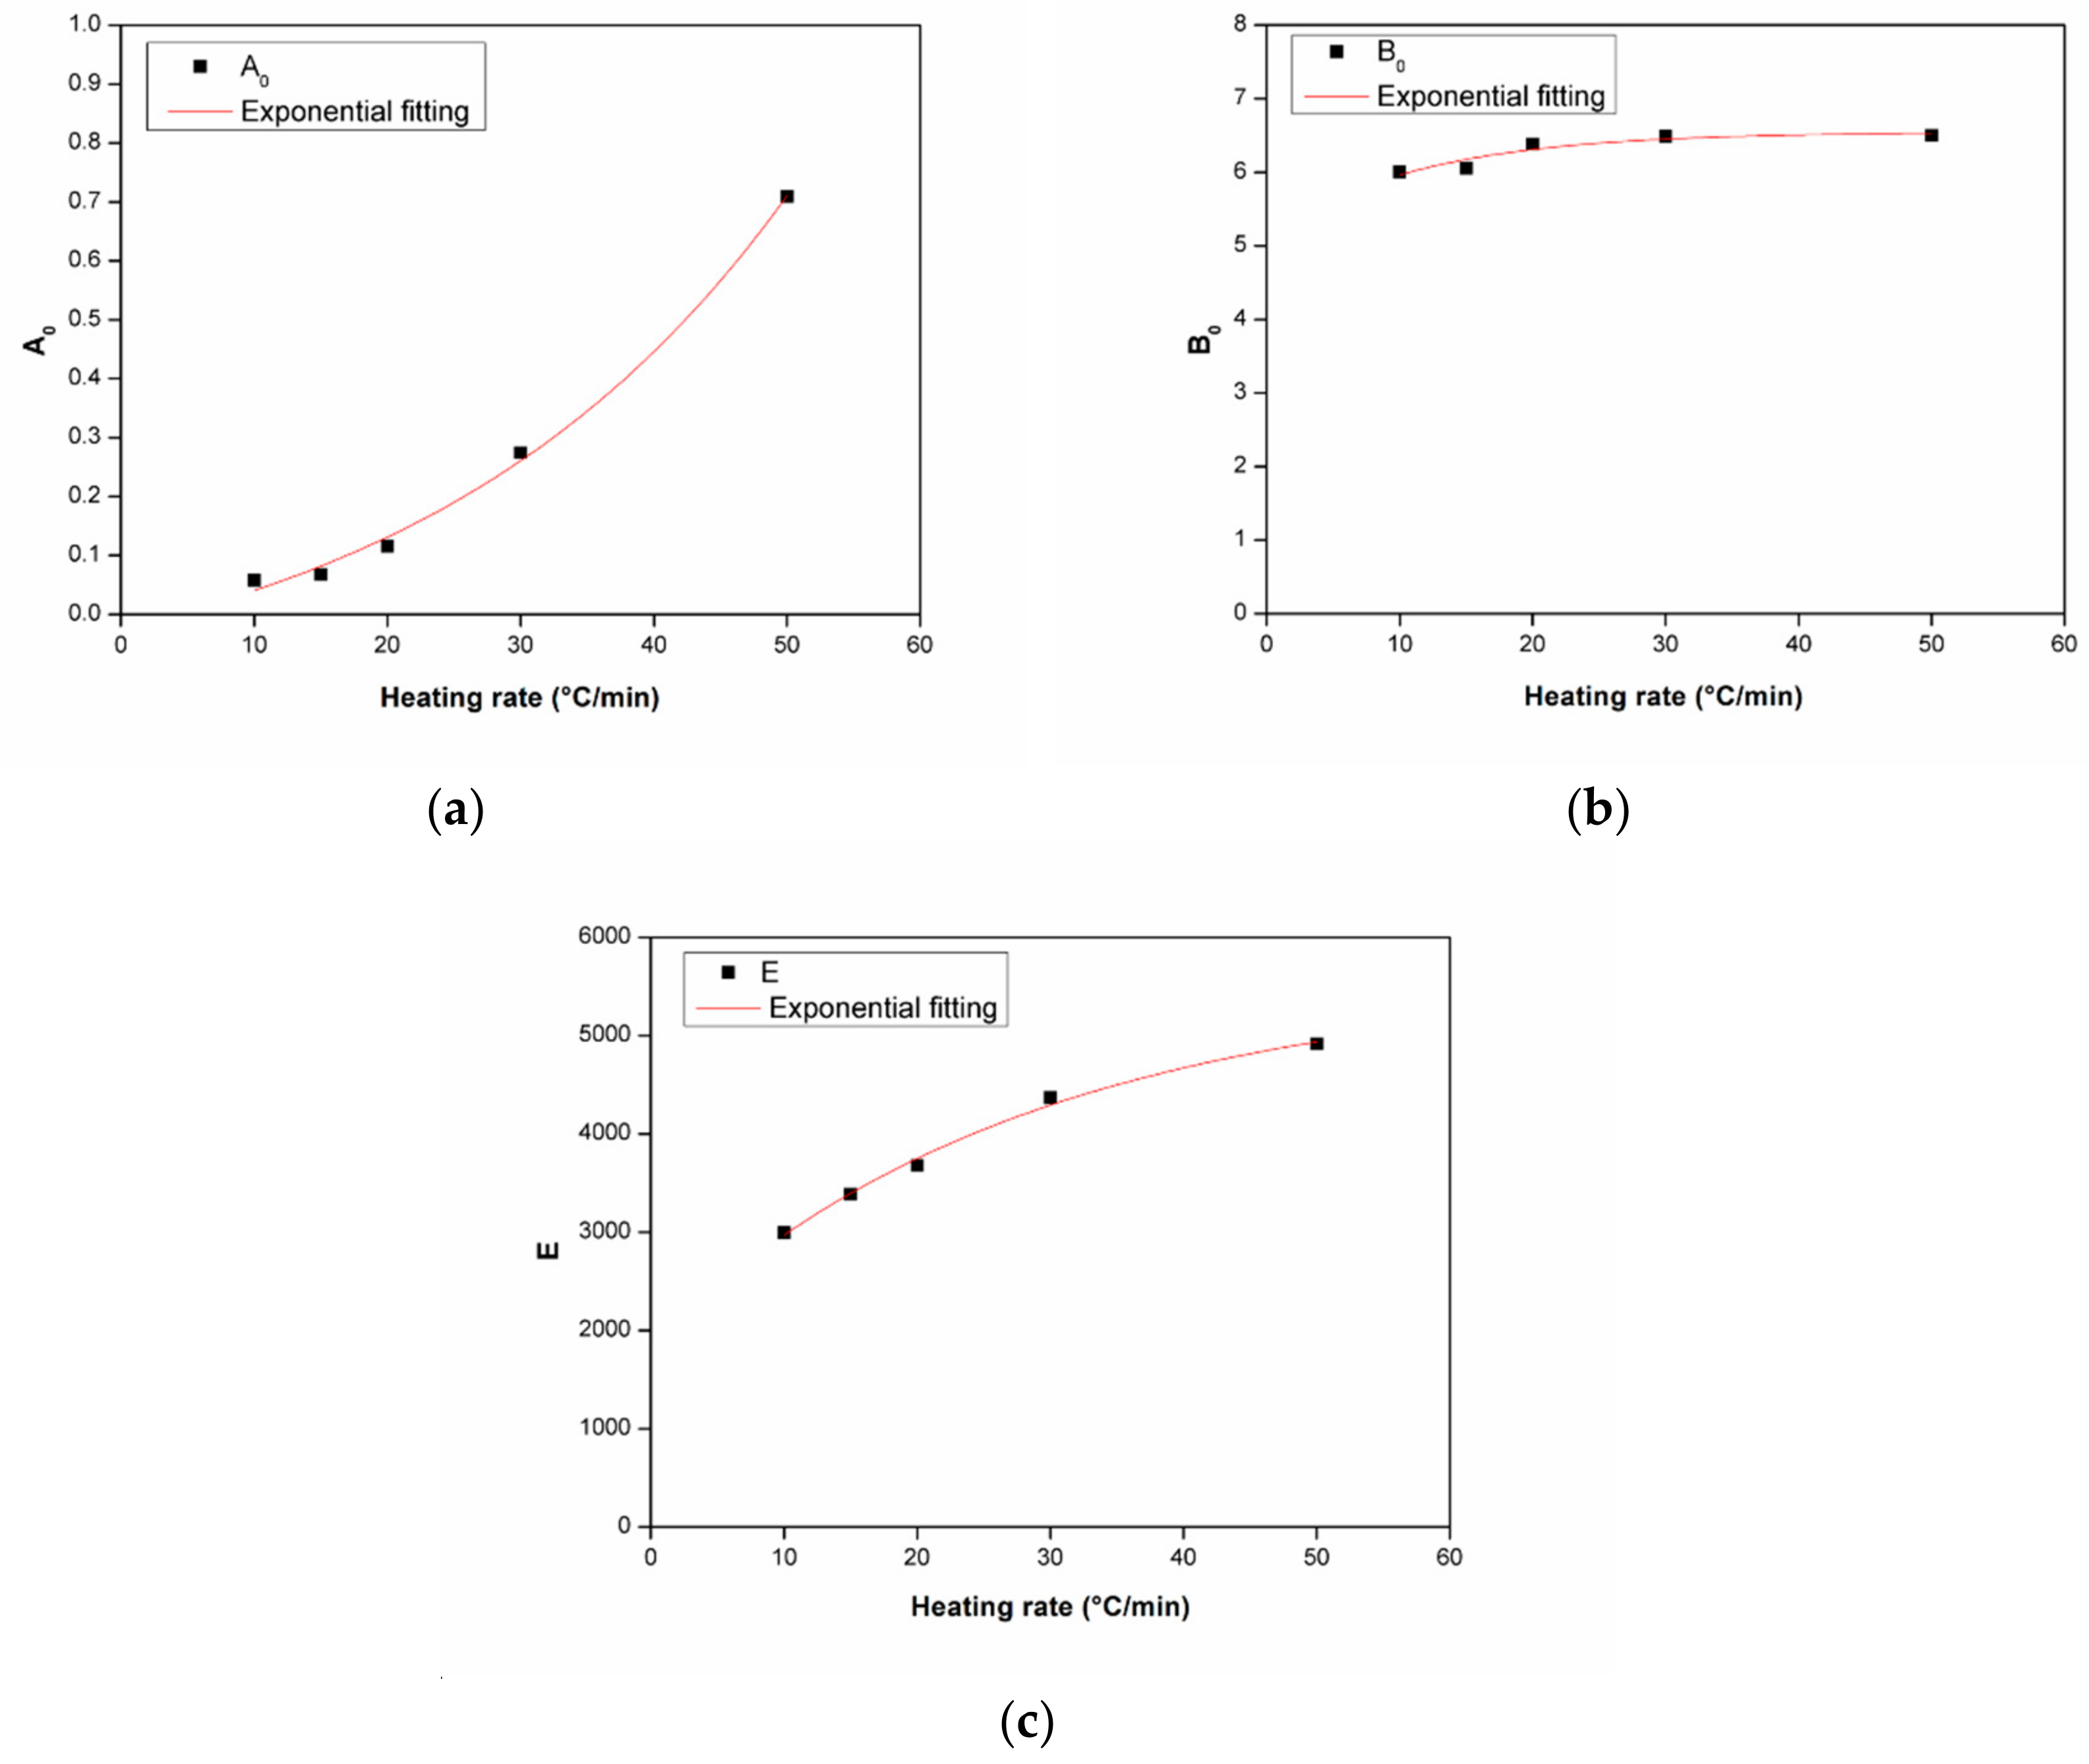
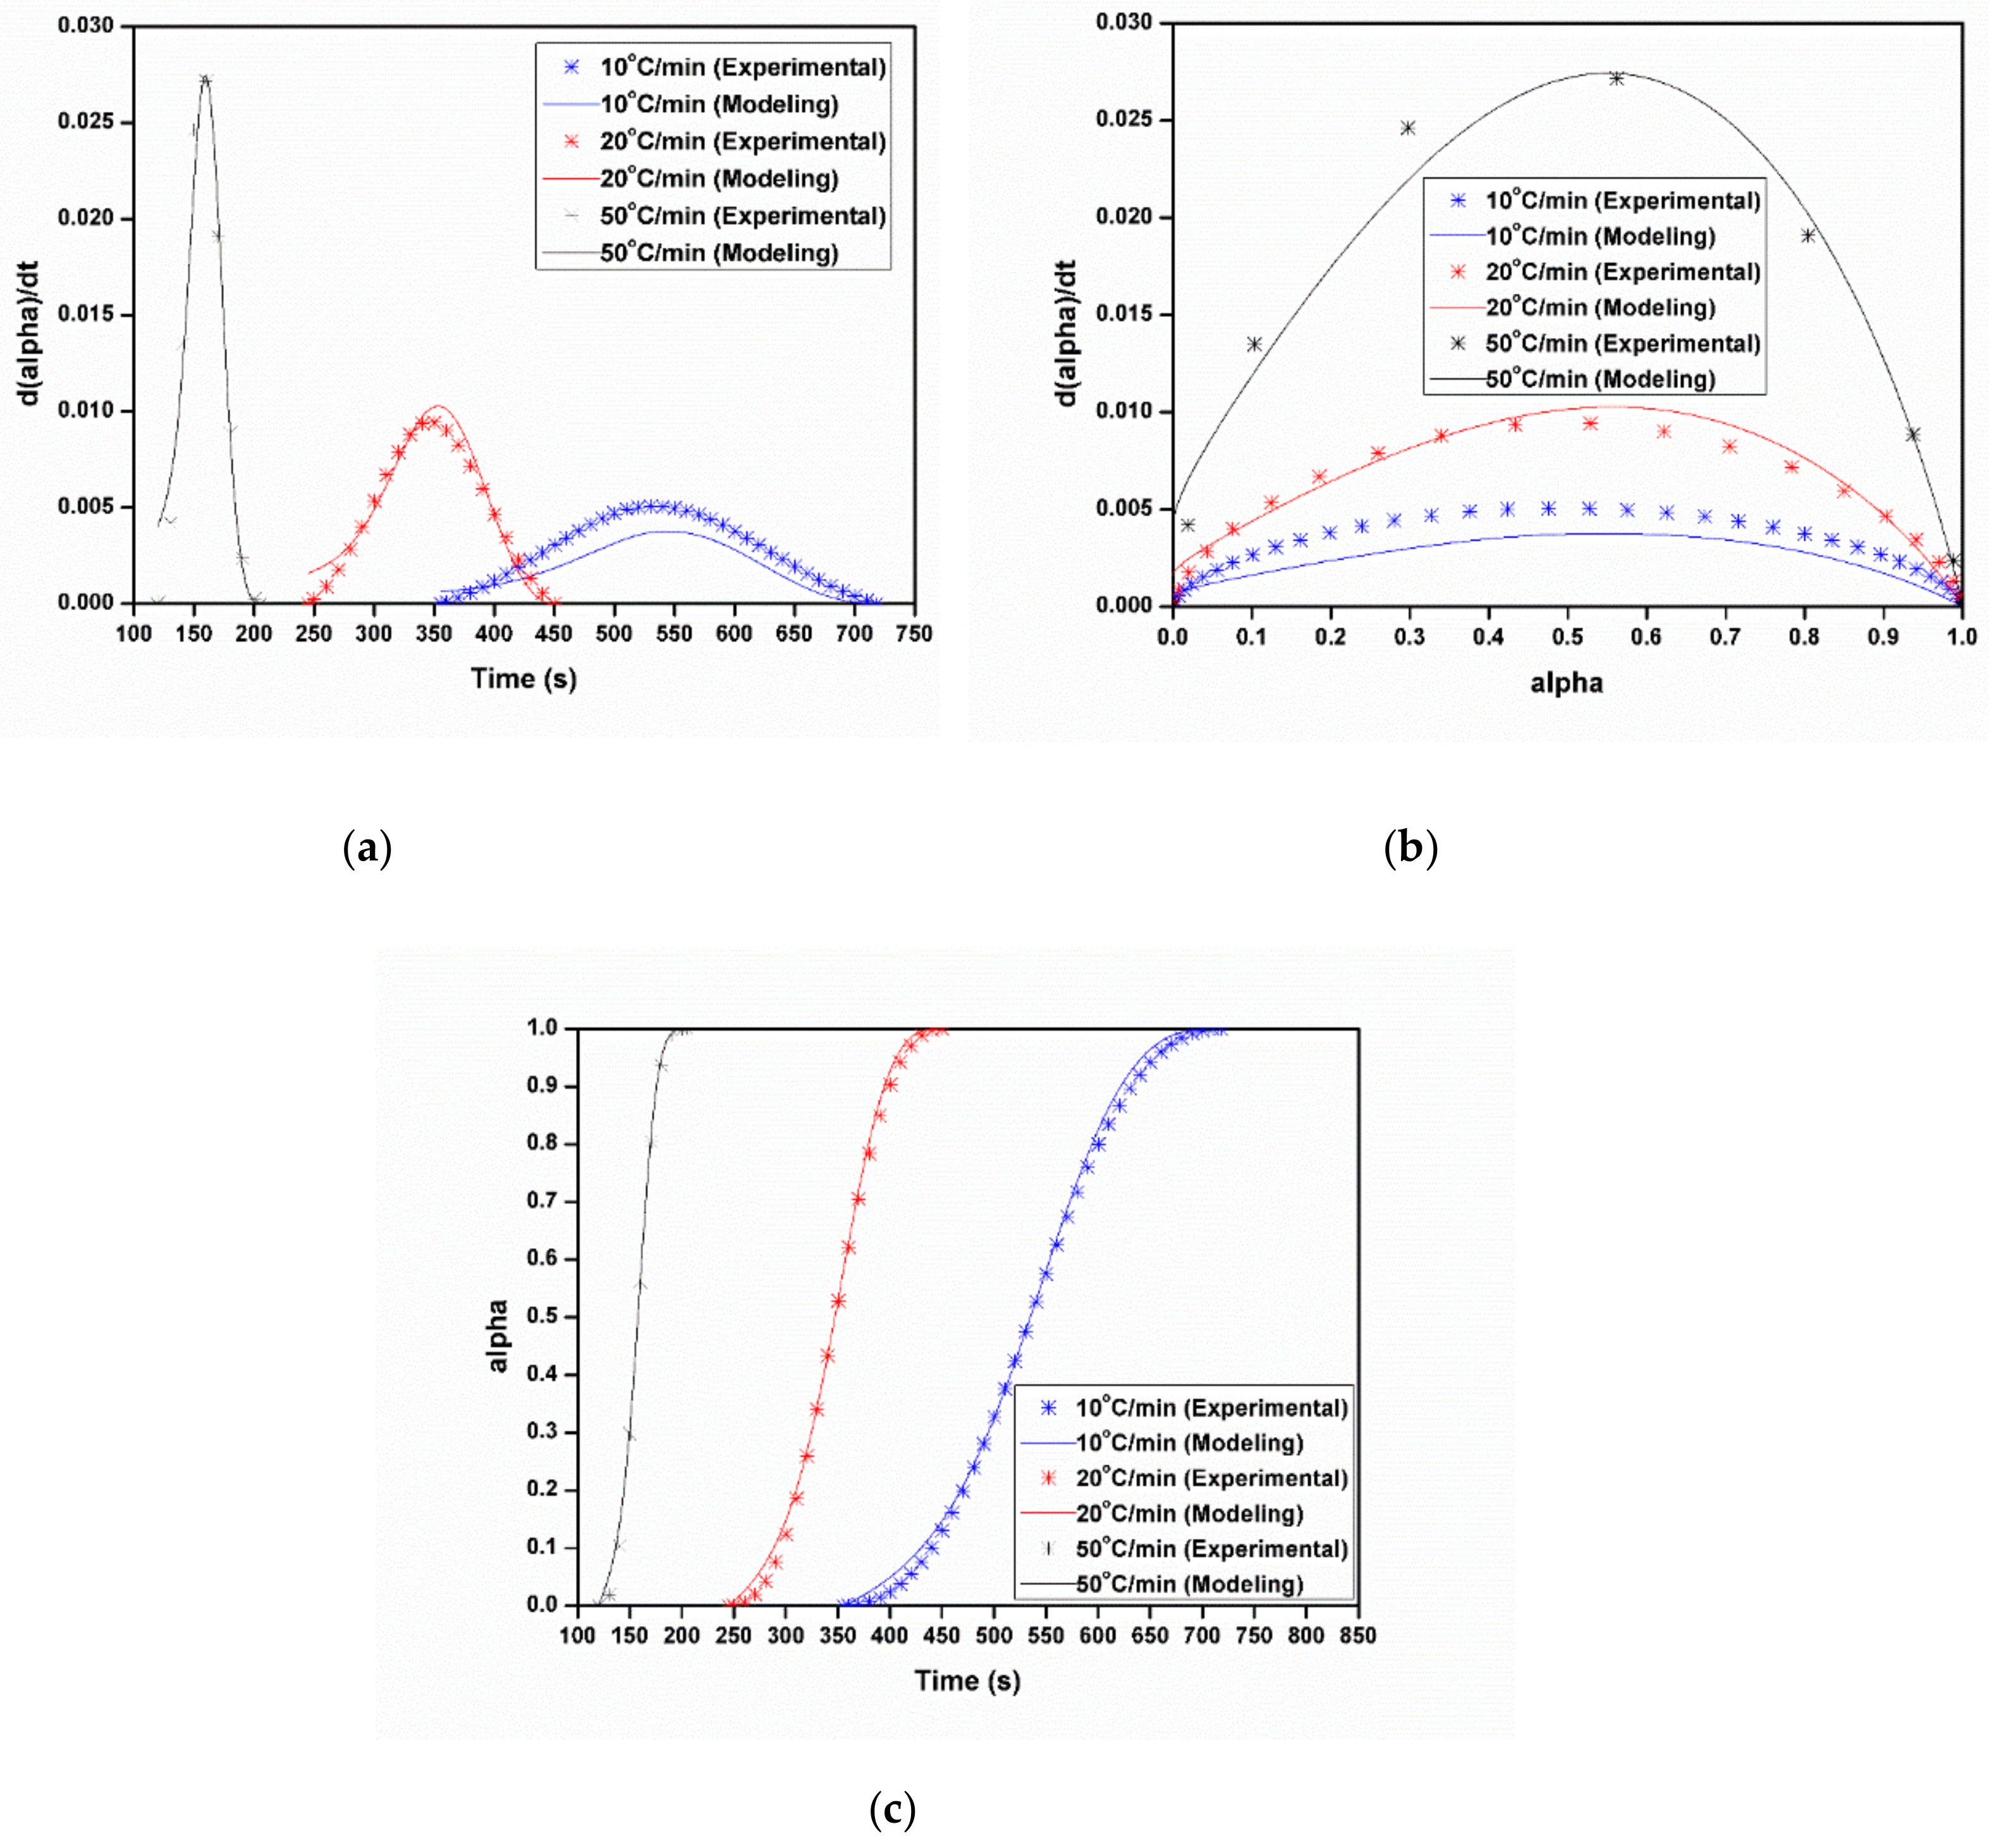
3.3.1. Dynamic Analysis
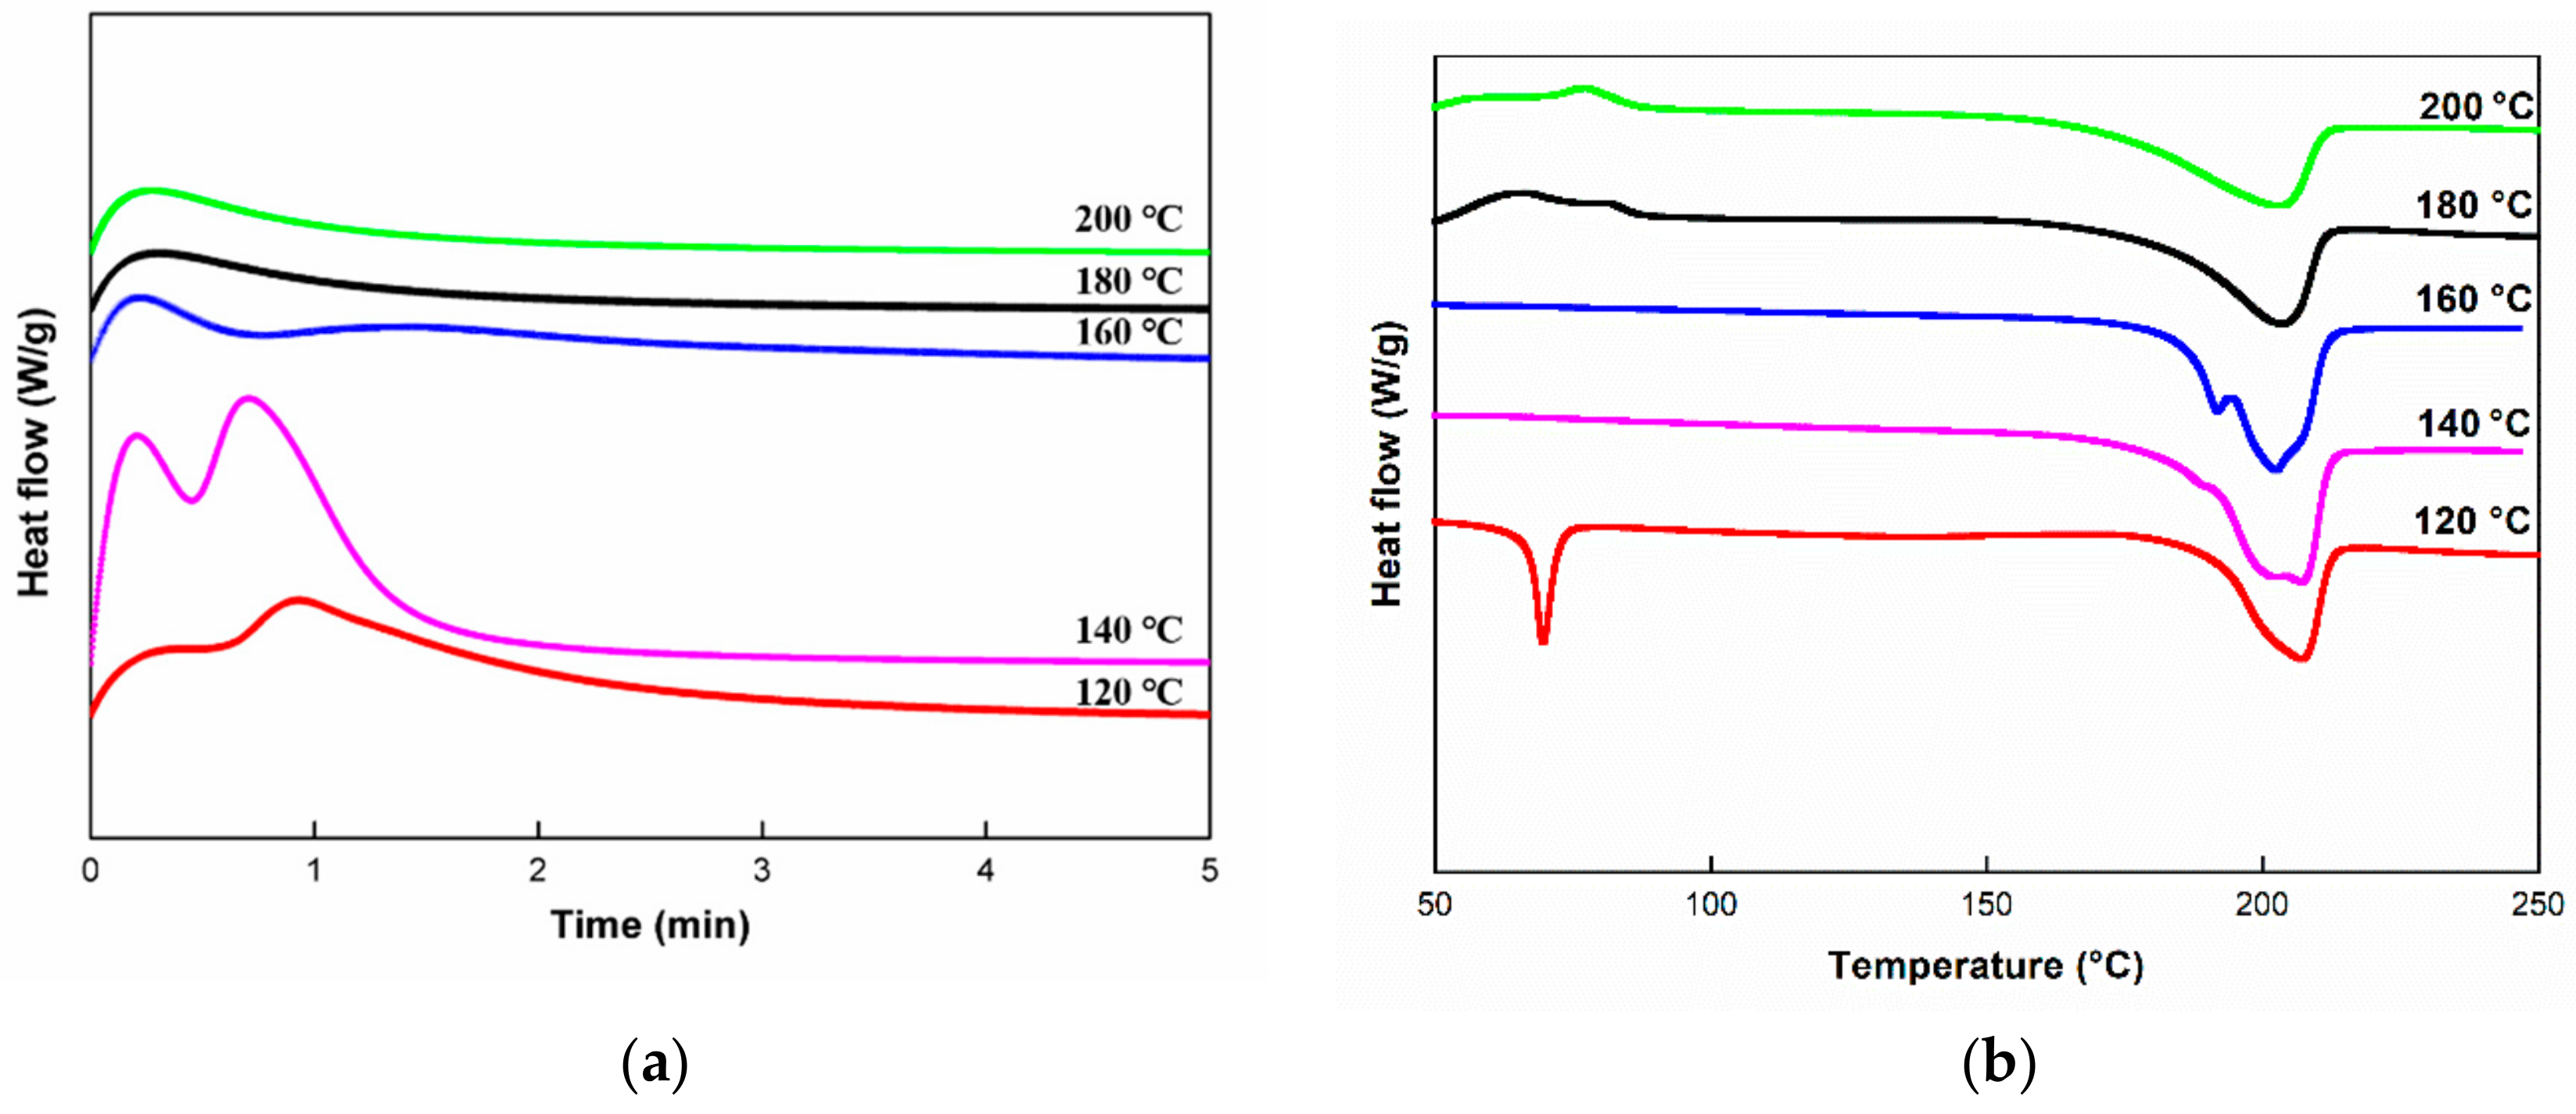
3.3.2. Isothermal Analysis
4. Concluding Remarks
Author Contributions
Acknowledgments
Conflicts of Interest
References
- Takahashi, J.; Ishikawa, T. Current Japanese activity in CFRTP for industrial application. In Proceedings of the Leuven: International Conference on Textile Composites, Leuven, Belgium, 16–20 September 2013. [Google Scholar]
- Vavilov, V.P. Modeling and characterizing impact damage in carbon fiber composites by thermal/infrared non-destructive testing. Compos. Part B Eng. 2014, 61, 1–10. [Google Scholar] [CrossRef]
- Machado, J.J.M.; Gamarra, P.M.R.; Marques, E.A.S.; da Silva, L.F.M. Improvement in impact strength of composite joints for the automotive industry. Compos. Part B Eng. 2018, 138, 243–255. [Google Scholar] [CrossRef]
- Van Rijswijk, K.; Bersee, H.E.N. Reactive processing of textile fiber-reinforced thermoplastic composites—an overview. Compos. Part A Appl. Sci. Manuf. 2007, 38, 666–681. [Google Scholar] [CrossRef]
- Nagahata, R.; Sugiyama, J.J.; Goyal, M.; Goto, M.; Honda, K.; Asai, M.; Ueda, M.; Takeuchi, K. Thermal polymerization of uniform macrocyclic ethylene terephthalate dimer. Polymer 2001, 42, 1275–1279. [Google Scholar] [CrossRef]
- Ahmadi, S.; Morshedian, J.; Hashemi, S.A.; Carreau, P.J.; Leelapornpisit, W. Novel anionic polymerization of epsilon-caprolactam towards polyamide 6 containing nanofibrils. Iran Polym. J. 2010, 19, 229–240. [Google Scholar]
- Desai, M.R.; Pandya, M.V.; Shah, C.S. Effect of initiator structure on physical and thermal-properties of nylon-6. Polym. Int. 1992, 29, 137–144. [Google Scholar] [CrossRef]
- Nagy, J.; Reith, L.; Fischlschweiger, M.; Steinbichler, G. Influence of fiber orientation and geometry variation on flow phenomena and reactive polymerization of epsilon-caprolactam. Chem. Eng. Sci. 2015, 128, 1–10. [Google Scholar] [CrossRef]
- Barhoumi, N.; Maazouz, A.; Jaziri, M.; Abdelhedi, R. Polyamide from lactams by reactive rotational molding via anionic ring-opening polymerization: Optimization of processing parameters. Express Polym. Lett. 2013, 7, 76–87. [Google Scholar] [CrossRef]
- Mohammadian-Gezaz, S.; Ghasemi, I.; Oromiehie, A. Preparation of anionic Polymerized polyamide 6 using internal mixer: The effect of styrene maleic anhydride as a macroactivator. Polym. Test. 2009, 28, 534–542. [Google Scholar] [CrossRef]
- Kim, K.J.; Hong, D.S.; Tripathy, A.R. Kinetics of adiabatic anionic copolymerization of epsilon-caprolactam in the presence of various activators. J. Appl. Polym. Sci. 1997, 66, 1195–1207. [Google Scholar] [CrossRef]
- Meng, F.B.; Huang, F.; Guo, Y.F.; Chen, J.J.; Chen, X.N.; Hui, D.; He, P.; Zhou, X.; Zhou, Z. In situ intercalation polymerization approach to polyamide-6/graphite nanoflakes for enhanced thermal conductivity. Compos. Part B Eng. 2017, 117, 165–173. [Google Scholar] [CrossRef]
- Pillay, S.; Vaidya, U.K.; Janowski, G.M. Liquid molding of carbon fabric-reinforced nylon matrix composite laminates. J. Thermoplast Comp. 2005, 18, 509–527. [Google Scholar] [CrossRef]
- Van Rijswijk, K.; Bersee, H.E.N.; Jager, W.F.; Picken, S.J. Optimisation of anionic polyamide-6 for vacuum infusion of thermoplastic composites: Choice of activator and initiator. Compos. Part A Appl. Sci. Manuf. 2006, 37, 949–956. [Google Scholar] [CrossRef]
- Zheng, D.; Tang, G.S.; Zhang, H.B.; Yu, Z.Z.; Yavari, F.; Koratkar, N.; Lim, S.-H.; Lee, M.-W. In situ thermal reduction of graphene oxide for high electrical conductivity and low percolation threshold in polyamide 6 nanocomposites. Compos. Sci. Technol. 2012, 72, 284–289. [Google Scholar] [CrossRef]
- Gong, Y.; Liu, A.D.; Yang, G.S. Polyamide single polymer composites prepared via in situ anionic polymerization of epsilon-caprolactam. Compos. Part A Appl. Sci. Manuf. 2010, 41, 1006–1011. [Google Scholar] [CrossRef]
- Gong, Y.; Yang, G.S. All-polyamide composites prepared by resin transfer molding. J. Mater. Sci. 2010, 45, 5237–5243. [Google Scholar] [CrossRef]
- Ze, K.; Ming, B.Y.; Wei, Y.; Zheng, Y.L.; Bang, H.X. Investigation on the reactive processing of textile-ramie fiber reinforced anionic polyamide-6 composites. Compos. Sci. Technol. 2015, 110, 188–195. [Google Scholar]
- Kim, B.J.; Cha, S.H.; Park, Y.B. Ultra-high-speed processing of nanomaterial-reinforced woven carbon fiber/polyamide 6 composites using reactive thermoplastic resin transfer molding. Compos. Part B Eng. 2018, 143, 36–46. [Google Scholar] [CrossRef]
- Tohidi, S.D.; Rocha, A.M.; Dencheva, N.V.; Denchev, Z. Microstructural-mechanical properties relationship in single polymer laminate composites based on polyamide 6. Compos. Part B Eng. 2018, 153, 315–324. [Google Scholar] [CrossRef]
- Li, Y.; Hiroshi, S. Conductive PVDF/PA6/CNTs nanocomposites fabricated by dual formation of cocontinuous and nanodispersion structures. Macromolecules 2008, 41, 5339–5344. [Google Scholar] [CrossRef]
- Li, C.J.; Xiang, M.; Zhao, X.W.; Ye, L. In situ synthesis of monomer casting nylon-6/graphene-polysiloxane nanocomposites: Intercalation structure, synergistic reinforcing, and friction-reducing effect. ACS Appl. Mater. Inter. 2017, 9, 33176–33190. [Google Scholar] [CrossRef] [PubMed]
- Carey, M.; Hinton, Z.; Sokol, M.; Alvarez, N.J.; Barsoum, M.W. Nylon-6/Ti3C2T z MXene Nanocomposites Synthesized by in Situ Ring Opening Polymerization of ε-Caprolactam and Their Water Transport Properties. ACS Appl. Mater. Int. 2019, 11, 20425–20436. [Google Scholar] [CrossRef] [PubMed]
- Ben, G.; Hirabayashi, A.; Sakata, K.; Nakamura, K.; Hirayama, N. Evaluation of new GFRTP and CFRTP using epsilon caprolactam as matrix fabricated with VaRTM. Sci. Eng. Compos. Mater. 2015, 22, 633–641. [Google Scholar] [CrossRef]
- Ben, G.C.; Sakata, K. Fast fabrication method and evaluation of performance of hybrid FRTPs for applying them to automotive structural members. Compos. Struct. 2015, 133, 1160–1167. [Google Scholar] [CrossRef]
- ASTM. D256-06. In Standard Test Methods for Determining the Izod Pendulum Impact Resistance of Plastics; ASTM International: West Conshohocken, PA, USA, 2006. [Google Scholar]
- Van Rijswijk, K.; Bersee, H.E.N.; Beukers, A.; Picken, S.J. Optimisation of anionic polyamide-6 for vacuum infusion of thermoplastic composites: Influence of polymerization temperature on matrix properties. Polym. Test. 2006, 25, 392–404. [Google Scholar] [CrossRef]
- Kargerkocsis, J.; Kiss, L. DSC studies of the activated anionic-polymerization of epsilon-caprolactam in the presence of crown compounds. J. Polym. Sci. Polym. Symposia 1981, 69, 67–71. [Google Scholar] [CrossRef]
- Wilfong, D.L.; Pommerening, C.A.; Gardlund, Z.G. Separation of polymerization and crystallization processes for nylon-6. Polymer 1992, 33, 3884–3888. [Google Scholar] [CrossRef]
- Kargerkocsis, J.; Kiss, L. Attempt of separation of the polymerization and crystallization process by means of DSC thermograms of activated anionic-polymerization of epsilon-caprolactam. Makromol. Chem. 1979, 180, 1593–1597. [Google Scholar] [CrossRef]
- Khodabakhshi, K.; Gilbert, M.; Dickens, P. Monitoring of samll-scale anionic polymerization of caprolactam; a method to be used in an additive manufacturing process. Polym. Advan. Technol. 2013, 24, 503–510. [Google Scholar] [CrossRef]
- Dave, R.S.; Kruse, R.L.; Udipi, K.; Williams, D.E. Polyamides from lactams via anionic ring-opening polymerization.3. Rheology. Polymer 1997, 38, 949–954. [Google Scholar] [CrossRef]


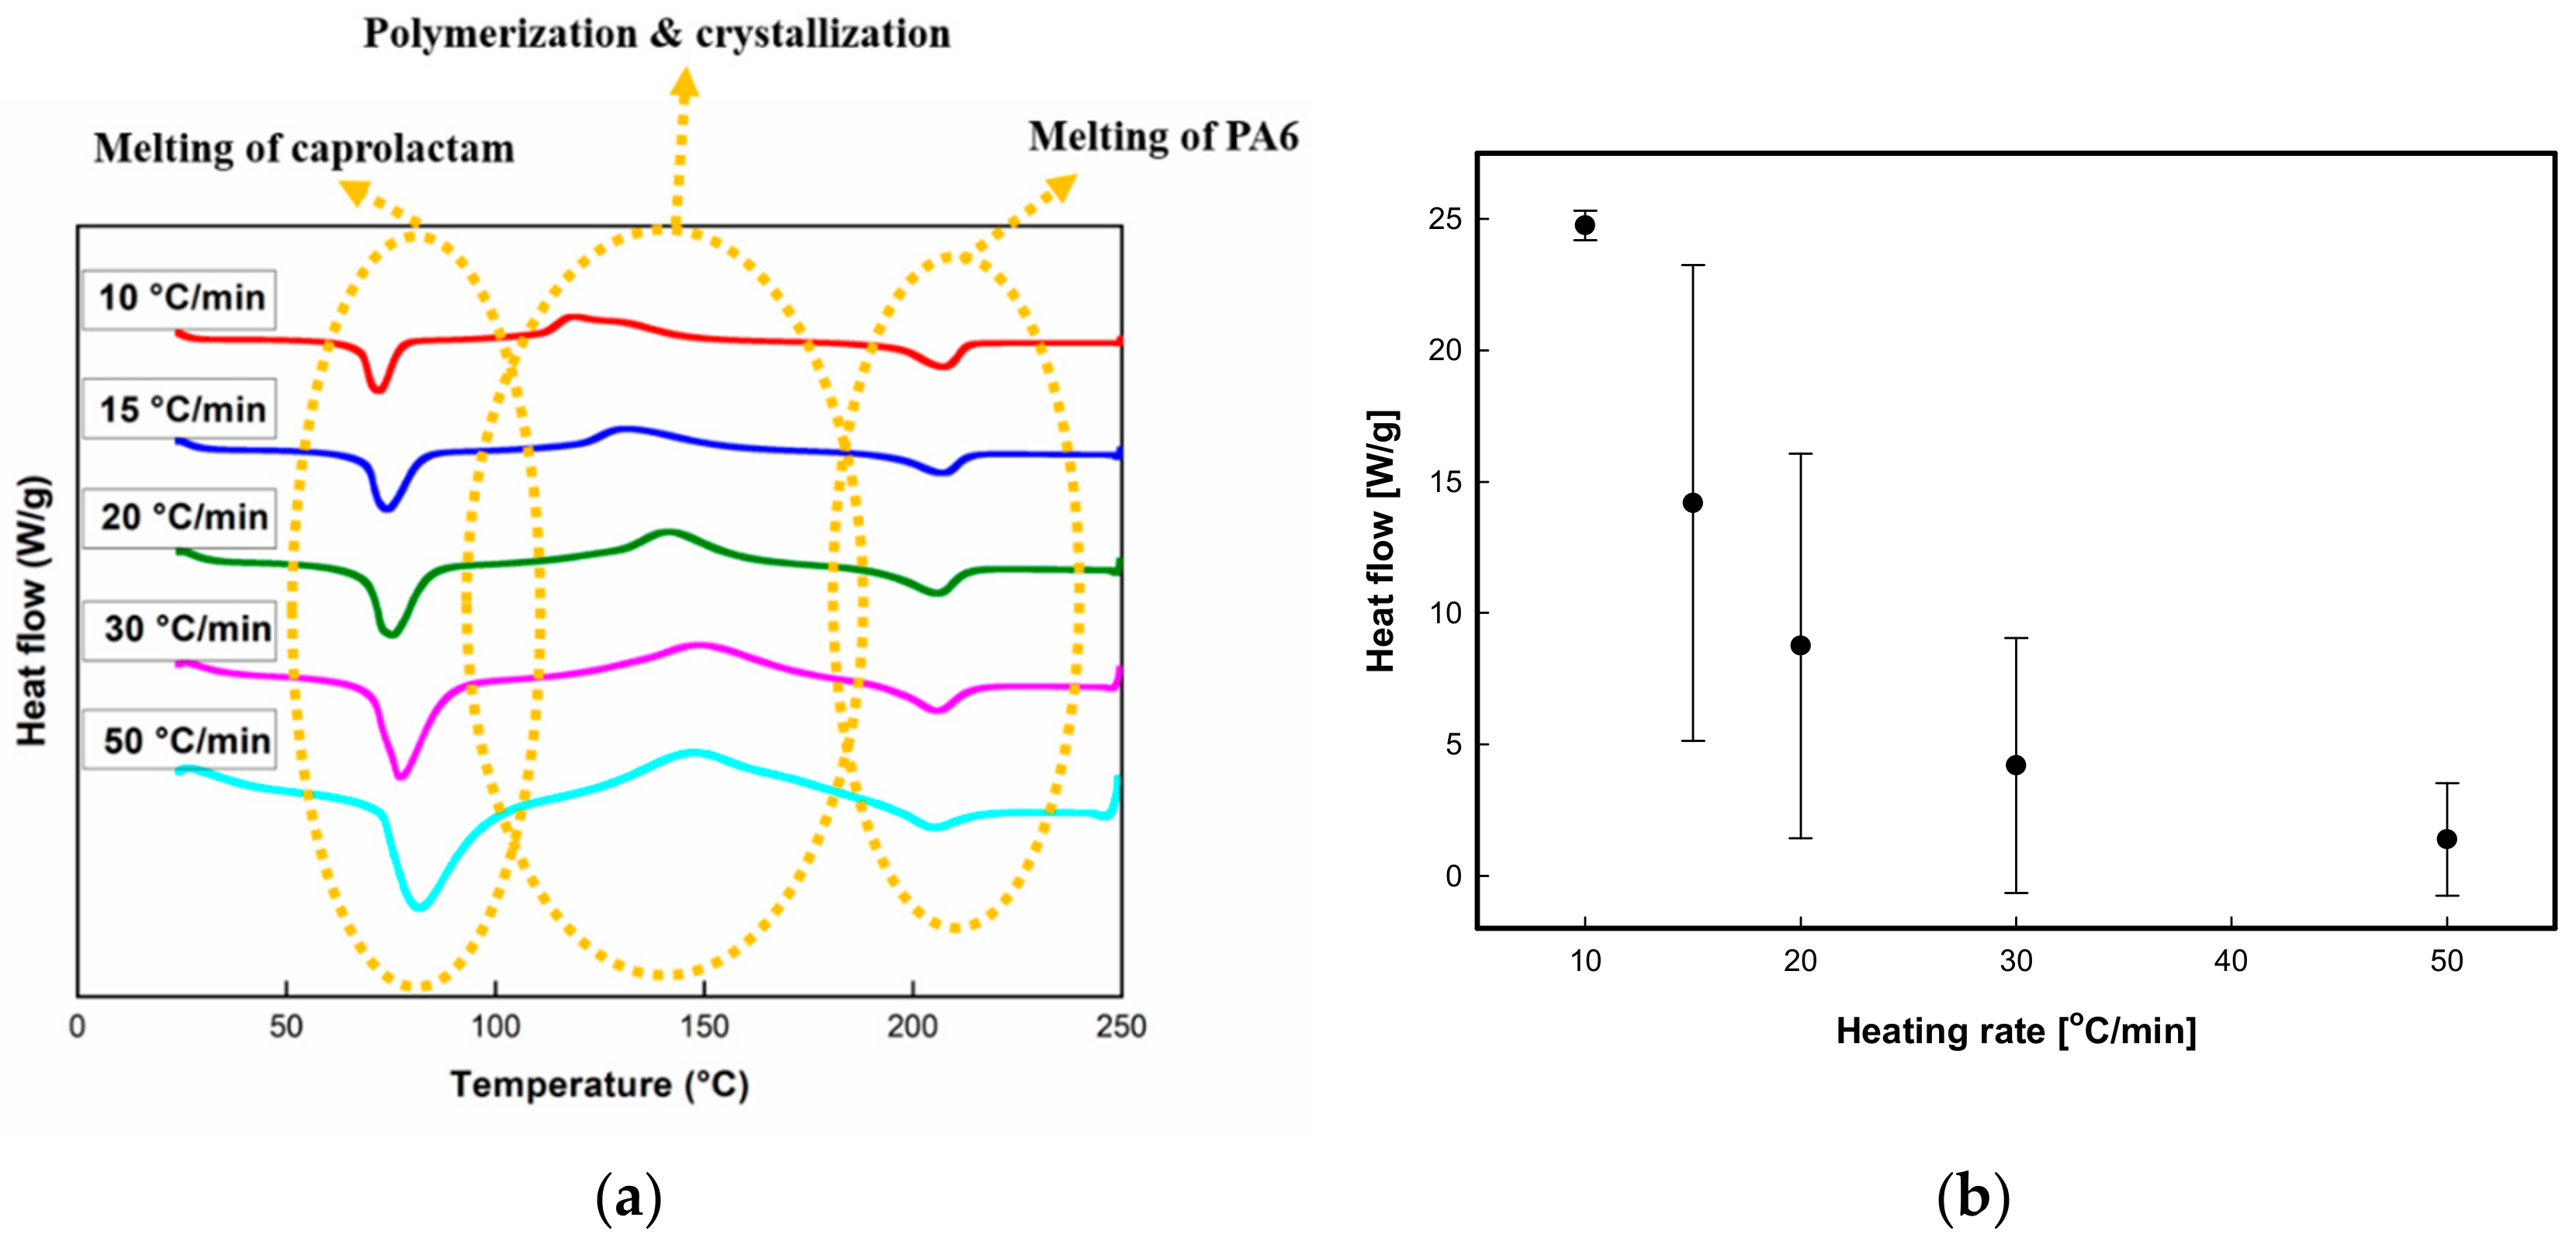
| Heating Rate (°C/min) | Melting of Caprolactam | Polymerization & Crystallization | Melting of PA6 | Polymerization | |
|---|---|---|---|---|---|
| Released Heat (J/g) | Released Heat (J/g) | Released Heat (J/g) | Crystallinity (%) | Released Heat (J/g) | |
| 10 | 113.4 | 147.6 | 77.65 | 41.00 | 69.95 |
| 15 | 114.3 | 137.2 | 64.81 | 34.25 | 72.35 |
| 20 | 119.5 | 136.6 | 63.92 | 33.79 | 72.68 |
| 30 | 119.7 | 106.2 | 32.12 | 17.44 | 74.10 |
| 50 | 124.3 | 90.34 | 12.15 | 6.480 | 78.19 |
| Heating Rate (°C/min) | A0 | E | B0 |
|---|---|---|---|
| 10 | 0.058 | 3000 | 6.005 |
| 15 | 0.068 | 3380 | 6.054 |
| 20 | 0.116 | 3680 | 6.382 |
| 30 | 0.274 | 4370 | 6.488 |
| 50 | 0.709 | 4920 | 6.498 |
| Heating Rate (°C/min) | A0 | E | B0 |
|---|---|---|---|
| 10 | 0.041 | 2970 | 5.963 |
| 15 | 0.082 | 3390 | 6.175 |
| 20 | 0.131 | 3750 | 6.310 |
| 30 | 0.261 | 4290 | 6.450 |
| 50 | 0.711 | 4940 | 6.530 |
| Molding Temperature (°C) | 120 °C | 140 °C | 160 °C | 180 °C | 200 °C |
|---|---|---|---|---|---|
| Heat of reaction (J/g) | 94.48 | 144.0 | 94.29 | 37.80 | 36.18 |
| Molding Temperature (°C) | Endothermic Reaction (J/g) | Melting (J/g) | Tm (°C) |
|---|---|---|---|
| 120 | −16.36 | 51.57 | 206.9 |
| 140 | 1.120 | 81.69 | 206.7 |
| 160 | 0.430 | 76.33 | 202.4 |
| 180 | 24.92 | 61.54 | 203.1 |
| 200 | 23.02 | 62.23 | 202.3 |
© 2020 by the authors. Licensee MDPI, Basel, Switzerland. This article is an open access article distributed under the terms and conditions of the Creative Commons Attribution (CC BY) license (http://creativecommons.org/licenses/by/4.0/).
Share and Cite
Li, M.-X.; Lee, D.; Lee, G.H.; Kim, S.M.; Ben, G.; Lee, W.I.; Choi, S.W. Effect of Temperature on the Mechanical Properties and Polymerization Kinetics of Polyamide-6 Composites. Polymers 2020, 12, 1133. https://doi.org/10.3390/polym12051133
Li M-X, Lee D, Lee GH, Kim SM, Ben G, Lee WI, Choi SW. Effect of Temperature on the Mechanical Properties and Polymerization Kinetics of Polyamide-6 Composites. Polymers. 2020; 12(5):1133. https://doi.org/10.3390/polym12051133
Chicago/Turabian StyleLi, Mei-Xian, Dasom Lee, Gyu Hee Lee, Seung Mo Kim, Goichi Ben, Woo Il Lee, and Sung Woong Choi. 2020. "Effect of Temperature on the Mechanical Properties and Polymerization Kinetics of Polyamide-6 Composites" Polymers 12, no. 5: 1133. https://doi.org/10.3390/polym12051133
APA StyleLi, M.-X., Lee, D., Lee, G. H., Kim, S. M., Ben, G., Lee, W. I., & Choi, S. W. (2020). Effect of Temperature on the Mechanical Properties and Polymerization Kinetics of Polyamide-6 Composites. Polymers, 12(5), 1133. https://doi.org/10.3390/polym12051133