Enhanced Dielectric Permittivity of Optimized Surface Modified of Barium Titanate Nanocomposites


Abstract
1. Introduction
2. Materials and Methods
2.1. Materials
2.2. Experimental Method
2.2.1. Surface Modification of BTO with Ethanol
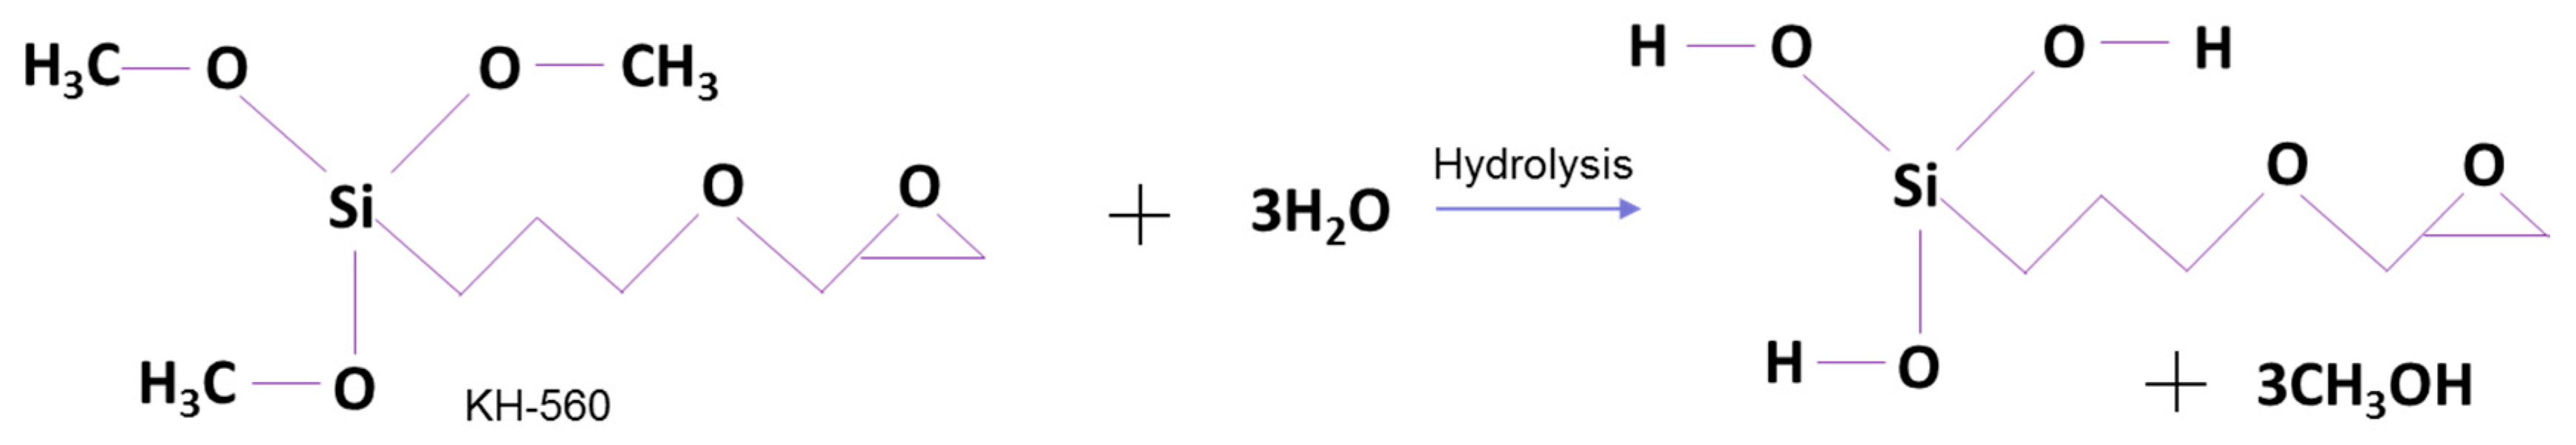
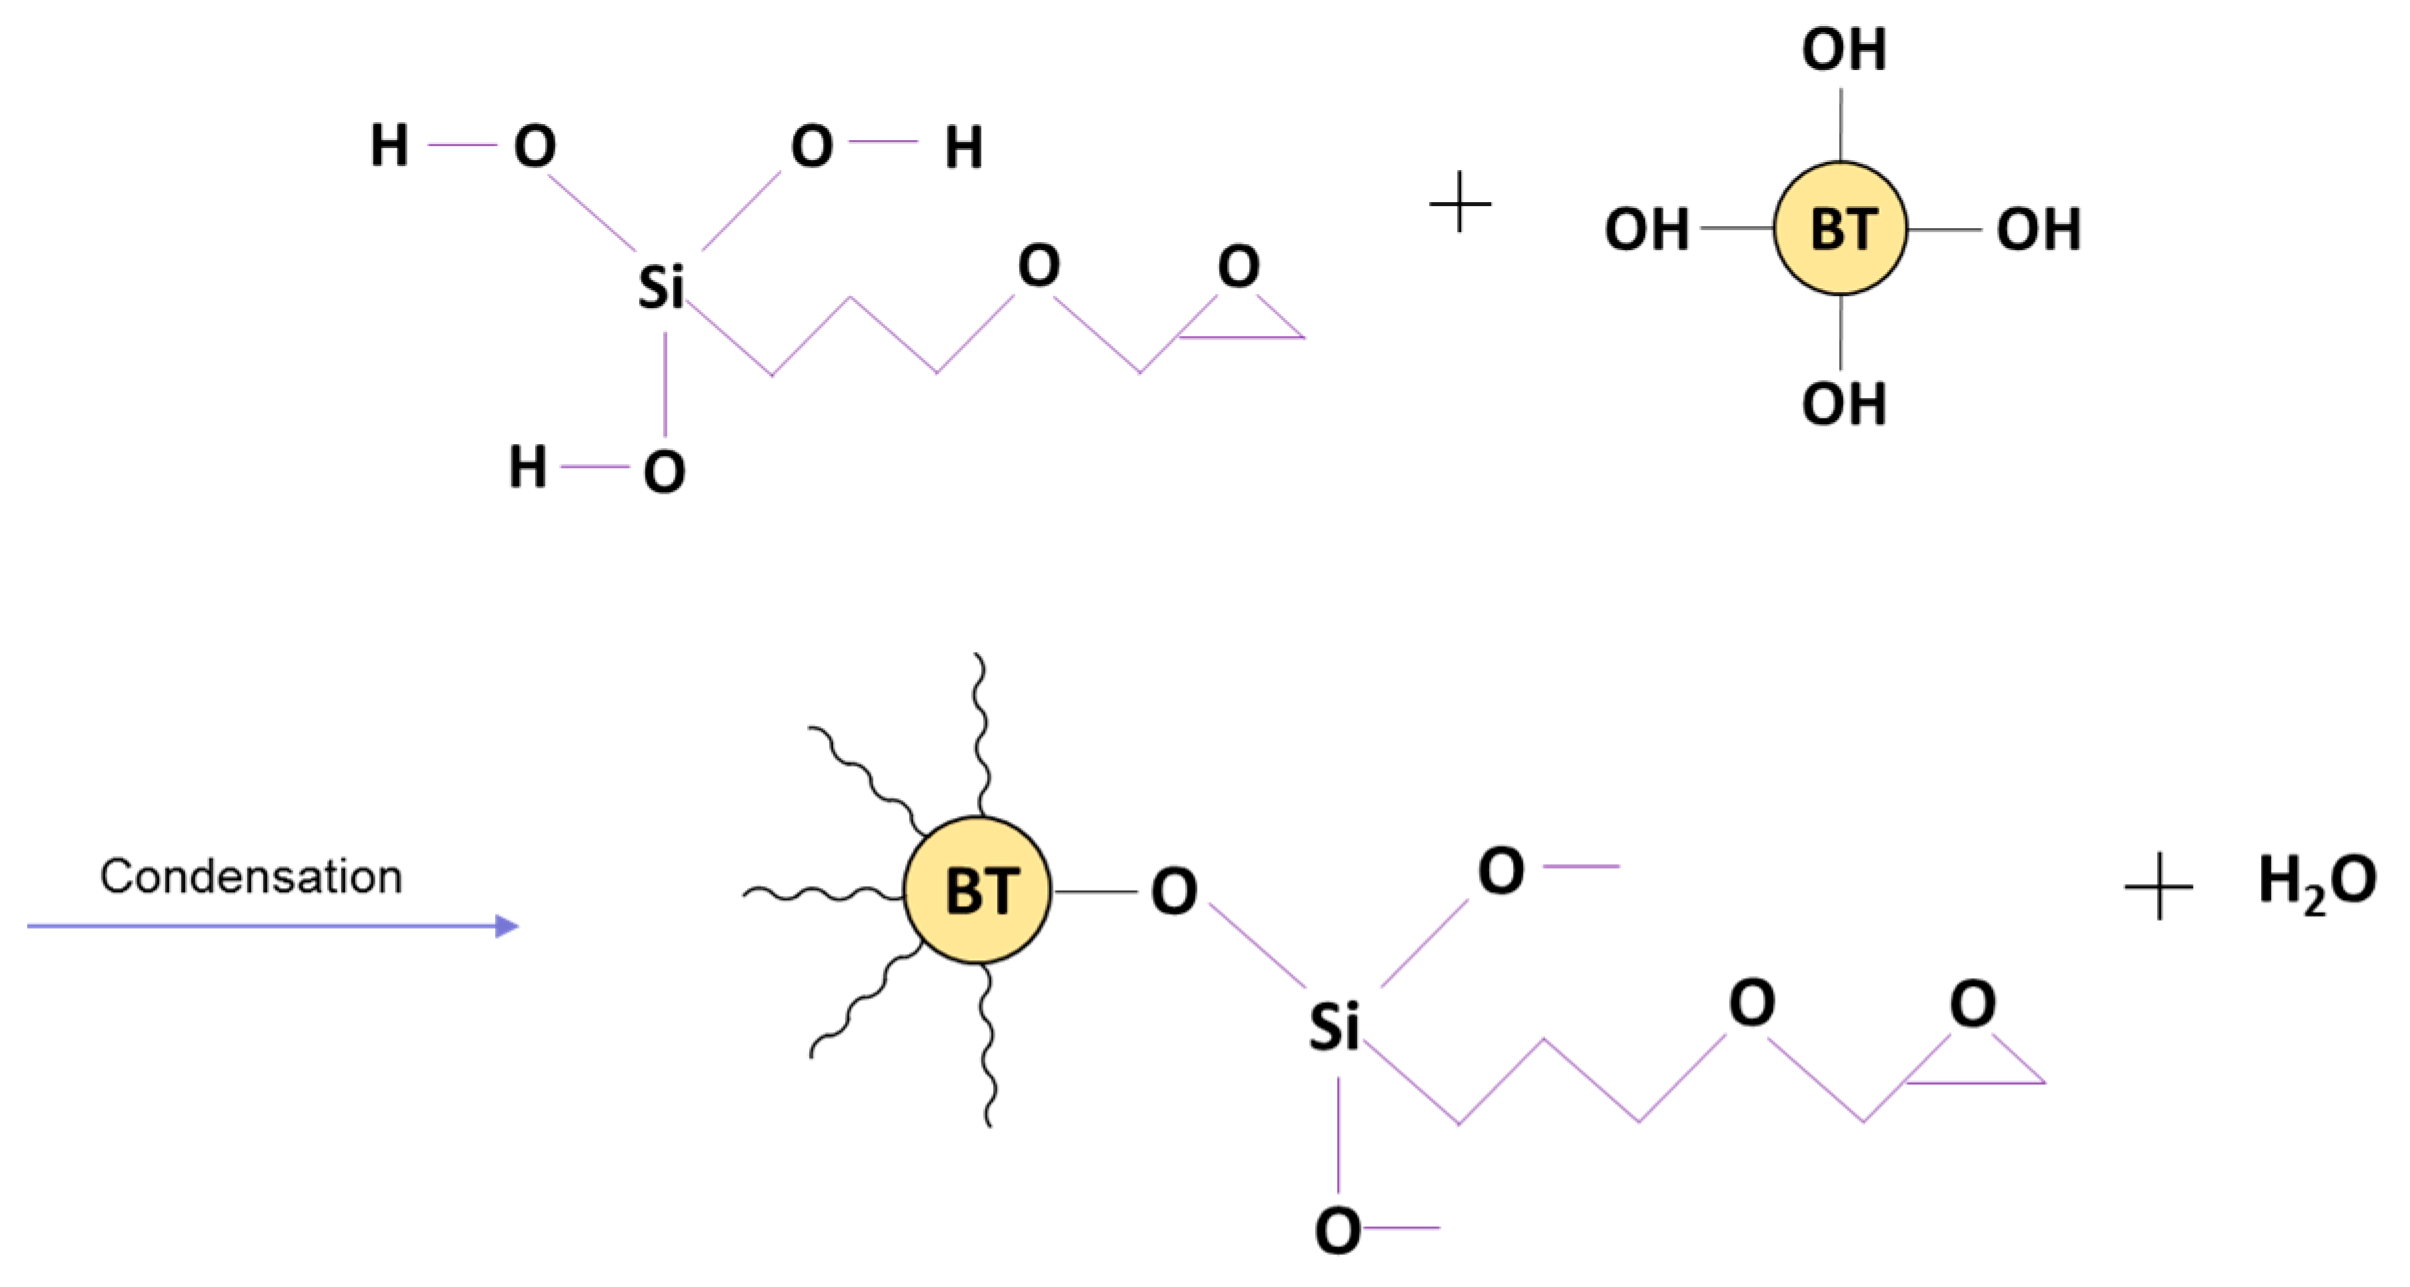
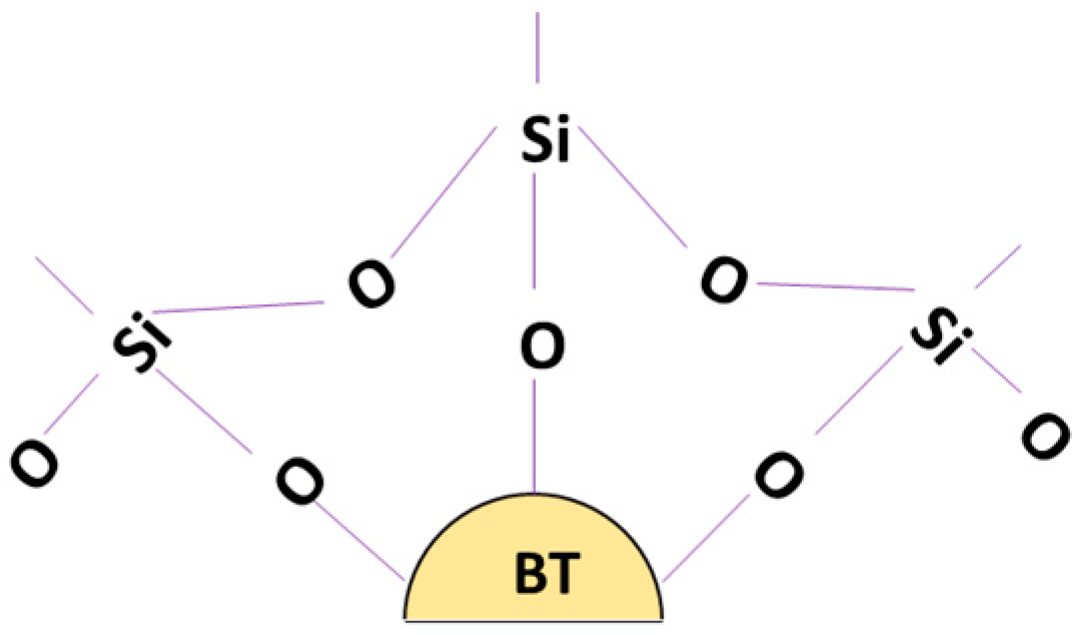
2.2.2. Surface Modification of BTO with Silane Coupling Agent
2.2.3. Film Characterization
3. Results and Discussion
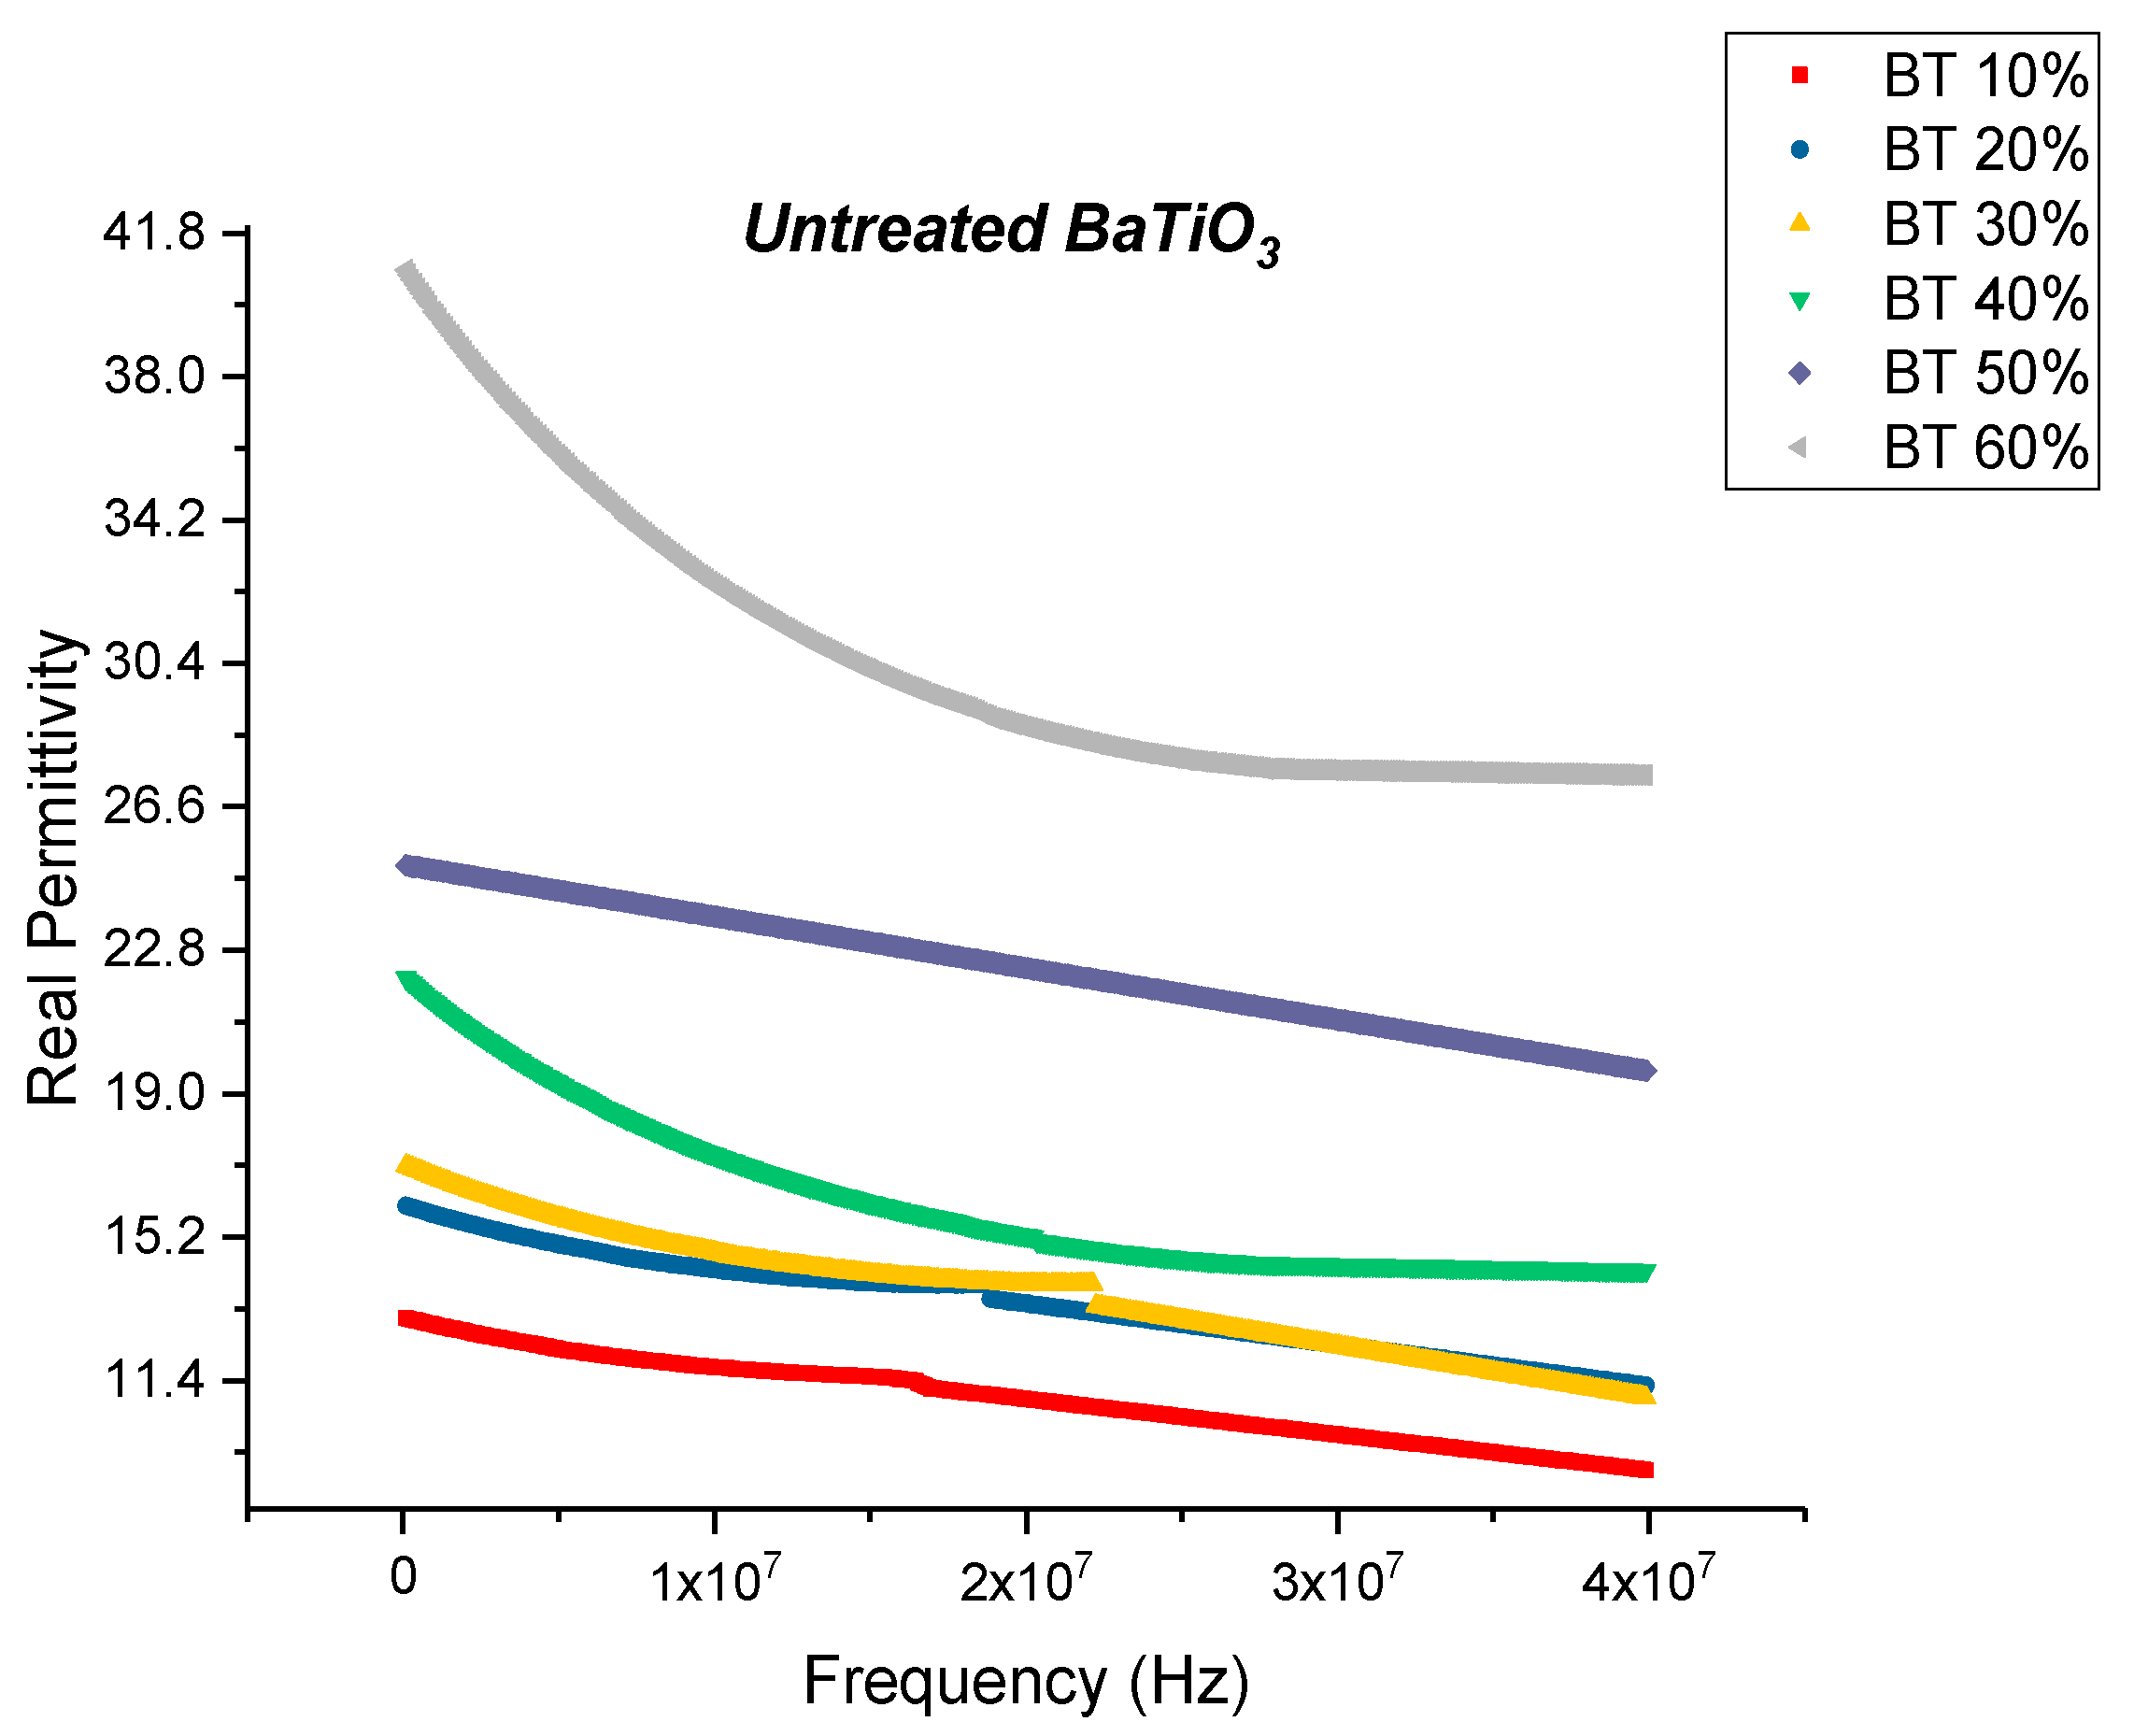
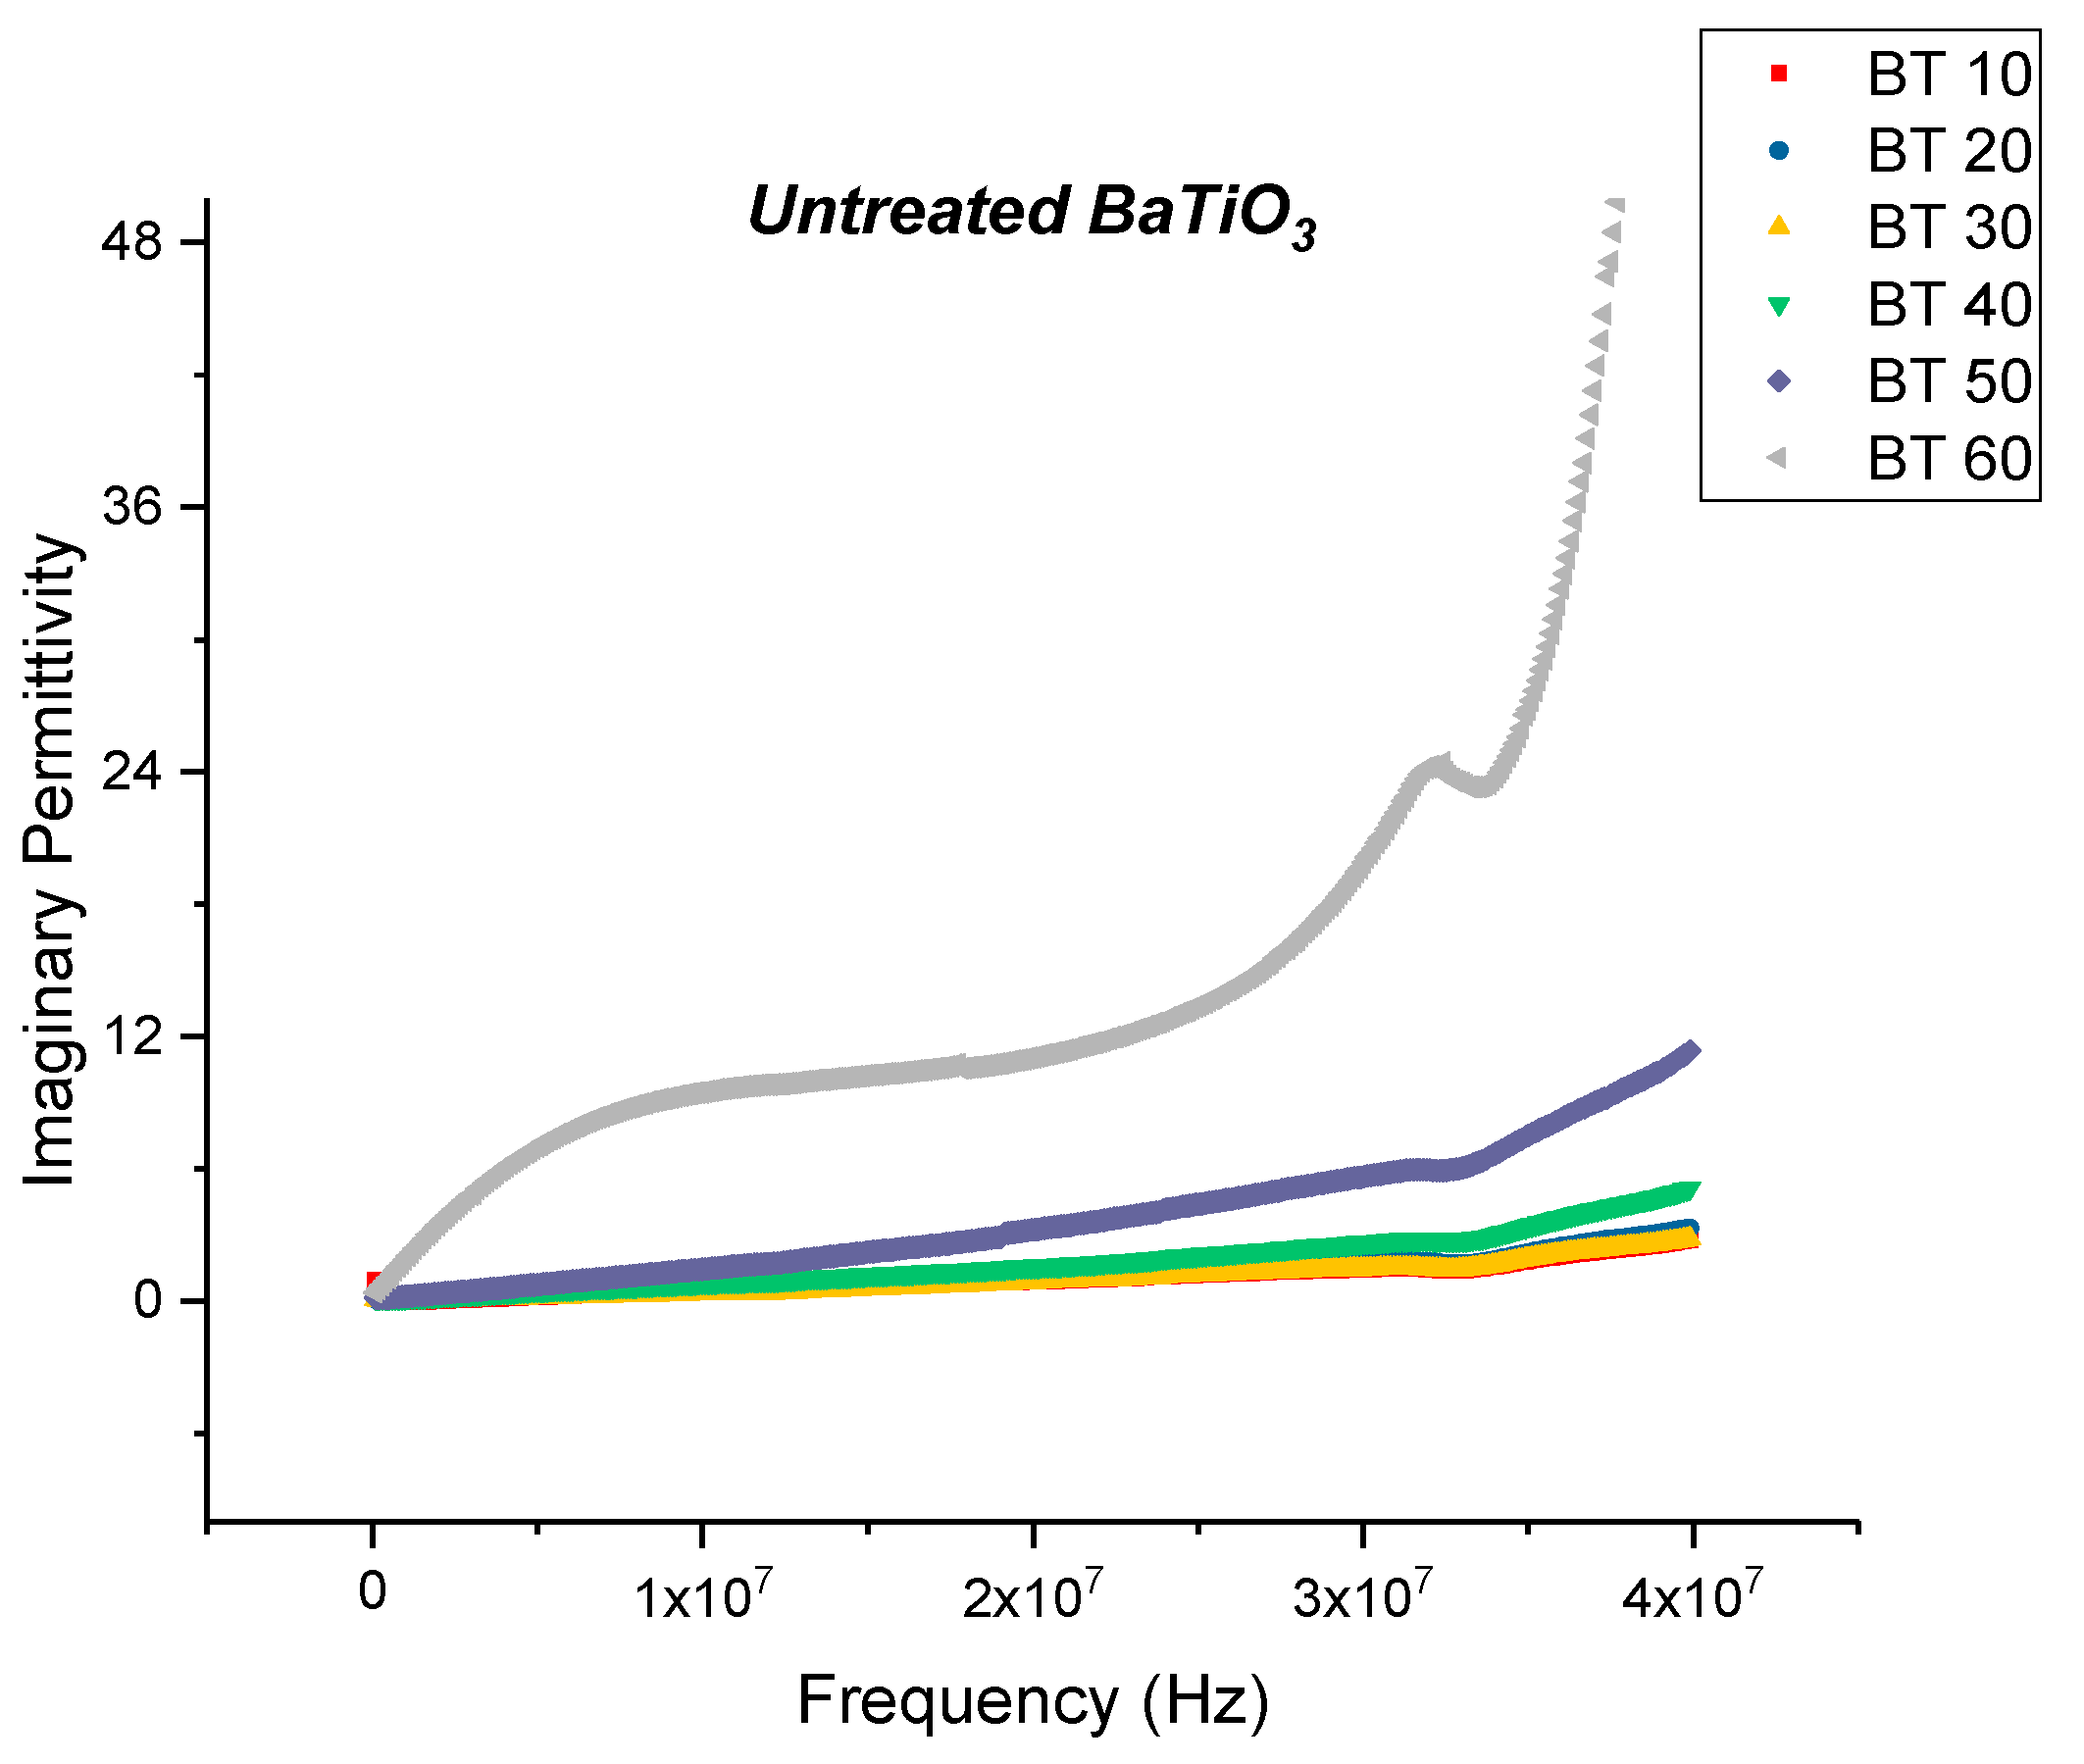
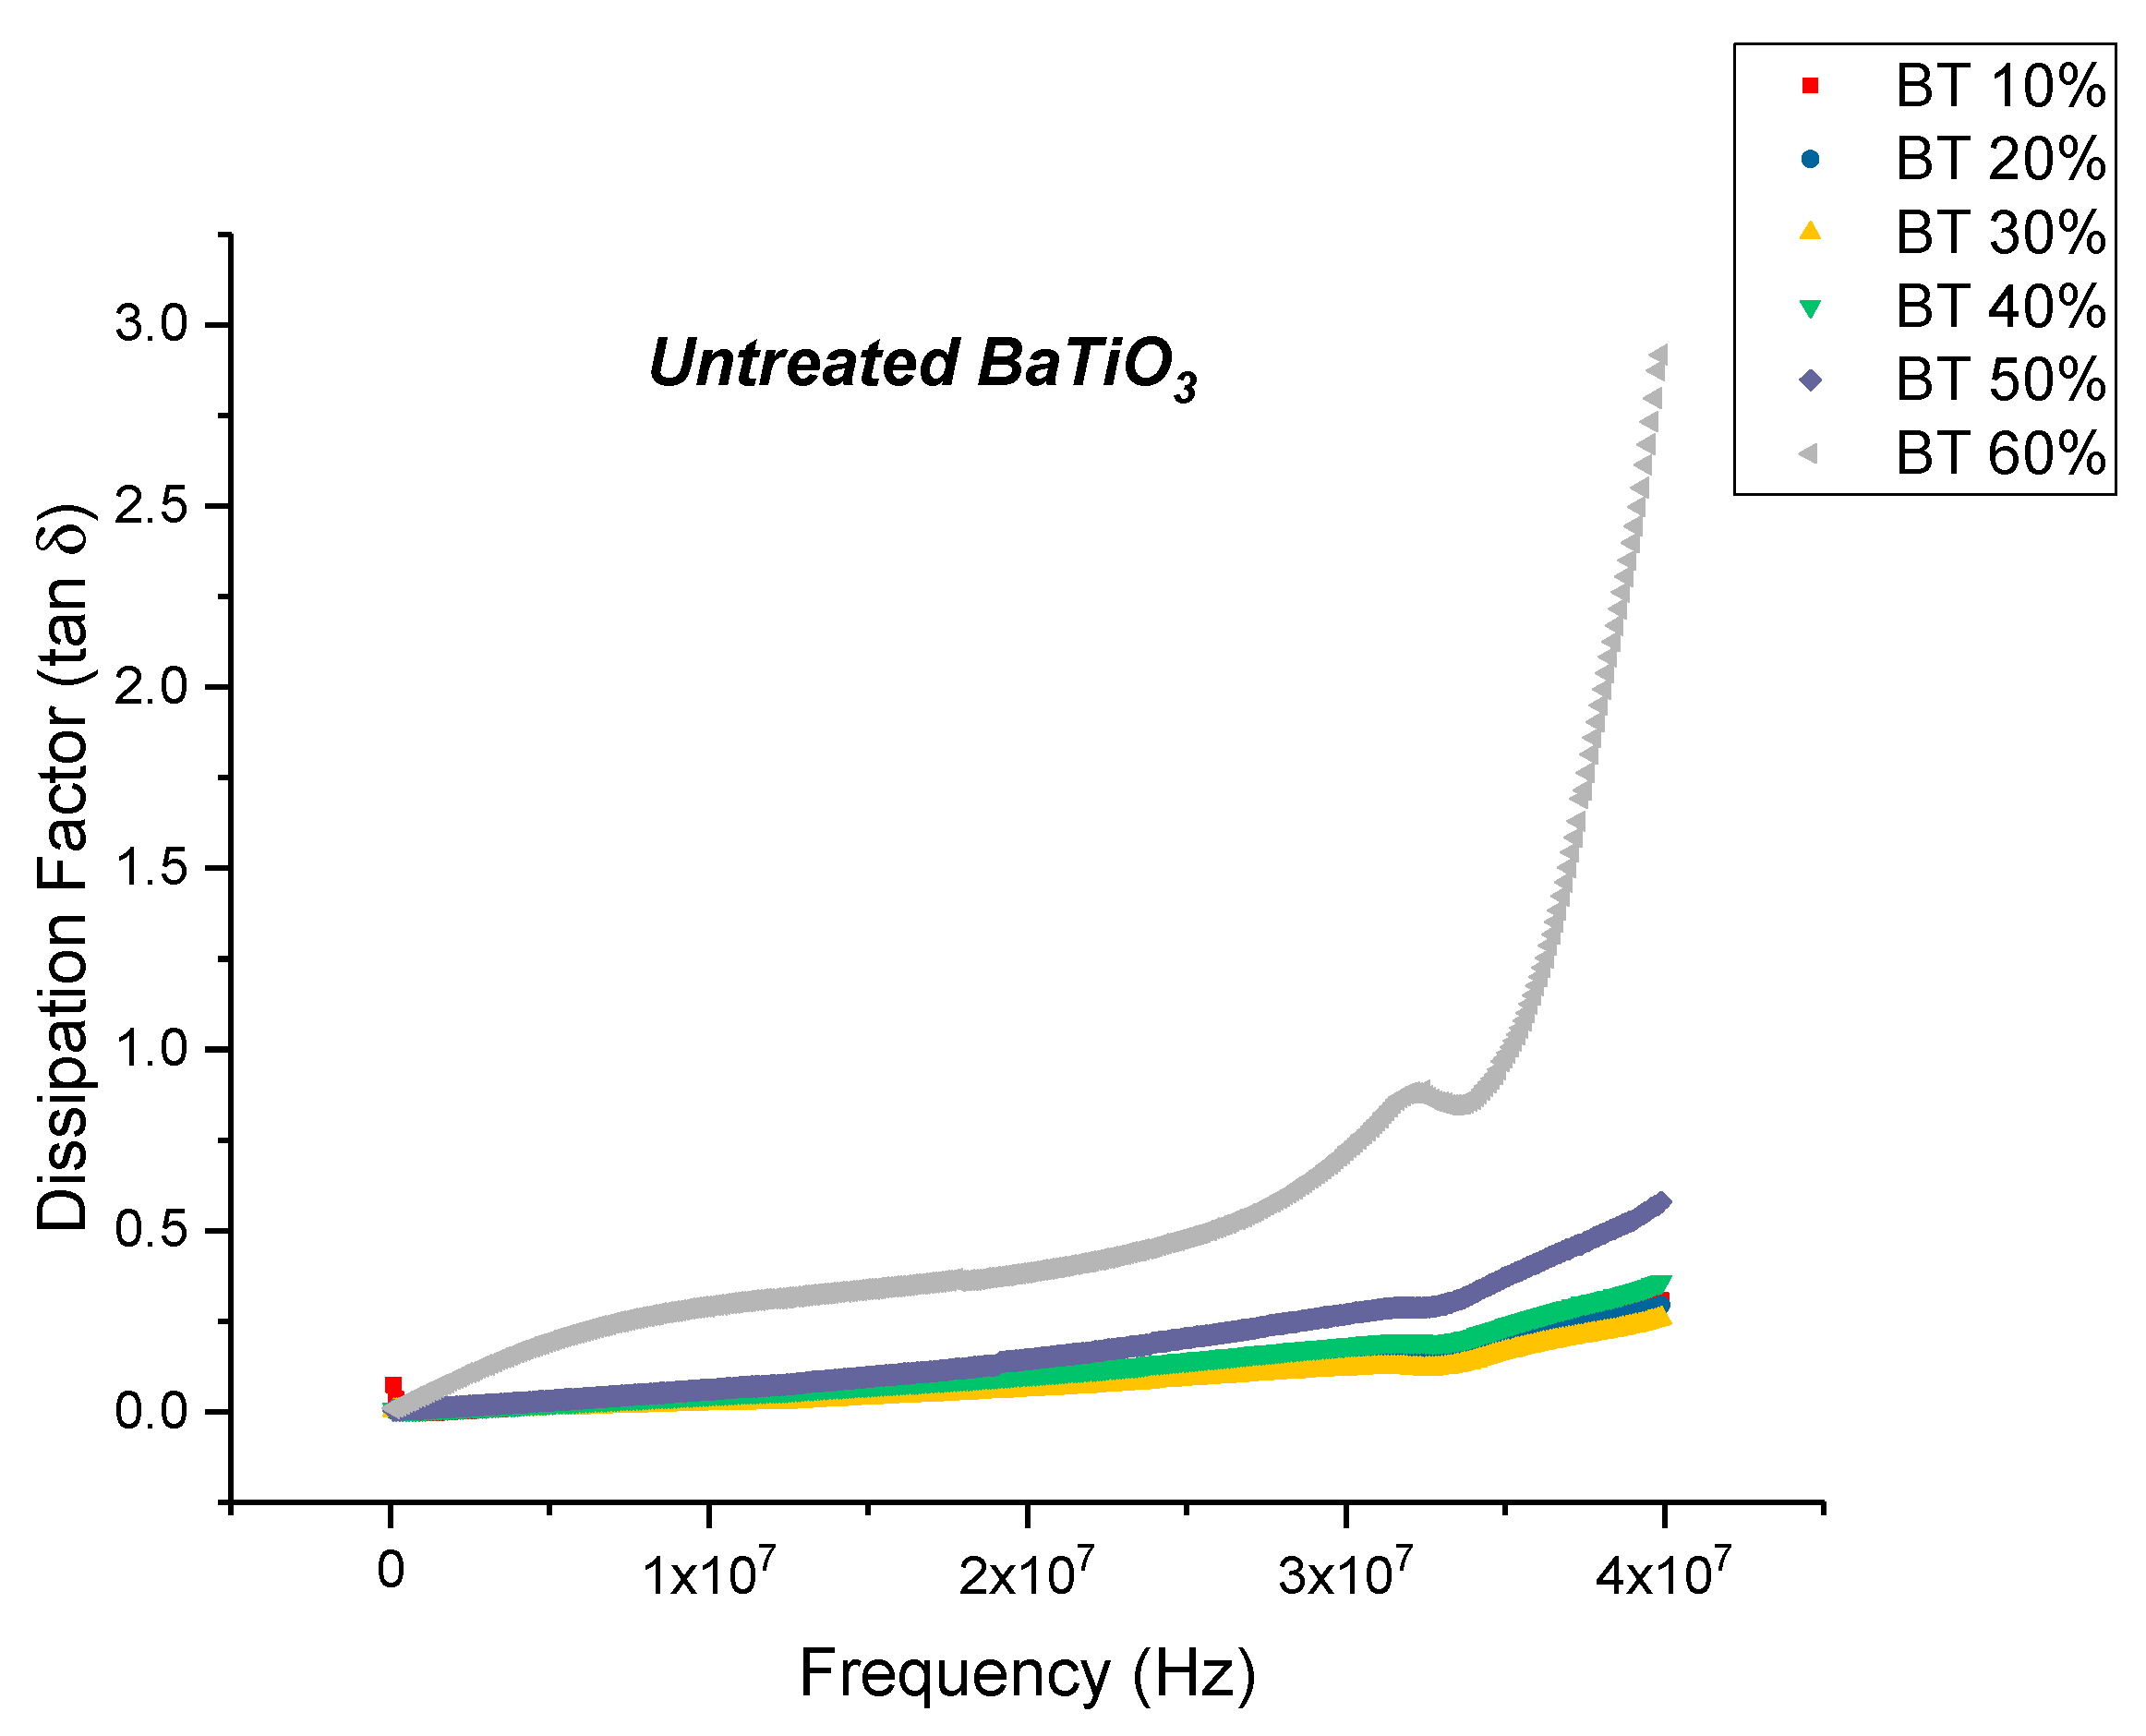
Dielectric Permittivity
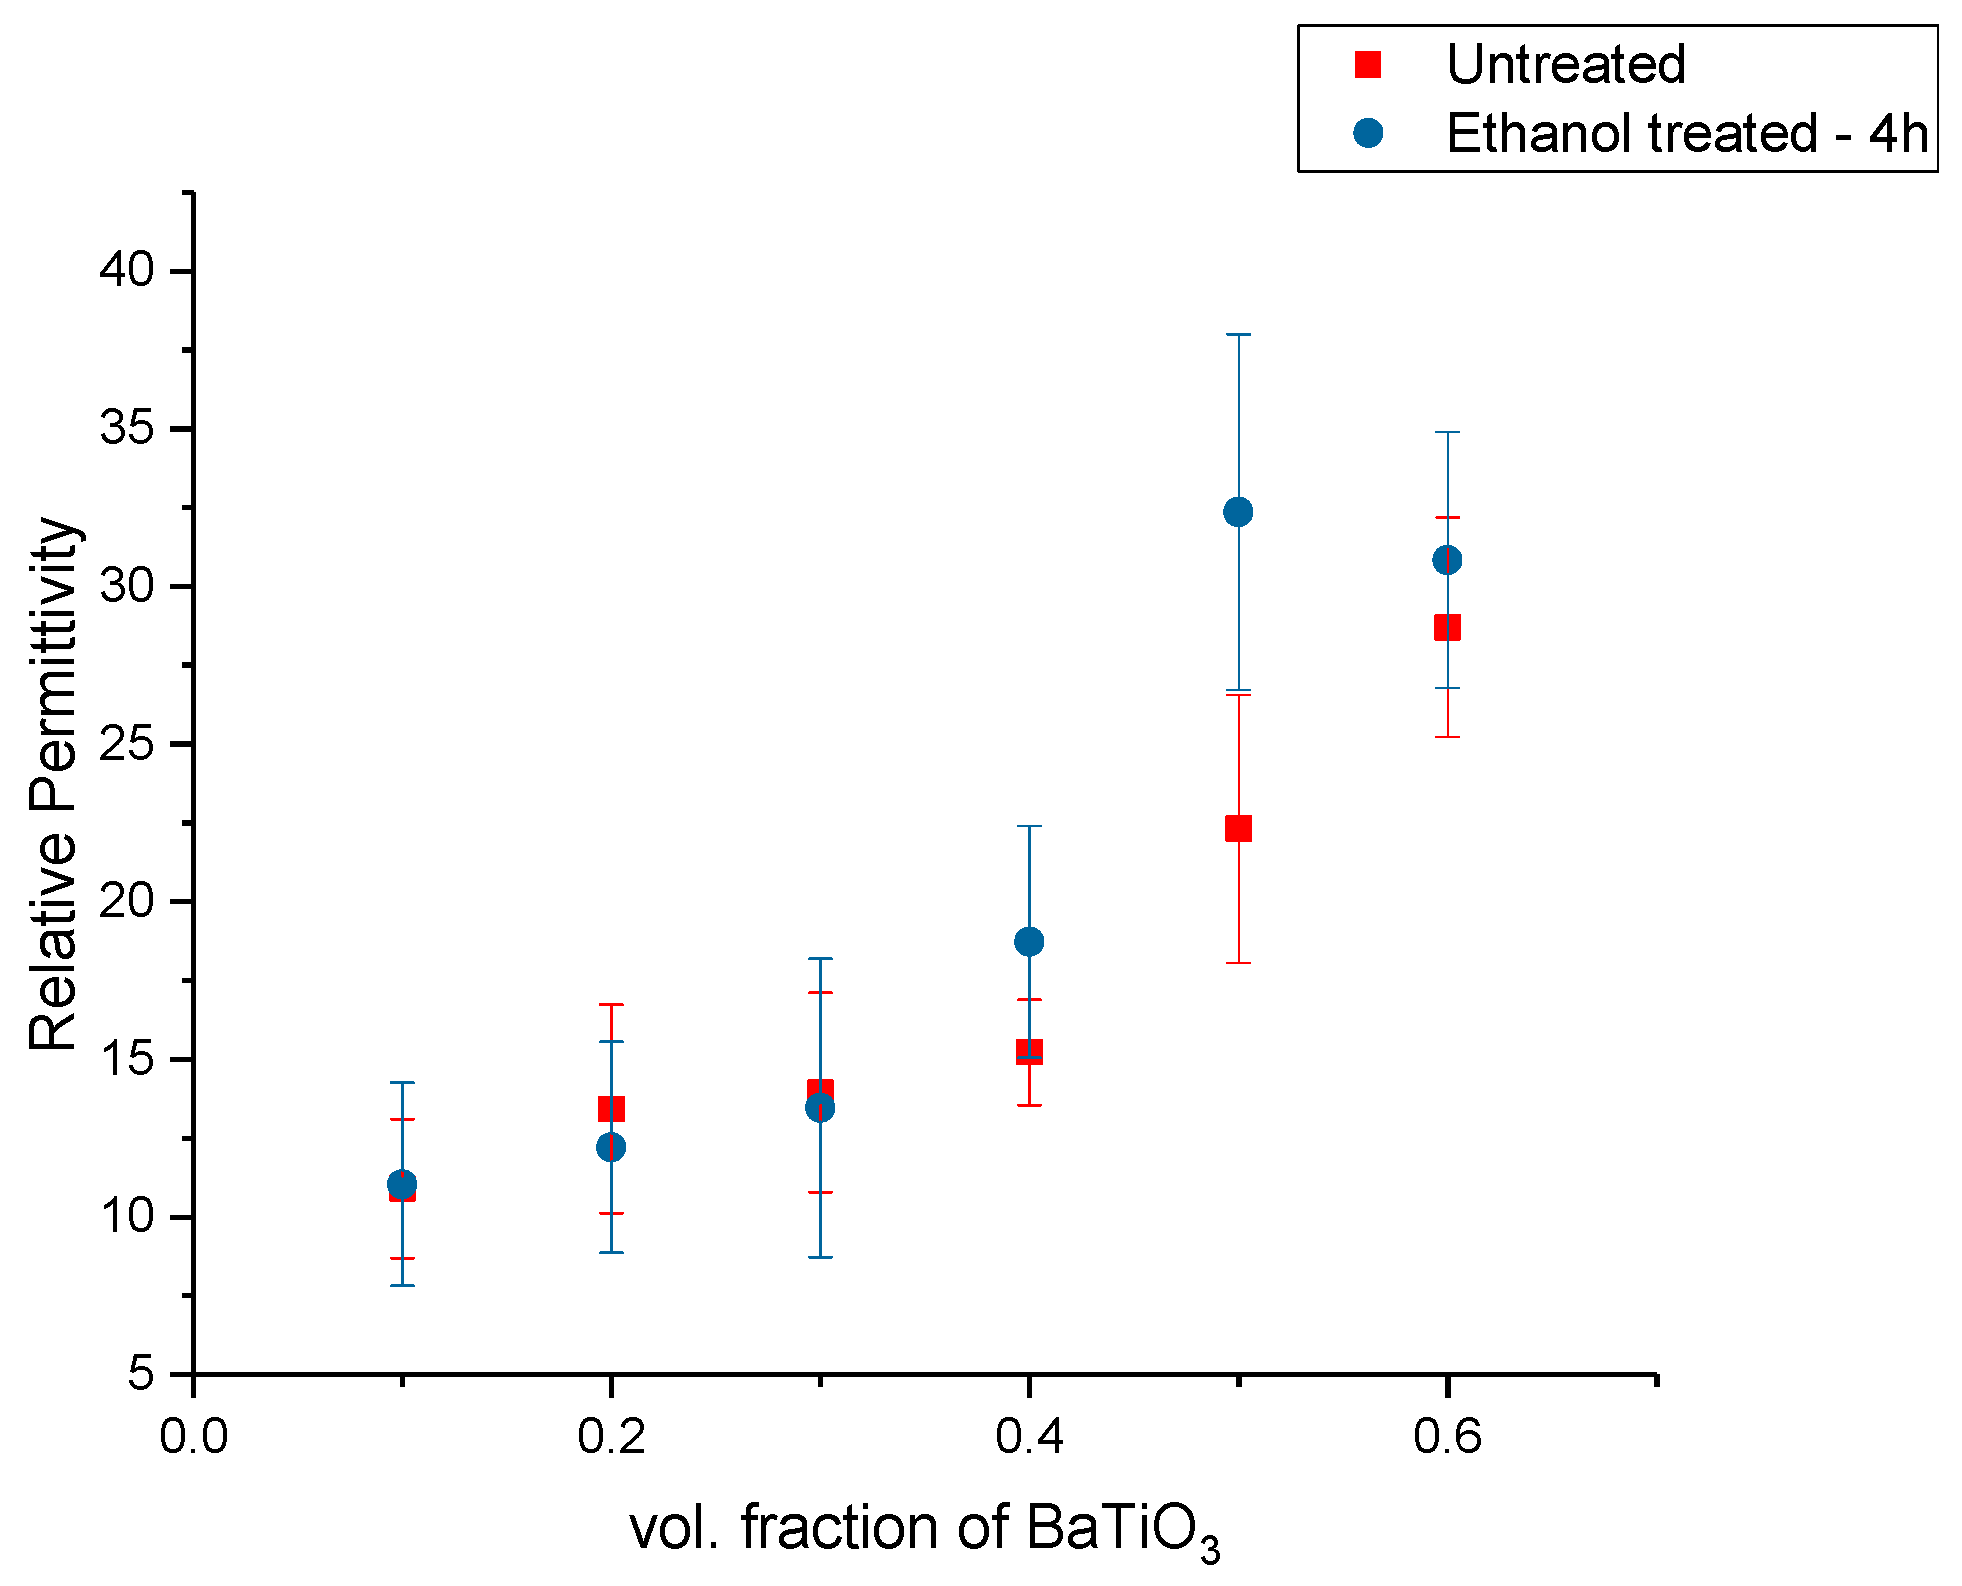
Dielectric Permittivity (BTO-Ethanol)
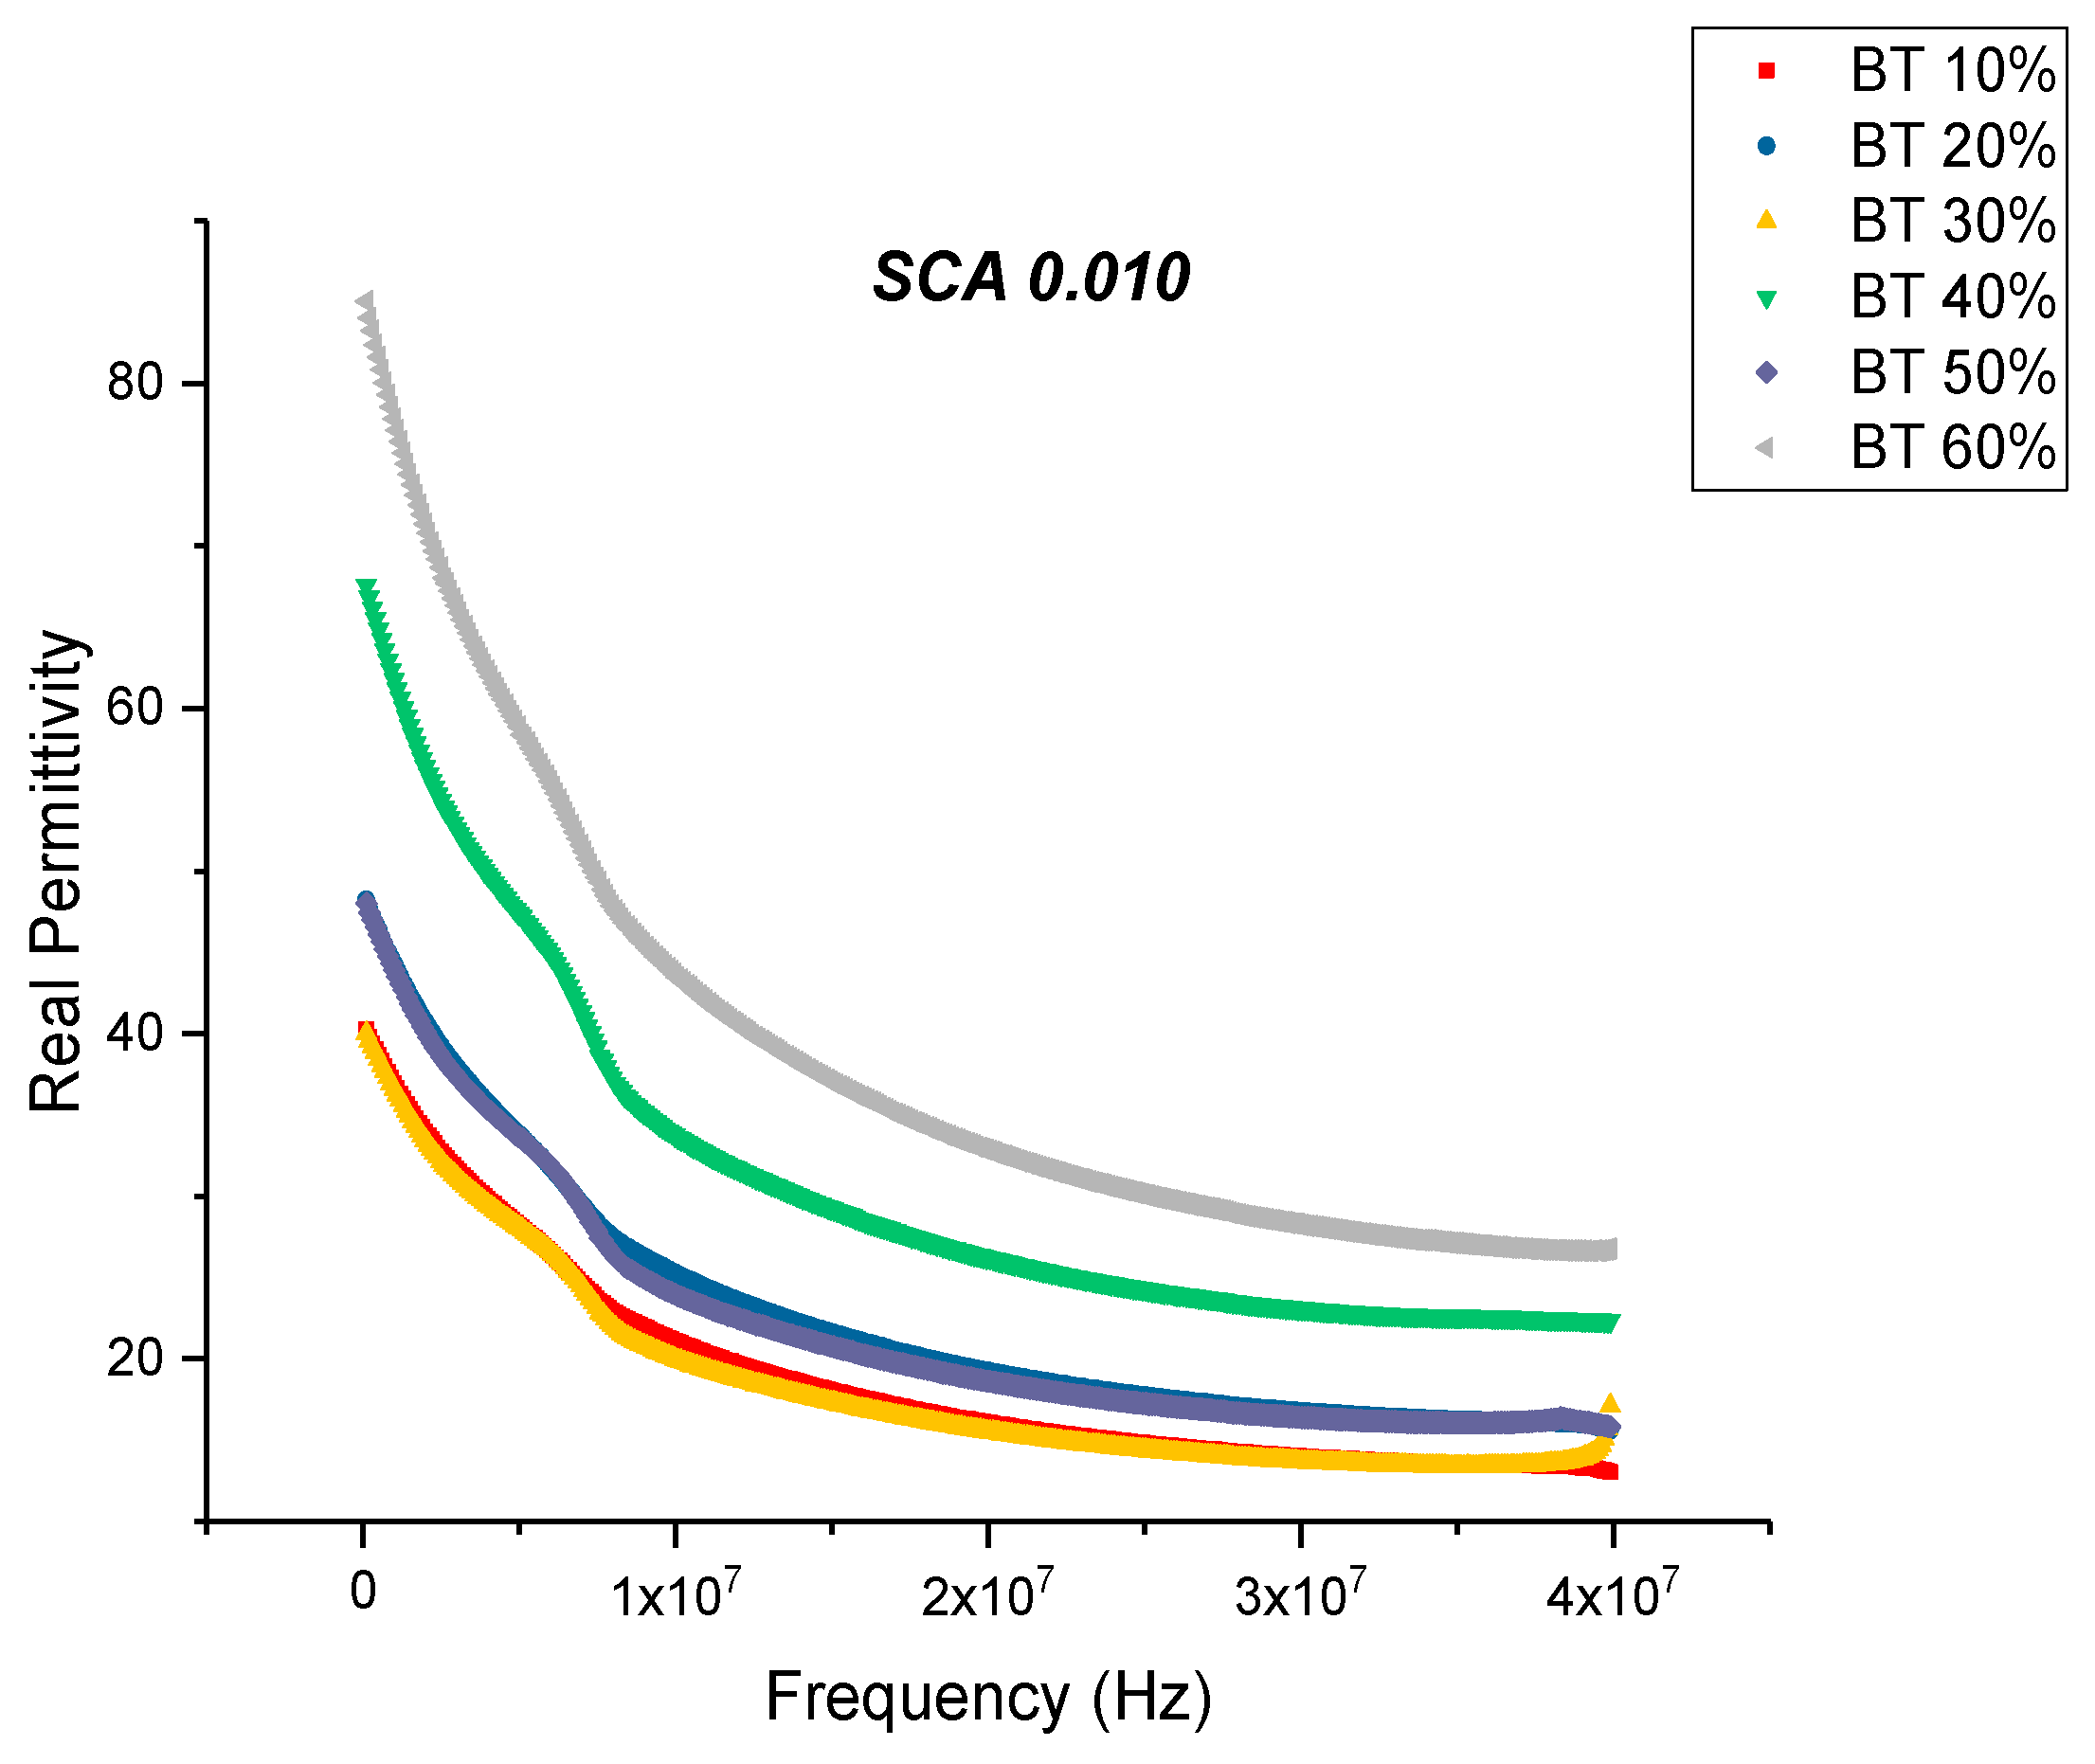
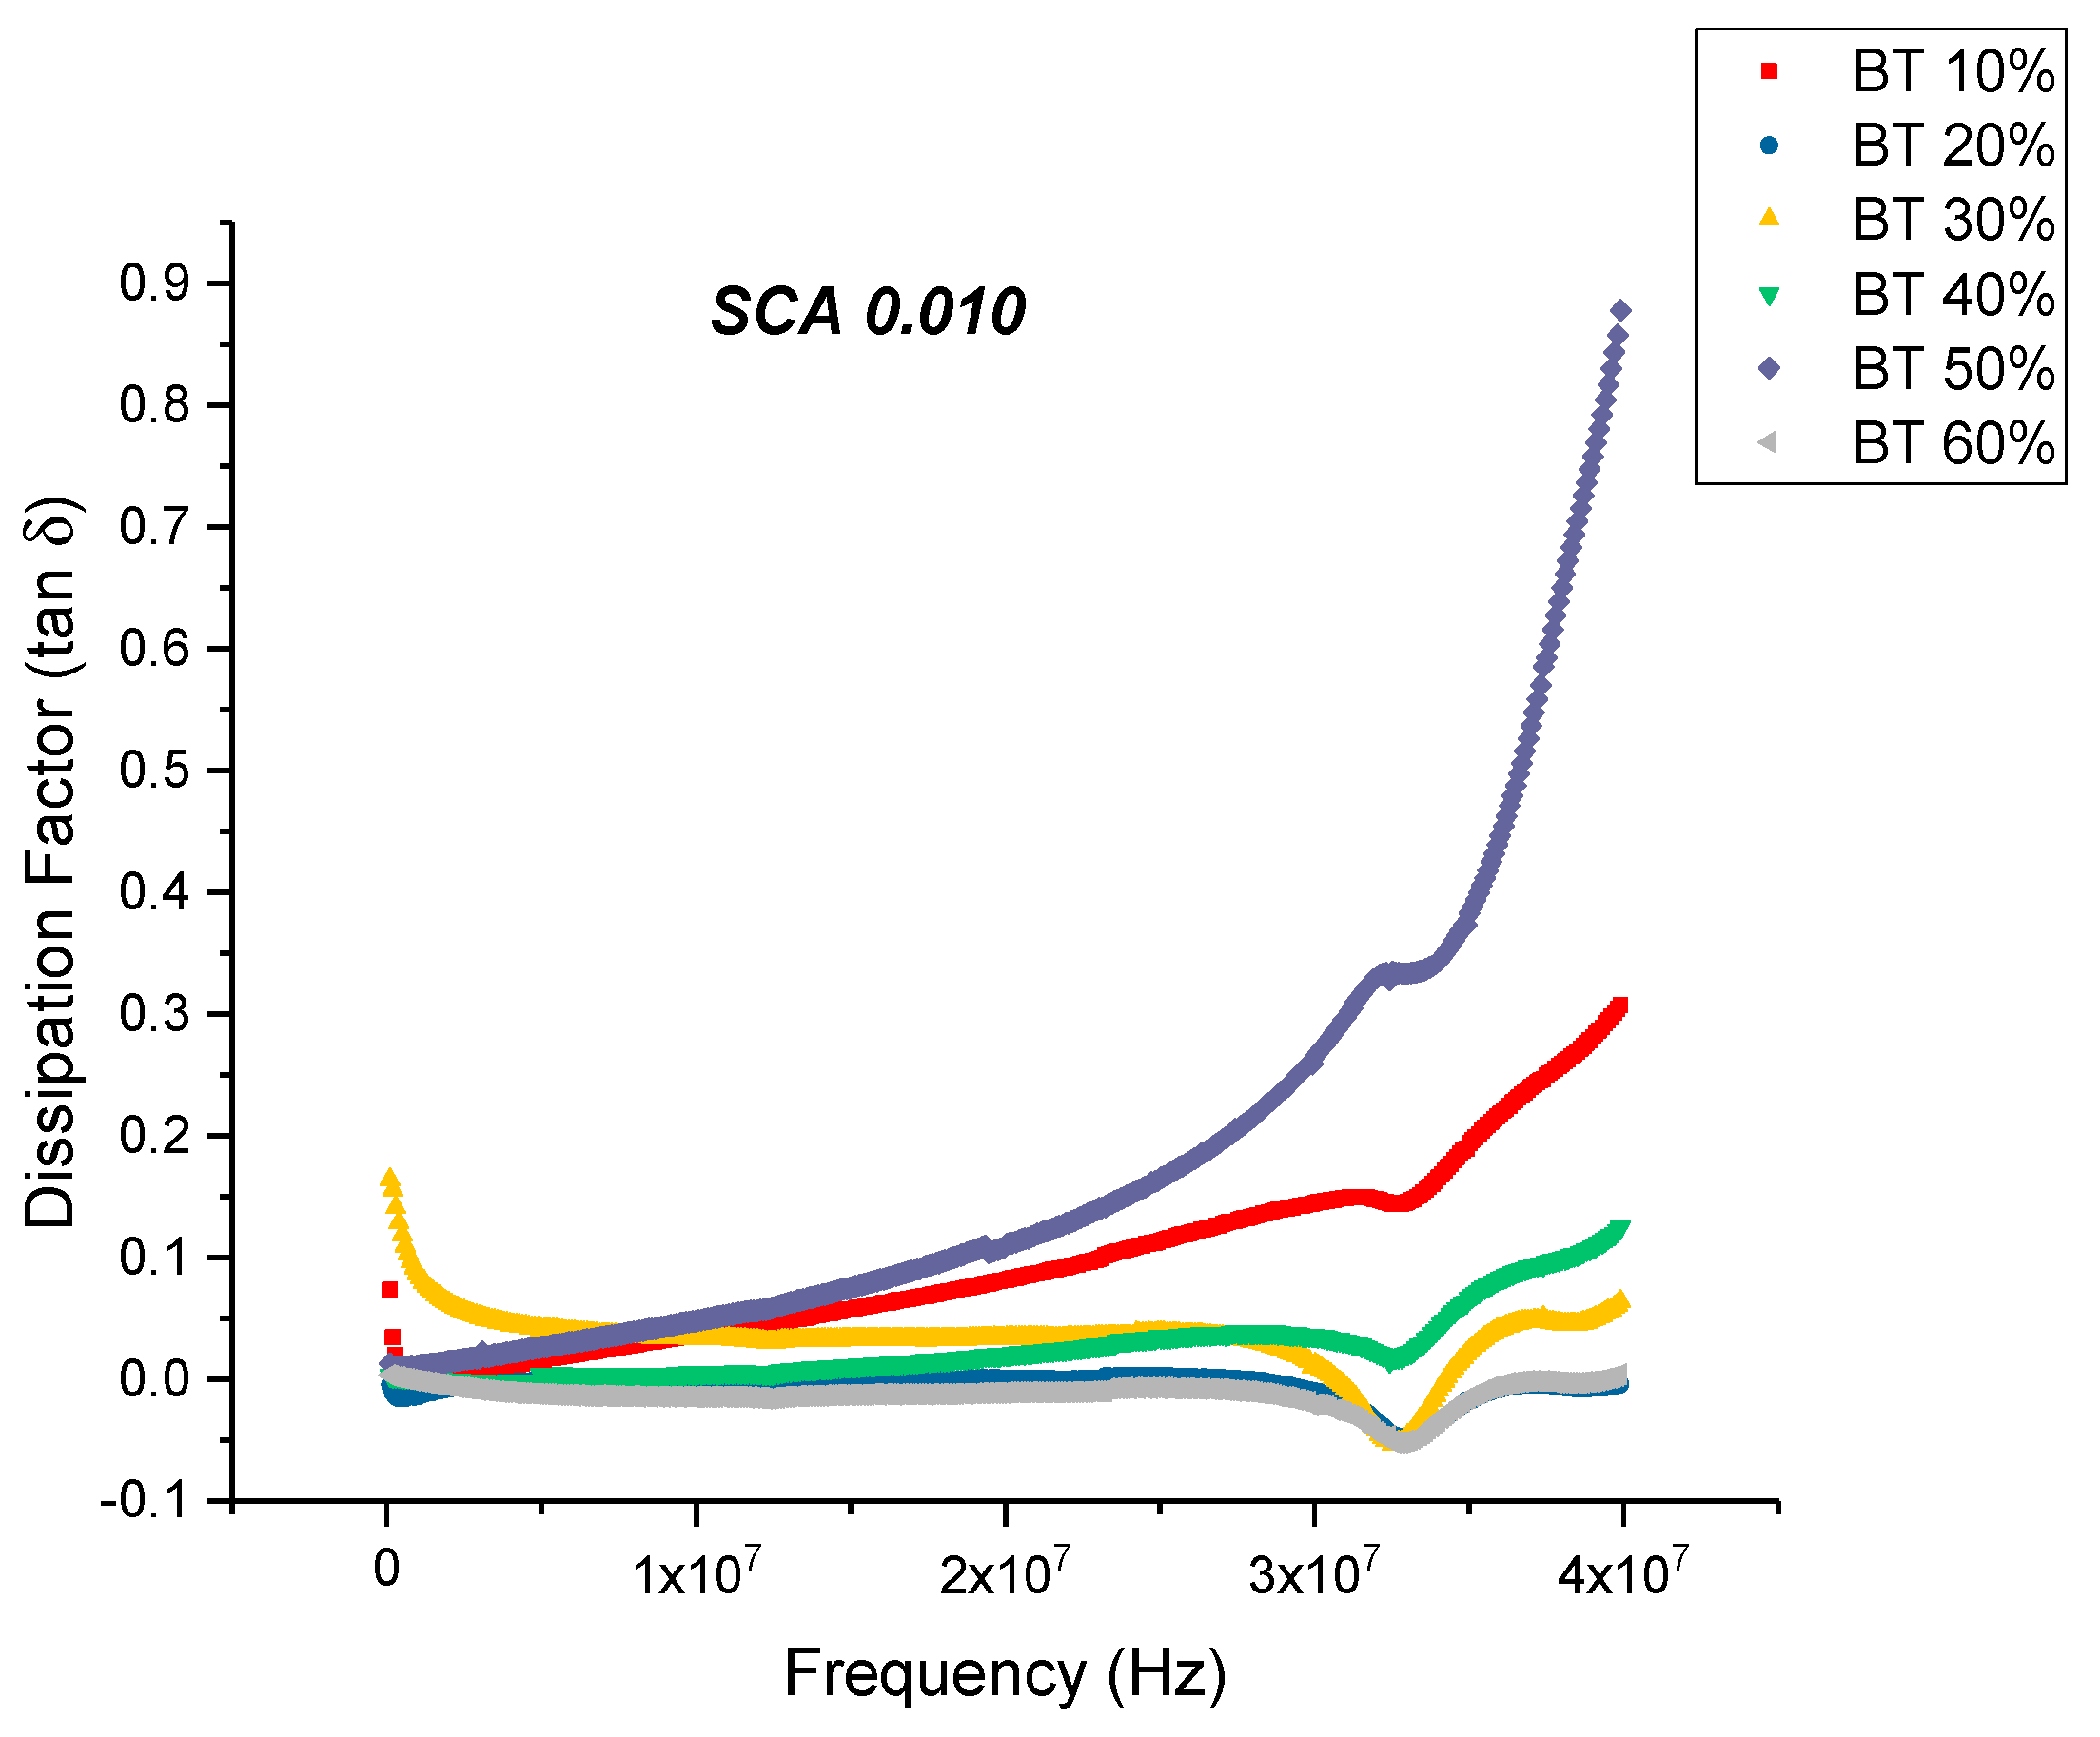
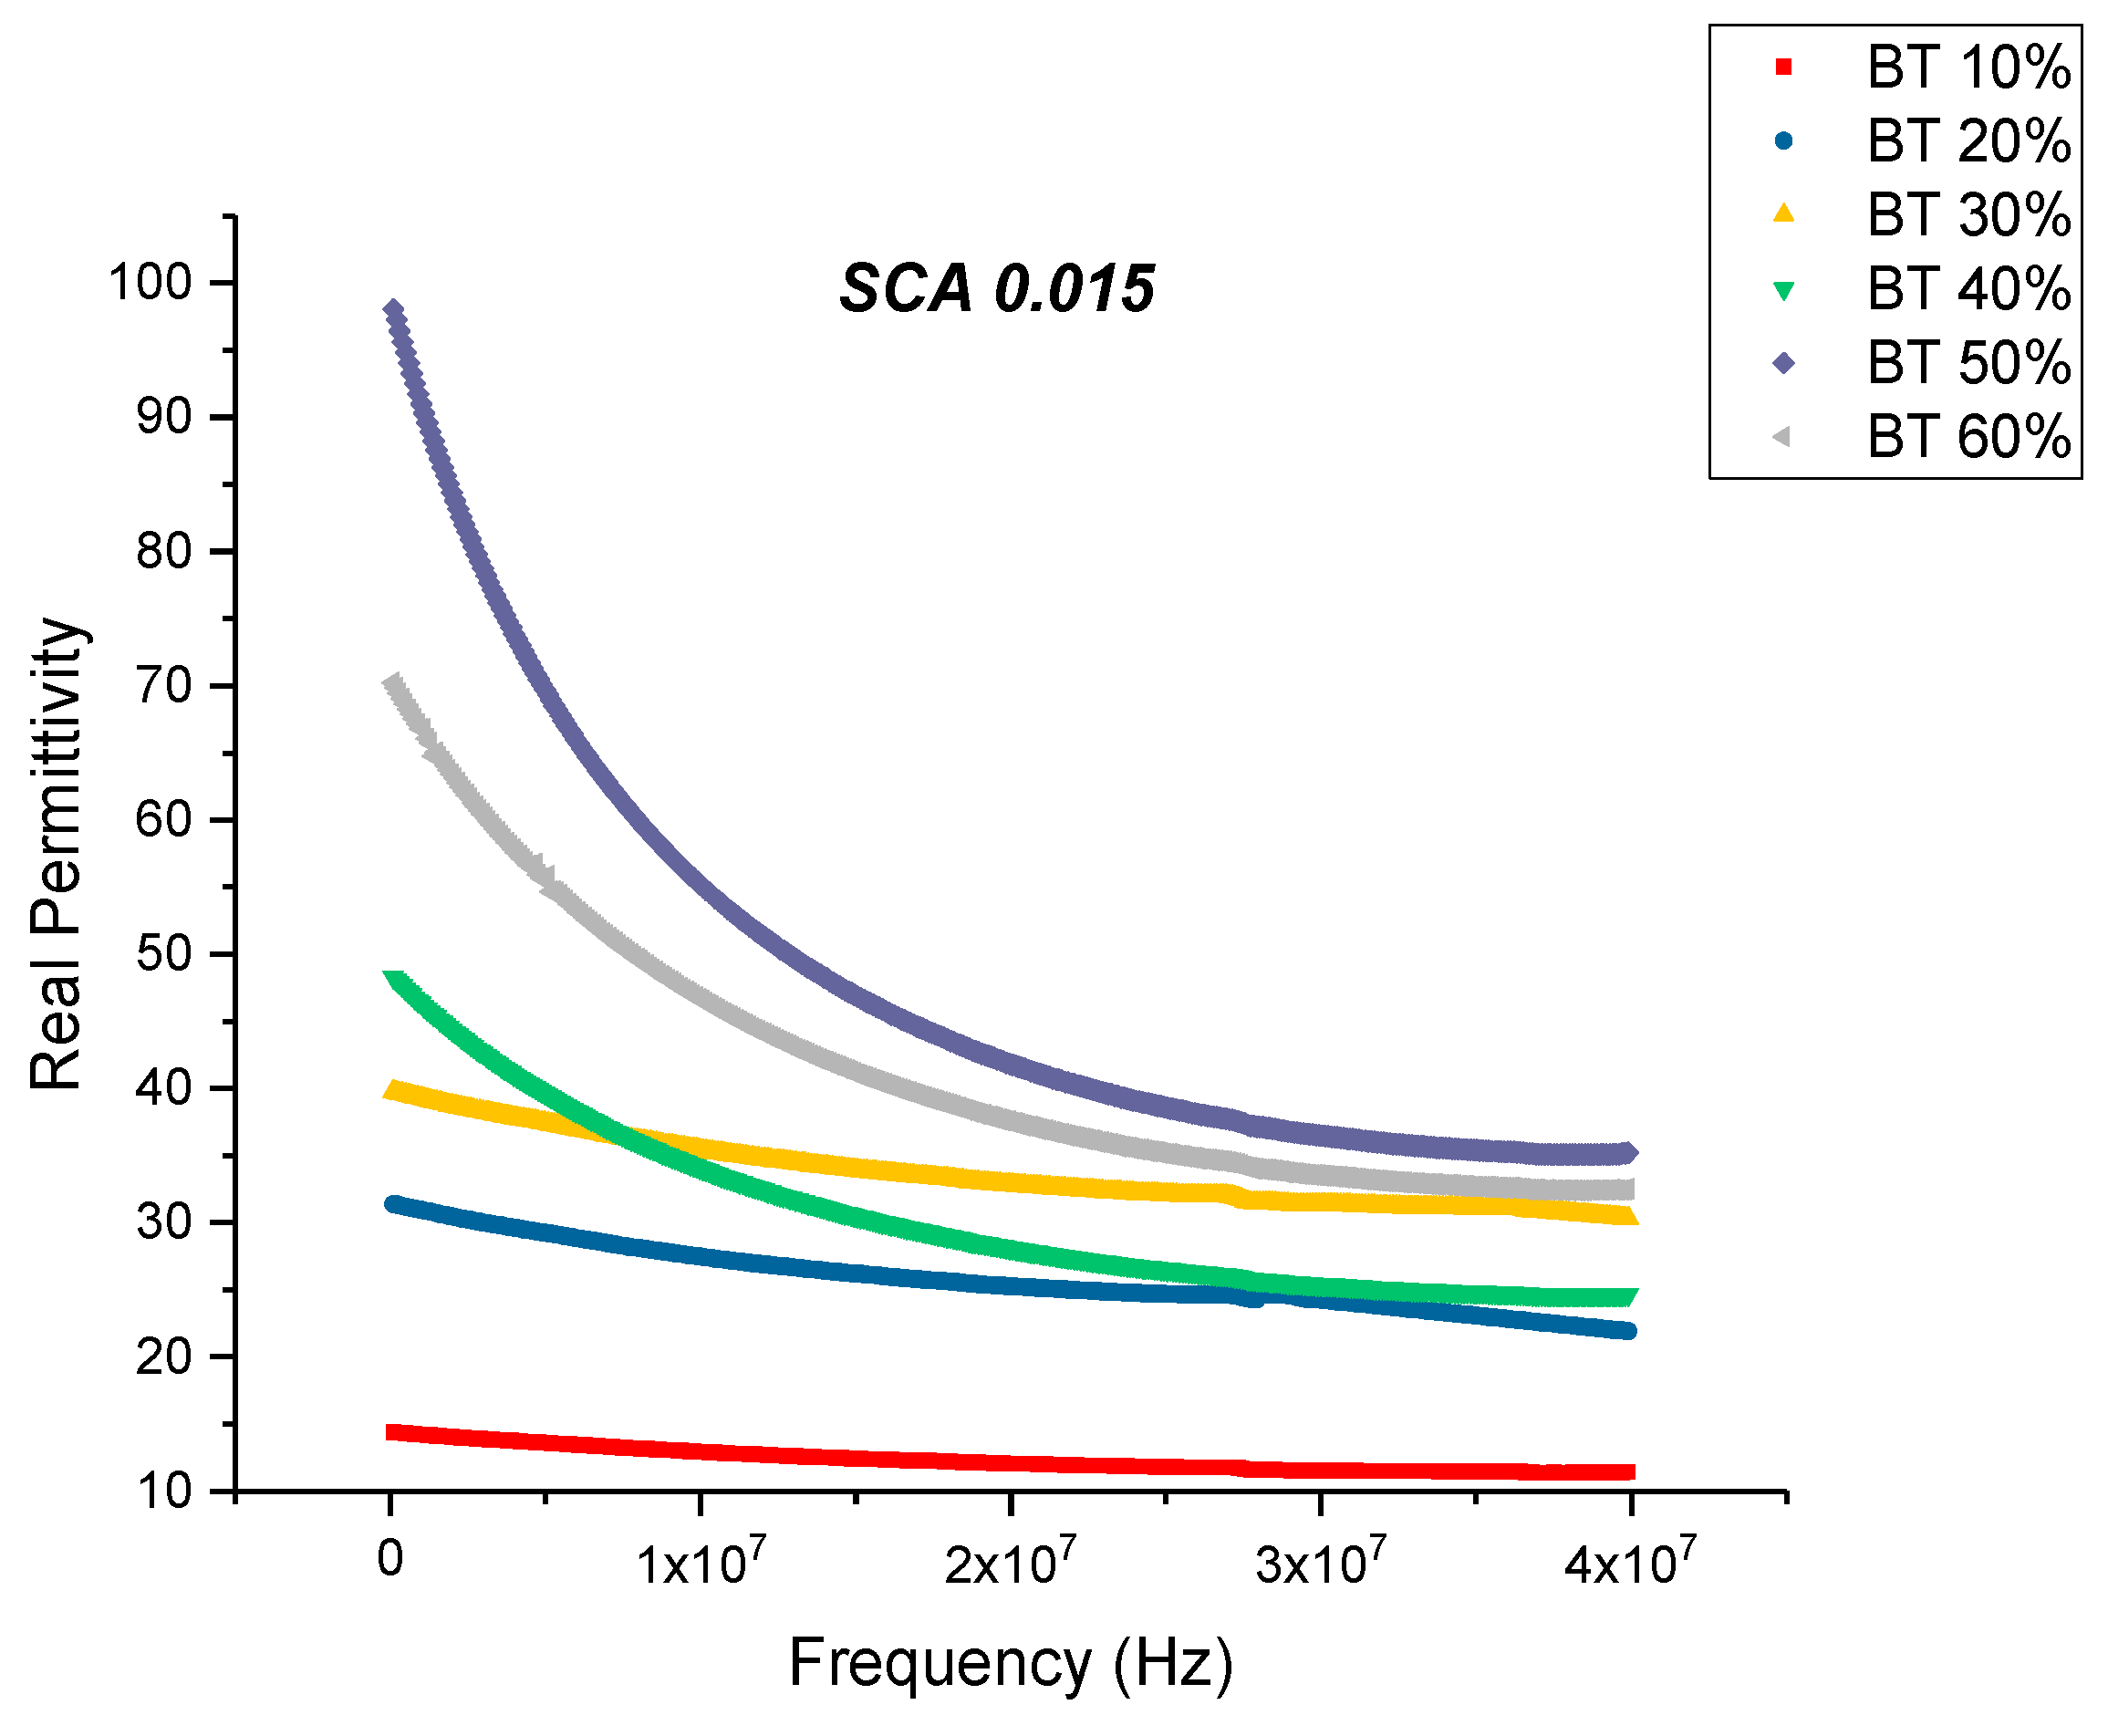
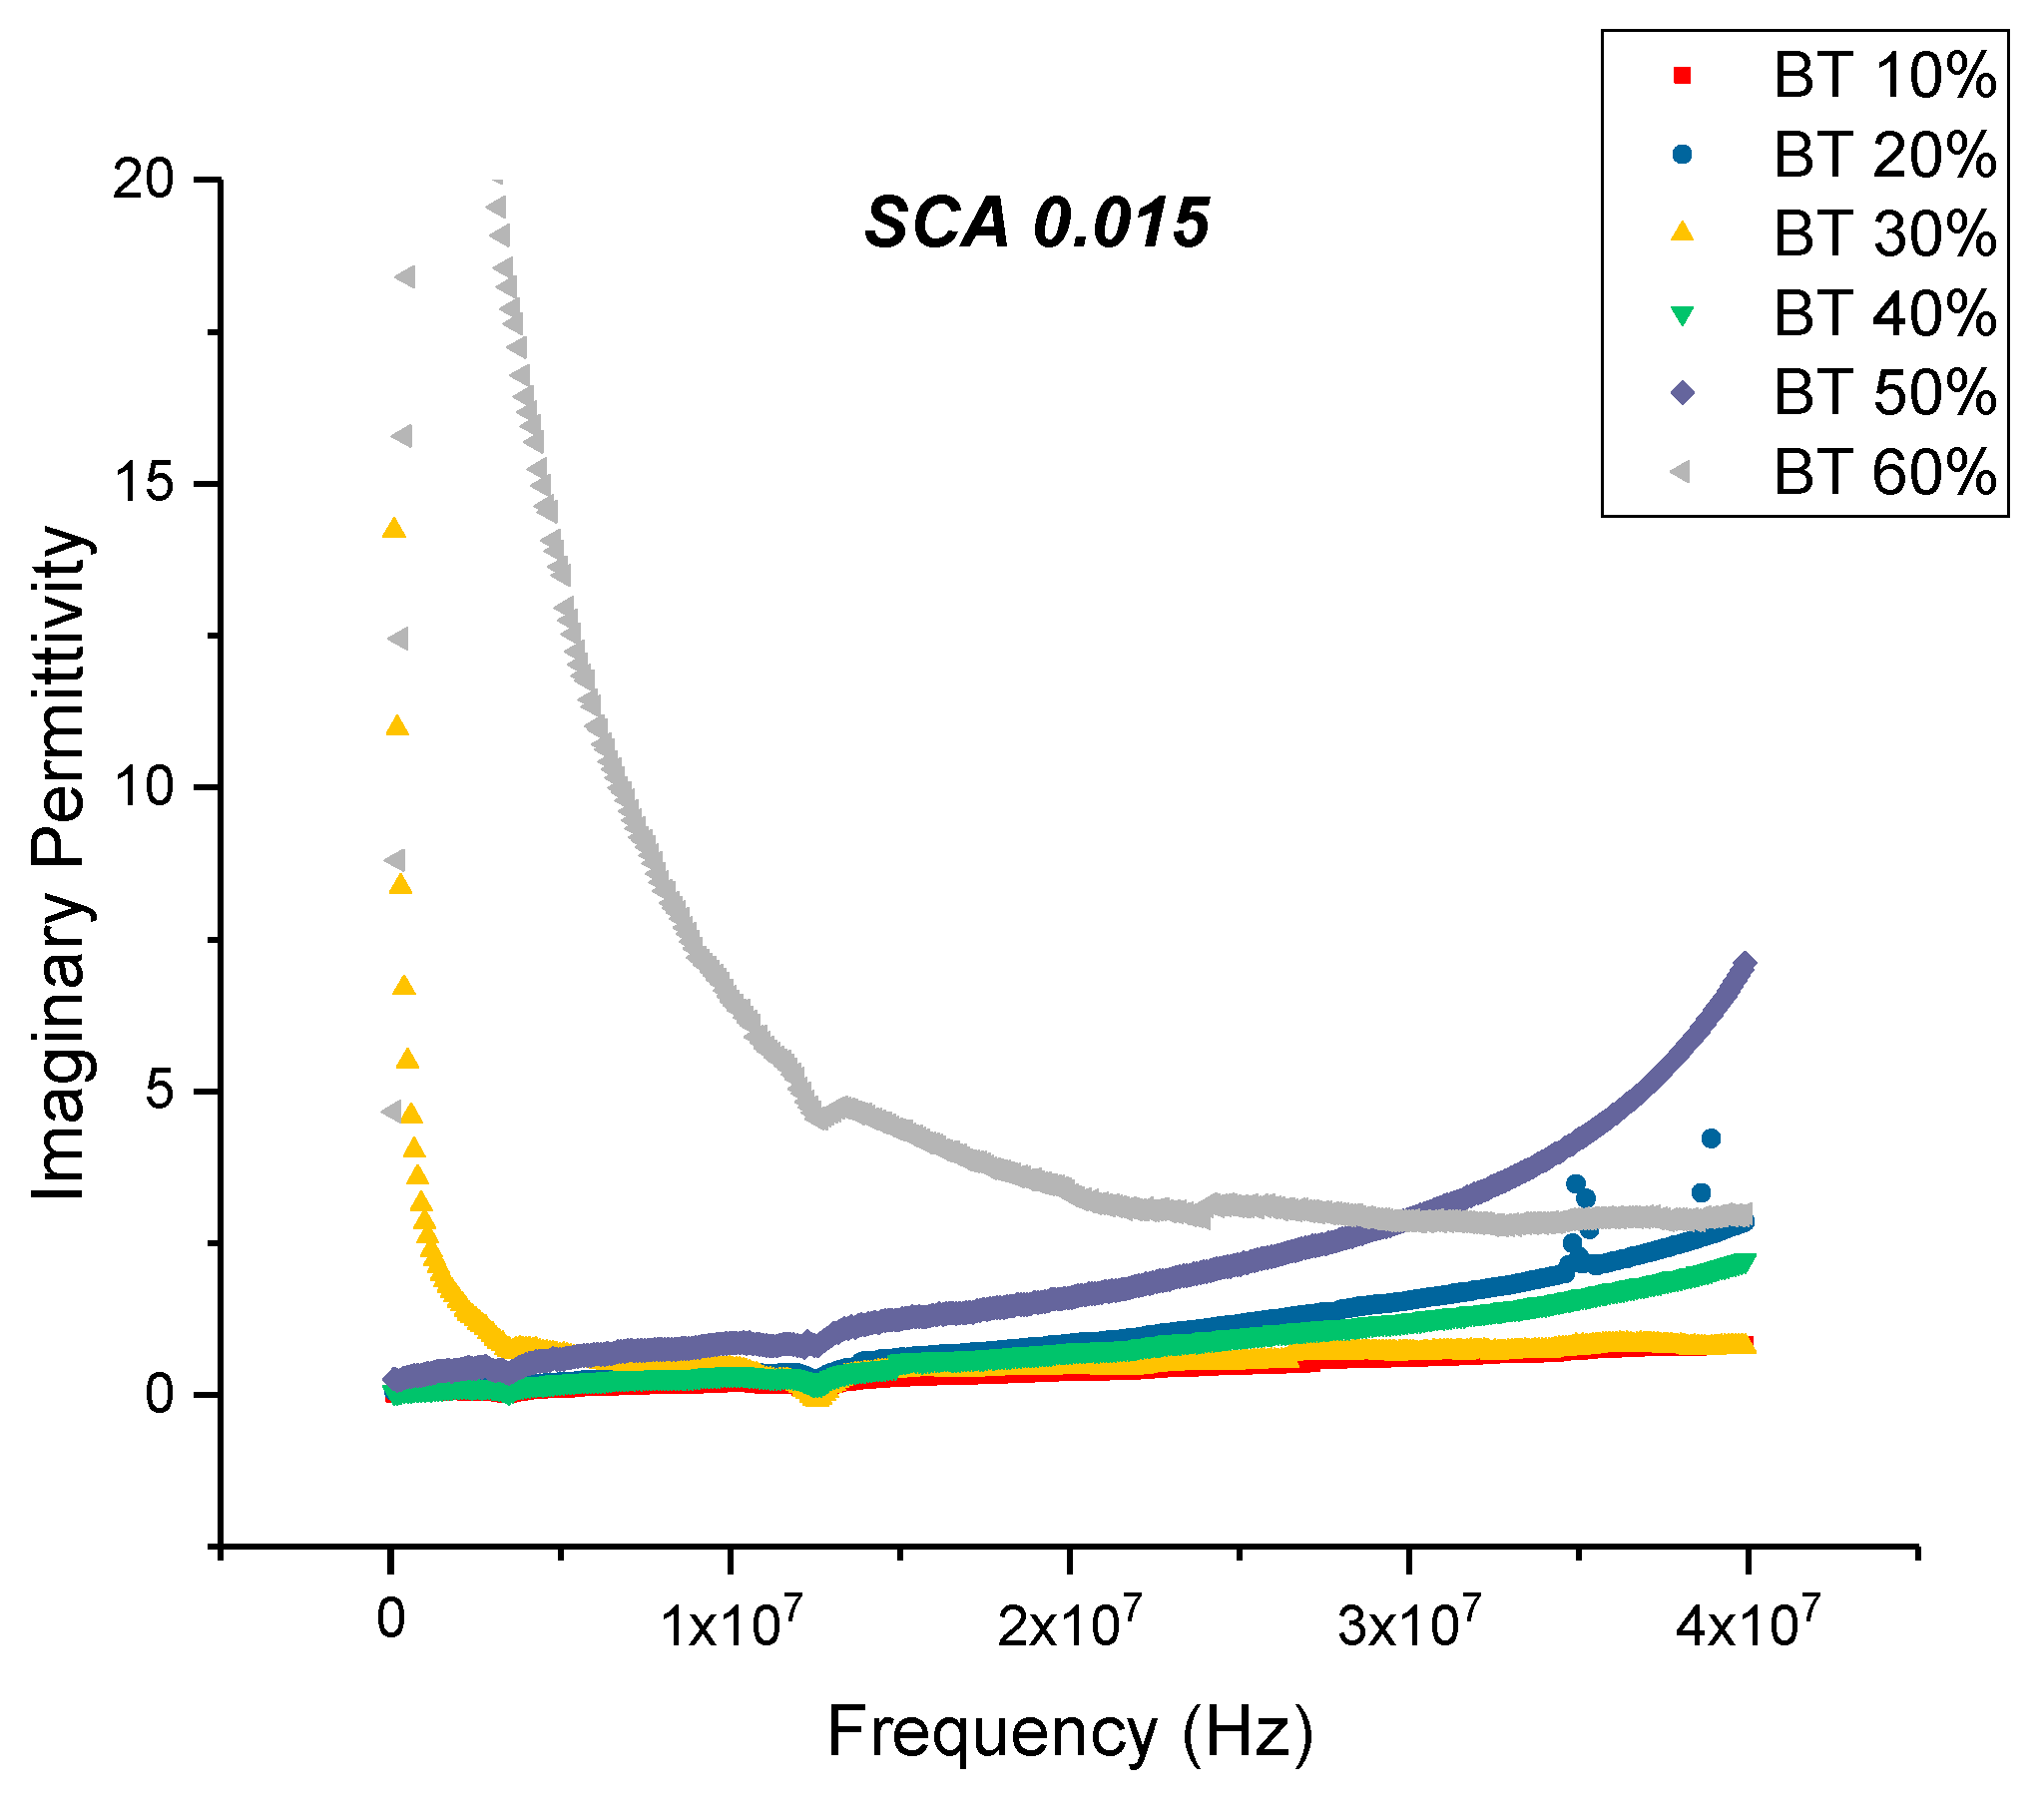
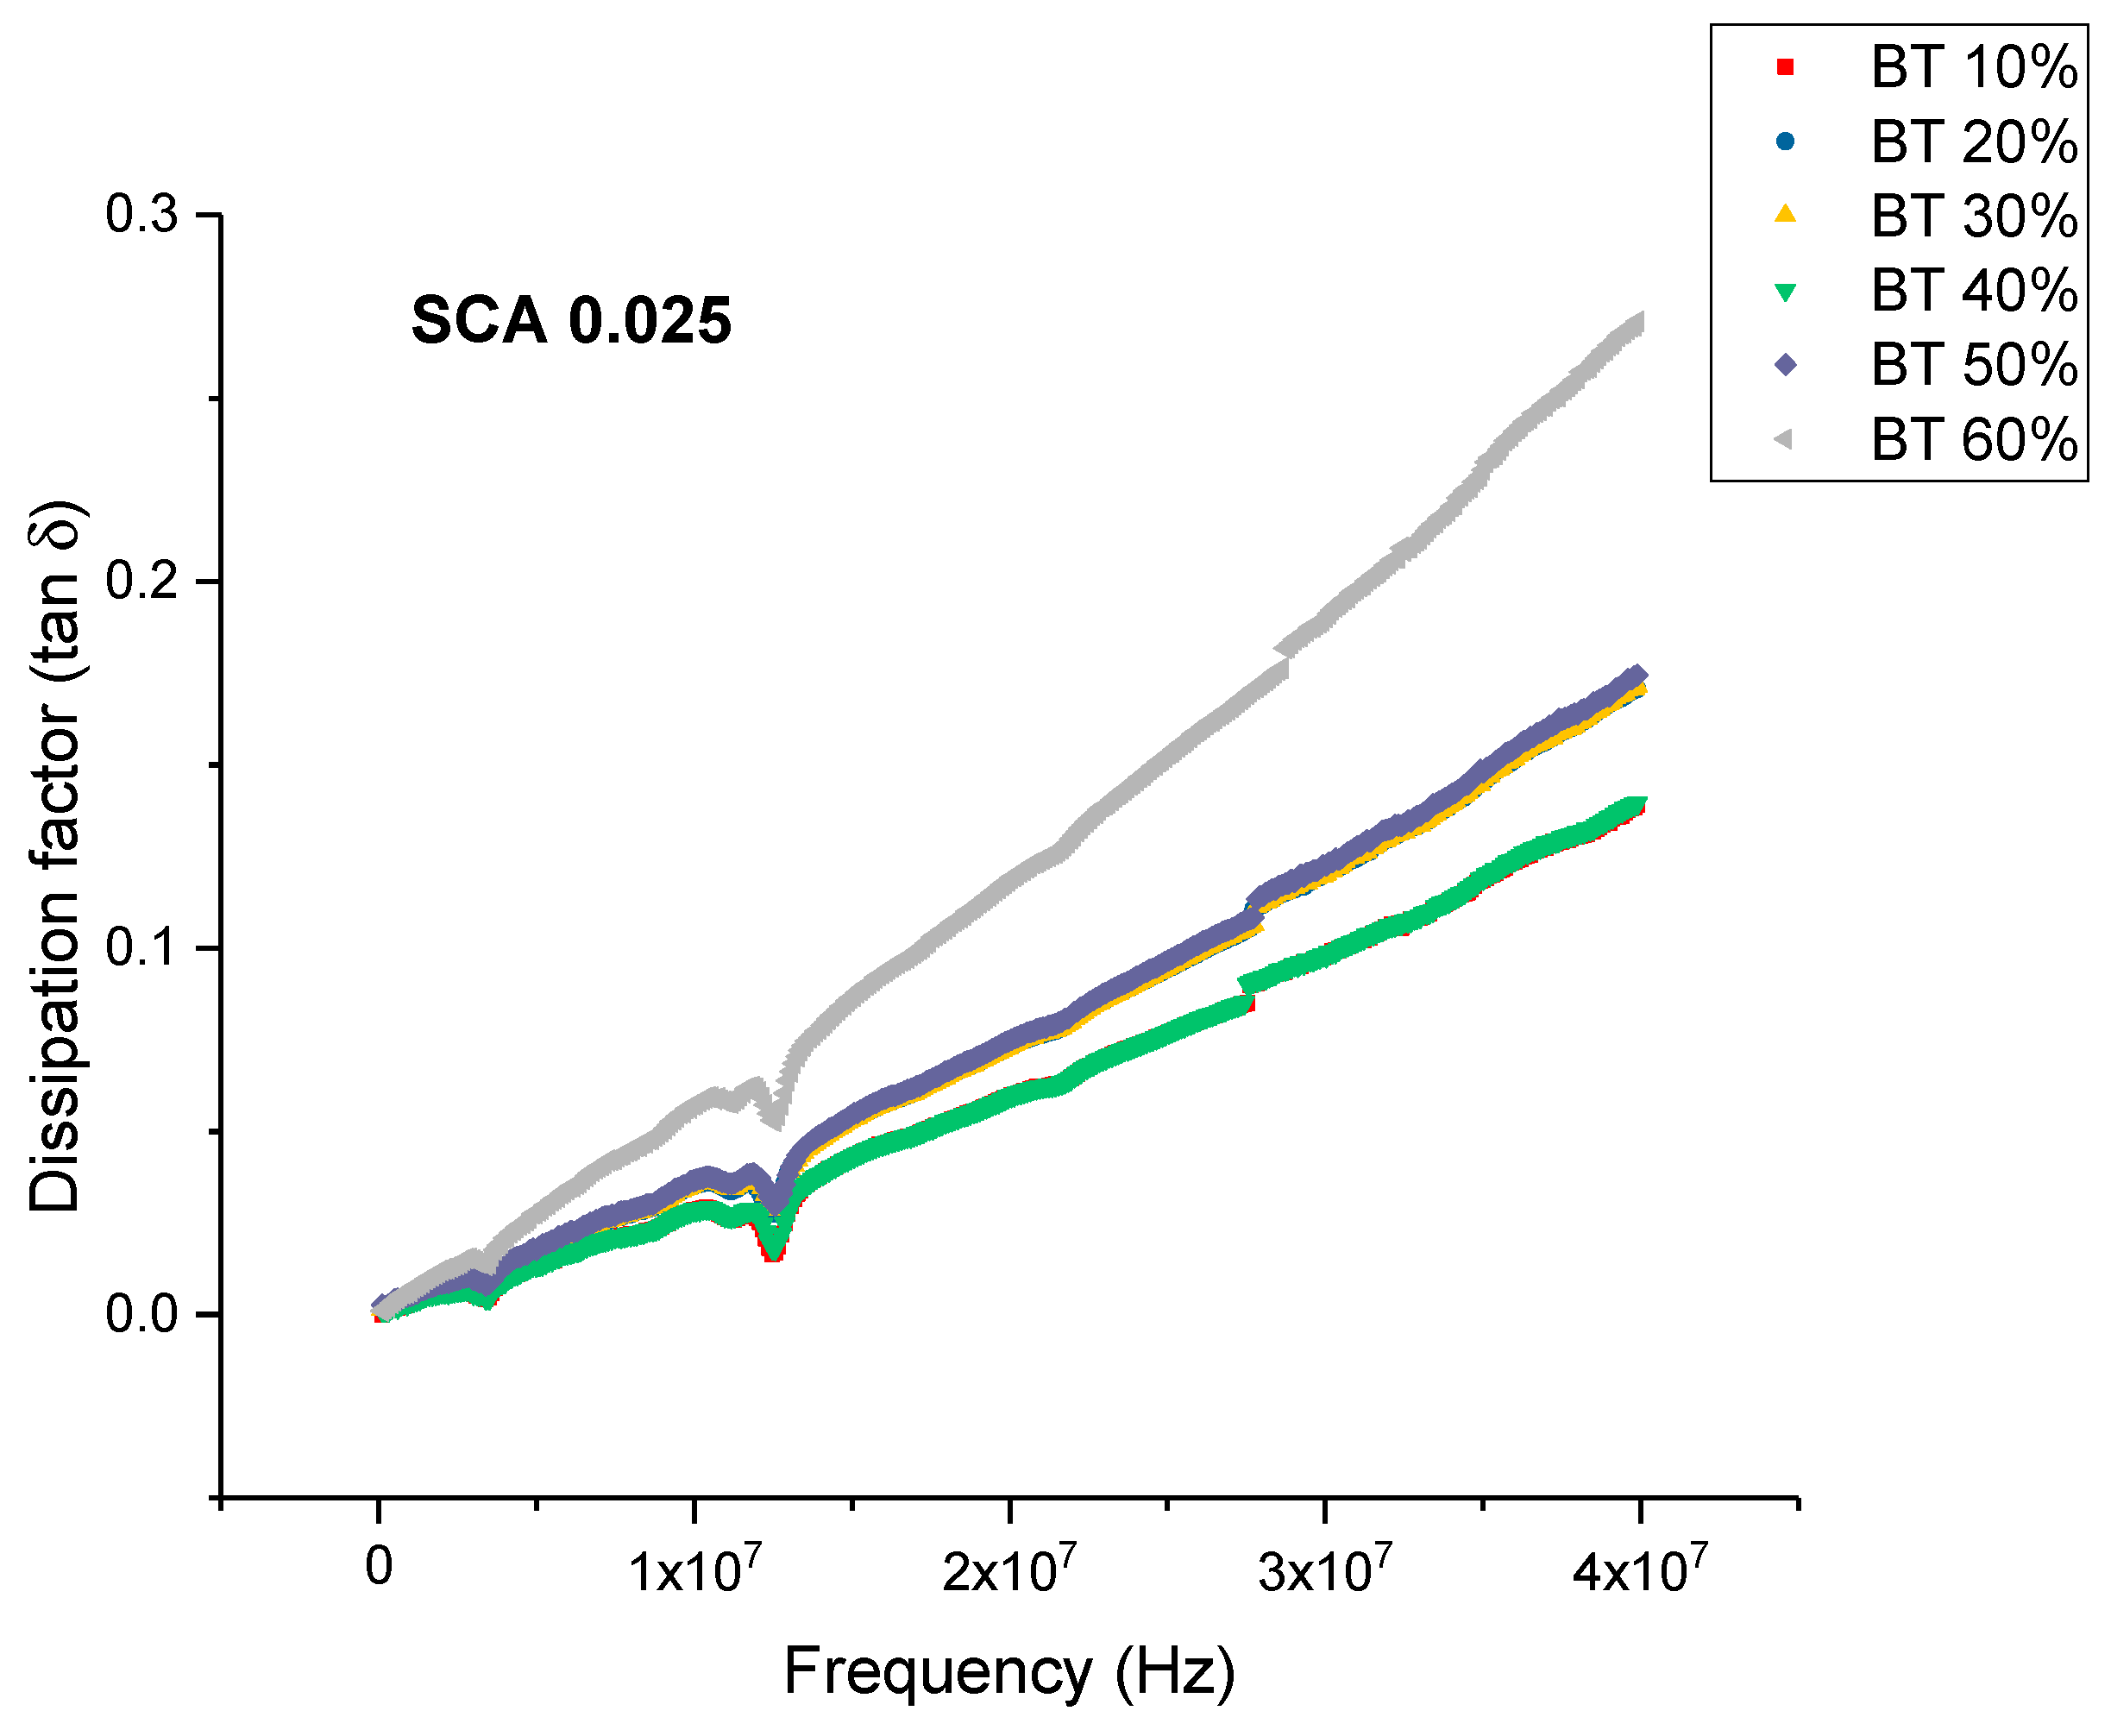
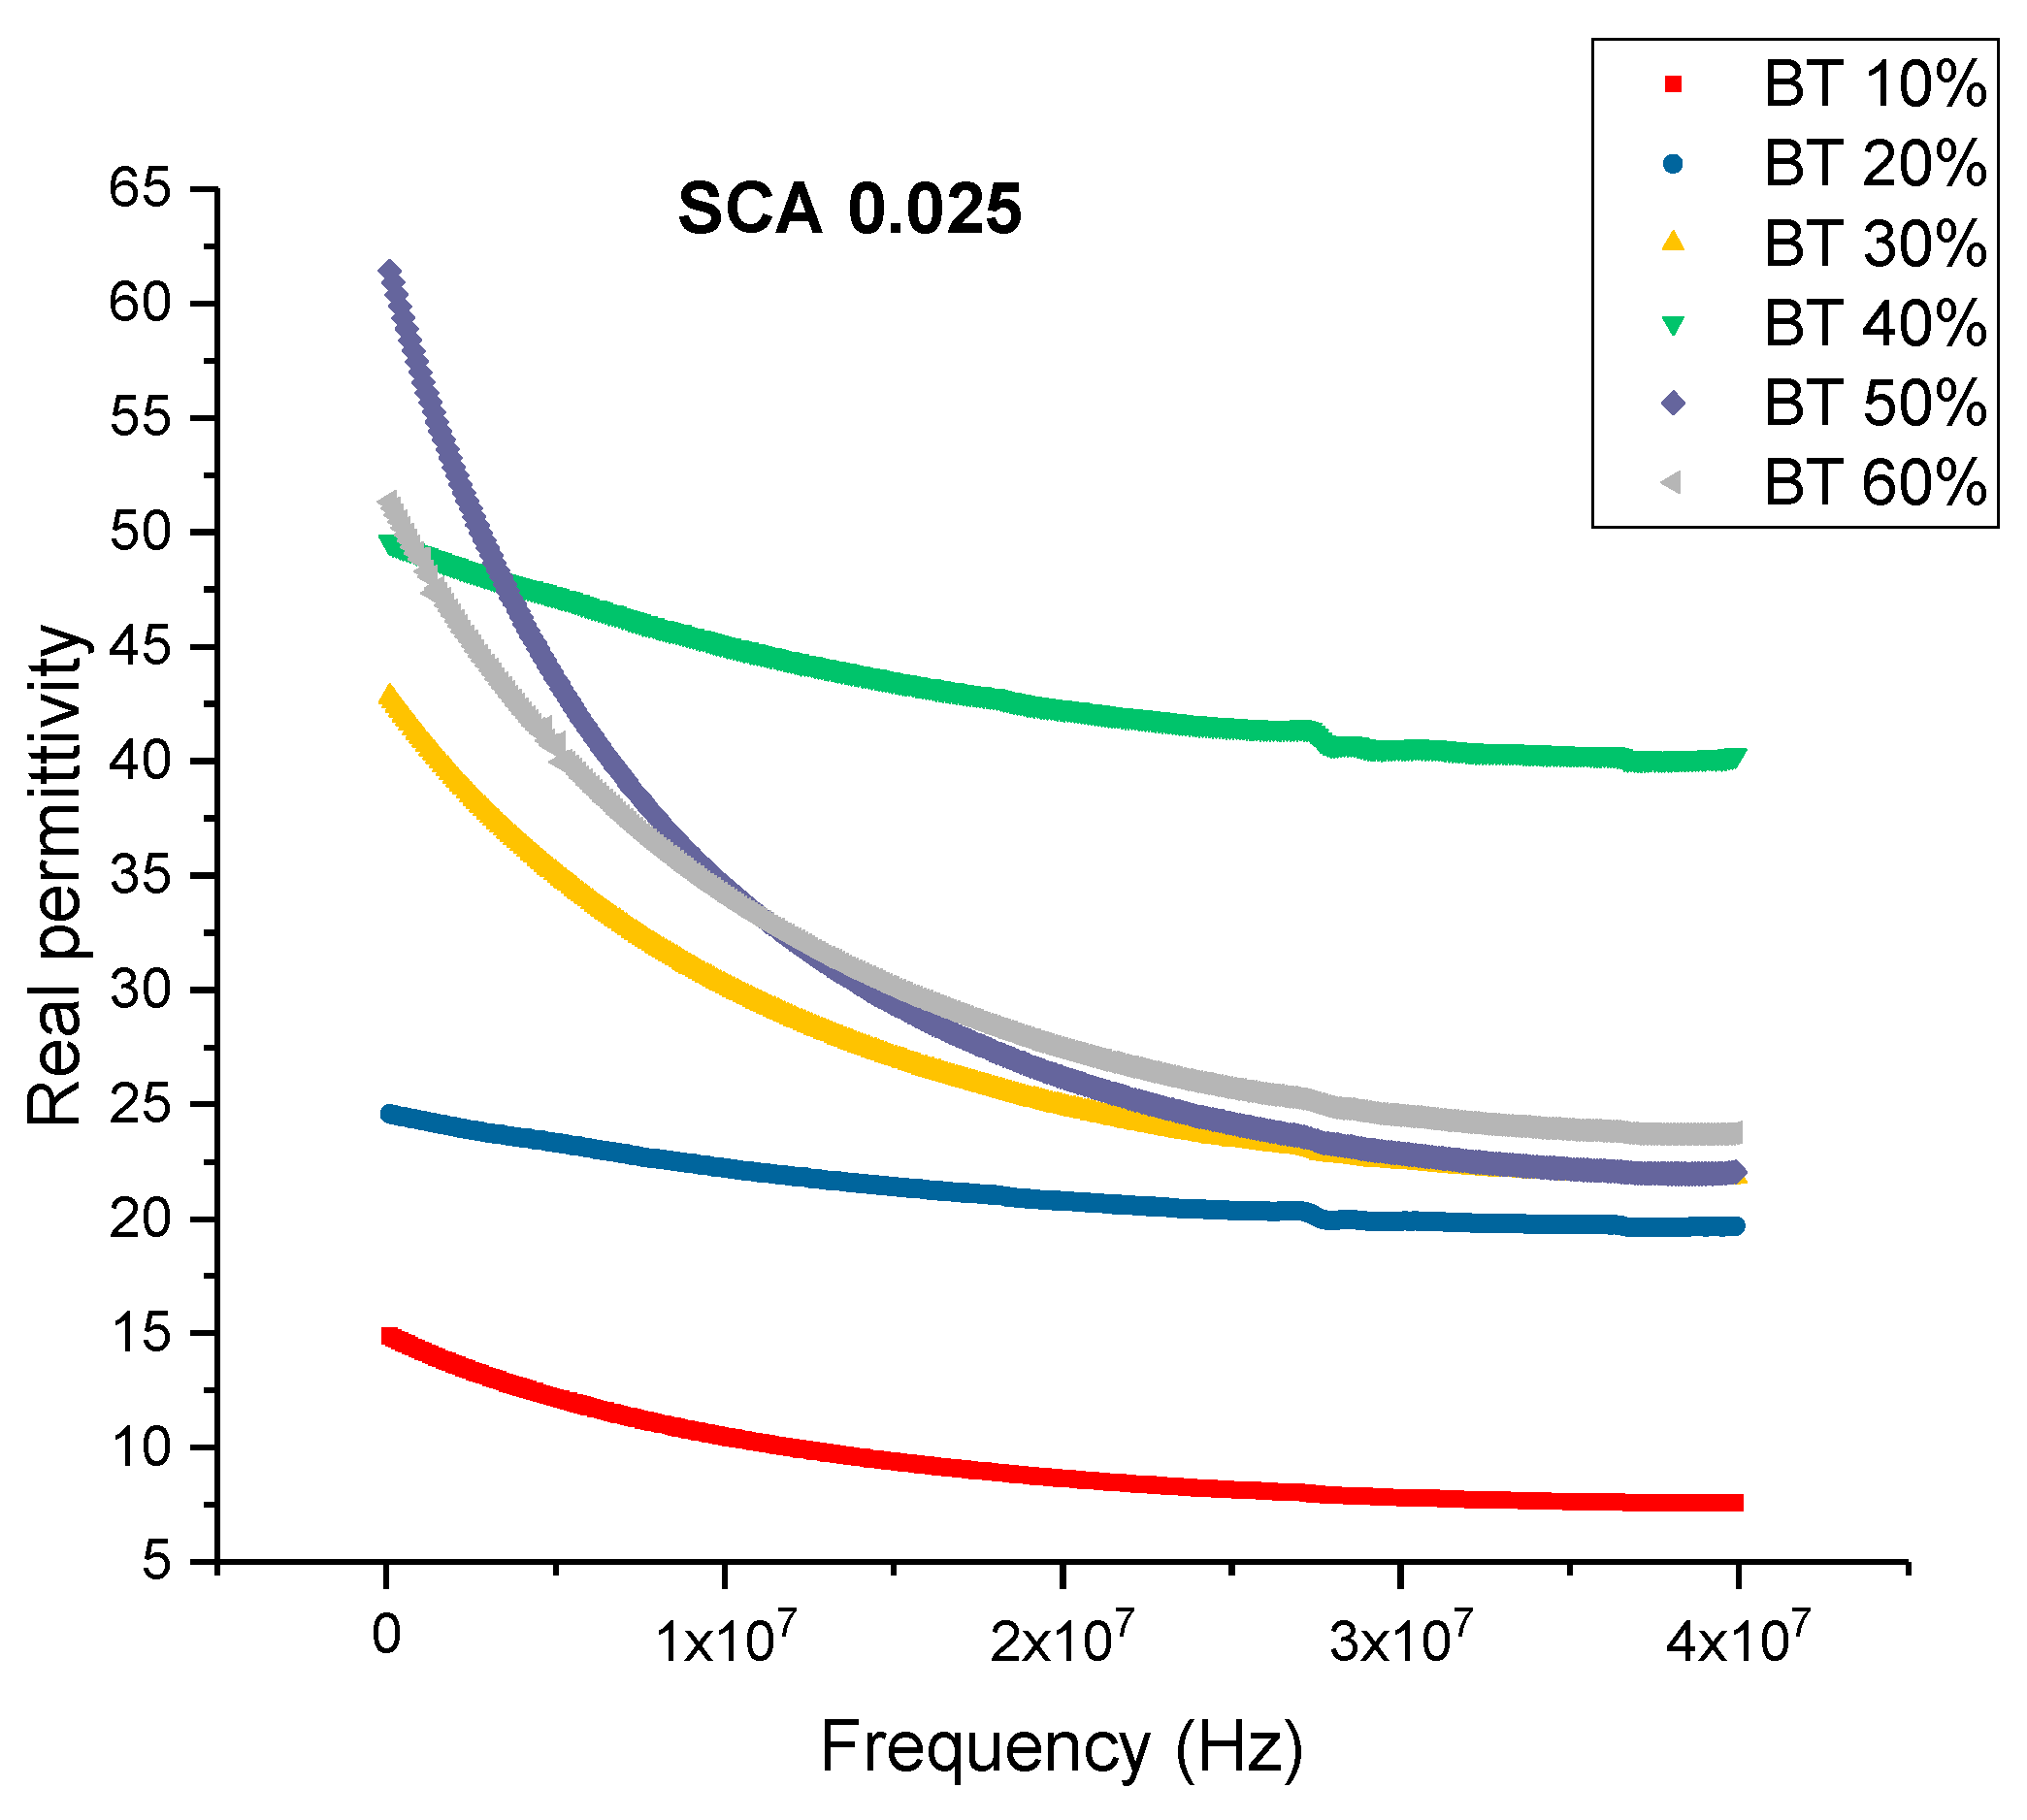
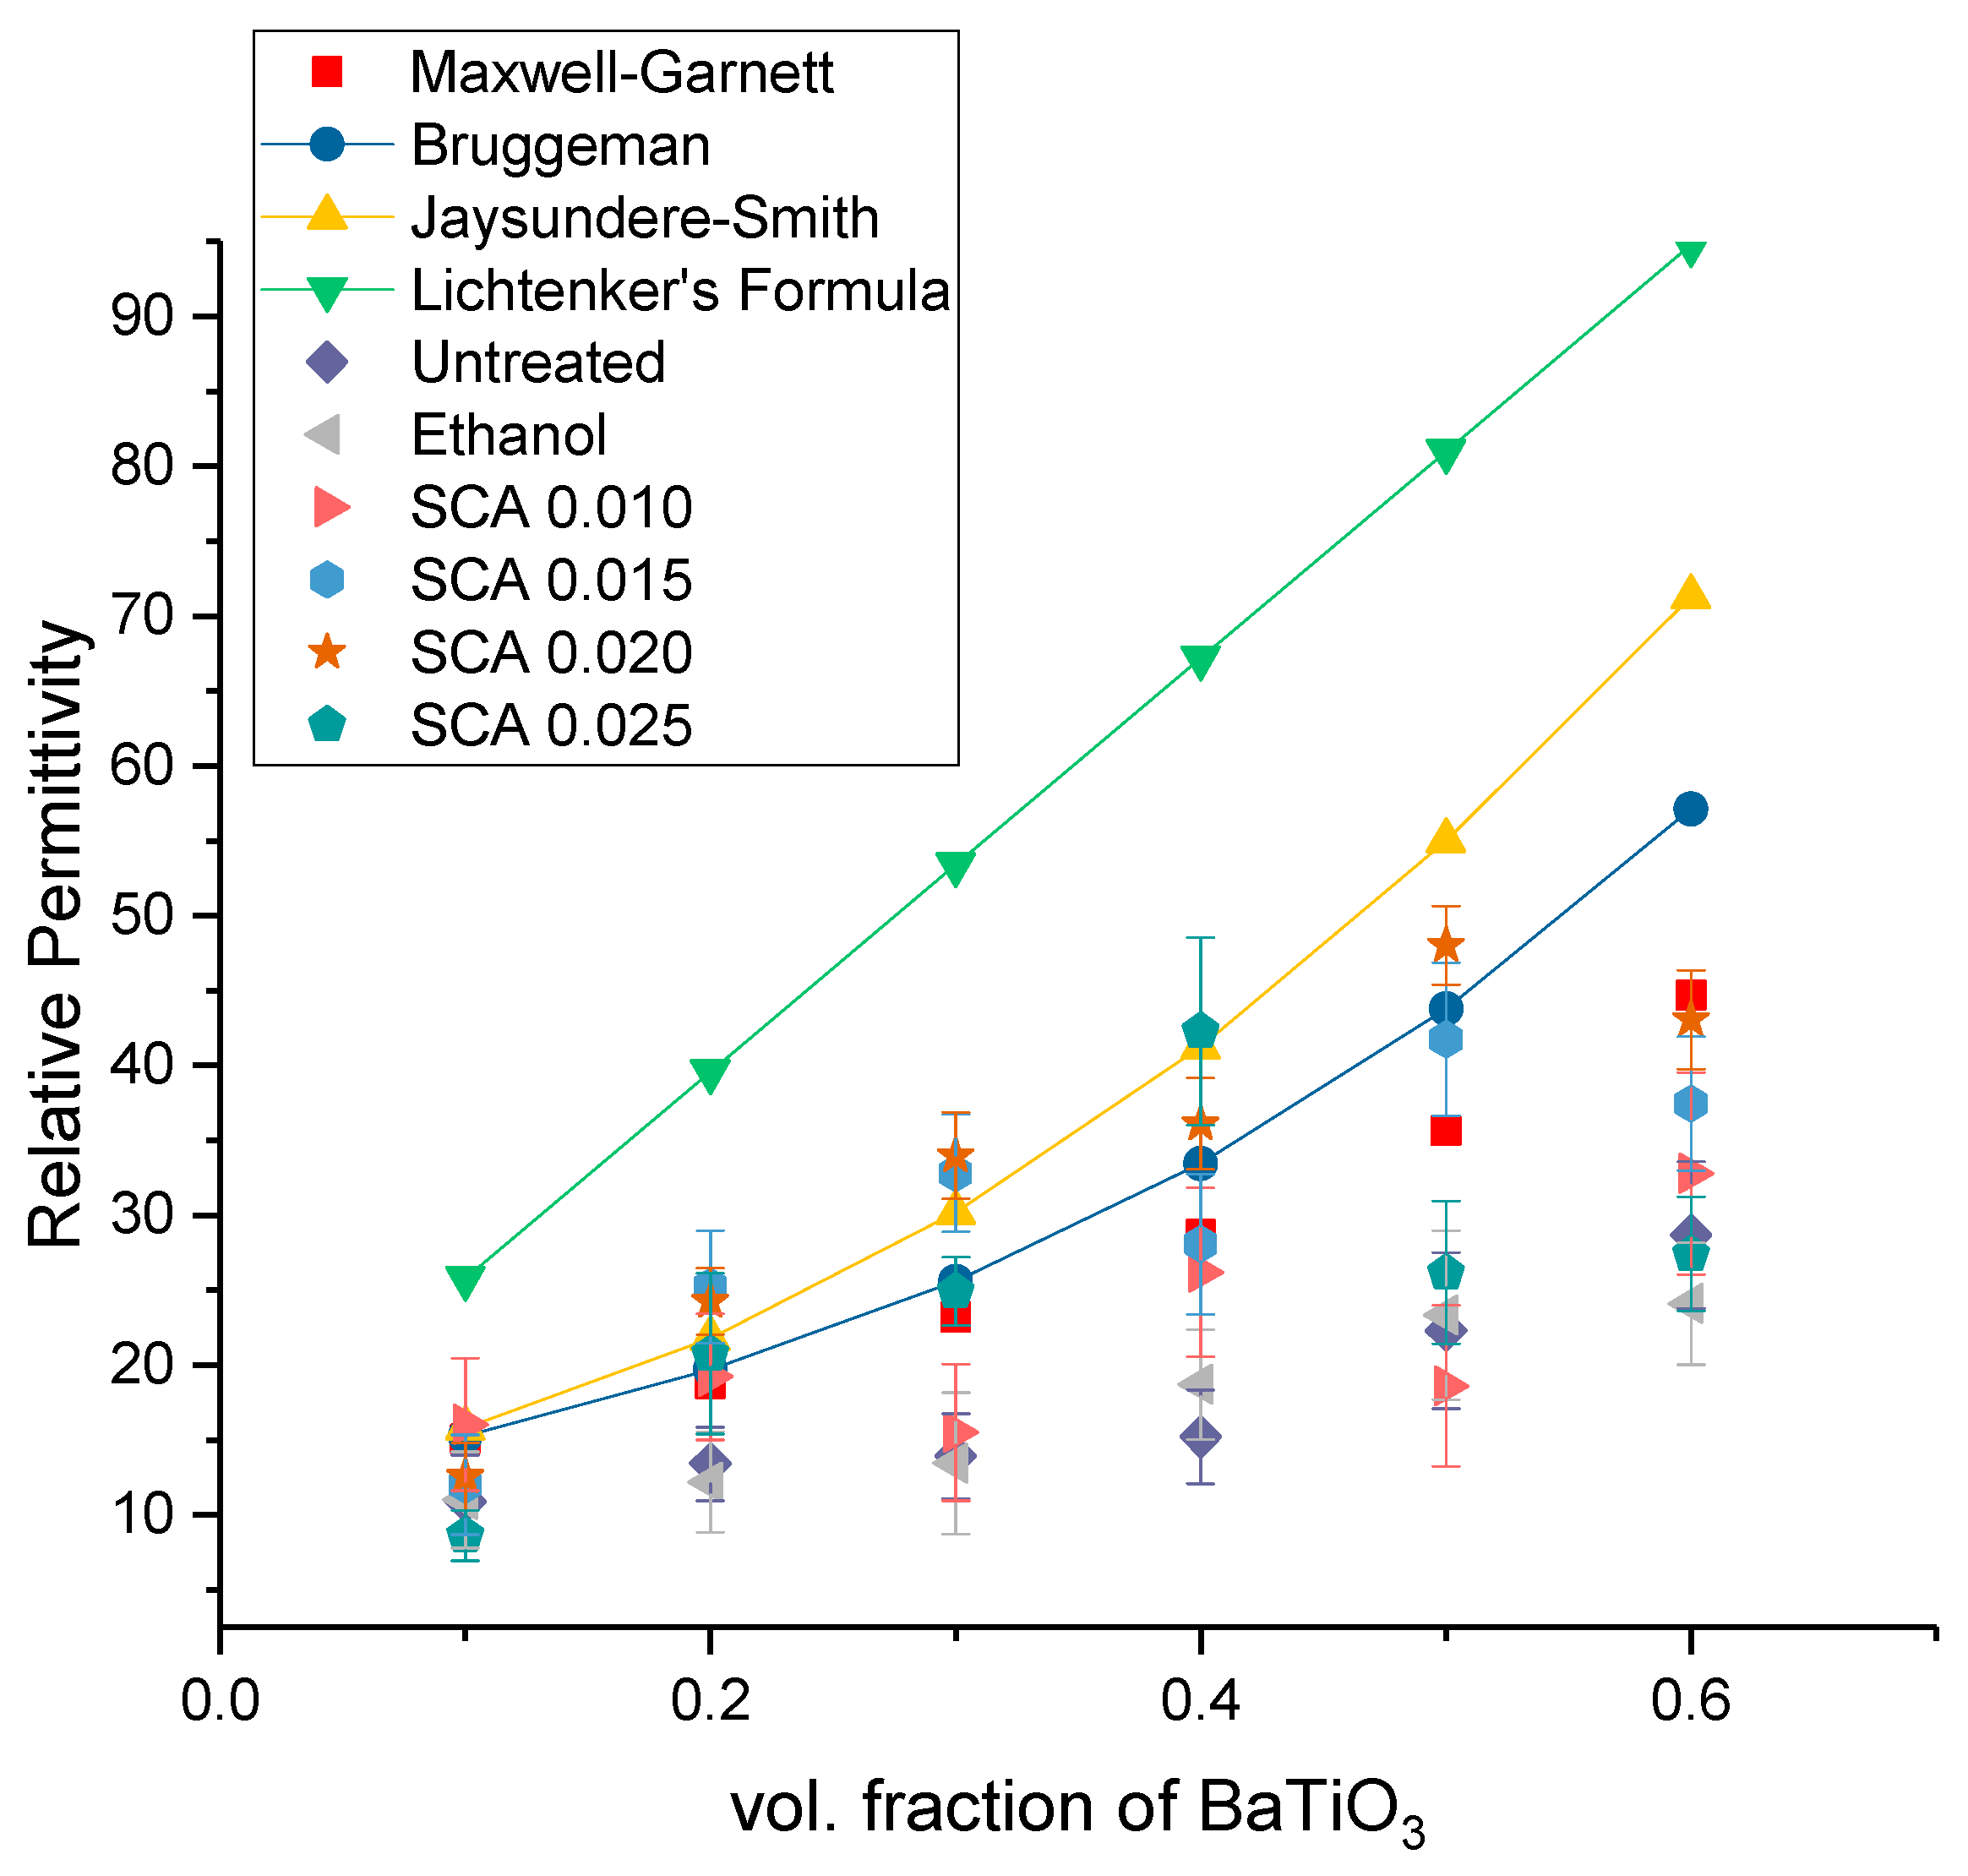
Dielectric Permittivity (BTO-Silane Coupling Agent)
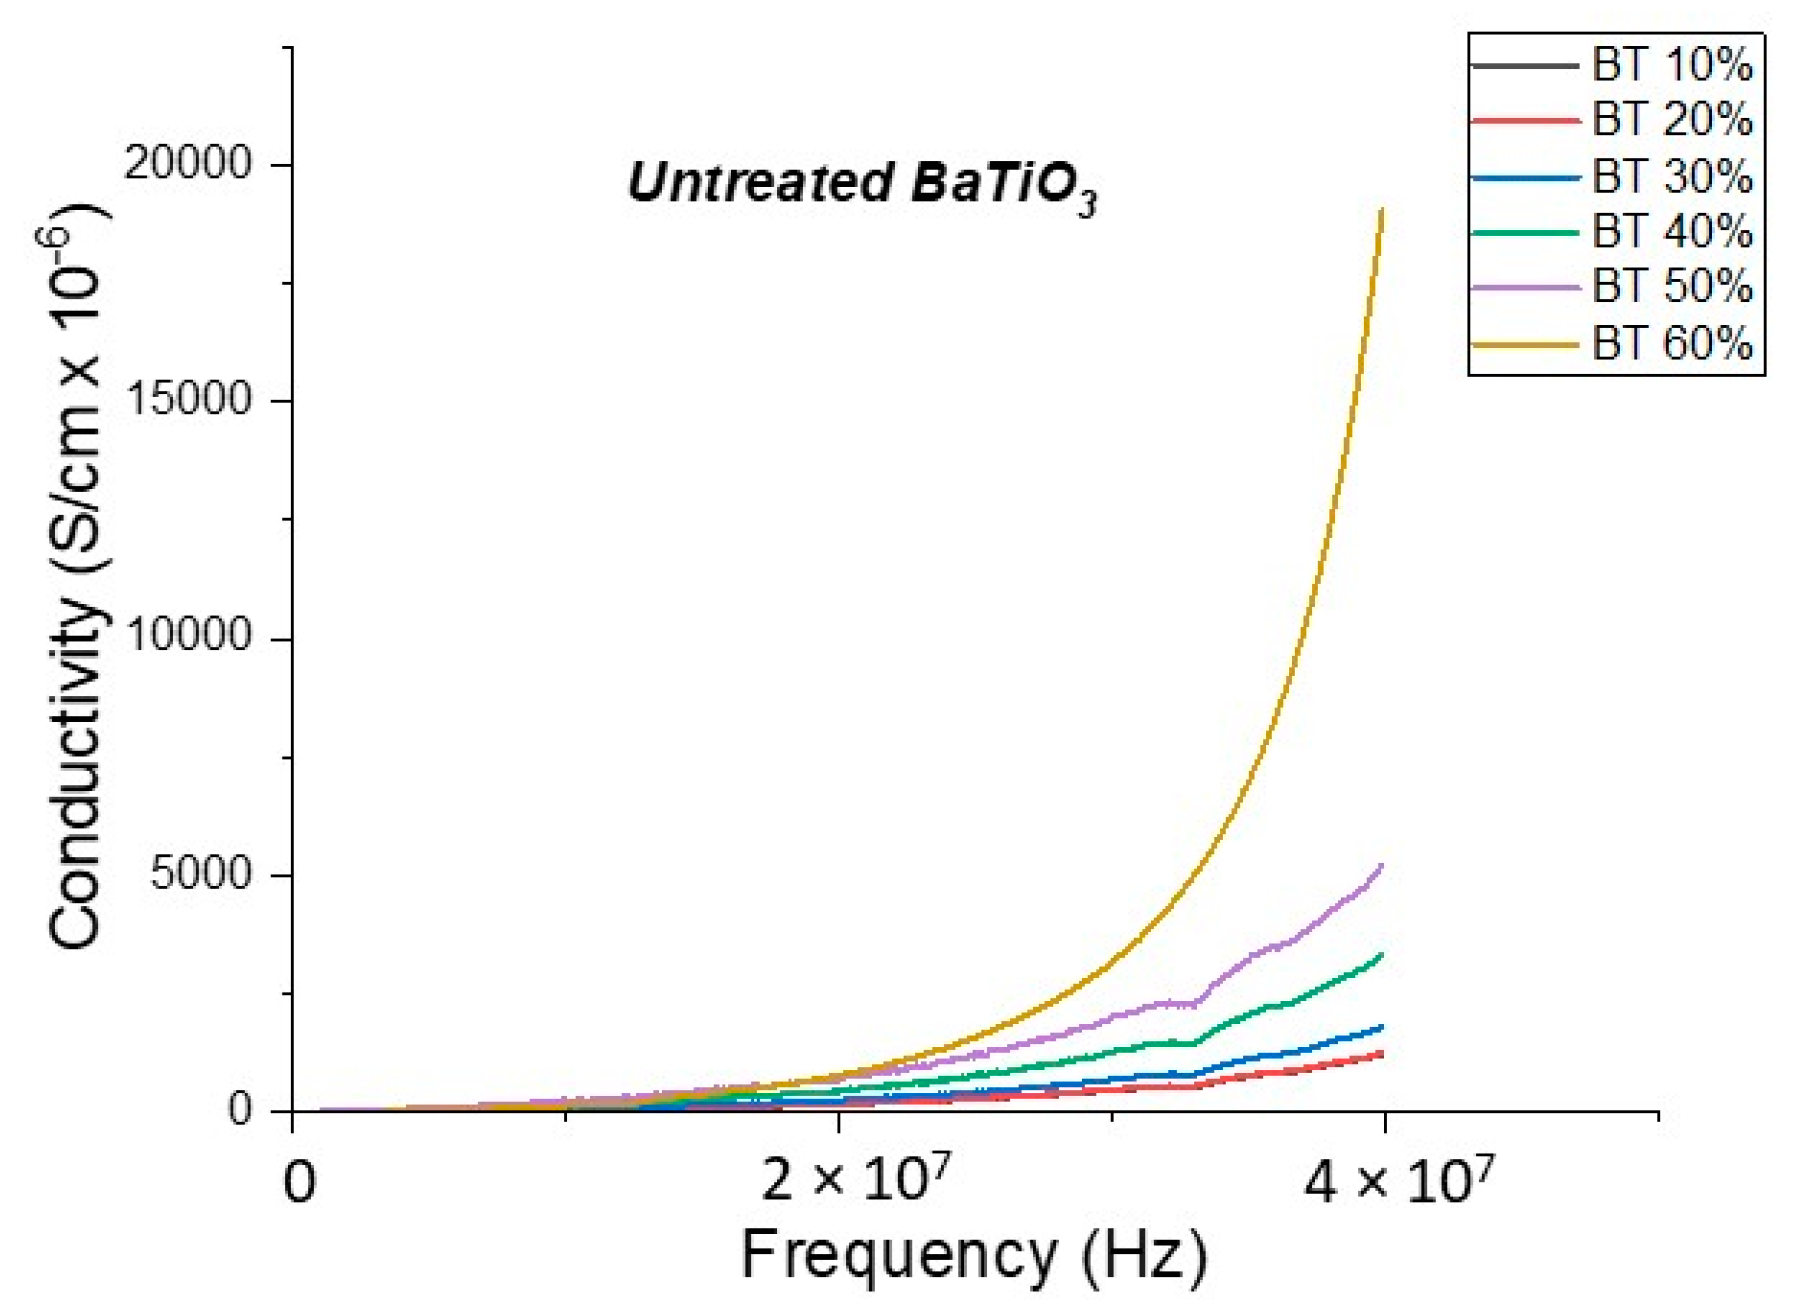
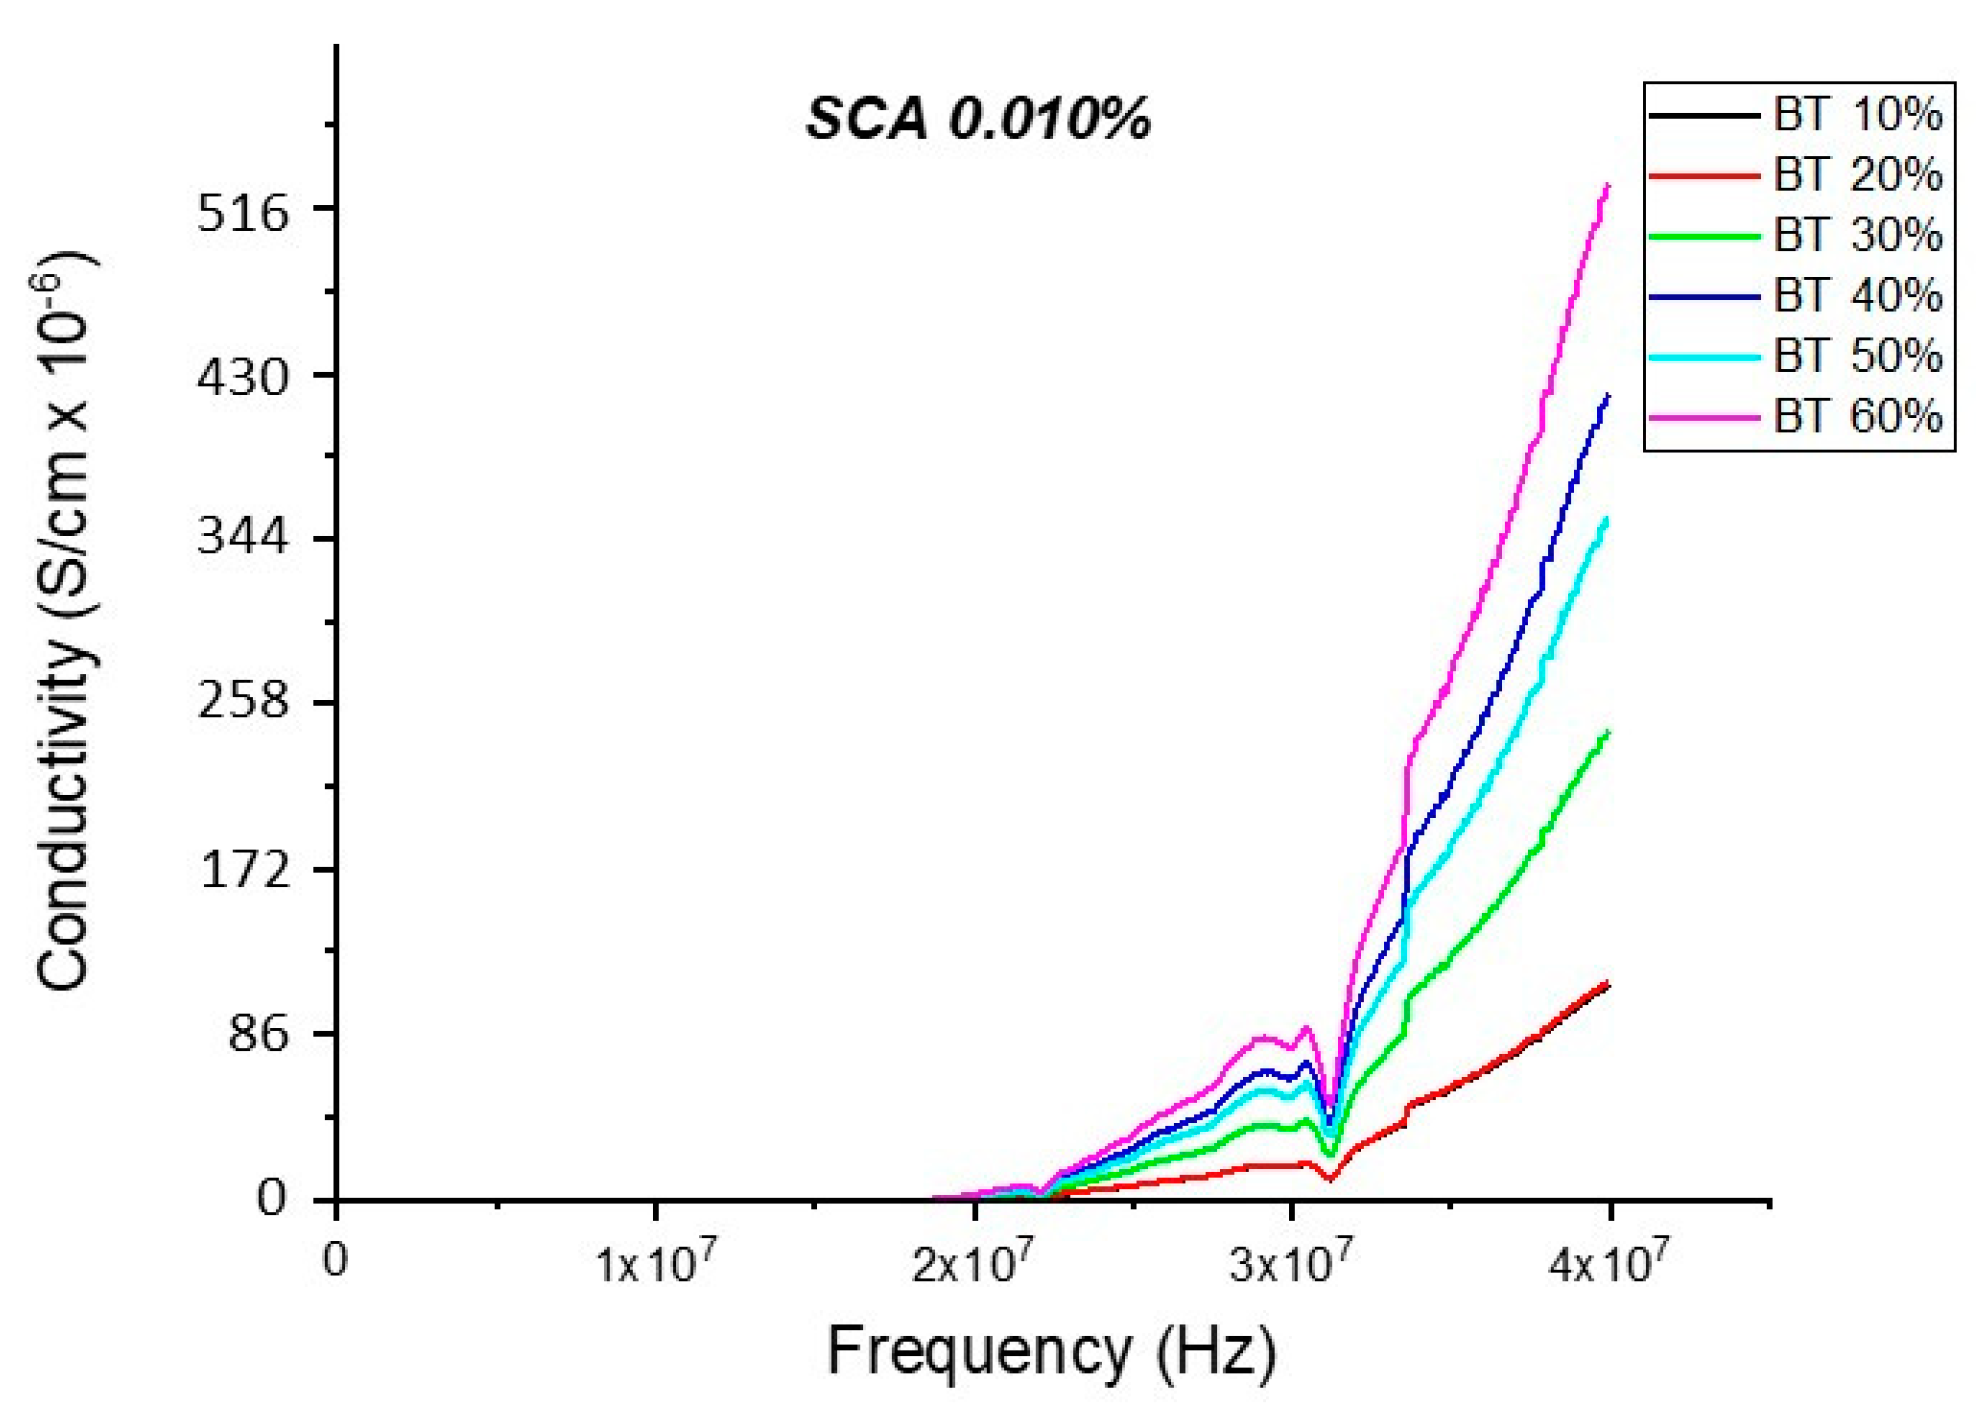
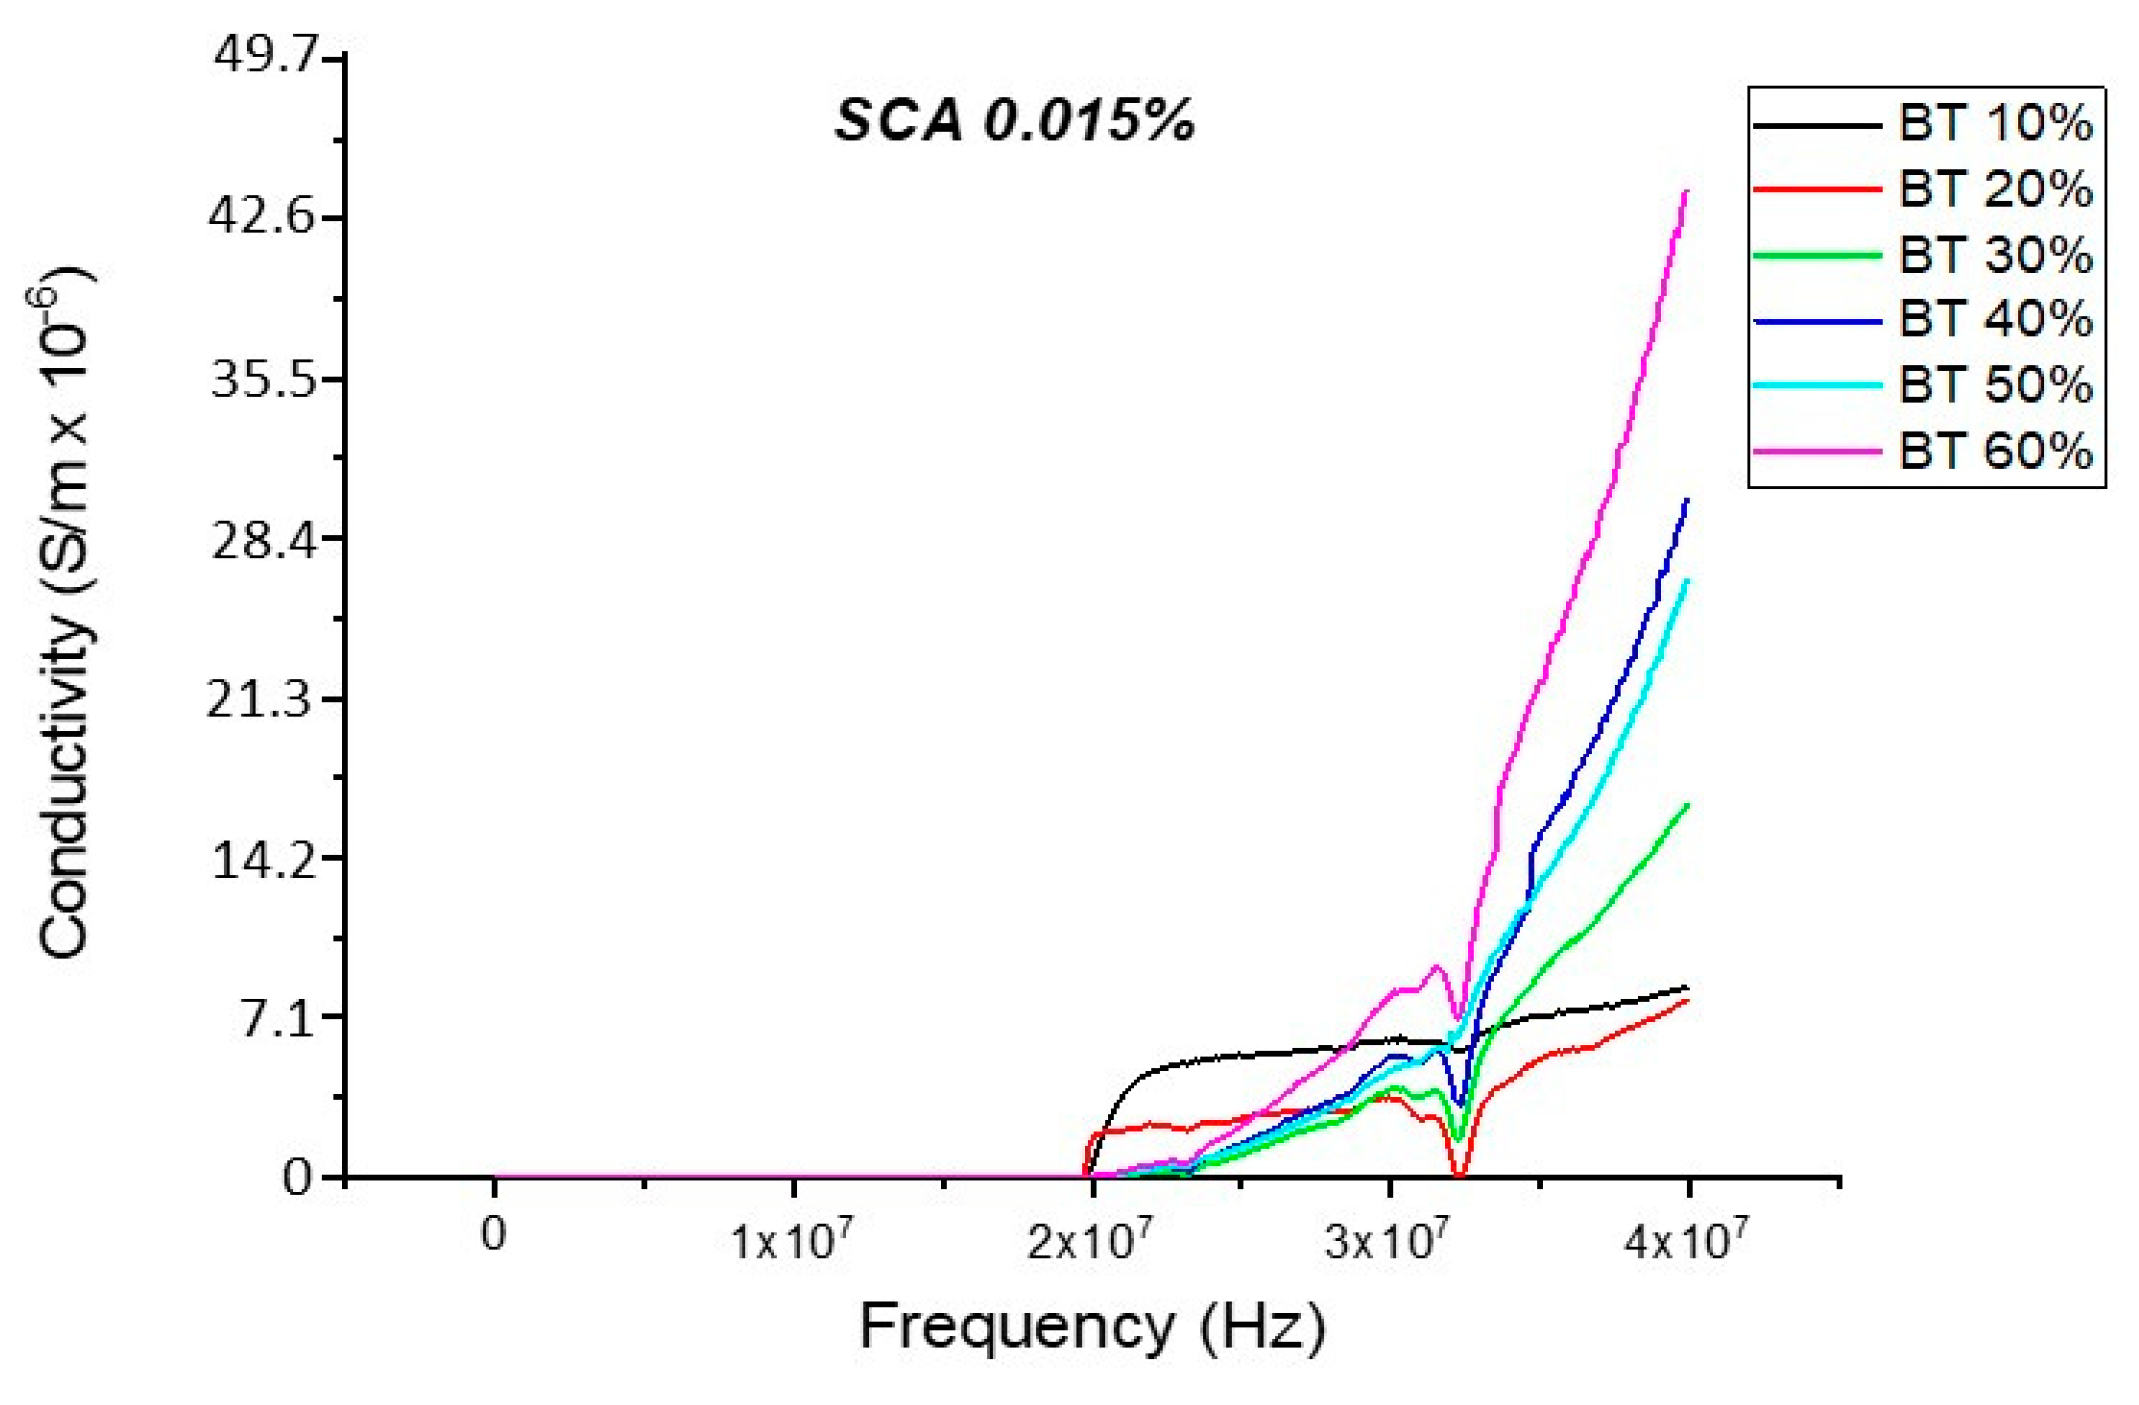
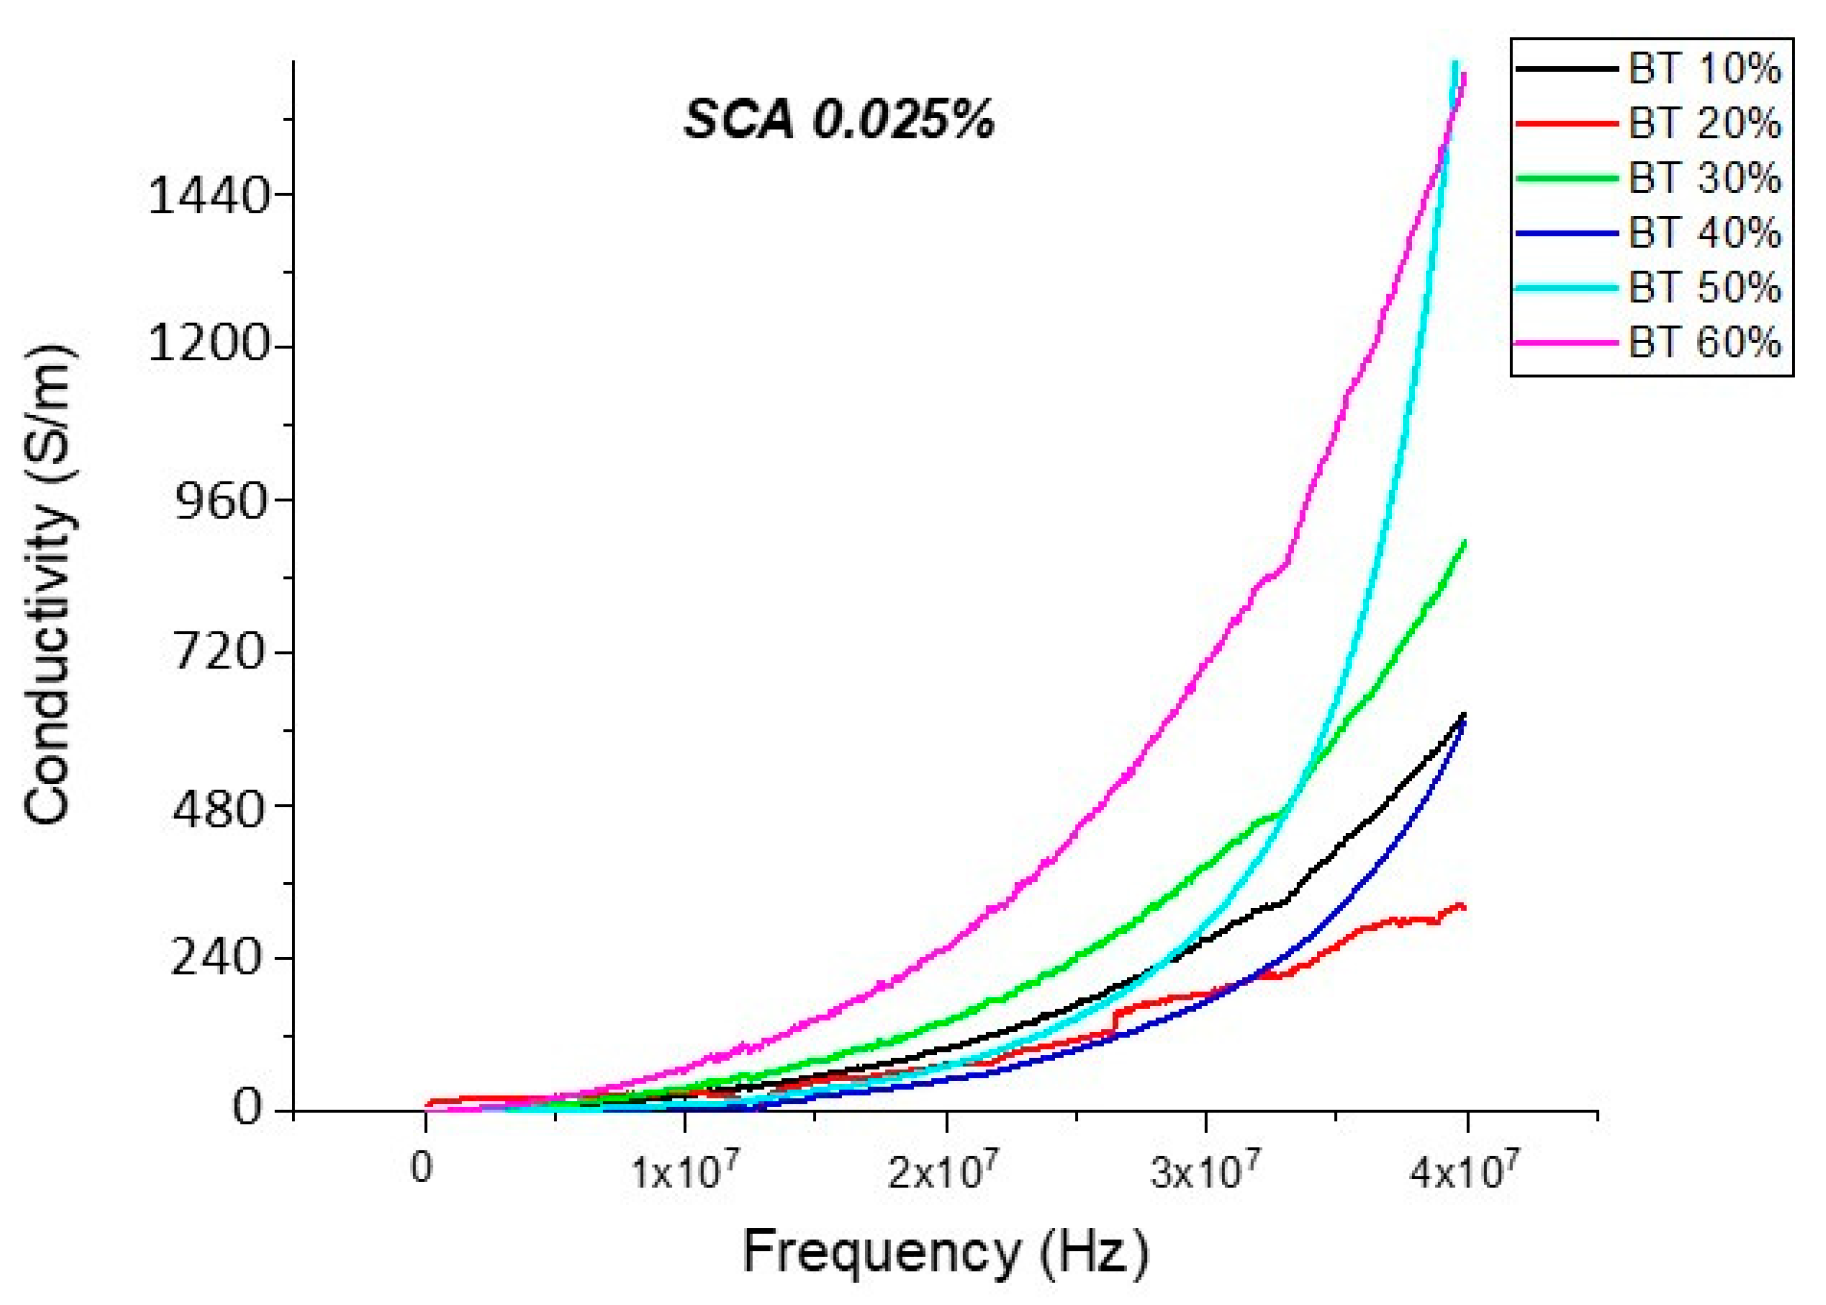
Conductivity (Untreated BTO and BTO-Silane Coupling Agent)
4. Conclusions
Author Contributions
Funding
Conflicts of Interest
References
- Herbert, J. Ceramic Dielectrics and Capacitors, Electrocomponent Science Monographs; Gordon and Breach Science Publishers: New York, NY, USA, 1985; Volume 6. [Google Scholar]
- Mizukoshi, T. Capacitor Market in Japan: Key Research Findings 2009. Available online: https://www.yanoresearch.com/press/pdf/554.pdf (accessed on 21 March 2020).
- Zou, K.; Dan, Y.; Xu, H.; Zhang, Q.; Lu, Y.; Huang, H.; He, Y. Recent advances in lead-free dielectric materials for energy storage. Mater. Res. Bull. 2019, 113, 190–201. [Google Scholar] [CrossRef]
- Qiao, Y.; Li, W.; Zhang, Y.; Jing, L.; Yang, X.; Gao, C.; Cao, W.; Fei, W. Ba and Mg co-doping to suppress high-temperature dielectric loss in lead-free Na0.5Bi0.5TiO3-based systems. J. Eur. Ceram. Soc. 2020, 40, 720–727. [Google Scholar] [CrossRef]
- Xiao, M.; Zhang, P.; Lou, J.; Wei, Y.; Zhang, P. Combined synthesis methods for producing LaNbO4 ceramics and investigation of microwave dielectric properties based on complex chemical bond theory. J. Alloys Compd. 2020, 812, 152154. [Google Scholar] [CrossRef]
- Yu, K.; Hu, S.; Tan, J.; Yu, W. Dielectric and piezoelectric properties of (K0.475Na0.495Li0.03) NbO3-0.003ZrO2/PVDF 0–3 composite reinforced with two types of nano-ZnO particles. J. Mater. Sci. 2020, 31, 1367–1381. [Google Scholar]
- Zhao, Q.; Zhang, H.W.; Li, J.; Xu, F.; Liao, Y.; Liu, C.; Su, H. Low-temperature sintering synthesis and electromagnetic properties of NiCuZn/BaTiO3 composite materials. J. Alloys Compd. 2019, 788, 44–49. [Google Scholar] [CrossRef]
- Chen, Y.; Ye, H.H.; Wang, X.S.; Li, Y.; Yao, X. Grain size effects on the electric and mechanical properties of submicro BaTiO3 ceramics. J. Eur. Ceram. Soc. 2020, 40, 391–400. [Google Scholar] [CrossRef]
- Hussain, A.; Sinha, N.; Joseph, A.J.; Goel, S.; Singh, B.; Bdikin, I.; Kumar, B. Mechanical investigations on piezo-/ferrolectric maleic acid-doped triglycine sulphate single crystal using nanoindentation technique. Arab. J. Chem. 2020, 13, 1874–1889. [Google Scholar] [CrossRef]
- Nasrin, S.; Khan, S.M.; Matin, M.A.; Khan, M.N.I.; Hossain, A.A.; Rahaman, M.D. Synthesis and deciphering the effects of sintering temperature on structural, elastic, dielectric, electric and magnetic properties of magnetic Ni0.25Cu0.13Zn0.62Fe2O4 ceramics. J. Mater. Sci. 2019, 30, 10722–10741. [Google Scholar] [CrossRef]
- Reznichenko, A.N.; Lugovaya, M.A.; Petrova, E.I.; Shvetsova, N.A.; Rybyanets, A.N. Lead-free porous and composite materials for ultrasonic transducers applications. Ferroelectrics 2019, 539, 93–100. [Google Scholar] [CrossRef]
- Hyun, J.-G.; Paik, K.-W.; Pak, J.S. Characterization of Epoxy/BaTiO3 Composite Embedded Capacitors for High Frequency Behaviors. In Proceedings of the 59th Electronic Components and Technology Conference, San Diego, CA, USA, 26–29 May 2009. [Google Scholar]
- Liang, S.; Chong, S.R.; Giannelis, E.P. Barium Titanate/Epoxy Composite Dielectric Materials for Integrated Thin Film Capacitors. In Proceedings of the 48th Electronic Components and Technology Conference, Seattle, WA, USA, 25–28 May 1998. [Google Scholar]
- Ramesh, S.; Huang, C.; Liang, S.; Giannelis, E.P. Integrated Thin Film Capacitors: Interfacial Control and Implications on Fabrication and Performance. In Proceedings of the 49th Electronic Components and Technology Conference, San Diego, CA, USA, 1–4 June 1999. [Google Scholar]
- Pan, M.-J.; Randall, C.A. A brief introduction to ceramic capacitors. IEEE Electr. Insul. Mag. 2010, 26, 44–50. [Google Scholar] [CrossRef]
- Arbatti, M.; Shan, X.; Cheng, Z.Y. Ceramic–polymer composites with high dielectric constant. Adv. Mater. 2007, 19, 1369–1372. [Google Scholar] [CrossRef]
- Avila, H.; Ramajo, L.; Góes, M.; Reboredo, M.M.; Castro, M.S.; Parra, R. Dielectric behavior of epoxy/BaTiO3 composites using nanostructured ceramic fibers obtained by electrospinning. ACS Appl. Mater. Interfaces 2013, 5, 505–510. [Google Scholar] [CrossRef] [PubMed]
- Bai, W.; Zheng, P.; Wen, F.; Zhang, J.; Chen, D.; Zhai, J.; Ji, Z. Lead-free BNT-based composite materials: Enhanced depolarization temperature and electromechanical behavior. Dalton Trans. 2017, 46, 15340–15353. [Google Scholar] [CrossRef] [PubMed]
- Bai, Y.; Cheng, Z.-Y.; Bharti, V.; Xu, H.S.; Zhang, Q.M. High-dielectric-constant ceramic-powder polymer composites. Appl. Phys. Lett. 2000, 76, 3804–3806. [Google Scholar] [CrossRef]
- Sundar, U.; Cook-Chennault, K.A.; Banerjee, S.; Refour, E. Dielectric and piezoelectric properties of percolative three-phase piezoelectric polymer composites. J. Vac. Sci. Technol. B 2016, 34, 041232. [Google Scholar] [CrossRef]
- Iijima, M.; Sato, N.; Lenggoro, I.W.; Kamiya, H. Surface modification of BaTiO3 particles by silane coupling agents in different solvents and their effect on dielectric properties of BaTiO3/epoxy composites. Colloids Surf. A 2009, 352, 88–93. [Google Scholar] [CrossRef]
- Jun, Y.-W.; Huh, Y.-M.; Choi, J.-S.; Lee, J.-H.; Song, H.-T.; Kim, S.; Yoon, S.; Kim, K.-S.; Shin, J.-S.; Suh, J.-S.; et al. Nanoscale size effect of magnetic nanocrystals and their utilization for cancer diagnosis via magnetic resonance imaging. J. Am. Chem. Soc. 2005, 127, 5732–5733. [Google Scholar] [CrossRef] [PubMed]
- Nan, C.-W.; Shen, Y.; Ma, J. Physical properties of composites near percolation. Annu. Rev. Mater. Res. 2010, 40, 131–151. [Google Scholar] [CrossRef]
- Huang, X.; Xie, L.; Yang, K.; Wu, C.; Jiang, P.; Li, S.; Wu, S.; Tatsumi, K.; Tanaka, T. Role of interface in highly filled epoxy/BaTiO3 nanocomposites. Part I-correlation between nanoparticle surface chemistry and nanocomposite dielectric property. IEEE Trans. Dielectr. Electr. Insul. 2014, 21, 467–479. [Google Scholar] [CrossRef]
- Katayama, A.; Yuko, W.-T.; Inomata, T.; Ozawa, T.; Masuda, H. Theoretical Study of N2 Coordination to Titanocene (III) Monochloride in Ionic Liquid. Bull. Chem. Soc. Jpn. 2019, 92, 1379–1384. [Google Scholar] [CrossRef]
- Min, Y.; Akbulut, M.; Kristiansen, K.; Golan, Y.; Israelachvili, J. The role of interparticle and external forces in nanoparticle assembly. Nat. Mater. 2008, 7, 527–538. [Google Scholar] [CrossRef] [PubMed]
- Lewis, J.A. Colloidal processing of ceramics. J. Am. Ceram. Soc. 2000, 83, 2341–2359. [Google Scholar] [CrossRef]
- Weil, E.D.; Levchik, S.V. Flame retardants in commercial use or development for polyolefins. J. Fire Sci. 2008, 26, 5–43. [Google Scholar] [CrossRef]
- Hornsby, P.R. Fire retardant fillers for polymers. Int. Mater. Rev. 2001, 46, 199–210. [Google Scholar] [CrossRef]
- Horrocks, A.R.; Price, D. Fire Retardant Materials; Woodhead Publishing: Abington, Cambridge, UK, 2001. [Google Scholar]
- Kim, S. Flame retardancy and smoke suppression of magnesium hydroxide filled polyethylene. J. Polym. Sci. Part B 2003, 41, 936–944. [Google Scholar] [CrossRef]
- Ramesh, S.; Shutzberg, B.A.; Huang, C.; Gao, J.; Giannelis, E.P. Dielectric nanocomposites for integral thin film capacitors: Materials design, fabrication and integration issues. IEEE Trans. Adv. Packag. 2003, 26, 17–24. [Google Scholar] [CrossRef]
- Li, C.-C.; Chang, S.-J.; Lee, J.-T.; Liao, W.-S. Efficient hydroxylation of BaTiO3 nanoparticles by using hydrogen peroxide. Colloids Surf. A Physicochem. Eng. Asp. 2010, 361, 143–149. [Google Scholar] [CrossRef]
- Zhou, T.; Zha, J.-W.; Cui, R.-Y.; Fan, B.-H.; Yuan, J.-K.; Dang, Z.-M. Improving dielectric properties of BaTiO3/ferroelectric polymer composites by employing surface hydroxylated BaTiO3 nanoparticles. ACS Appl. Mater. Interfaces 2011, 3, 2184–2188. [Google Scholar] [CrossRef]
- Fan, Y.; Wang, G.; Huang, X.; Bu, J.; Sun, X.; Jiang, P. Molecular structures of (3-aminopropyl) trialkoxysilane on hydroxylated barium titanate nanoparticle surfaces induced by different solvents and their effect on electrical properties of barium titanate based polymer nanocomposites. Appl. Surf. Sci. 2016, 364, 798–807. [Google Scholar] [CrossRef]
- Almadhoun, M.N.; Bhansali, U.S.; Alshareef, H.N. Nanocomposites of ferroelectric polymers with surface-hydroxylated BaTiO3 nanoparticles for energy storage applications. J. Mater. Chem. 2012, 22, 11196–11200. [Google Scholar] [CrossRef]
- Kim, P.; Doss, N.M.; Tillotson, J.P.; Hotchkiss, P.J.; Pan, M.J.; Marder, S.R.; Perry, J.W. High energy density nanocomposites based on surface-modified BaTiO3 and a ferroelectric polymer. ACS Nano 2009, 3, 2581–2592. [Google Scholar] [CrossRef] [PubMed]
- Wang, Z.; Qu, B.; Fan, W.; Hu, Y.; Shen, X. Effects of PE-g-DBM as a compatiblizer on mechanical properties and crystallization behaviors of magnesium hydroxide-based LLDPE blends. Polym. Degrad. Stab. 2002, 76, 123–128. [Google Scholar] [CrossRef]
- Wang, Z.; Chen, Z.; Fan, W.; Nie, W. Effects of surface modifiers on mechanical and rheological properties of halogen-free flame retarded polyethylene composites. Polym.-Plast. Technol. Eng. 2006, 45, 191–196. [Google Scholar] [CrossRef]
- Chen, X.; Yu, J.; Guo, S. Structure and properties of polypropylene composites filled with magnesium hydroxide. J. Appl. Polym. Sci. 2006, 102, 4943–4951. [Google Scholar] [CrossRef]
- Huang, H.; Tian, M.; Yang, J.; Li, H.; Liang, W.; Zhang, L.; Li, X. Stearic acid surface modifying Mg (OH) 2: Mechanism and its effect on properties of ethylene vinyl acetate/Mg (OH) 2 composites. J. Appl. Polym. Sci. 2008, 107, 3325–3331. [Google Scholar] [CrossRef]
- Liauw, C.M.; Dumitru, P.; Lees, G.C.; Clemens, M.L.; Rothon, R.N. Interfacial Modification of Polystyrene-block-polybutadiene-block-polystyrene/Magnesium Hydroxide Composites, 1. Macromol. Mater. Eng. 2003, 288, 412–420. [Google Scholar] [CrossRef]
- Schofield, W.; Hurst, S.; Lees, G.; Liauw, C.M.; Rothon, R.N. Influence of surface modification of magnesium hydroxide on the processing and mechanical properties of composites of magnesium hydroxide and an ethylene vinyl acetate copolymer. Compos. Interfaces 1997, 5, 515–528. [Google Scholar] [CrossRef]
- Zhou, W.; Yu, D. Effect of coupling agents on the dielectric properties of aluminum particles reinforced epoxy resin composites. J. Compos. Mater. 2011, 45, 1981–1989. [Google Scholar] [CrossRef]
- Sasikala, T.; Raman, S.; Mohanan, P.; Pavithran, C.; Sebastian, M.T. Effect of silane coupling agent on the dielectric and thermal properties of DGEBA-forsterite composites. J. Polym. Res. 2011, 18, 811–819. [Google Scholar] [CrossRef]
- Badheka, P.; Magadala, V.; Devaraju, N.G.; Lee, B.I.; Kim, E.S. Effect of dehydroxylation of hydrothermal barium titanate on dielectric properties in polystyrene composite. J. Appl. Polym. Sci. 2006, 99, 2815–2821. [Google Scholar] [CrossRef]
- Huang, X.; Xie, L.; Jiang, P.; Wang, G.; Liu, F. Electrical, thermophysical and micromechanical properties of ethylene-vinyl acetate elastomer composites with surface modified BaTiO3 nanoparticles. J. Phys. D Appl. Phys. 2009, 42, 245407. [Google Scholar] [CrossRef]
- Huang, X.; Ma, Z.; Wang, Y.; Jiang, P.; Yin, Y.; Li, Z. Polyethylene/aluminum nanocomposites: Improvement of dielectric strength by nanoparticle surface modification. J. Appl. Polym. Sci. 2009, 113, 3577–3584. [Google Scholar] [CrossRef]
- Anderson, R.A.; Lagasse, R.R.; Russick, E.M.; Schroeder, J.L. Effects of void size and gas content on electrical breakdown in lightweight, mechanically compliant, void-filled dielectrics. J. Appl. Phys. 2002, 91, 3205–3212. [Google Scholar] [CrossRef]
- Zeng, X.; Yu, S.; Sun, R.; Du, R. Microstructure, thermal and dielectric properties of homogeneous bismaleimide-triazine/barium titanate nanocomposite films. Mater. Chem. Phys. 2011, 131, 387–392. [Google Scholar] [CrossRef]
- Dalle Vacche, S.; Oliveira, F.; Leterrier, Y.; Michaud, V.; Damjanovic, D.; Månson, J.A.E. Effect of silane coupling agent on the morphology, structure, and properties of poly (vinylidene fluoride–trifluoroethylene)/BaTiO3 composites. J. Mater. Sci. 2014, 49, 4552–4564. [Google Scholar] [CrossRef]
- Quan, B.; Shi, W.H.; Ong, S.J.H.; Lu, X.; Wang, P.L.; Ji, G.; Xu, Z.J. Defect Engineering in Two Common Types of Dielectric Materials for Electromagnetic Absorption Applications. Adv. Funct. Mater. 2019, 29, 1901236. [Google Scholar] [CrossRef]
- Sciences, E.M. Epofix Cold-Setting Embedding Resin. EMS Catalog #1232. Available online: https://www.emsdiasum.com/microscopy/technical/datasheet/1232.aspx (accessed on 21 March 2020).
- Aldrich, S. Barium Titanate (IV) Nanopowder Specifications. Available online: https://www.sigmaaldrich.com/catalog/product/aldrich/256552?lang=en®ion=US&gclid=Cj0KCQjw9tbzBRDVARIsAMBplx8633AyJoQwC8I68XXKjIQr-cc4DEji-rQ5g-B-n2iViXsvgfjqeoYaAvcnEALw_wcB (accessed on 21 March 2020).
- Sundar, U.; Lao, Z.C.; Cook-Chennault, K. Investigation of Piezoelectricity and Resistivity of Surface Modified Barium Titanate Nanocomposites. Polymers 2019, 11, 2123. [Google Scholar] [CrossRef]
- Plueddemann, E.P. Silane coupling agents. Addit. Plast. 1978, 1, 123–167. [Google Scholar]
- Dang, Z.-M.; Yuan, J.-K.; Zha, J.-W.; Zhou, T.; Li, S.-T.; Hu, G.-H. Fundamentals, processes and applications of high-permittivity polymer–matrix composites. Prog. Mater. Sci. 2012, 57, 660–723. [Google Scholar] [CrossRef]
- Garnett, J.C.M. Colours in metal glasses and in metallic films. Proc. R. Soc. Lond. 1904, 73, 443–445. [Google Scholar] [CrossRef]
- Garnett, J.C.M. Colours in metal glasses, in metallic films and in metallic solutions–II. In Proceedings of the Royal Society of London Series A-Containing Papers of a Mathematical and Physical Character; Royal Society: London, UK, 1905; Volume 76, pp. 370–373. [Google Scholar]
- Koledintseva, M.Y.; Chandra, S.K.R.; DuBroff, R.E.; Schwartz, R.W. Modeling of dielectric mixtures containing conducting inclusions with statistically distributed aspect ratio. Prog. Electromagn. Res.-Pier 2006, 66, 213–228. [Google Scholar] [CrossRef]
- Karkkainen, K.; Sihvola, A.; Nikoskinen, K. Effective permittivity of a random mixture with spherical inclusions. In Proceedings of the Igarss 2000: IEEE 2000 International Geoscience and Remote Sensing Symposium, Honolulu, HI, USA, 24–28 July 2000; Stein, T.I., Ed.; IEEE: Honolulu, HI, USA, 2000; Volume 1–6. [Google Scholar]
- Karkkainen, K.K.; Sihvola, A.H.; Nikoskinen, K.I. Effective permittivity of mixtures: Numerical validation by the FDTD method. IEEE Trans. Geosci. Remote Sens. 2000, 38, 1303–1308. [Google Scholar] [CrossRef]
- Sharma, R.; Sihvola, A. Studies on polarizabilities and scattering behavior of small spherical particles. Radio Sci. 2000, 35, 83–96. [Google Scholar] [CrossRef][Green Version]
- Gowdhaman, P.; Annamalai, V.; Thakur, O.P. Piezo, ferro and dielectric properties of ceramic-polymer composites of 0-3 connectivity. Ferroelectrics 2016, 493, 120–129. [Google Scholar] [CrossRef]
- Wilson, P.M.; Lipatov, A.; Schmidt, D.; Schubert, E.; Schubert, M.; Sinitskii, A.; Hofmann, T. Structural and optical properties of cobalt slanted nanopillars conformally coated with few-layer graphene. Appl. Phys. Lett. 2015, 106, 231901. [Google Scholar] [CrossRef]
- Nelson, S.; Kraszewski, A.; You, T. Solid and particulate material permittivity relationships. J. Microw. Power Electromagn. Energy 1991, 26, 45–51. [Google Scholar] [CrossRef]
- Kiley, E.M.; Yakovlev, V.V.; Ishizaki, K.; Vaucher, S. Applicability Study of Classical and Contemporary Models for Effective Complex Permittivity of Metal Powders. J. Microw. Power Electromagn. Energy 2012, 46, 26–38. [Google Scholar] [CrossRef]
- Simpkin, R. Derivation of Lichtenecker’s Logarithmic Mixture Formula from Maxwell’s Equations. IEEE Trans. Microw. Theory Tech. 2010, 58, 545–550. [Google Scholar] [CrossRef]
- Zakri, T.; Laurent, J.P.; Vauclin, M. Theoretical evidence for ‘Lichtenecker’s mixture formulae’ based on the effective medium theory. J. Phys. D-Appl. Phys. 1998, 31, 1589–1594. [Google Scholar] [CrossRef]
- Jayasundere, N.; Smith, B.V. Dielectric-constant for binary piezoelectric 0-3 composites. J. Appl. Phys. 1993, 73, 2462–2466. [Google Scholar] [CrossRef]
- Fan, L.; Rao, Y.; Tison, C.; Moon, K.S.; Pothukuchi, S.V.; Wong, C.P. Use of dispersant in high K polymer-ceramic nano-composite to improve manufacturability and performance of integral capacitors. In Proceedings of the 52nd Electronic Components and Technology Conference, San Diego, CA, USA, 28–31 May 2002; pp. 936–940. [Google Scholar]
- Rao, Y.; Takahashi, A.; Wong, C. Di-block copolymer surfactant study to optimize filler dispersion in high dielectric constant polymer-ceramic composite. Compos. Part A Appl. Sci. Manuf. 2003, 34, 1113–1116. [Google Scholar] [CrossRef]
- Cho, S.-D.; Lee, J.-Y.; Hyun, J.-G.; Paik, K.W. Study on epoxy/BaTiO3 composite embedded capacitor films (ECFs) for organic substrate applications. Mater. Sci. Eng. B 2004, 110, 233–239. [Google Scholar] [CrossRef]
- Dang, Z.-M.; Wang, H.-Y.; Xu, H.-P. Influence of silane coupling agent on morphology and dielectric property in BaTiO3/polyvinylidene fluoride composites. Appl. Phys. Lett. 2006, 89, 2902. [Google Scholar] [CrossRef]
- Ramajo, L.; Reboredo, M.; Castro, M. Dielectric response and relaxation phenomena in composites of epoxy resin with BaTiO3 particles. Compos. Part A Appl. Sci. Manuf. 2005, 36, 1267–1274. [Google Scholar] [CrossRef]
- Van Krevelen, D.; Hoftyzer, P. Their estimation and correlation with chemical structure. In Properties of Polymers; Elsevier: New York, NY, USA, 1976. [Google Scholar]
- Huang, X.; Xie, L.; Yang, K.; Wu, C.; Jiang, P.; Li, S.; Tanaka, T. Role of interface in highly filled epoxy/BaTiO3 nanocomposites. Part II-effect of nanoparticle surface chemistry on processing, thermal expansion, energy storage and breakdown strength of the nanocomposites. IEEE Trans. Dielectr. Electr. Insul. 2014, 21, 480–487. [Google Scholar] [CrossRef]
- Brosseau, C.; Achour, M. Variable-temperature measurements of the dielectric relaxation in carbon black loaded epoxy composites. J. Appl. Phys. 2009, 105, 124102. [Google Scholar] [CrossRef]
- Fattoum, A.; Arous, M.; Gmati, F.; Dhaoui, W.; Mohamed, A.B. Influence of dopant on dielectric properties of polyaniline weakly doped with dichloro and trichloroacetic acids. J. Phys. D-Appl. Phys. 2007, 40, 4347–4354. [Google Scholar] [CrossRef]
- Siddabattuni, S.; Schuman, T.P.; Dogan, F. Improved polymer nanocomposite dielectric breakdown performance through barium titanate to epoxy interface control. Mater. Sci. Eng. B 2011, 176, 1422–1429. [Google Scholar] [CrossRef]
- Lewis, T. Interfaces: Nanometric dielectrics. J. Phys. D Appl. Phys. 2005, 38, 202. [Google Scholar] [CrossRef]
- Ramajo, L.; Reboredo, M.M.; Castro, M.S. BaTiO3–epoxy composites for electronic applications. Int. J. Appl. Ceram. Technol. 2010, 7, 444–451. [Google Scholar]
- Ogitani, S.; Bidstrup-Allen, S.A.; Kohl, P.A. Factors influencing the permittivity of polymer/ceramic composites for embedded capacitors. IEEE Trans. Adv. Packag. 2000, 23, 313–322. [Google Scholar] [CrossRef]
- Rao, Y.; Ogitani, S.; Kohl, P.; Wong, C.P. Novel polymer–ceramic nanocomposite based on high dielectric constant epoxy formula for embedded capacitor application. J. Appl. Polym. Sci. 2002, 83, 1084–1090. [Google Scholar] [CrossRef]
- Karimi, A.A.; Ahmad, Z. Effect of interface on the thermal mechanical properties of chemically bonded epoxy-silica hybrids. Prog. Org. Coat. 2017, 106, 137–144. [Google Scholar] [CrossRef]
- Macan, J.; Ivankovic, H.; Ivankovic, M.; Mencer, H.J. Study of cure kinetics of epoxy-silica organic-inorganic hybrid materials. Thermochim. Acta 2004, 414, 219–225. [Google Scholar] [CrossRef]


| Barium Titanate Nano-Powder | |
|---|---|
| Property | |
| Density (g/cm3) | 6.08 |
| Mean Diameter * | ~100 nm |
| Curie Point (°C) | 130 °C |
| Dielectric constant | 150 [54] |
| d33 (pC/N) | ~85.6 (crystal)/~191 (ceramic) |
| Property | |
|---|---|
| Dielectric Constant | 2.9–3.0 * |
| Dielectric dissipation | ~0.02–0.04 |
| Electromechanical coupling factor, k33 | - |
| Piezoelectric strain coefficient, d33 | - |
| Density | 1.16 g/cm3 |
| Electrical Resistivity | 0.15 @ 1 kHz |
| Symbol | Legend | Relative Permittivity | Standard Deviation |
|---|---|---|---|
 | Maxwell-Garnett Equation | 35.65 | - |
 | Bruggeman Self-Consistent Effective Medium Approximation | 43.80 | - |
 | Jaysundere-Smith Equation | 55.02 | - |
 | Lichtenker’s Formula | 81 | - |
 | Untreated BaTiO3 | 22.31 | 5.2 |
 | Ethanol Surface Treated | 23.36 | 5.64 |
 | Silane Coupling Agent—0.010 | 18.62 | 5.37 |
 | Silane Coupling Agent—0.015 | 41.76 | 5.11 |
 | Silane Coupling Agent—0.020 | 48.03 | 5.63 |
 | Silane Coupling Agent—0.025 | 26.20 | 4.78 |
| Type of Composite | Surface Modification | Dielectric Permittivity |
|---|---|---|
| BaTiO3—epoxy composite: thin film capacitors [82] | N-phenyl aminopropyltrimethoxysilane | 40 @ 1 kHz |
| BaTiO3—epoxy composite [83,84] | 3-aminoprpoyltriethoxysilane (KH-550) | vol. fraction < 70%. ~35 @ 105 Hz |
| BaTiO3/epoxy composites [85,86] | 3-glycidoxypropyltrimethoxysilane | ~28 @105 Hz |
| BaTiO3 /(EVM) copolymer elastomer [35,85] | γ-aminopropyl triethoxysilane (Silquest A-1100) | Increasing permittivity with BaTiO3 loading. ~25 @ 70 wt.% of BaTiO3 |
| BTresin/BaTiO3 [85,86] | 3-glycidoxypropyl trimethoxysilane (KH-560) | Permittivity increased with loading. ~5 at 0%–~25 at 70% |
| BaTiO3/epoxy: Integral thin film capacitors [35,85] | N-phenyl aminopropyltrimethoxysilane, glycidoxy, mercapto, cyclohexyl | ~40 @ 105 Hz |
| BaTiO3-epoxy composites [56] | Glycidoxymethoxysilane Z-6040 | Increases with particles that were surface modified ~40 at 100 Hz |
| DGEBA-forsterite composites [85] | Aminopropyltriethoxy silane (APTS) | Dielectric permittivity increased from 3.7 to 3.9 after surface treating. |
| BaTiO3-P(VDF-TrFE) [57] | 3-aminopropyltriethoxysilane (APTS) | Dielectric permittivity improved—(i) 100 to 113, (ii) 80−100 and (ii) 75−85 |
| BaTiO3-DEGBA epoxy (this work) | γ–glycidyloxypropyltrimethoxysilane (KH-560) | 76 @ 10 kHz (0.20 SCA) 97 @ 100 Hz (0.150 SCA) 88 @ 1 kHz (0.20 SCA) |
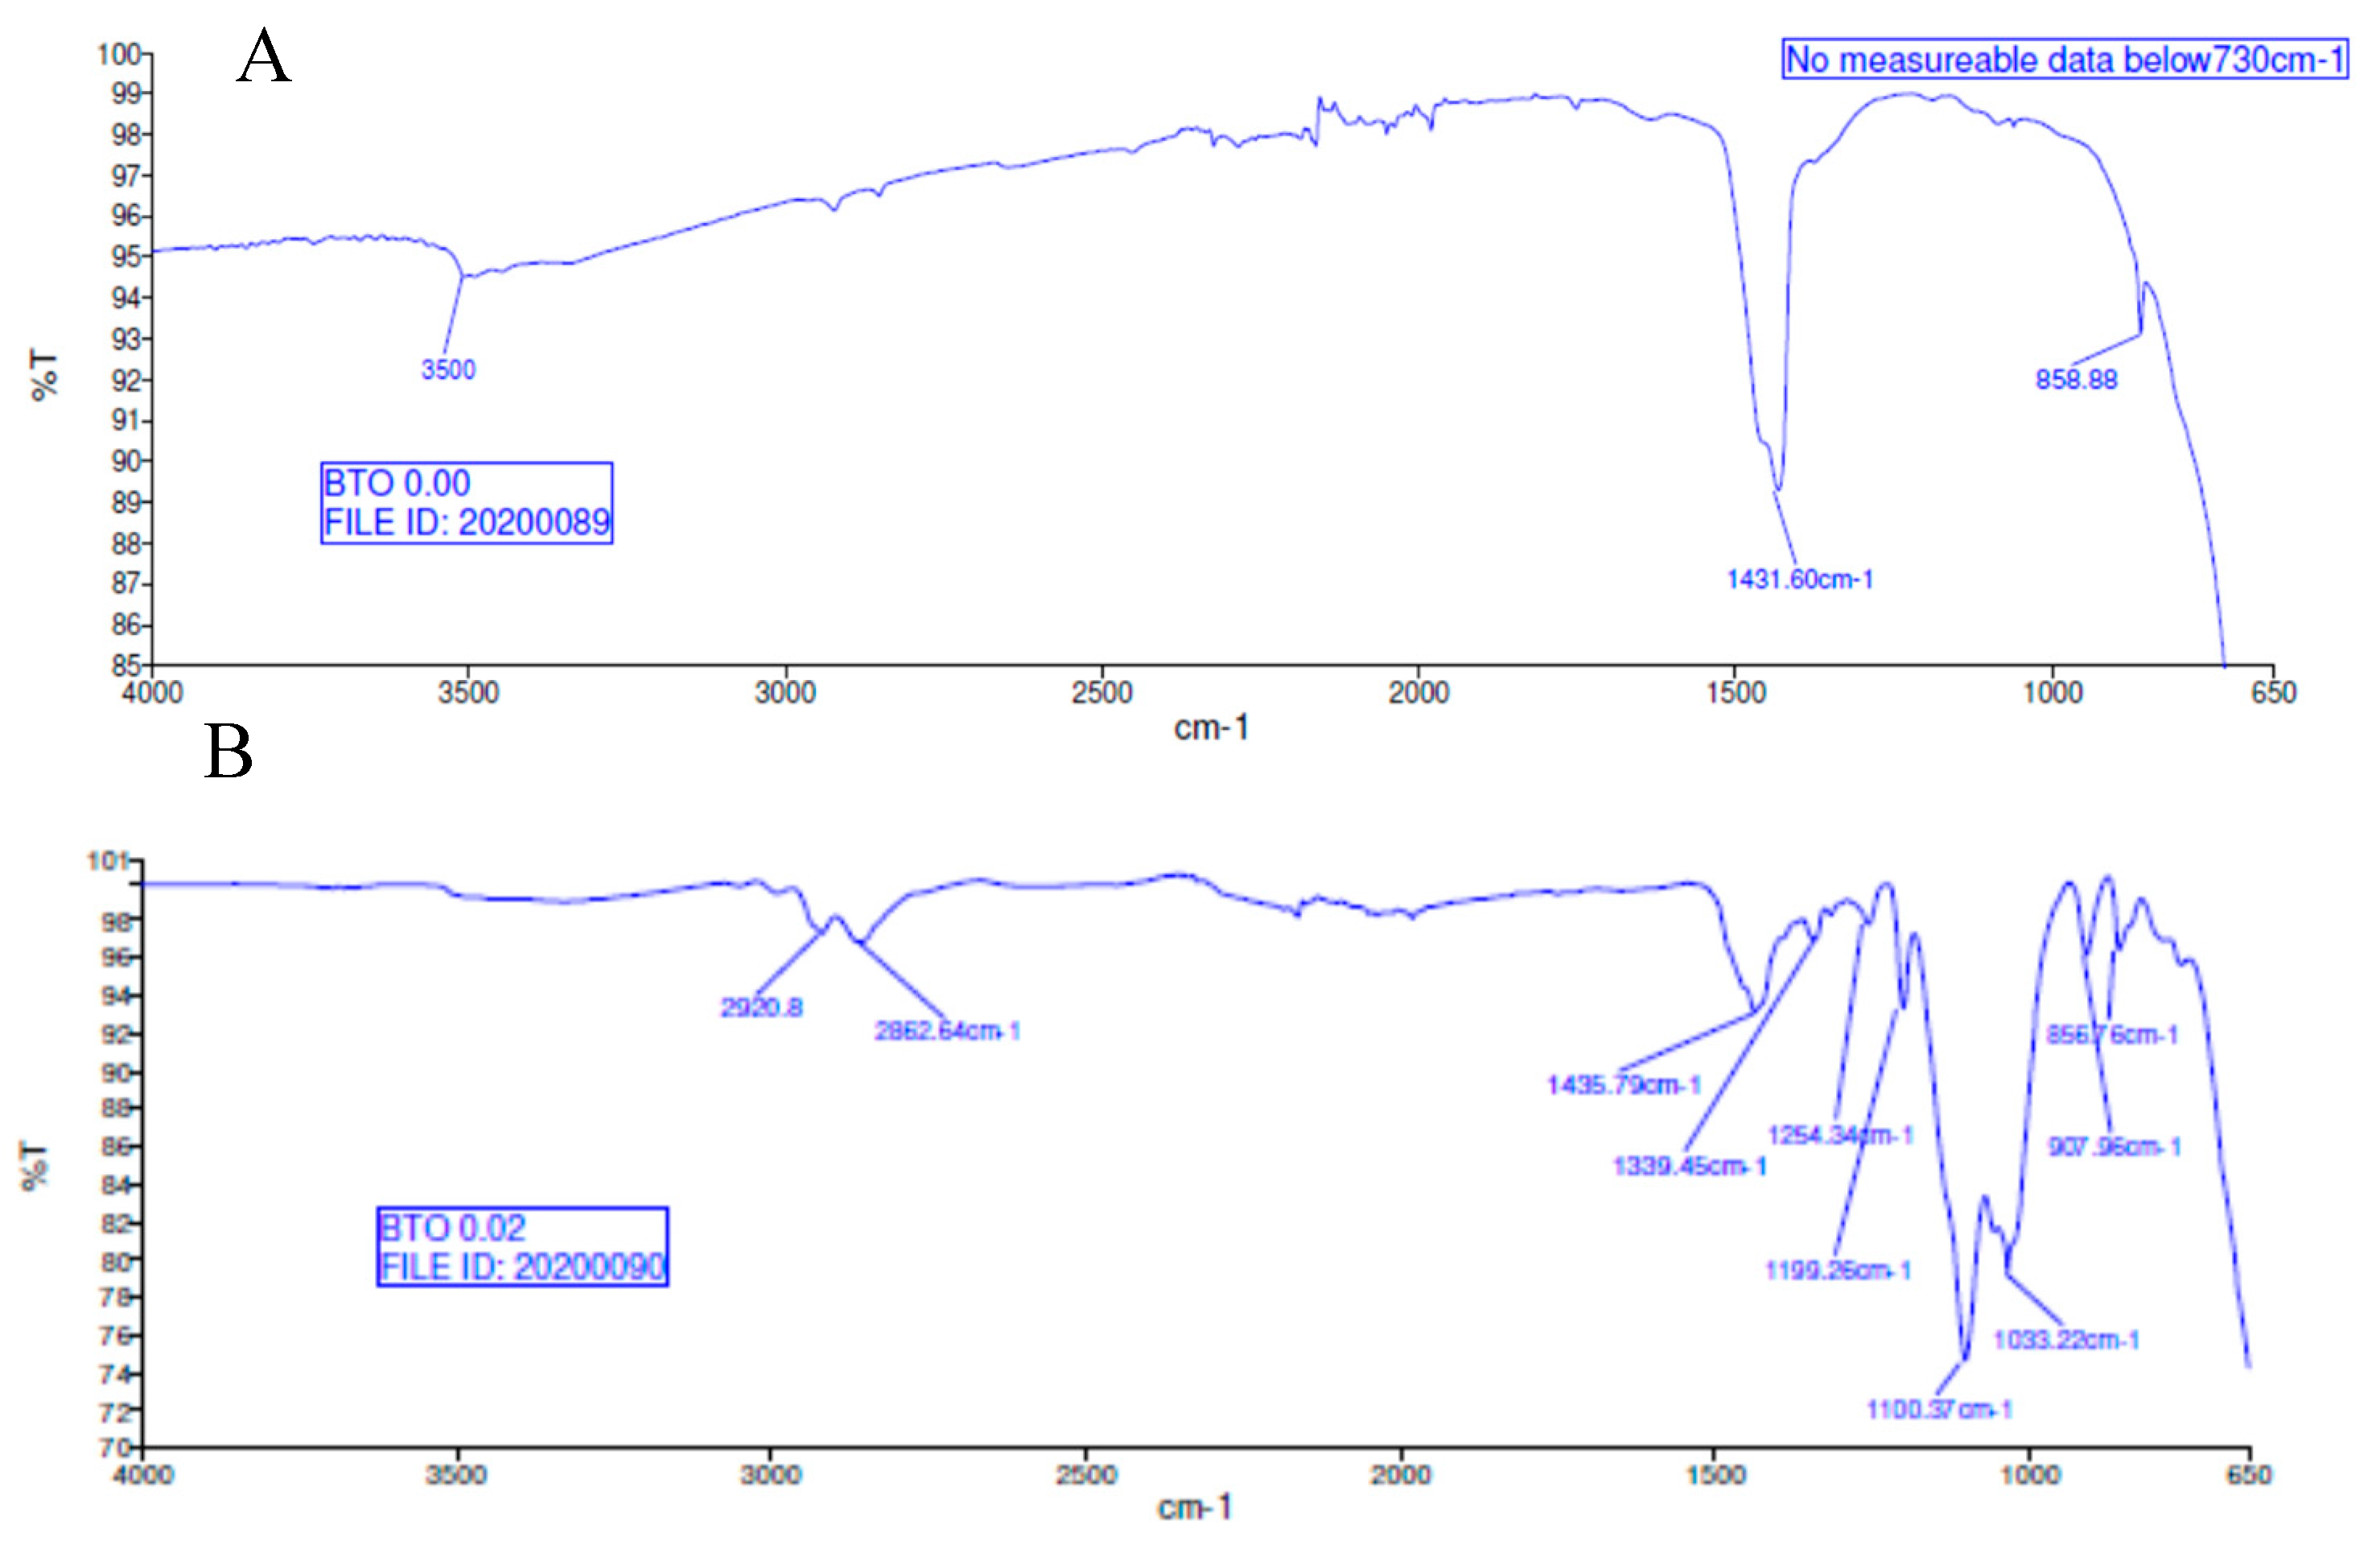
| Wavelength (cm−1) | Bond Type |
|---|---|
| 700–800 | C–H (Si–CH2–CH2–Si) stretching vibrations |
| 850–900 | Si–O (Si–OH) stretching vibrations |
| 900–960 | Si–O–C2H5 vibrations |
| 1000–1250 | Si–O (from Si–O–Si bonds) vibrations |
| 1300–1400 | CH2 and CH3 bending vibrations |
| 3200–3700 | OH (from Si–OH group) stretching vibrations |
© 2020 by the authors. Licensee MDPI, Basel, Switzerland. This article is an open access article distributed under the terms and conditions of the Creative Commons Attribution (CC BY) license (http://creativecommons.org/licenses/by/4.0/).
Share and Cite
Sundar, U.; Lao, Z.; Cook-Chennault, K. Enhanced Dielectric Permittivity of Optimized Surface Modified of Barium Titanate Nanocomposites. Polymers 2020, 12, 827. https://doi.org/10.3390/polym12040827
Sundar U, Lao Z, Cook-Chennault K. Enhanced Dielectric Permittivity of Optimized Surface Modified of Barium Titanate Nanocomposites. Polymers. 2020; 12(4):827. https://doi.org/10.3390/polym12040827
Chicago/Turabian StyleSundar, Udhay, Zichen Lao, and Kimberly Cook-Chennault. 2020. "Enhanced Dielectric Permittivity of Optimized Surface Modified of Barium Titanate Nanocomposites" Polymers 12, no. 4: 827. https://doi.org/10.3390/polym12040827
APA StyleSundar, U., Lao, Z., & Cook-Chennault, K. (2020). Enhanced Dielectric Permittivity of Optimized Surface Modified of Barium Titanate Nanocomposites. Polymers, 12(4), 827. https://doi.org/10.3390/polym12040827