Quantitative Structural Analysis of Polystyrene Nanoparticles Using Synchrotron X-ray Scattering and Dynamic Light Scattering

 ,
,
Abstract
1. Introduction
2. Materials and Methods
3. Results and Discussion
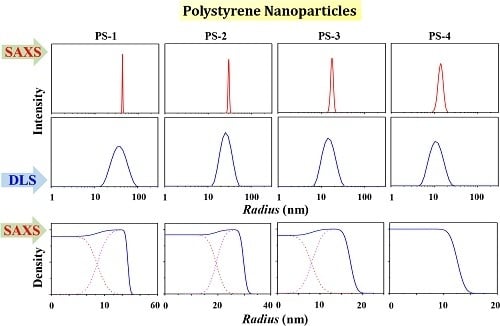
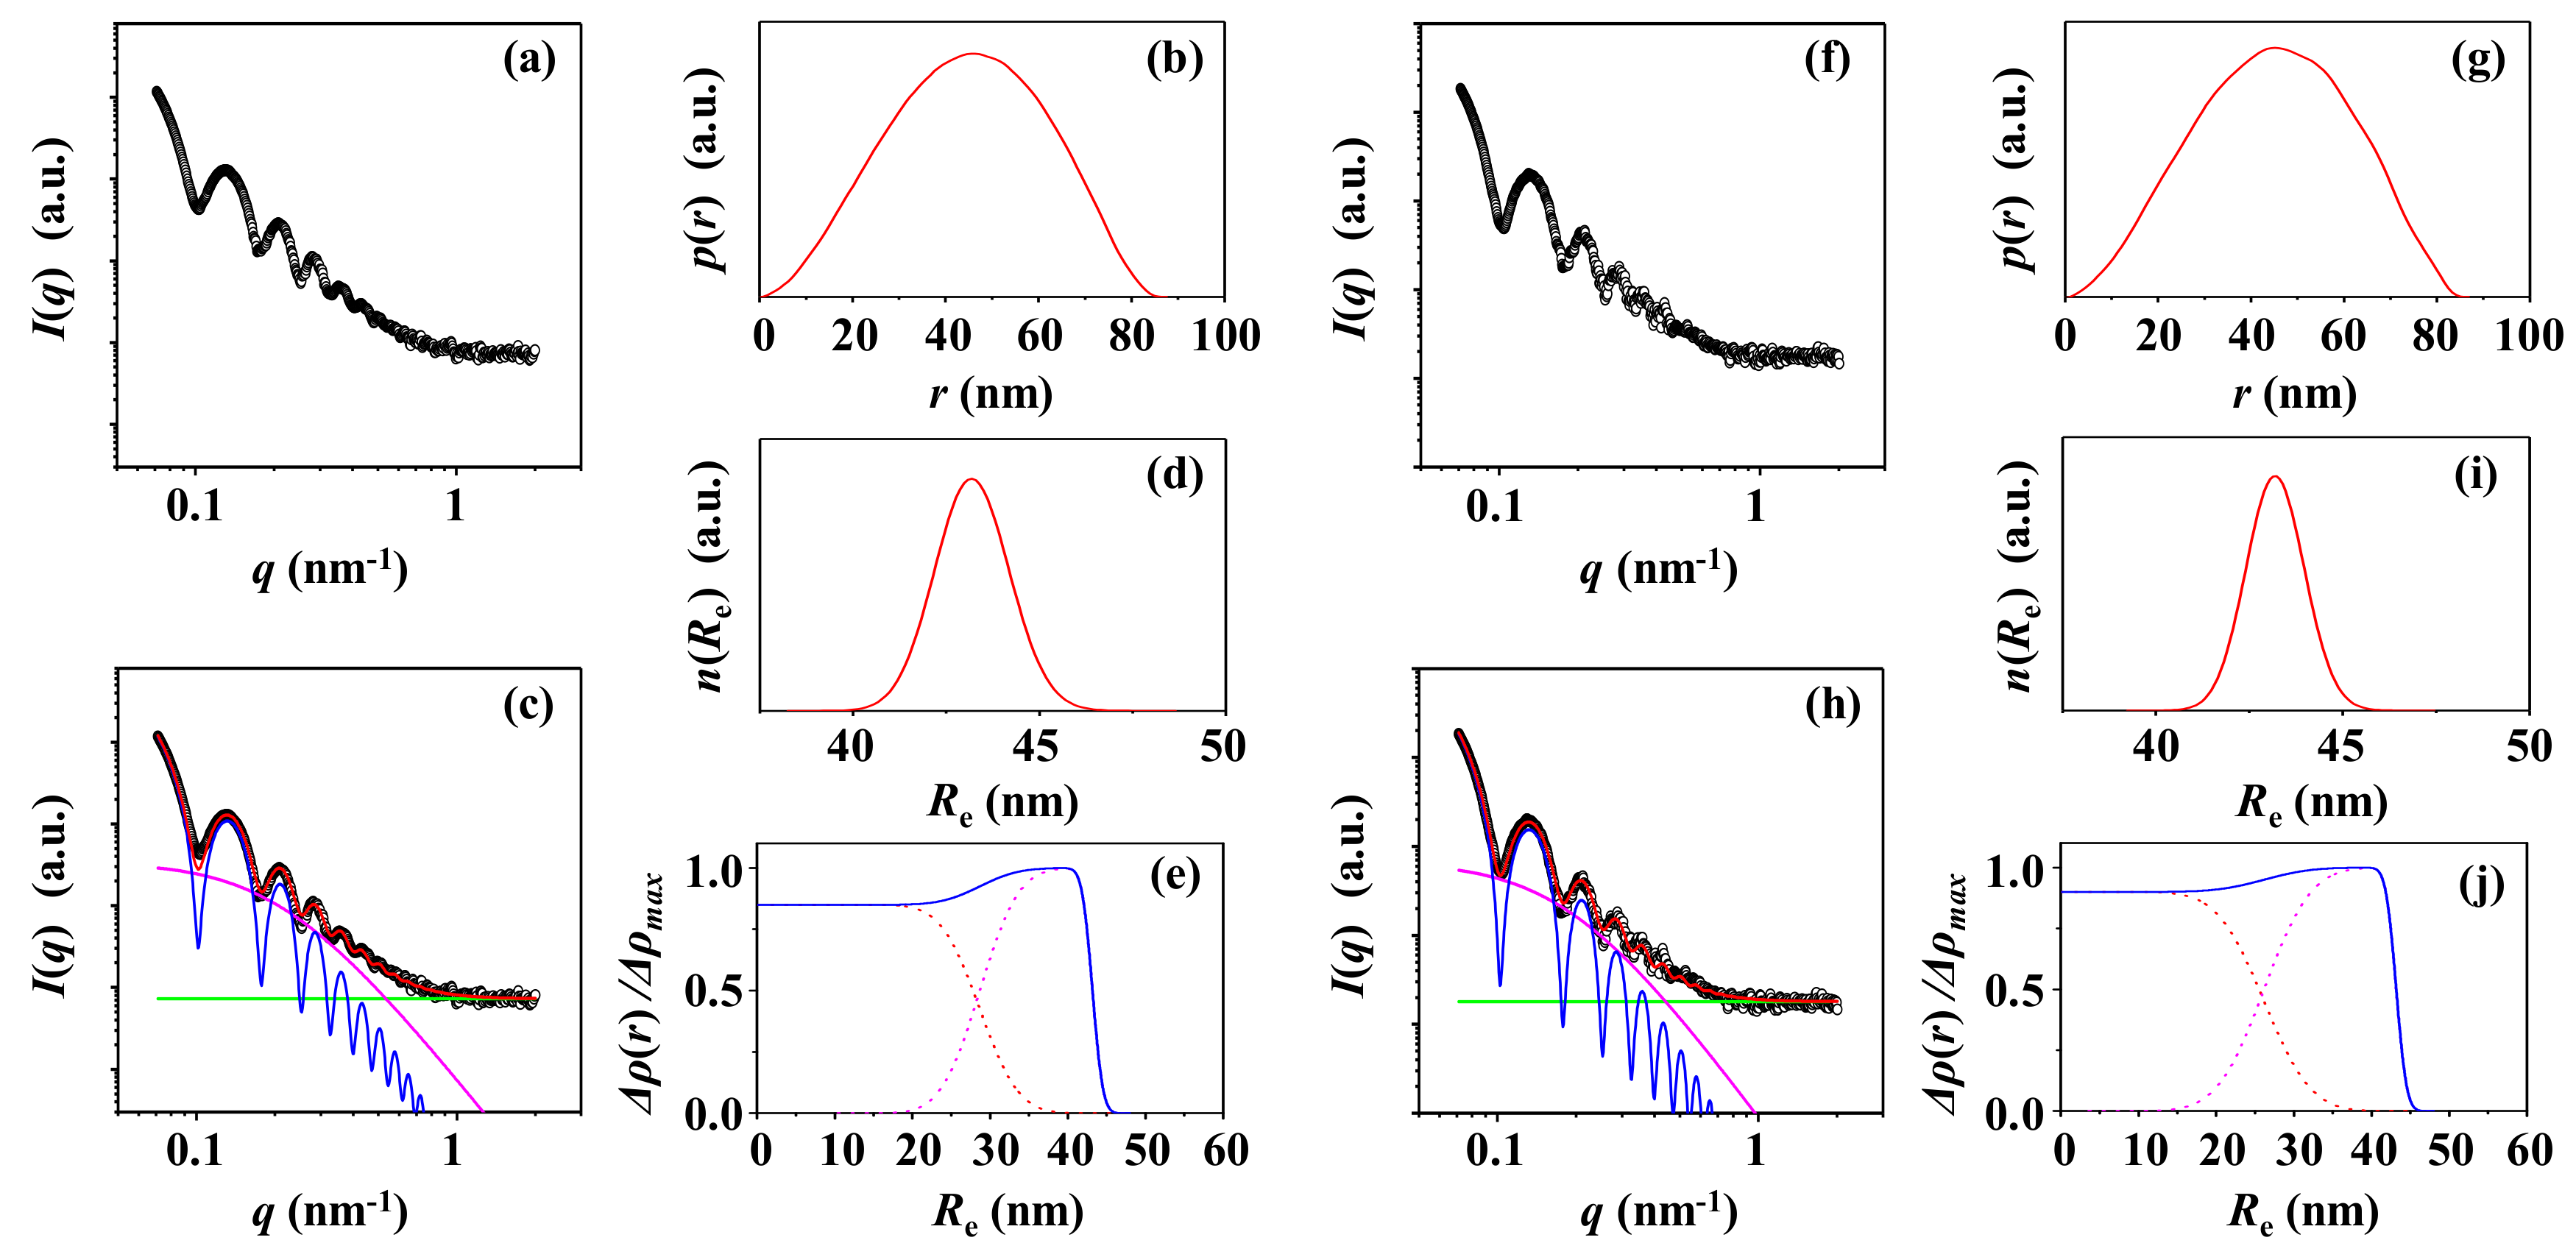
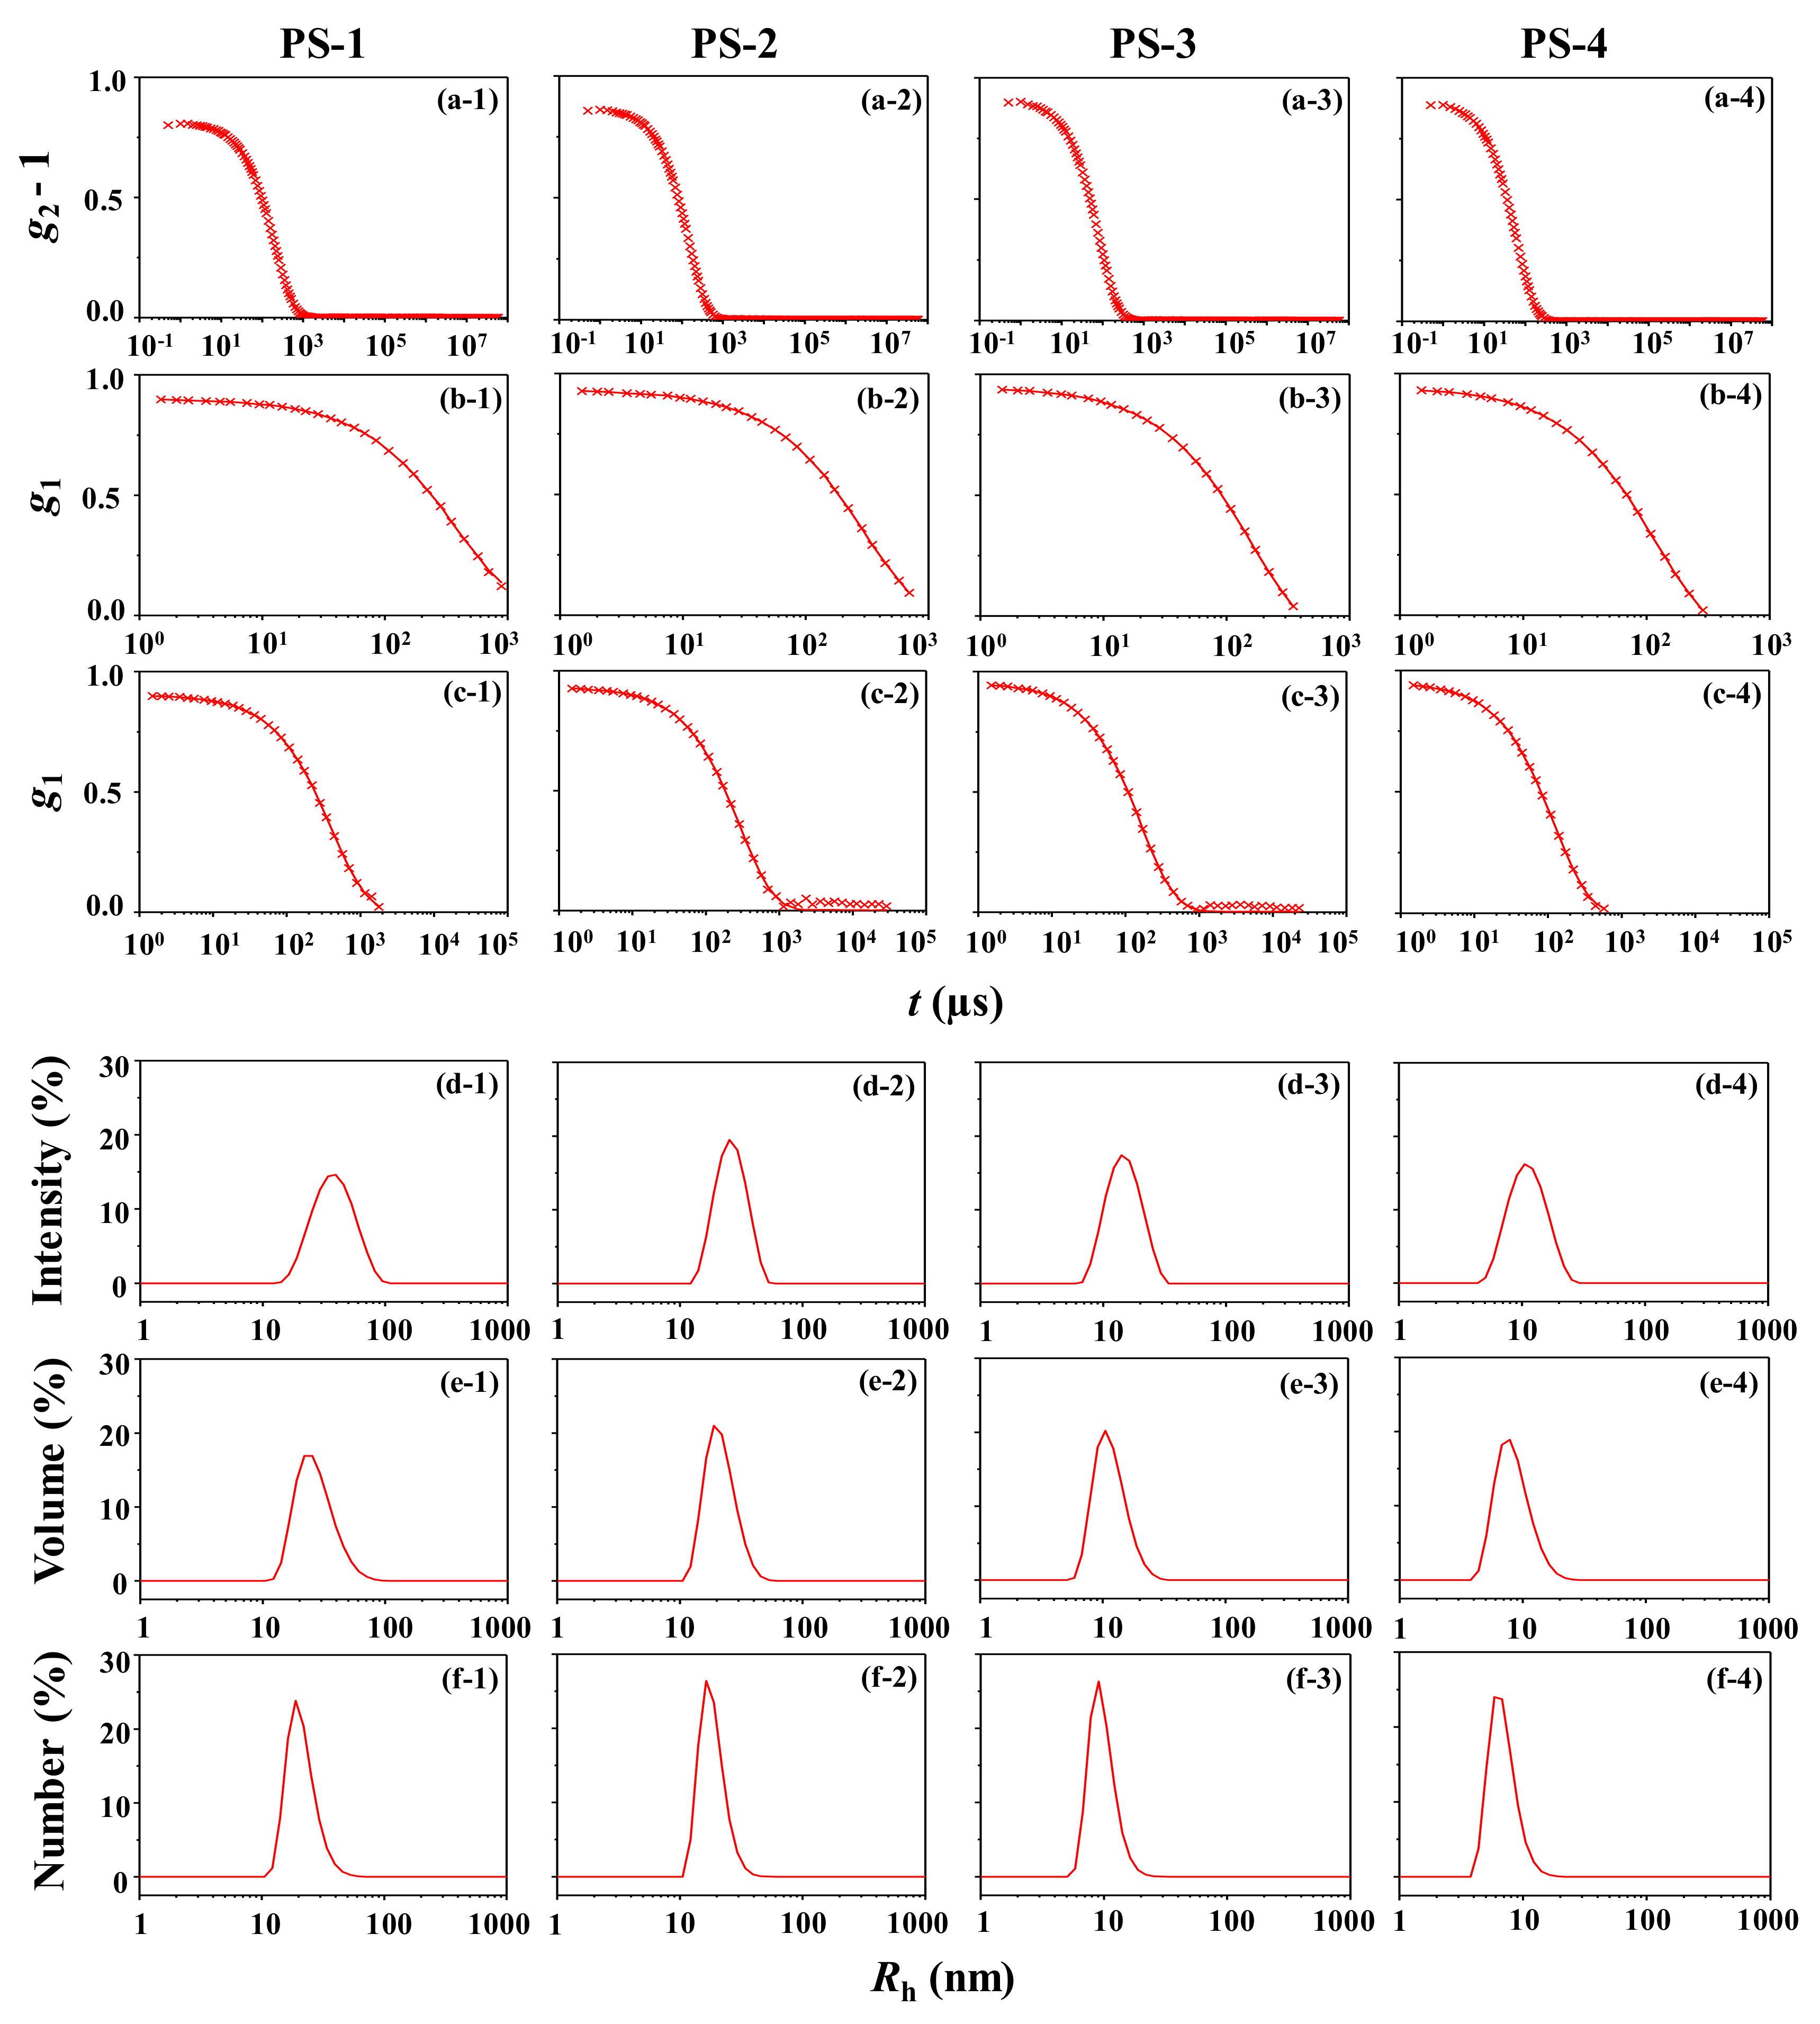
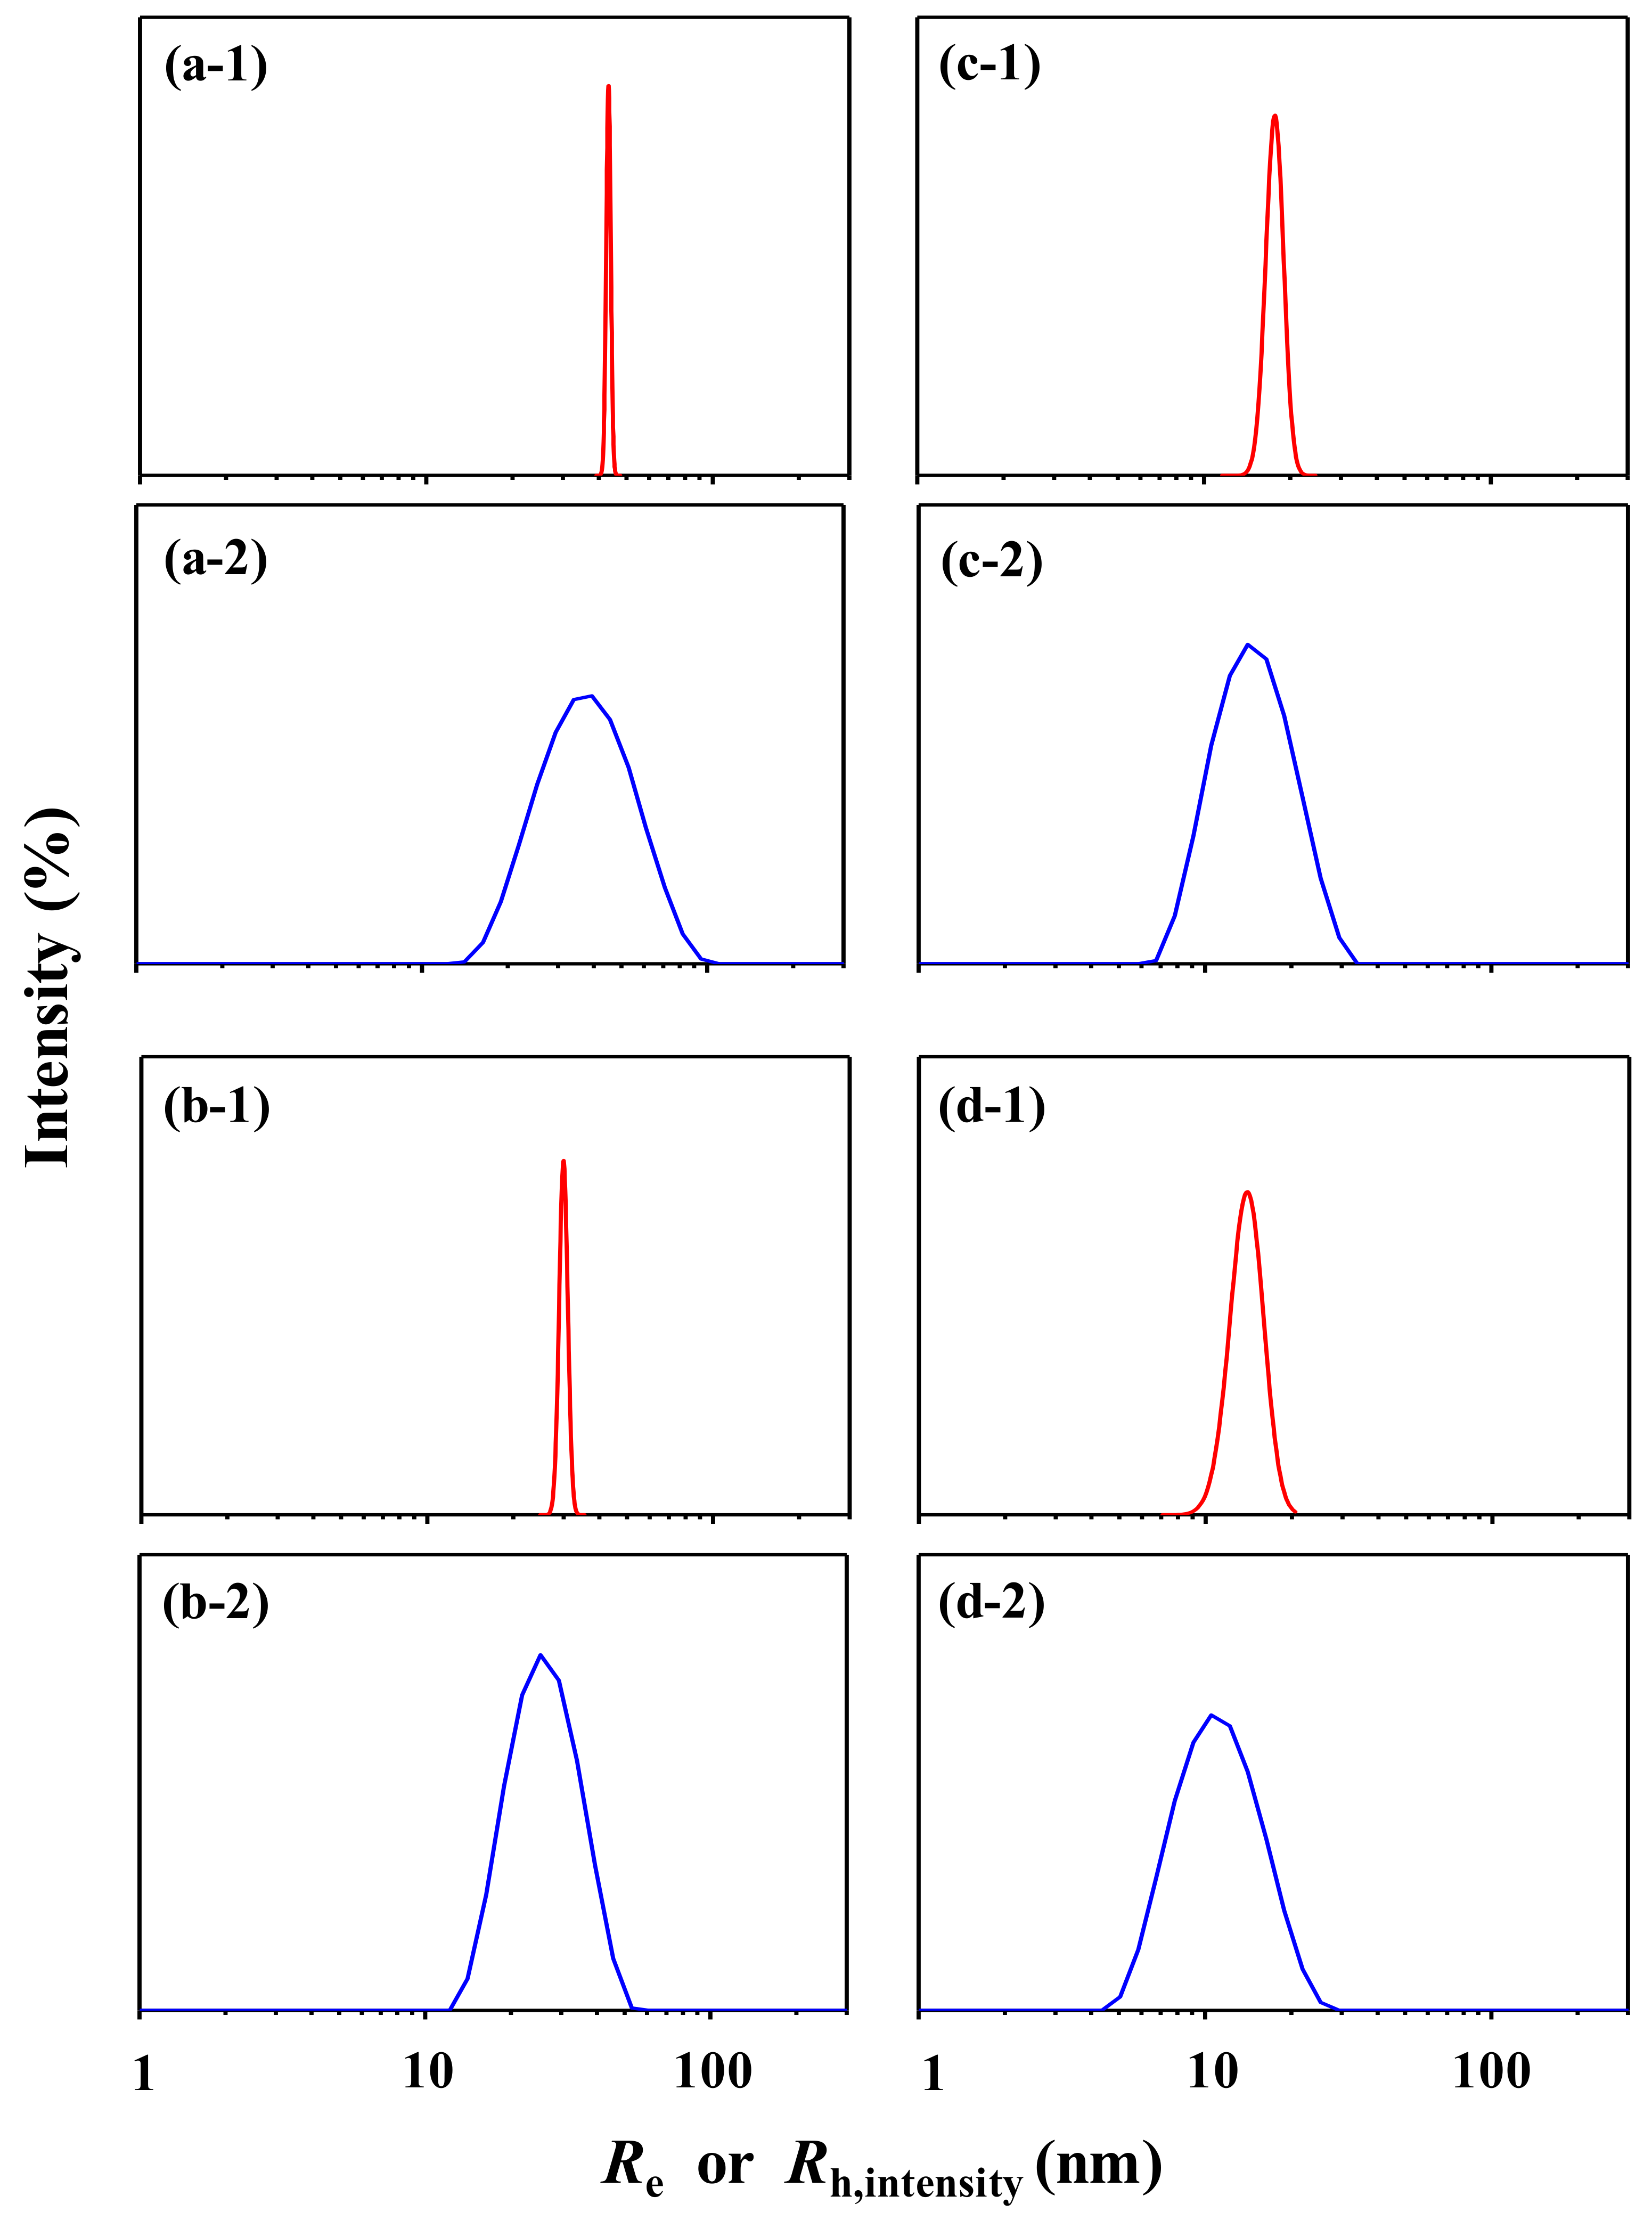
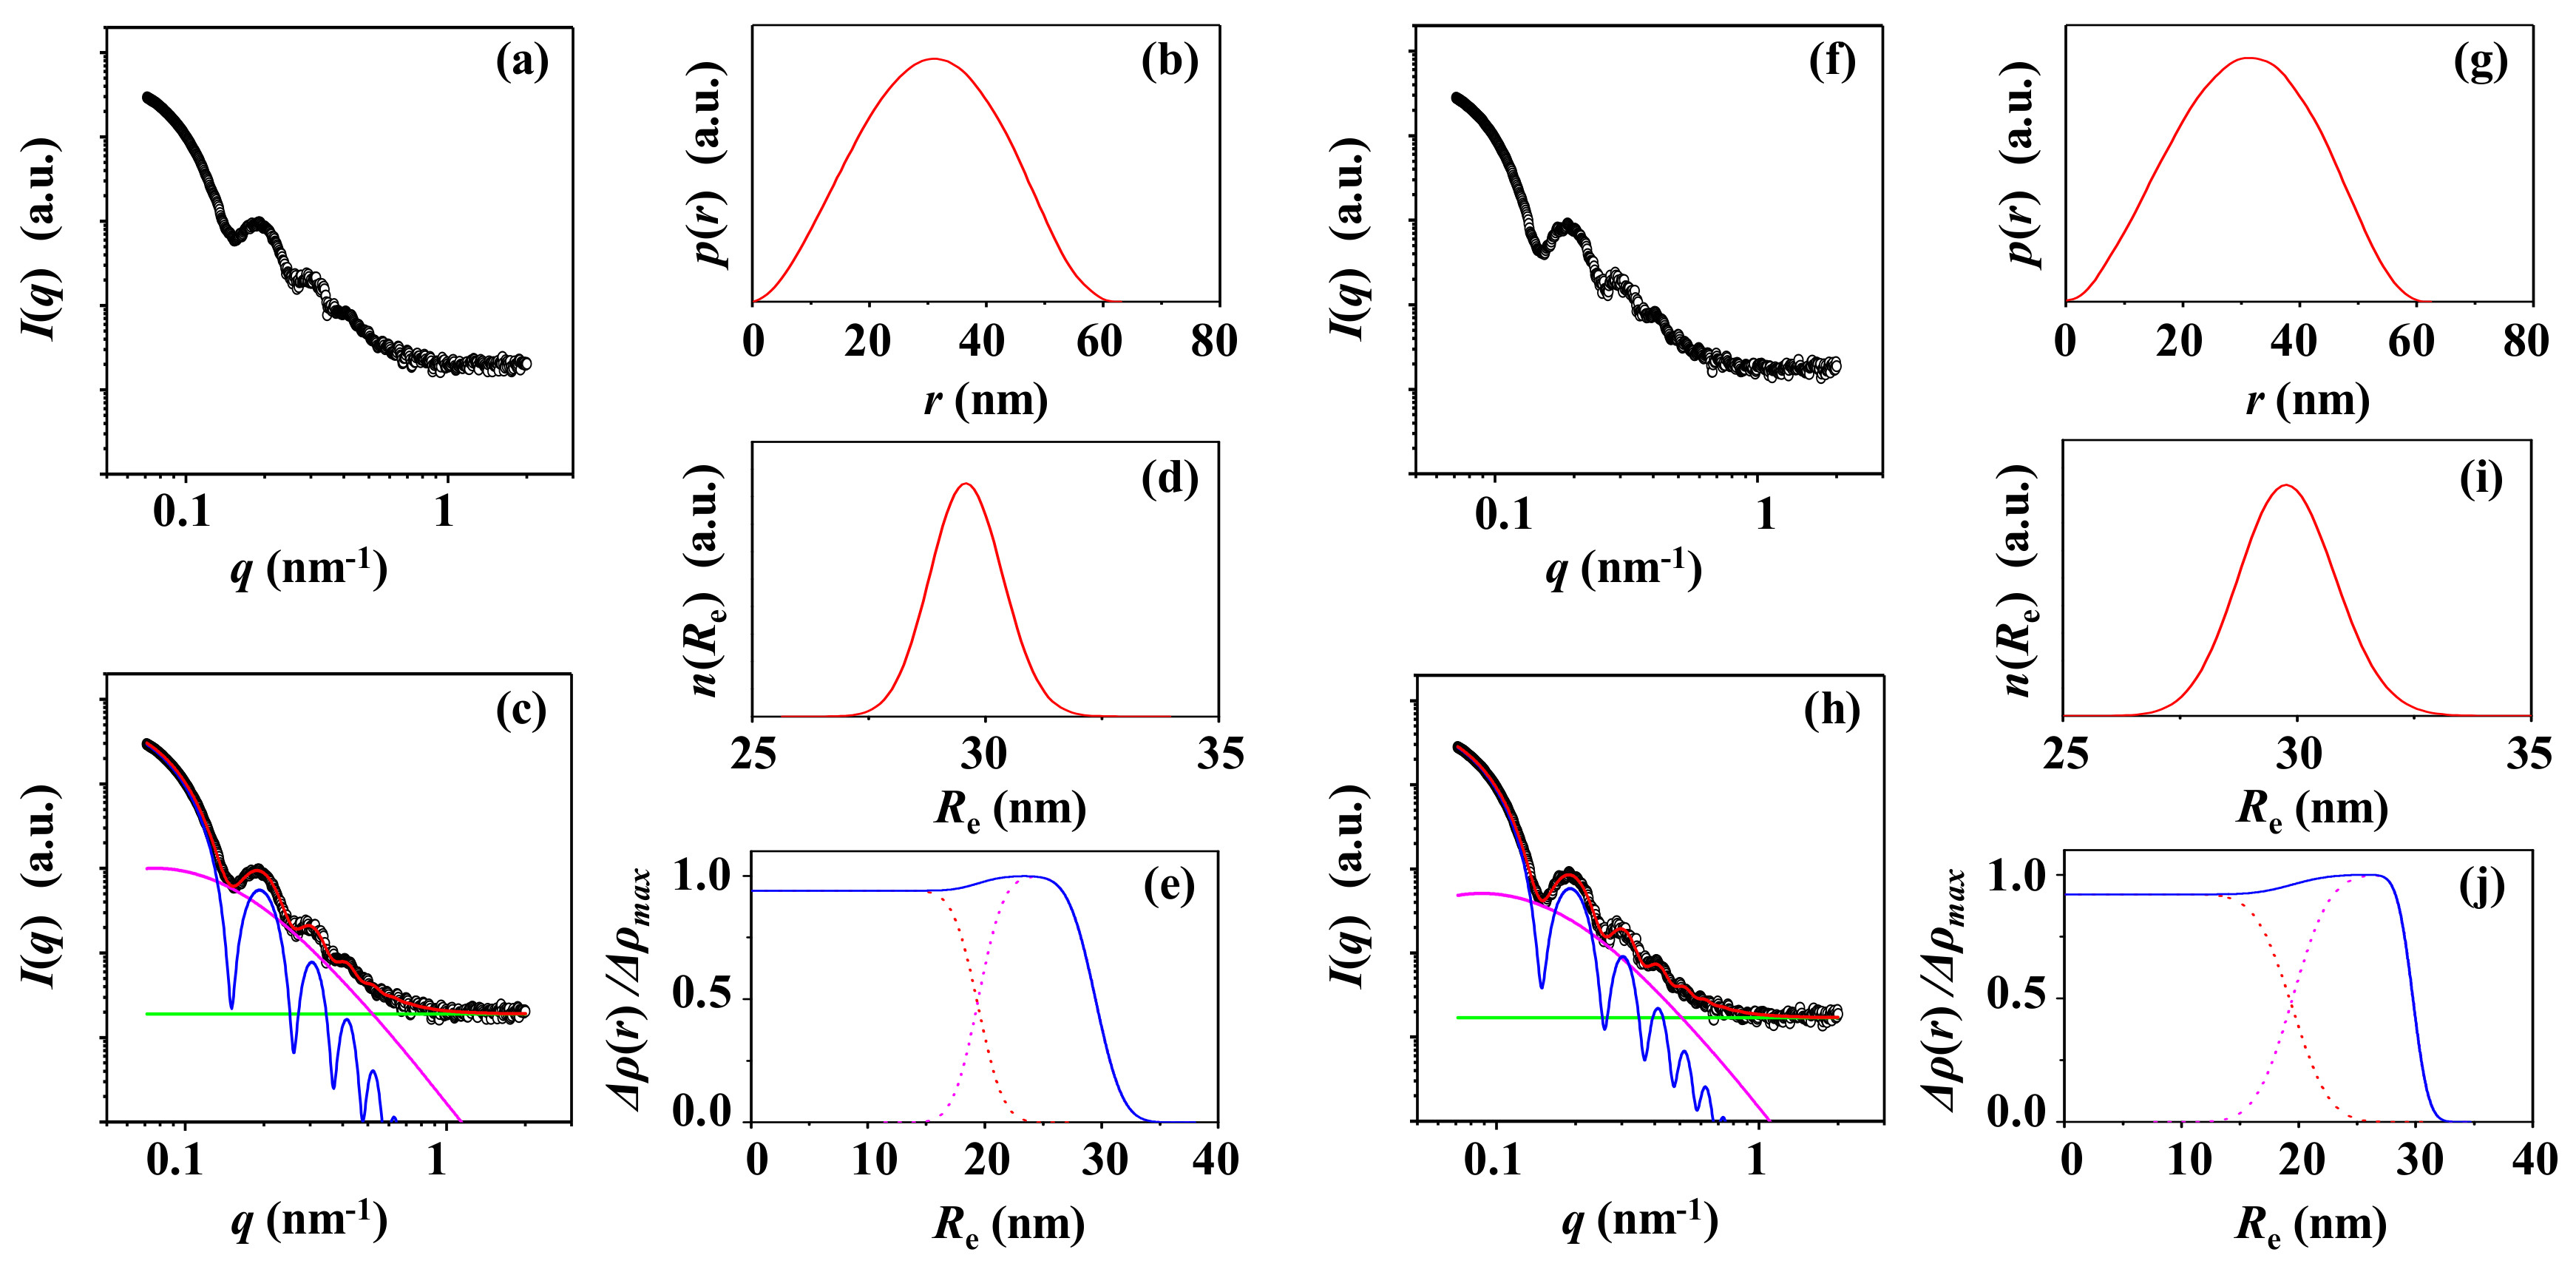
3.1. PS-1
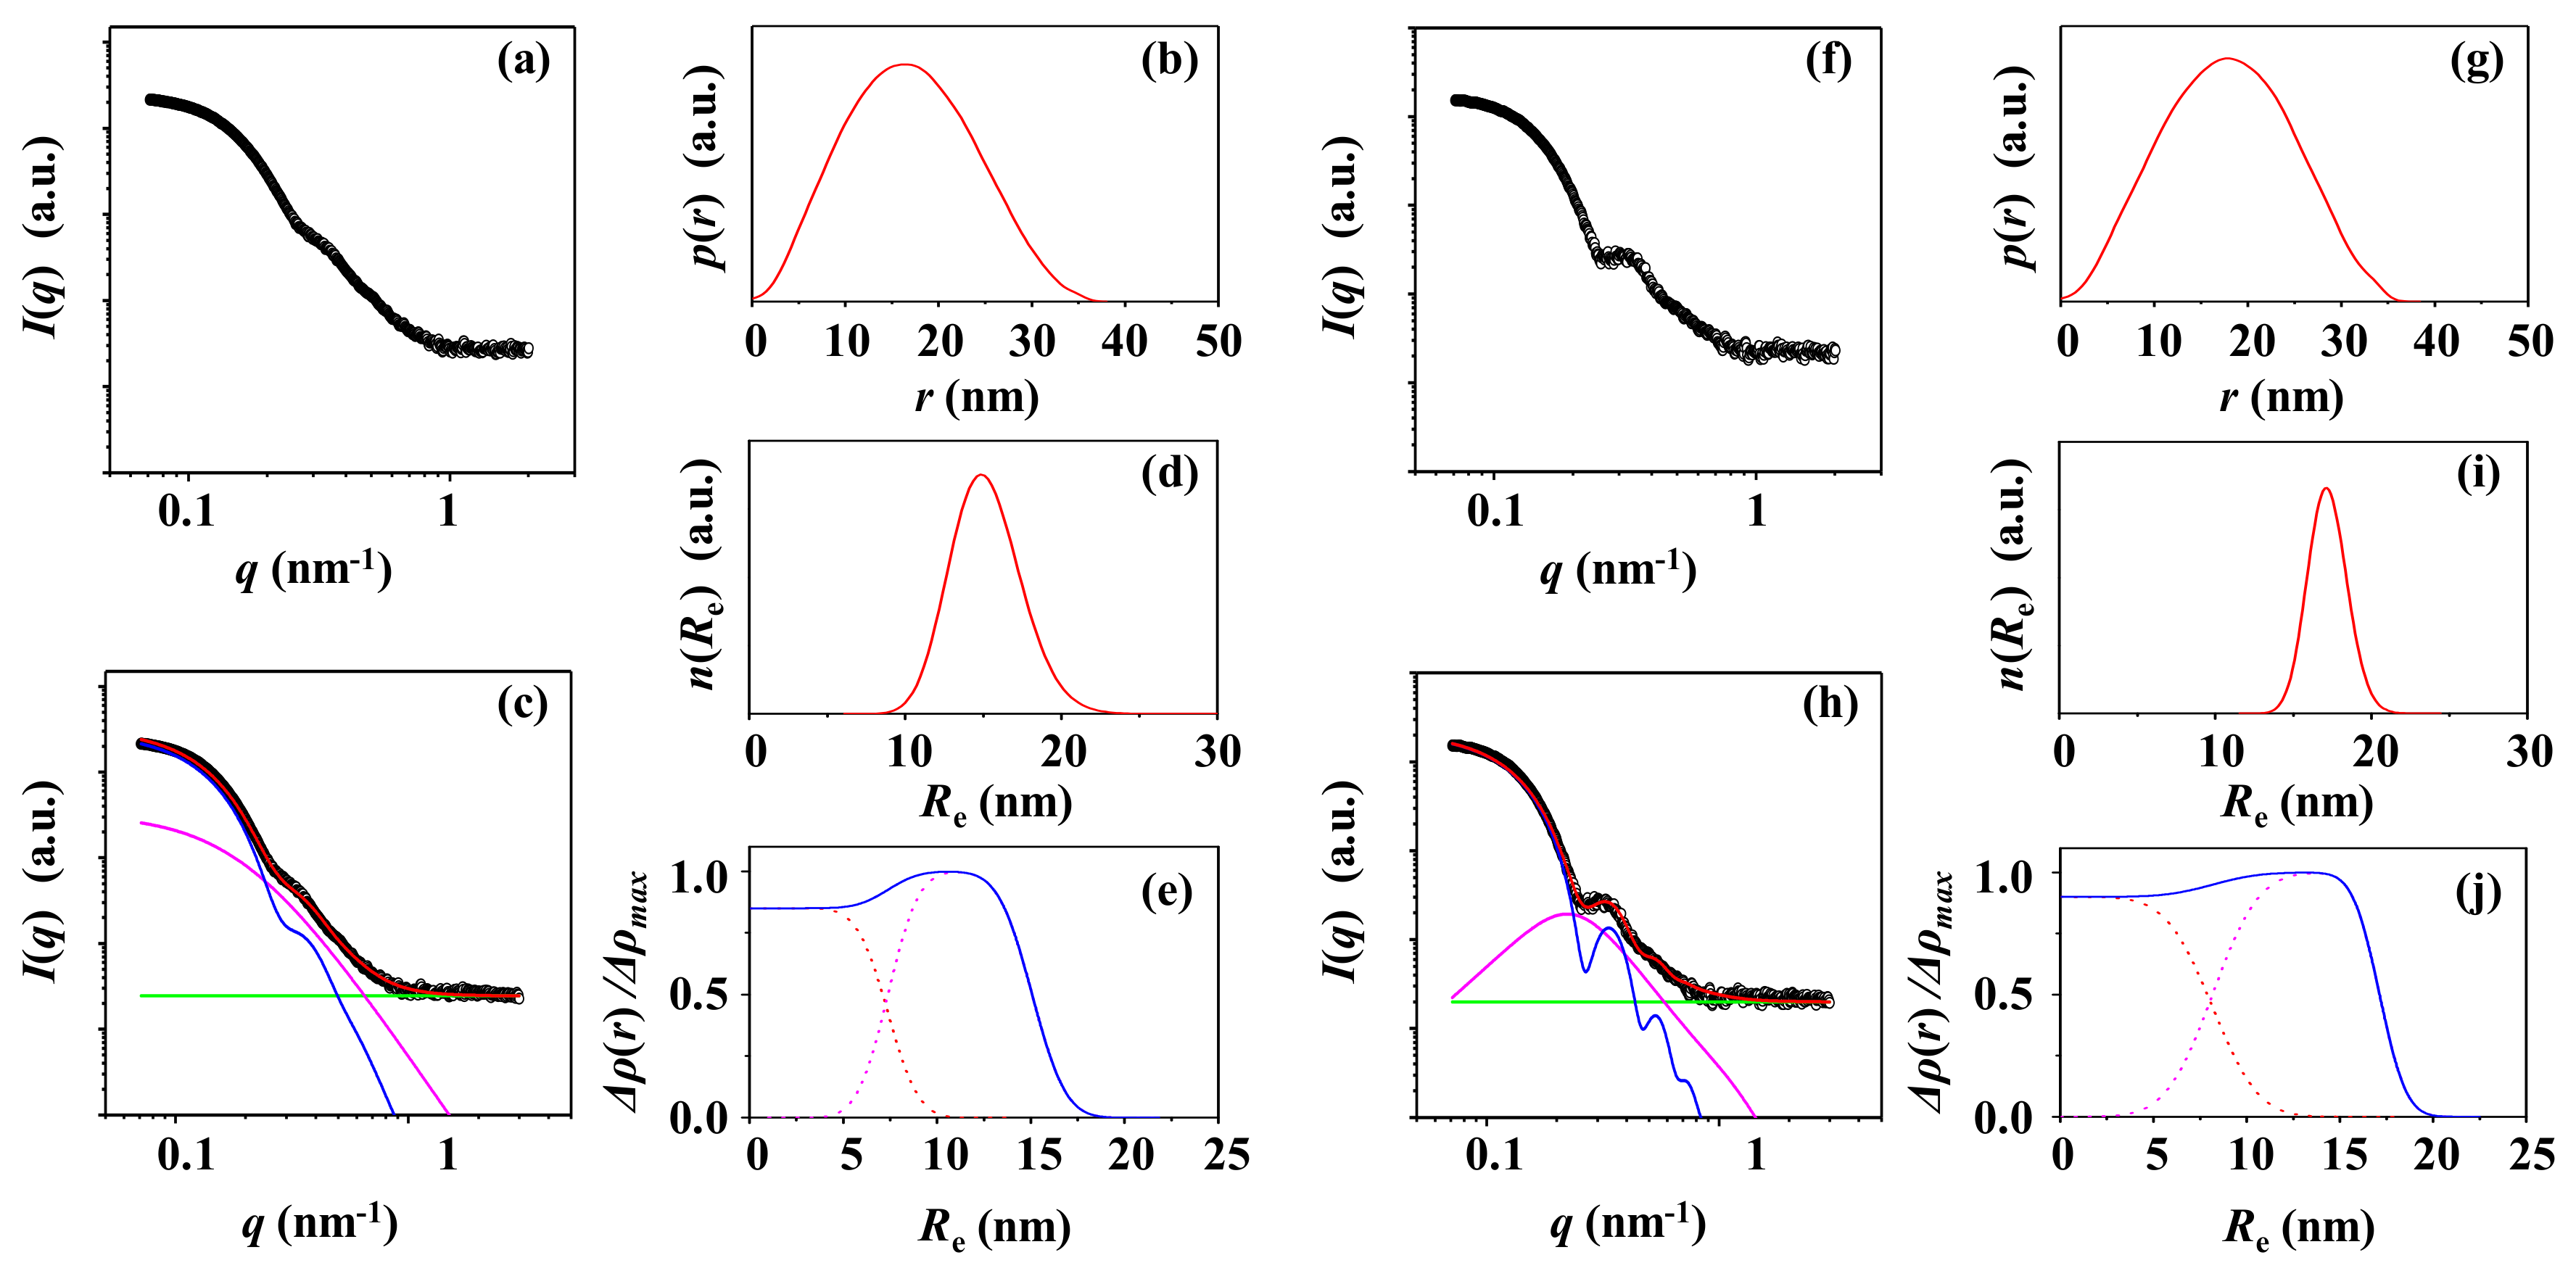
3.2. PS-2
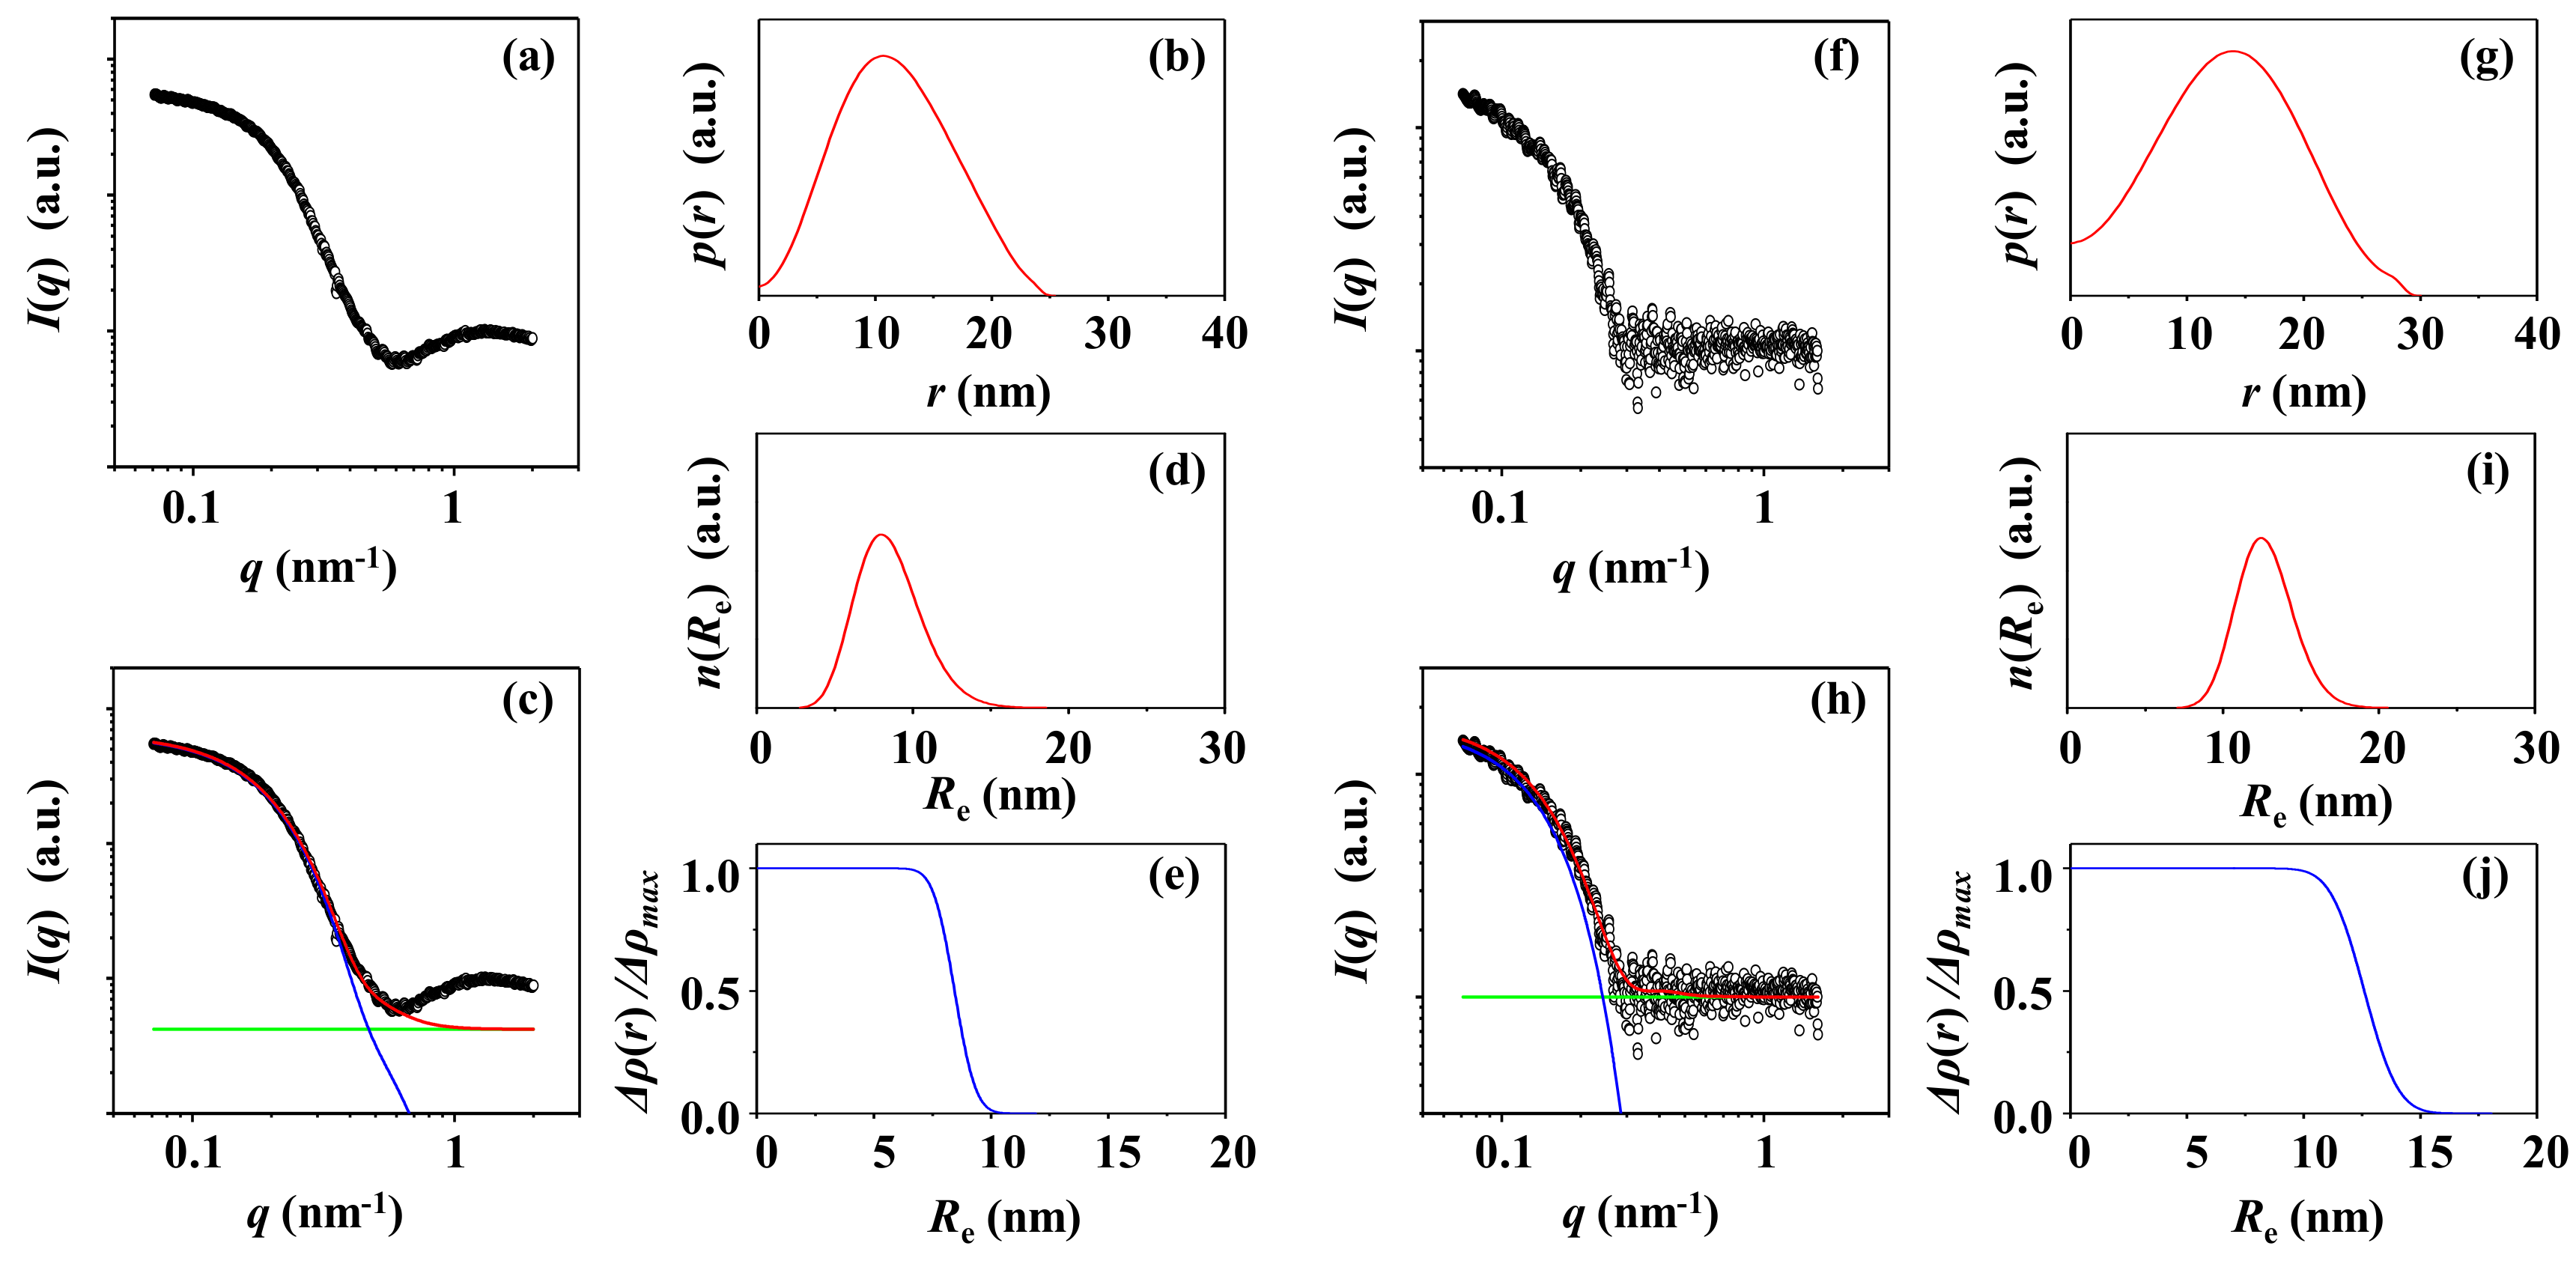
3.3. PS-3
3.4. PS-4
4. Conclusions
Supplementary Materials
Author Contributions
Funding
Acknowledgments
Conflicts of Interest
References
- Gilbert, R.G. Emulsion Polymerization, A Mechanistic Approach; Academic Press: London, UK, 1995. [Google Scholar]
- Antonietti, M.; Forster, S. Vesicles and liposomes: A self-assembly principle beyond lipids. Adv. Mater. 2003, 15, 1323–1333. [Google Scholar] [CrossRef]
- Atanase, L.I.; Riess, G. Self-assembly of block and graft copolymers in organic solvents: An overview of recent advances. Polymers 2018, 10, 62. [Google Scholar] [CrossRef] [PubMed]
- Ree, B.J.; Satoh, Y.; Jin, K.S.; Isono, T.; Kim, W.J.; Kakuchi, T.; Satoh, T.; Ree, M. Well-defined stable nanomicelles self-assembled by cyclic and tadpole polymers: A versatile smart carrier platform. NPG Asia Mater. 2017, 9, e453. [Google Scholar] [CrossRef]
- Atanase, L.I.; Desbrieres, J.; Riess, G. Micellization of synthetic and polysaccharides-based graft copolymers in aqueous media. Prog. Polym. Sci. 2017, 73, 32–60. [Google Scholar] [CrossRef]
- Kim, Y.Y.; Hwang, B.; Song, S.; Ree, B.J.; Kim, Y.; Cho, S.Y.; Heo, K.; Kwon, Y.K.; Ree, M. Well-defined hollow nanochanneled-silica nanospheres prepared with the aid of sacrificial copolymer nanospheres and surfactant nanocylinders. Nanoscale 2015, 7, 14774–14785. [Google Scholar] [CrossRef]
- Liu, W.T. Nanoparticles and their biological and environmental applications. J. Biosci. Bioeng. 2006, 102, 1–7. [Google Scholar] [CrossRef]
- Zhang, Q.F.; Uchaker, E.; Candelaria, S.L.; Cao, G.Z. Nanomaterials for energy conversion and storage. Chem. Soc. Rev. 2013, 42, 3127–3171. [Google Scholar] [CrossRef]
- Patri, A.K.; Dobrovolskaia, M.A.; Stern, S.T.; McNeil, S.E. Chapter 7. Preclinical Characterization of Engineered Nanoparticles Intended for Cancer Therapeutics. In Nanotechnology for Cancer Therapy; Amiji, M.M., Ed.; Taylor Francis Group: Boca Raton, FL, USA, 2006. [Google Scholar]
- Siralertmukul, K.; Watcharamul, S.; Wicheanpaisan, N.; Nuisin, R. Potential antibacterial activity of polystyrene nanoparticles/chitosan coated on cotton fabrics. Macromol. Symp. 2015, 354, 324–333. [Google Scholar] [CrossRef]
- Gao, Y.; Shi, Y. Design of a single nanoparticle trapping device based on bow-tie-shaped photonic crystal nanobeam cavities. IEEE Photonics J. 2019, 11, 4500408. [Google Scholar] [CrossRef]
- Taguchi, M.; Ogami, T.; Ando, J.; Fukuda, T.; Emoto, A. Ag-coated submicron particles of polystyrene formed by dewetting process and their application in multi-functional biosensor-chips. Colloids Surf. A 2018, 558, 171–178. [Google Scholar] [CrossRef]
- Lehner, R.; Weder, C.; Petri-Fink, A.; Rothen-Rutishauser, B. Emergence of nanoplastic in the environment and possible impact on human health. Environ. Sci. Technol. 2019, 53, 1748–1765. [Google Scholar] [CrossRef] [PubMed]
- Yang, Q.; Li, L.; Zhao, F.; Han, H.; Wang, W.; Tian, Y.; Wang, Y.; Ye, Z.; Guo, X. Hollow silica–polyelectrolyte composite nanoparticles for controlled drug delivery. J. Mater. Sci. 2018, 54, 2552–2565. [Google Scholar] [CrossRef]
- Ehmann, F.; Sakai-Kato, K.; Duncan, R.; Hernán Pérez dela Ossa, D.; Pita, R.; Vidal, J.M.; Kohli, A.; Tothfalusi, L.; Sanh, A.; Tinton, S.; et al. Next-generation nanomedicines and nanosimilars: EU regulators’ initiatives relating to the development and evaluation of nanomedicines. Nanomedicine 2013, 8, 849–856. [Google Scholar] [CrossRef] [PubMed]
- Chithrani, B.D.; Ghazani, A.A.; Chan, W.C. Determining the size and shape dependence of gold nanoparticle uptake into mammalian cells. Nano Lett. 2006, 6, 662–668. [Google Scholar] [CrossRef]
- Cabral, H.; Matsumoto, Y.; Mizuno, K.; Chen, Q.; Murakami, M.; Kimura, M.; Terada, Y.; Kano, M.R.; Miyazono, K.; Uesaka, M.; et al. Accumulation of sub-100 nm polymeric micelles in poorly permeable tumours depends on size. Nat. Nanotechnol. 2011, 6, 815–823. [Google Scholar] [CrossRef]
- Döge, N.; Hadam, S.; Volz, P.; Wolf, A.; Schönborn, K.-H.; Blume-Peytavi, U.; Alexiev, U.; Vogt, A. Identification of polystyrene nanoparticle penetration across intact skin barrier as rare event at sites of focal particle aggregations. J. Biophotonics. 2018, 11, e201700169. [Google Scholar] [CrossRef]
- Rothbauer, M.; Patel, N.; Gondola, H.; Siwetz, M.; Huppertz, B.; Ertl, P. A comparative study of five physiological key parameters between four different human trophoblast-derived cell lines. Sci. Rep. 2017, 7, 5892. [Google Scholar] [CrossRef]
- Gaumet, M.; Vargas, A.; Gurny, R.; Delie, F. Nanoparticles for drug delivery: The need for precision in reporting particle size parameters. Eur. J. Pharm. Biopharm. 2008, 69, 1–9. [Google Scholar] [CrossRef]
- Marques-Santos, L.F.; Grassi, G.; Bergami, E.; Faleri, C.; Balbi, T.; Salis, A.; Damonte, G.; Canesi, L.; Corsi, I. Cationic polystyrene nanoparticle and the sea urchin immune system: Biocorona formation, cell toxicity, and multixenobiotic resistance phenotype. Nanotoxicology 2018, 12, 847–867. [Google Scholar] [CrossRef]
- Liu, Y.; MarkWorden, R. Size dependent disruption of tethered lipid bilayers by functionalized polystyrene nanoparticles. Biochim. Biophys. Acta 2015, 1848, 67–75. [Google Scholar] [CrossRef][Green Version]
- Cai, X.J.; Woods, A.; Mesquida, P.; Jones, S.A. Assessing the potential for drug−nanoparticle surface interactions to improve drug penetration into the skin. Mol. Pharm. 2016, 13, 1375–1384. [Google Scholar] [CrossRef] [PubMed]
- McCarthy, J.; Gong, X.; Nahirney, D.; Duszyk, M.; Radomski, M.W. Polystyrene nanoparticles activate ion transport in human airway epithelial cells. Internatl. J. Nanomed. 2011, 6, 1343–1356. [Google Scholar] [CrossRef] [PubMed]
- Brun, N.R.; Beenakker, M.M.T.; Hunting, E.R.; Ebert, D.; Vijver, M.G. Brood pouch-mediated polystyrene nanoparticle uptake during Daphnia magna embryogenesis. Nanotoxicology 2017, 11, 1059–1069. [Google Scholar] [CrossRef] [PubMed]
- Stetefeld, J.; McKenna, S.A.; Patel, T.R. Dynamic light scattering: A practical guide and applications in biomedical sciences. Biophys. Rev. 2016, 8, 409–427. [Google Scholar] [CrossRef]
- Kestens, V.; Roebben, G.; Herrmann, J.; Jämting, Å.; Coleman, V.; Minelli, C.; Clifford, C.; De Temmerman, P.J.; Mast, J.; Junjie, L.; et al. Challenges in the size analysis of a silica nanoparticle mixture as candidate certified reference material. J. Nanopart. Res. 2016, 18, 171. [Google Scholar] [CrossRef]
- Hoo, C.M.; Starostin, N.; West, P.; Mecartney, M.L. A comparison of atomic force microscopy (AFM) and dynamic light scattering (DLS) methods to characterize nanoparticle size distributions. J. Nanopart. Res. 2008, 10, 89–96. [Google Scholar] [CrossRef]
- Frisken, B.J. Revisiting the method of cumulants for the analysis of dynamic light-scattering data. Appl. Opt. 2001, 40, 4087–4091. [Google Scholar] [CrossRef]
- Patty, P.J.; Frisken, B.J. Direct determination of the number-weighted mean radius and polydispersity from dynamic light-scattering data. Appl. Opt. 2006, 45, 2209–2216. [Google Scholar] [CrossRef]
- Xu, Y.; Nakane, N.; Maurer-Spurej, E. Novel test for microparticles in platelet-rich plasma and platelet concentrates using dynamic light scattering. Transfusion 2011, 51, 363–370. [Google Scholar] [CrossRef]
- Ree, B.J.; Lee, J.; Satoh, Y.; Kwon, K.; Isono, T.; Satoh, T.; Ree, M. A Comparative study of dynamic light and X-ray scatterings on micelles of topological polymer amphiphiles. Polymers 2018, 10, 1347. [Google Scholar] [CrossRef]
- Ree, B.J.; Satoh, T.; Yamamoto, T. Micelle structure details and stabilities of cyclic block copolymer amphiphile and its linear analogues. Polymers 2019, 11, 163. [Google Scholar] [CrossRef] [PubMed]
- Lee, J.; Xiang, L.; Byambabaatar, S.; Kim, H.; Jin, K.S.; Ree, M. Bacillus licheniformis α-amylase: Structural feature in a biomimetic solution and structural changes in extrinsic conditions. Int. J. Biol. Macromol. 2019, 127, 286–296. [Google Scholar] [CrossRef] [PubMed]
- Bootz, A.; Vogel, V.; Schubert, D.; Kreuter, J. Comparison of scanning electron microscopy, dynamic light scattering and analytical ultracentrifugation for the sizing of poly(butyl cyanoacrylate) nanoparticles. Eur. J. Pharm. Biopharm. 2004, 57, 369–375. [Google Scholar] [CrossRef]
- Zhang, J.; Li, Y.; An, F.F.; Zhang, X.; Chen, X.; Lee, C.S. Preparation and size control of sub-100 nm pure nanodrugs. Nano Lett. 2015, 15, 313–318. [Google Scholar] [CrossRef]
- Kuntsche, J.; Horst, J.C.; Bunjes, H. Cryogenic transmission electron microscopy (cryo-TEM) for studying the morphology of colloidal drug delivery systems. Int. J. Pharm. 2011, 417, 120–137. [Google Scholar] [CrossRef] [PubMed]
- Yuana, Y.; Oosterkamp, T.H.; Bahatyrova, S.; Ashcroft, B.; Garcia, R.P.; Bertina, R.M.; Osanto, S. Atomic force microscopy: A novel approach to the detection of nanosized blood microparticles. J. Thromb. Haemost. 2010, 8, 315–323. [Google Scholar] [CrossRef]
- Wolfgang, H.-G.; Dorothee, H.; Klaus-Peter, J.; Carl Georg, F.; Harald, B. Current limitations of SEM and AFM metrology for the characterization of 3D nanostructures. Meas. Sci. Technol. 2011, 22, 094003. [Google Scholar]
- Baalousha, M.; Lead, J.R. Rationalizing nanomaterial sizes measured by atomic force microscopy, flow field-flow fractionation, and dynamic light scattering: Sample preparation, polydispersity, and particle structure. Environ. Sci. Technol. 2012, 46, 6134–6142. [Google Scholar] [CrossRef]
- Takechi-Haraya, Y.; Goda, Y.; Sakai-Kato, K. Imaging and size measurement of nanoparticles in aqueous medium by use of atomic force microscopy. Anal. Bioanal. Chem. 2018, 410, 1525–1531. [Google Scholar] [CrossRef]
- Ballauff, M. Analysis of polymer colloids by small-angle X-ray and neutron scattering: Contrast variation. Adv. Eng. Mater. 2011, 13, 793–802. [Google Scholar] [CrossRef]
- Teulon, J.-M.; Godon, C.; Chantalat, L.; Moriscot, C.; Cambedouzou, J.; Odorico, M.; Ravaux, J.; Podor, R.; Gerdil, A.; Habert, A.; et al. On the operational aspects of measuring nanoparticle sizes. Nanomaterials 2019, 9, 18. [Google Scholar] [CrossRef] [PubMed]
- Kim, M.; Rho, Y.; Jin, K.S.; Ahn, B.; Jung, S.; Kim, H.; Ree, M. pH-dependent structures of ferritin and apoferritin in solution: Disassembly and reassembly. Biomacromolecules 2011, 12, 1629–1640. [Google Scholar] [CrossRef]
- Shin, S.R.; Jin, K.S.; Lee, C.K.; Kim, S.I.; Spinks, G.M.; So, I.; Jeon, J.-H.; Kang, T.M.; Mun, J.Y.; Han, S.-S.; et al. Fullerene attachment enhances performance of a DNA nanomachine. Adv. Mater. 2009, 21, 1907–1910. [Google Scholar] [CrossRef]
- Castorph, S.; Riedel, D.; Arleth, L.; Sztucki, M.; Jahn, R.; Holt, M.; Salditt, T. Structure parameters of synaptic vesicles quantified by small-angle x-ray scattering. Biophys. J. 2010, 98, 1200–1208. [Google Scholar] [CrossRef] [PubMed]
- Zhao, Y.; Liu, S.; Elsworth, D.; Jiang, Y.; Zhu, J. Pore Structure Characterization of Coal by Synchrotron Small-Angle X-ray Scattering and Transmission Electron Microscopy. Energy Fuels 2014, 28, 3704–3711. [Google Scholar] [CrossRef]
- Cervellino, A.; Giannini, C.; Guagliardi, A.; Zanchet, D. Quantitative analysis of gold nanoparticles from synchrotron data by means of least-squares techniques: Least-squares analysis of gold nanoparticles. Eur. Phys. J. B 2004, 41, 485–493. [Google Scholar] [CrossRef]
- Hassellov, M.; Readman, J.W.; Ranville, J.F.; Tiede, K. Nanoparticle analysis and characterization methodologies in environmental risk assessment of engineered nanoparticles. Ecotoxicology 2008, 17, 344–361. [Google Scholar] [CrossRef]
- Mahl, D.; Diendorf, J.; Meyer-Zaika, W.; Epple, M. Possibilities and limitations of different analytical methods for the size determination of a bimodal dispersion of metallic nanoparticles. Colloids Surf. A Physicochem. Eng. Asp. 2011, 377, 386–392. [Google Scholar] [CrossRef]
- Eaton, P.; Quaresma, P.; Soares, C.; Neves, C.; De Almeida, M.P.; Pereira, E.; West, P. A direct comparison of experimental methods to measure dimensions of synthetic nanoparticles. Ultramicroscopy 2017, 182, 179–190. [Google Scholar] [CrossRef]
- DeBlois, R.W.; Bean, C.P. Counting and sizing of submicron particles by the resistive pulse technique. Rev. Sci. Instrum. 1970, 41, 909–916. [Google Scholar] [CrossRef]
- Pabst, W.; Gregorová, E. Characterization of Particles and Particle Systems; Institute of Chemical Technology (ICT): Prague, Czech, 2007. [Google Scholar]
- Braun, A.; Couteau, O.; Franks, K.; Kestens, V.; Roebben, G.; Lamberty, A.; Linsinger, T.P.J. Validation of dynamic light scattering and centrifugal liquid sedimentation methods for nanoparticle characterisation. Adv. Powder Technol. 2011, 22, 766–770. [Google Scholar] [CrossRef]
- Boyd, R.D.; Pichaimuthu, S.K.; Cuenat, A. New approach to intertechnique comparisons for nanoparticle size measurements; using atomic force microscopy, nanoparticle tracking analysis and dynamic light scattering. Colloids Surf. A Physicochem. Eng. Asp. 2011, 387, 35–42. [Google Scholar] [CrossRef]
- Kato, H.; Nakamura, A.; Takahashi, K.; Kinugasa, S. Accurate size and size-distribution determination of polystyrene latex nanoparticles in aqueous medium using dynamic light scattering and asymmetrical flow field flow fractionation with multi-angle light scattering. Nanomaterilas 2012, 2, 15–30. [Google Scholar] [CrossRef] [PubMed]
- Kim, K.; Kim, J.; Yun, Y.; Ahn, H.; Min, B.; Kim, N.; Rah, S.; Kim, H.; Lee, C.; Seo, I.; et al. Small-angle X-ray Scattering Beamline BL4C SAXS at Pohang Light Source II. Biodesign 2017, 5, 24–29. [Google Scholar]
- Glatter, O.J. A new method for the evaluation of small-angle scattering data. J. Appl. Crystallogr. 1977, 10, 415–421. [Google Scholar] [CrossRef]
- Takeshita, H.; Poovarodom, M.; Kiya, T.; Arai, F.; Takenaka, K.; Miya, M.; Shiomi, T. Crystallization behavior and chain folding manner of cyclic, star and linear poly(tetrahydrofuran)s. Polymer 2012, 53, 5375–5384. [Google Scholar] [CrossRef]
- Li, T.; Senesi, A.J.; Lee, B. Small Angle X-ray Scattering for Nanoparticle Research. Chem. Rev. 2016, 116, 11128–11180. [Google Scholar] [CrossRef]
- Hashemi, S. TEM Data from Thermo Fisher Particle Technology; Thermo Fisher Inc.: Waltham, MA, USA, 2017. [Google Scholar]
- Siegert, A.J.F. On the fluctuations in signals returned by many independently moving scatterers. In Massachusetts Institute of Technology; Radiation Laboratory Report No. 465; MIT: Cambridge, MA, USA, 1949. [Google Scholar]
- Simons, J. The Siegert method in resonance scattering: Relation to L2 methods. Int. J. Quantum Chem. 1981, 20, 779–780. [Google Scholar] [CrossRef]


| PS Nanoparticles | ||||||||
|---|---|---|---|---|---|---|---|---|
| Structure Parameter | PS-1 | PS-2 | PS-3 | PS-4 | ||||
| Water a | Supernatant b | Water | Supernatant | Water | Supernatant | Water | Supernatant | |
| SAXS Analysis | ||||||||
| Rec(nm) | 43.2 (1.0) d | 43.2 (0.8) | 29.6 (0.8) | 29.8 (1.0) | 14.5 (2.5) | 16.5 (1.3) | 8.5 (2.1) | 12.7 (1.8) |
| rce(nm) | 29.2 (0.6) | 27.0 (0.6) | 19.6 (0.5) | 19.8 (0.5) | 7.3 (1.8) | 8.3 (0.6) | 8.5 (2.1) | 12.7 (1.8) |
| tf,cf(nm) | 5.5 | 6.6 | 2.4 | 3.5 | 1.5 | 2.6 | 1.0 | 1.6 |
| tsg(nm) | 14.0 (0.8) | 16.2 (0.5) | 10.0 (0.6) | 10.0 (0.9) | 7.2 (1.8) | 8.2 (1.1) | ||
| tf,sh(nm) | 1.5 | 1.5 | 2.6 | 1.5 | 1.7 | 1.5 | ||
| ε i | 1.0 | 1.0 | 1.0 | 1.0 | 1.0 | 1.0 | 1.0 | 1.0 |
| ξ j (nm) | 4.6 | 5.2 | 5.4 | 4.7 | 5.0 | 2.9 | ||
| Rgk (nm) | 33.5 | 33.5 | 22.9 | 23.1 | 11.2 | 12.9 | 6.6 | 9.8 |
| Rg,IFTl (nm) | 33.8 | 33.7 | 23.2 | 23.3 | 12.9 | 13.5 | 8.9 | 10.4 |
| Rmax,IFTm (nm) | 45.5 | 45.1 | 30.9 | 31.2 | 16.3 | 18.0 | 10.7 | 14.1 |
| Dmax,IFTn (nm) | 87.5 | 86.8 | 63.0 | 62.4 | 38.0 | 38.4 | 25.4 | 30.0 |
| Rmax,IFT/Rg,IFT | 1.35 | 1.34 | 1.33 | 1.34 | 1.26 | 1.33 | 1.20 | 1.36 |
| Dmax/Rmax,IFT | 1.92 | 1.92 | 2.04 | 2.00 | 2.33 | 2.13 | 2.37 | 2.13 |
| Rg/Rg,IFT | 0.99 | 0.99 | 0.99 | 0.99 | 0.87 | 0.96 | 0.74 | 0.94 |
| DLS Analysis | ||||||||
| Rh,zo (nm) | 33.5 | 25.0 | 14.0 | 10.4 | ||||
| PDIDLSp (nm) | 0.154 | 0.055 | 0.085 | 0.093 | ||||
| Rh,intensityq (nm) | 39.9 (14.7) | 26.9 (7.4) | 15.3 (4.7) | 11.6 (3.9) | ||||
| Rh,voulmer (nm) | 28.0 (10.5) | 21.9 (6.3) | 11.9 (3.7) | 8.6 (2.9) | ||||
| Rh,numbers (nm) | 21.6 (6.3) | 18.6 (4.5) | 9.9 (2.5) | 7.0 (1.9) | ||||
| Rh,z/Rg | 1.00 | 1.00 | 1.09 | 1.08 | 1.25 | 1.09 | 1.58 | 1.06 |
| Rh,z/Rg,IFT | 0.99 | 0.99 | 1.08 | 1.07 | 1.09 | 1.04 | 1.17 | 1.00 |
| Rh,intensity/Re | 0.92 | 0.92 | 0.91 | 0.90 | 1.06 | 0.93 | 1.36 | 0.91 |
| Rh,volume/Re | 0.65 | 0.65 | 0.74 | 0.73 | 0.82 | 0.72 | 1.01 | 0.68 |
| Rg,number/Re | 0.50 | 0.50 | 0.63 | 0.62 | 0.68 | 0.60 | 0.82 | 0.55 |
| TEM Analysis | ||||||||
| R t (nm) | 40.5 (1.5) | 25.5 (1.5) | ||||||
© 2020 by the authors. Licensee MDPI, Basel, Switzerland. This article is an open access article distributed under the terms and conditions of the Creative Commons Attribution (CC BY) license (http://creativecommons.org/licenses/by/4.0/).
Share and Cite
Wong, J.C.; Xiang, L.; Ngoi, K.H.; Chia, C.H.; Jin, K.S.; Ree, M. Quantitative Structural Analysis of Polystyrene Nanoparticles Using Synchrotron X-ray Scattering and Dynamic Light Scattering. Polymers 2020, 12, 477. https://doi.org/10.3390/polym12020477
Wong JC, Xiang L, Ngoi KH, Chia CH, Jin KS, Ree M. Quantitative Structural Analysis of Polystyrene Nanoparticles Using Synchrotron X-ray Scattering and Dynamic Light Scattering. Polymers. 2020; 12(2):477. https://doi.org/10.3390/polym12020477
Chicago/Turabian StyleWong, Jia Chyi, Li Xiang, Kuan Hoon Ngoi, Chin Hua Chia, Kyeong Sik Jin, and Moonhor Ree. 2020. "Quantitative Structural Analysis of Polystyrene Nanoparticles Using Synchrotron X-ray Scattering and Dynamic Light Scattering" Polymers 12, no. 2: 477. https://doi.org/10.3390/polym12020477
APA StyleWong, J. C., Xiang, L., Ngoi, K. H., Chia, C. H., Jin, K. S., & Ree, M. (2020). Quantitative Structural Analysis of Polystyrene Nanoparticles Using Synchrotron X-ray Scattering and Dynamic Light Scattering. Polymers, 12(2), 477. https://doi.org/10.3390/polym12020477