The Study of Physico-Mechanical Properties of Polylactide Composites with Different Level of Infill Produced by the FDM Method


Abstract
:1. Introduction
2. Materials and Methods
2.1. Materials
2.2. Method of testing
- M − water uptake
- Mw − mass of the samples after hydrolytic degradation
- Mt − mass of the neat samples before hydrolytic degradation
3. Results and discussion
- ΔHf is the melting enthalpy of the samples
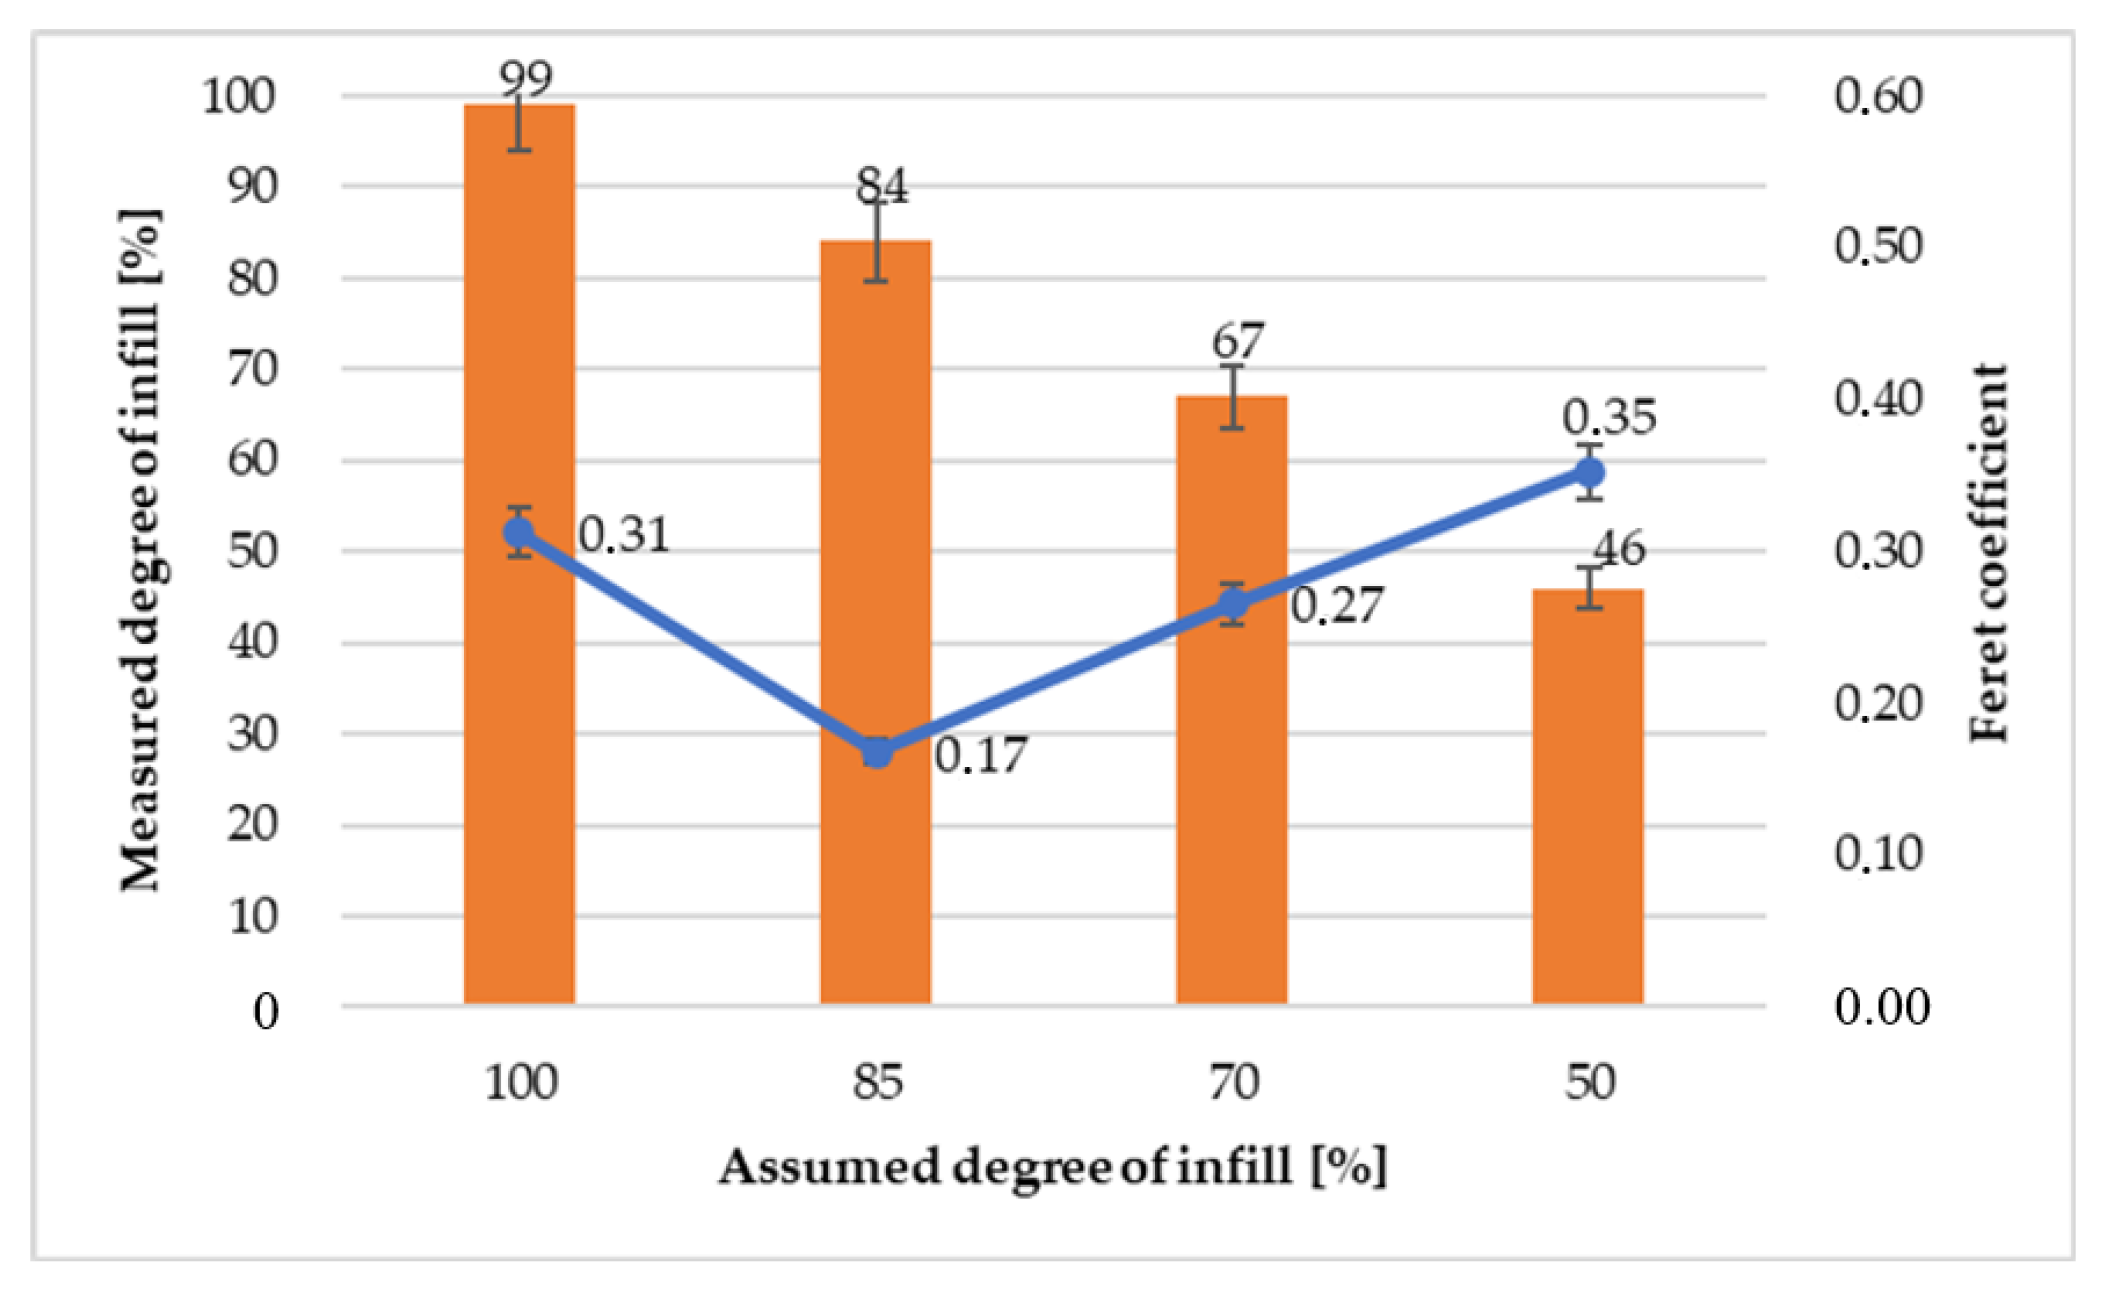
- Fmax − maximum length of empty space
- Fmin − minimum length of empty space
4. Conclusions
Author Contributions
Funding
Conflicts of Interest
References
- Wang, X.; Jiang, M.; Zhou, Z.; Gou, J.; Hui, D. 3D printing of polymer matrix composites: A review and prospective. Compos. Part B. 2017, 110, 442–458. [Google Scholar] [CrossRef]
- Gonzalez, J.; Rydz, J.; Musio, M.; Sikorska, W.; Hercog, A.; Kowalczuk, M. Three-dimensional printing of PLA and PLA / PHA dumbbell-shaped specimens of crisscross and transverse patterns as promising materials in emerging application areas: Prediction study. Polym. Degrad. Stab. 2018, 156, 100–110. [Google Scholar] [CrossRef] [Green Version]
- Popescu, D.; Zapciu, A.; Amza, C.; Baciu, F.; Marinescu, R. FDM process parameters in fl uence over the mechanical properties of polymer specimens: A review. Polym. Test. 2018, 69, 157–166. [Google Scholar] [CrossRef]
- Kozior, T.; Kundera, C. Evaluation of the influence of parameters of FDM technology on the selected mechanical properties of models. Procedia Eng. 2017, 192, 463–468. [Google Scholar] [CrossRef]
- Liao, Y.; Liu, C.; Coppola, B.; Barra, G.; Di Mio, L.; Incarnato, L.; Lafdi, K. Effect of porosity and crysallinity on 3D prited PLA properies. Polymer 2019, 11, 1487. [Google Scholar] [CrossRef] [Green Version]
- Vaes, D.; Coppens, M.; Goderis, B.; Zoetelied, W.; Van Puyvelde, P. Assessment of Crystallinity Development during Fused Filament Fabrication through Fast Scanning Chip Calorimetry. Appl. Sci. 2019, 9, 2676; [Google Scholar] [CrossRef] [Green Version]
- Ngo, T.W.; Kashani, A.; Imbalzano, G.; Nguyn, K.T.Q.; Hui, D. Additibe manufacturing (3D printing); A review of materials, methods, applications and challenges. Compos. Part B. 2018, 143, 172–196. [Google Scholar] [CrossRef]
- Saeidlou, S.; Huneault, M.A.; Li, H.; Park, C.B. Progress in Polymer Science Poly (lactic acid) crystallization. Prog. Polym. Sci. 2012, 37, 1657–1677. [Google Scholar] [CrossRef]
- Gupta, B.; Revagade, N.; Hilborn, J. Poly (lactic acid) fiber: An overview, Progress in Polymer Science (Oxford). Prog. Polym. Sci. 2007, 32, 4. [Google Scholar] [CrossRef]
- Drumright, R.E.; Gruber, P.R.; Henton, D.E. Polylactic Acid Technology Adv. Materials 2000, 12, 1841–1846. [Google Scholar]
- Jamshidian, M.; Arab-Tehrany, E.; Imran, M.; Jacquot, M.; Desobry, S. Poly-lactic acid: Production, applications, nanocomposites, and release studies. Compr. Rev. Food Sci. Food Saf. 2010, 9, 552–571. [Google Scholar] [CrossRef]
- Modjarrad, K.; Ebnesajjad, S. Handbook of Polymer Applications in Medicine and Medical Devices; Elsevier: Amsterdam, The Netherlands, 2013. [Google Scholar]
- Garlotta, D. A literature review of poly(lactic acid). J. Polym. Environ. 2001, 9, 2. [Google Scholar] [CrossRef]
- Lasprilla, A.J.R.; Martinez, G.A.R.; Lunelli, B.H.; Jardini, A.L.; Filho, R.M. Poly-lactic acid synthesis for application in biomedical devices - A review. Biotechnol. Adv. 2012, 30, 1. [Google Scholar] [CrossRef] [PubMed]
- Auras, R.; Lim, L.T.; Selke, S.E.M.; Tsuji, H. Poly (Lactic Acid): Synthesis, Structures, Properties, Processing, and Applications; Chapter 12: Poly(lactic acid) Science and Technology: Processing, Properties, Additives and Applications Jiménez A.; Peltzer, M., Ruseckaite, R., Eds.; The Royal Society of Chemistry: Cambridge, UK, 2014. [Google Scholar]
- Giordano, R.A.; Wu, B.M.; Borland, S.W.; Cima, L.G.; Sachs, E.M.; Cima, M.J. Mechanical properties of dense polylactic acid structures fabricated by three dimensional printing. J Biomater. Sci. Polym. Ed. 1997, 8, 63–75. [Google Scholar] [CrossRef] [PubMed]
- U.S. Food & Drug administration. Packaging & Food Contact Substances (FCS). In Food Ingred. Packag.; 2020. Available online: https://www.fda.gov/food/food-ingredients-packaging/packaging-food-contact-substances-fcs (accessed on 10 October 2020).
- Sodergard, A.; Stolt, M. Natural and synthetic biomedical polymers. Biomedicine, Prog. Polym. Sci. 2014, 27, 1123–1163. [Google Scholar] [CrossRef]
- Song, Y.; Tashiro, K.; Xu, D.; Liu, J.; Bin, Y. Crystallization behavior of poly (lactic acid )/ micro fibrillated cellulose composite. Polymer (Guildf) 2013, 54, 3417–3425. [Google Scholar] [CrossRef]
- Pilla, S.; Gong, S.; Neill, E.O.; Rowell, R.M.; Krzysik, A.M. Polylactide-Pine Wood Flour Composites. Polym. Eng. Sci. 2008, 48, 578–587. [Google Scholar] [CrossRef]
- Lebedev, S.M.; Gefle, O.S.; Amitov, E.T.; Berchuk, D.Y.; Zhuravlev, D.V. Poly(lactic acid)-based polymer composites with high electric and thermal conductivity and their characterization. Polym. Test. 2017, 58, 241–248. [Google Scholar] [CrossRef]
- Zakaria, Z.; Islam, S.; Hassan, A.; Haafiz, M.K.M.; Arjmandi, R.; Inuwa, I.M.; Hasan, M. Mechanical Properties and Morphological Characterization of PLA / Chitosan / Epoxidized Natural Rubber Composites. Adv. Mater. Sci. Eng. 2013. [Google Scholar] [CrossRef] [Green Version]
- Lebedev, S.M.; Gefle, O.S.; Amitov, E.T.; Berchuk, D.Y.; Zhuravlev, D.V. Influence of heavy metal powders on rheological properties of poly(lactic acid). Russ. Phys. J. 2017, 60, 624–630. [Google Scholar] [CrossRef]
- Xue, B.; Ye, J.; Zhang, J. Highly conductive Poly (L-lactic acid) composites obtained via in situ expansion of graphite. J. Polym. Res. 2015, 22, 1–9. [Google Scholar] [CrossRef]
- Laureto, J.; Tomasi, J.; King, J.A.; Pearce, J.M. Thermal properties of 3-D printed polylactic acid-metal composites porosity to accurately model the effect of air pore volume. Prog. Addit. Manuf. 2017, 2, 57–71. [Google Scholar] [CrossRef] [Green Version]
- Tekce, H.S.; Kumlutas, D.; Tavman, I.H. Effect of Particle Shape on Thermal Conductivity of Copper Reinforced Polymer Composites. J. Reinf. Plast. Copp. Reinf. Polym. Compos. 2007, 26, 113–121. [Google Scholar] [CrossRef]
- Perego, G.; Cella, G.D.; Bastloll, C. Effect of Molecular Weight and Crystallinity on Poly (lactic acid) Mechanical Properties. J. Appl. Polym. Sci. 1996, 59, 37–43. [Google Scholar] [CrossRef]
- Harris, A.M.; Lee, E.C. Improving Mechanical Performance of Injection Molded PLA by Controlling Crystallinity. J. of Appl. Polym. Sci. 2008, 107, 2246–2255. [Google Scholar] [CrossRef]
- Li, S.; Mccarthy, S. Influence of Crystallinity and Stereochemistry on the Enzymatic Degradation of Poly(lactide). Macromolecules 1999, 32, 4454–4456. [Google Scholar] [CrossRef]
- Drieskens, M.; Peeters, R.; Mullens, J.; Franco, D.; Lemstra, P.J. Structure Versus Properties Relationship of Poly (lactic acid). Eff. Cryst Barrier Prop. 2009, 47, 2247–2258. [Google Scholar] [CrossRef]
- Feng, Y.; Ma, P.; Xu, P.; Wang, R.; Dong, W.; Chen, M. The crystallization behavior of poly (lactic acid) with different types of nucleating agents. Int. J. Biol. Macromol. 2018, 106, 955–962. [Google Scholar] [CrossRef]
- Abeykoon, C.; Sri-Amphorn, P.; Fernando, A. Optimization of fused deposition modeling parameters for improved PLA and ABS 3D printed structures. Inter. J. Lightweight Mater. Manufact. 2020, 3, 284–297. [Google Scholar] [CrossRef]
- Luzianin, O.; Movrin, D.; Stathopoulos, V.; Pandis, P.; Radusin, T.; Guduric, V. Impact of processing parameters on tensile strength, in-process crystallinity and mesostructure in FDM-fabricated PLA specimens. Rapid Prototyping J. 2019, 25, 1398–1410. [Google Scholar] [CrossRef]
- Wang, L.; Gardner, D.J. Contribution of printing parameters to the interfacial strength of polylactic acid (PLA) in material extrusion additive manufacturing. Prog. Addit. Manuf. 2018, 3, 165–171. [Google Scholar] [CrossRef]
- Bher, A.; Unalan, I.; Auras, R.; Rubino, M.; Schvezov, C. Toughening of poly(lactic acid) and thermoplastic cassava starch reactive blends using graphene nanoplatelets. Polymers 2018, 10, 95. [Google Scholar] [CrossRef] [PubMed] [Green Version]
- Broda, J.; Fabia, J.; Baczek, M.; Slusarczyk, C. Supramolecular structure of polypropylene fibers extruded with addition of functionalized reduced graphene oxide. Polymers (Basel) 2020, 12, 910. [Google Scholar] [CrossRef] [PubMed]
- Sanes, J.; Sánchez, C.; Pamies, R.; Avilés, M.; Bermúdez, M. Extrusion of polymer nanocomposites with graphene and graphene derivative nanofillers: An overview of recent developments. Materials 2020, 13, 549. [Google Scholar] [CrossRef] [PubMed] [Green Version]
- Prusa Printers. What's up with Original Prusa i3- Prusa Printers. Available online: https://blog.prusaprinters.org/whats-up-with-original-prusa-i3_4124 (accessed on 20 September 2020).
- 3D Hubs. 3D printing trends Q3 2018. Available online: https://www.myminifactory.com/pages/3d-printing-content-trends-report-q3-2018 (accessed on 13 October 2020).
- Coetzee, G. Prusa shows us the New i3 MK2 3D Printer and where the Community is Headed, Jump up to. Available online: https://hackaday.com/2016/06/15/prusa-shows-us-the-new-i3-mk2-3d-printer-and-where-the-community-is-headed/ (accessed on 10 October 2020).
- Garzon-Hernandez, P.; Garcia-Gonzalez, D.; Jérusalem, A.; Arias, A. Design of FDM 3D printed polymers: An experimental-modelling methodology for the prediction of mechanical properties. Mater. Des. 2020, 188, 108414. [Google Scholar] [CrossRef]
- Brischetto, S.; Ferro, C.; Torre, R.; Maggiore, P. 3D FDM production and mechanical behavior of polymeric sandwich specimens embedding classical and honeycomb cores. Curved Layer. Struct. 2018, 5, 80–94. [Google Scholar] [CrossRef]
- Ferro, G.; Brischetto, S.; Torre, R.; Maggiore, P. Characterization of ABS specimens produced via the 3D printing technology for drone structural. Curved Layer. Struct. 2016, 3, 172–188. [Google Scholar] [CrossRef] [Green Version]
- Brischetto, S.; Torre, R. Tensile and Compressive Behavior in the Experimental Tests for PLA Specimens Produced via Fused Deposition Modelling Technique. J. Compos. Sci. 2020, 4. [Google Scholar] [CrossRef]
- Baran, H.; Erbil, Y. Surface Modification of 3D Printed PLA Objects by Fused Deposition Modeling: A Review. Colloids Interfaces 2019, 3, 43. [Google Scholar] [CrossRef] [Green Version]
- Malinowski, R.; Łubkowski, D. Badanie wpływu temperatury I czasu suszenia na wybrane właściwości polilaktydu (PLA). Inż. Ap. Chem. 2010, 49, 77–78. [Google Scholar]
- Deshmukh, K.; Basheer Ahamed, M.; Deshmukh, R.R.; Khadheer Pasha, S.K.; Bhagat, P.R.; Chidambaram, K. Biopolymer Composites with High Dielectric Performance: Interface Engineering. Biopolym. Compos. Electron. 2017, 27–128. [Google Scholar]
- Bazan, P.; Nosal, P.; Kozub, B.; Kuciel, S. Biobased Polyethylene Hybrid Composites with Natural Fiber: Mechanical, Thermal Properties, and Micromechanics. Materials 2020, 13, 2967. [Google Scholar] [CrossRef]
- Solomon, I.; Sevvel, P.; Gunasekaran, J. A review on the various processing parameters in FDM. Mater. Today Proc. 2020. [Google Scholar] [CrossRef]
- Bazan, P.; Mierzwinski, D.; Bogucki, R.; Kuciel, S. Bio-Based Polyethylene Composites with Natural Fiber: Mechanical, Thermal, and Ageing Properties. Materials 2020, 13, 2595. [Google Scholar] [CrossRef] [PubMed]
- Garzon-Hernandez, S.; Arias, A.; Garcia-Gonzalez, D. A continuum constitutive model for FDM 3D printed thermoplastics. Compos. Part B Eng. 2020, 201, 108373. [Google Scholar] [CrossRef]
- Cuiffo, M.; Snyder, J.; Elliott, A.; Romero, N.; Kannan, S.; Halada, G. Impact of the fused deposition (FDM) printing process on polylactic acid (PLA) chemistry and structure. Applied Sci. 2017, 7, 579. [Google Scholar] [CrossRef] [Green Version]
- Mazur, K.; Singh, R.; Friedrich, R.P.; Genç, H.; Unterweger, H.; Sałasińska, K.; Bogucki, R.; Kuciel, S.; Cicha, I. The Effect of Antibacterial Particle Incorporation on the Mechanical Properties, Biodegradability, and Biocompatibility of PLA and PHBV Composites. Macromol. Mater. Eng. 2020, 305. [Google Scholar] [CrossRef]
- Mazur, K.; Kuciel, S. Mechanical and hydrothermal aging behaviour of polyhydroxybutyrate-co-valerate (PHBV) composites reinforced by natural fibers. Molecules 2019, 24, 3458. [Google Scholar] [CrossRef] [Green Version]


| Parameters | Variant 1 | Variant 2 | Variant 3 | Variant 4 |
|---|---|---|---|---|
| Layer height [mm] | 0.5 | |||
| Bed temperature [°C] | 55 | |||
| Extruder temperature [°C] | 190 | |||
| Extrusion speed [mm/s] | 45 | |||
| Degree of infill [%] | 100 | |||
| Direction of print angle [°] | 45 | 85 | 70 | 50 |
| Index | Description | Density [g/cm3] | Specific Strength |
|---|---|---|---|
| 100 | 100% of infill | 1.2156 ± 0.0321 | 48.3 ± 0.4 |
| 100C | 100% of crystallized infill | 1.2253 ± 0.0222 | 53.9 ± 0.6 |
| 85 | 85% of infill | 1.1652 ± 0.0139 | 40.0 ± 0.2 |
| 85C | 85% of crystallized infill | 1.1655 ± 0.0092 | 45.9 ± 0.7 |
| 70 | 70% of infill | 0.9946 ± 0.0139 | 41.0 ± 0.6 |
| 70C | 70% of crystallized infill | 1.0101 ± 0.0065 | 48.2 ± 0.5 |
| 50 | 50% of infill | 0.8704 ± 0.0294 | 46.5 ± 0.8 |
| 50C | 50% of crystallized infill | 0.8767± 0.0118 | 48.5 ± 0.3 |
| σz [MPa] | Ez[MPa] | εz[%] | σg [MPa] | Eg[MPa] | εg[%] | |||||||
|---|---|---|---|---|---|---|---|---|---|---|---|---|
| P | C | P | C | P | C | P | C | P | C | P | C | |
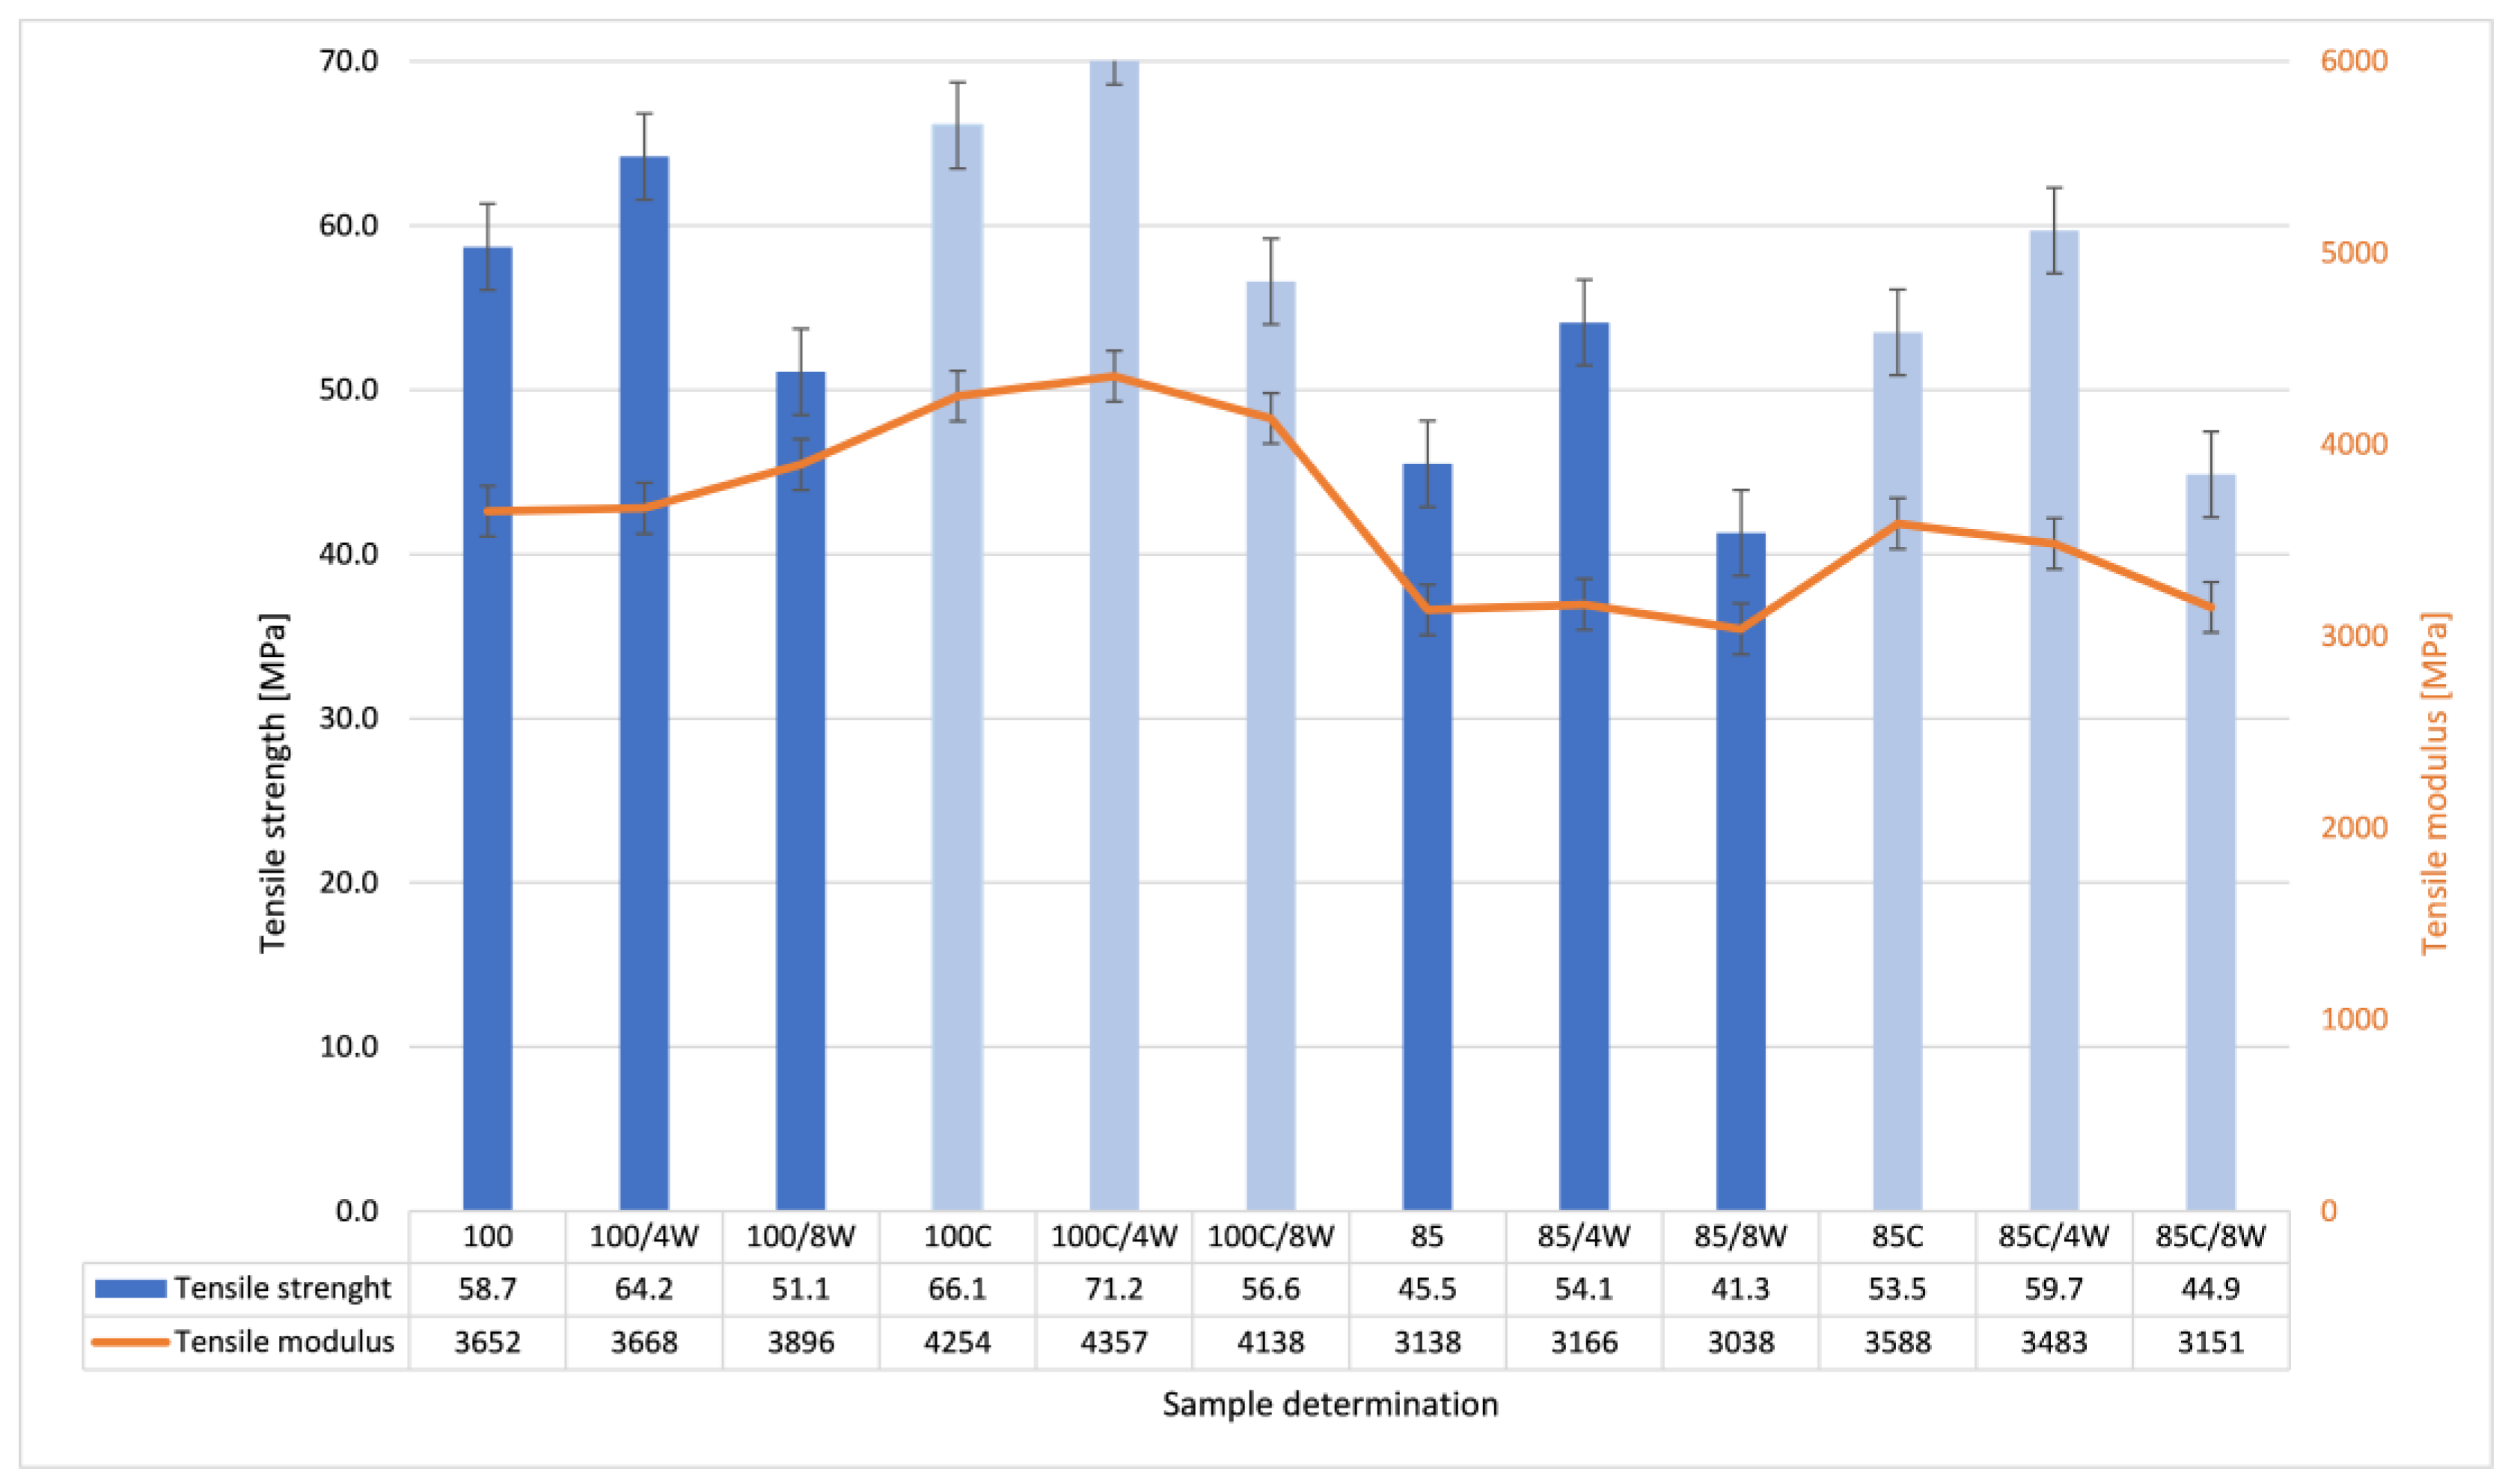
| PLA 100 | 64.2±0.4 | 66.1±0.3 | 3668±121 | 4254±210 | 2.2±0.2 | 1.9±0.3 | 118.9±0.4 | 119.1±0.3 | 3487±78 | 3526±131 | 5.2±0.5 | 7.4±0.2 |
| PLA 85 | 54.1±0.2 | 53.5±0.4 | 3466±132 | 3588±195 | 2.5±0.3 | 2.1±0.5 | 102.5±0.3 | 101.5±0.2 | 3279±104 | 3305±101 | 6.1±0.4 | 5.9±0.3 |
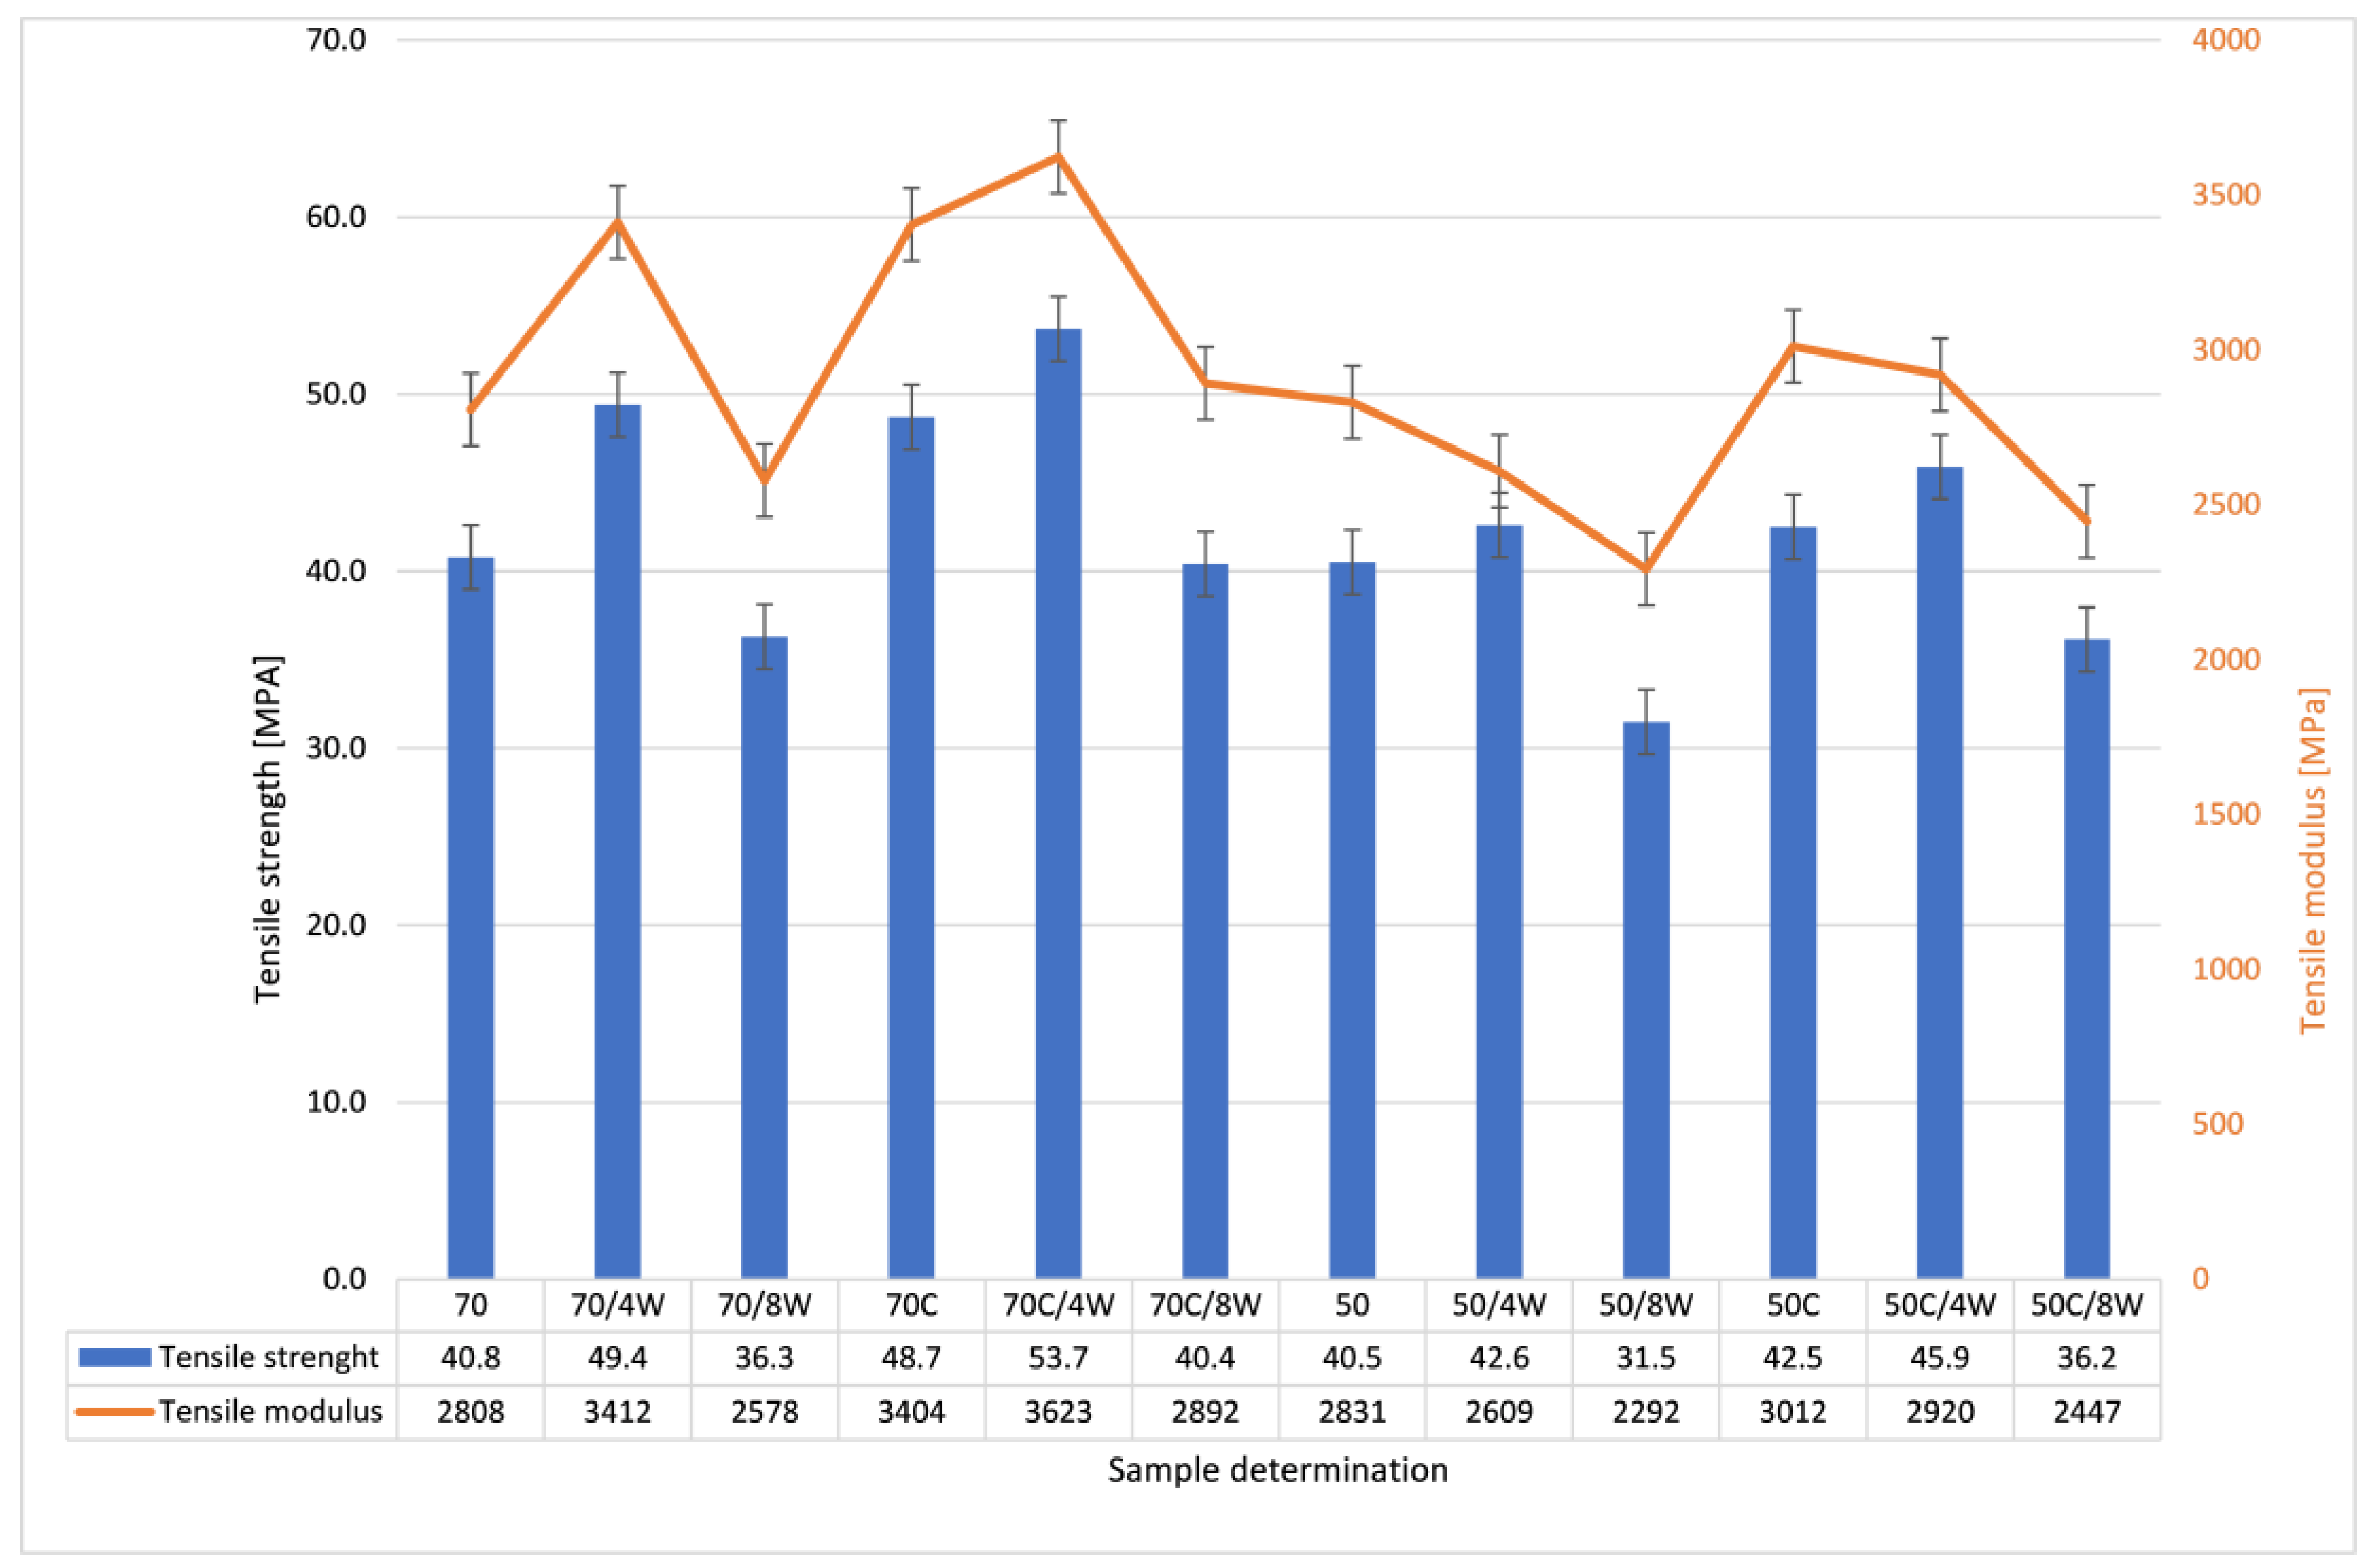
| PLA 70 | 49.4±0.4 | 48.7±0.5 | 3412±129 | 3404±187 | 2.1±0.5 | 2.0±0.2 | 95.7±0.1 | 95.6±0.6 | 3138±109 | 3096±89 | 5.2±0.3 | 5.0±0.2 |
| PLA 50 | 42.6±0.3 | 42.5±0.6 | 2609±147 | 2920±217 | 2.4±0.4 | 2.2±0.6 | 89.8±0.4 | 81.2±0.2 | 2903±119 | 2980±108 | 5.6±0.1 | 5.5±0.2 |
| Types of Samples | Samples before Crystallization | Samples after Crystallization |
|---|---|---|
| Values of melting enthalpy [J/g] | 19.23 | 20.42 |
| Values of crystallinity [%] | 17.48 | 18.57 |
Publisher’s Note: MDPI stays neutral with regard to jurisdictional claims in published maps and institutional affiliations. |
© 2020 by the authors. Licensee MDPI, Basel, Switzerland. This article is an open access article distributed under the terms and conditions of the Creative Commons Attribution (CC BY) license (http://creativecommons.org/licenses/by/4.0/).
Share and Cite
Gaweł, A.; Kuciel, S. The Study of Physico-Mechanical Properties of Polylactide Composites with Different Level of Infill Produced by the FDM Method. Polymers 2020, 12, 3056. https://doi.org/10.3390/polym12123056
Gaweł A, Kuciel S. The Study of Physico-Mechanical Properties of Polylactide Composites with Different Level of Infill Produced by the FDM Method. Polymers. 2020; 12(12):3056. https://doi.org/10.3390/polym12123056
Chicago/Turabian StyleGaweł, Anna, and Stanisław Kuciel. 2020. "The Study of Physico-Mechanical Properties of Polylactide Composites with Different Level of Infill Produced by the FDM Method" Polymers 12, no. 12: 3056. https://doi.org/10.3390/polym12123056