Flexural Properties and Microstructure Mechanisms of Renewable Coir-Fiber-Reinforced Magnesium Phosphate Cement-Based Composite Considering Curing Ages


Abstract
1. Introduction
2. Experimental Programs
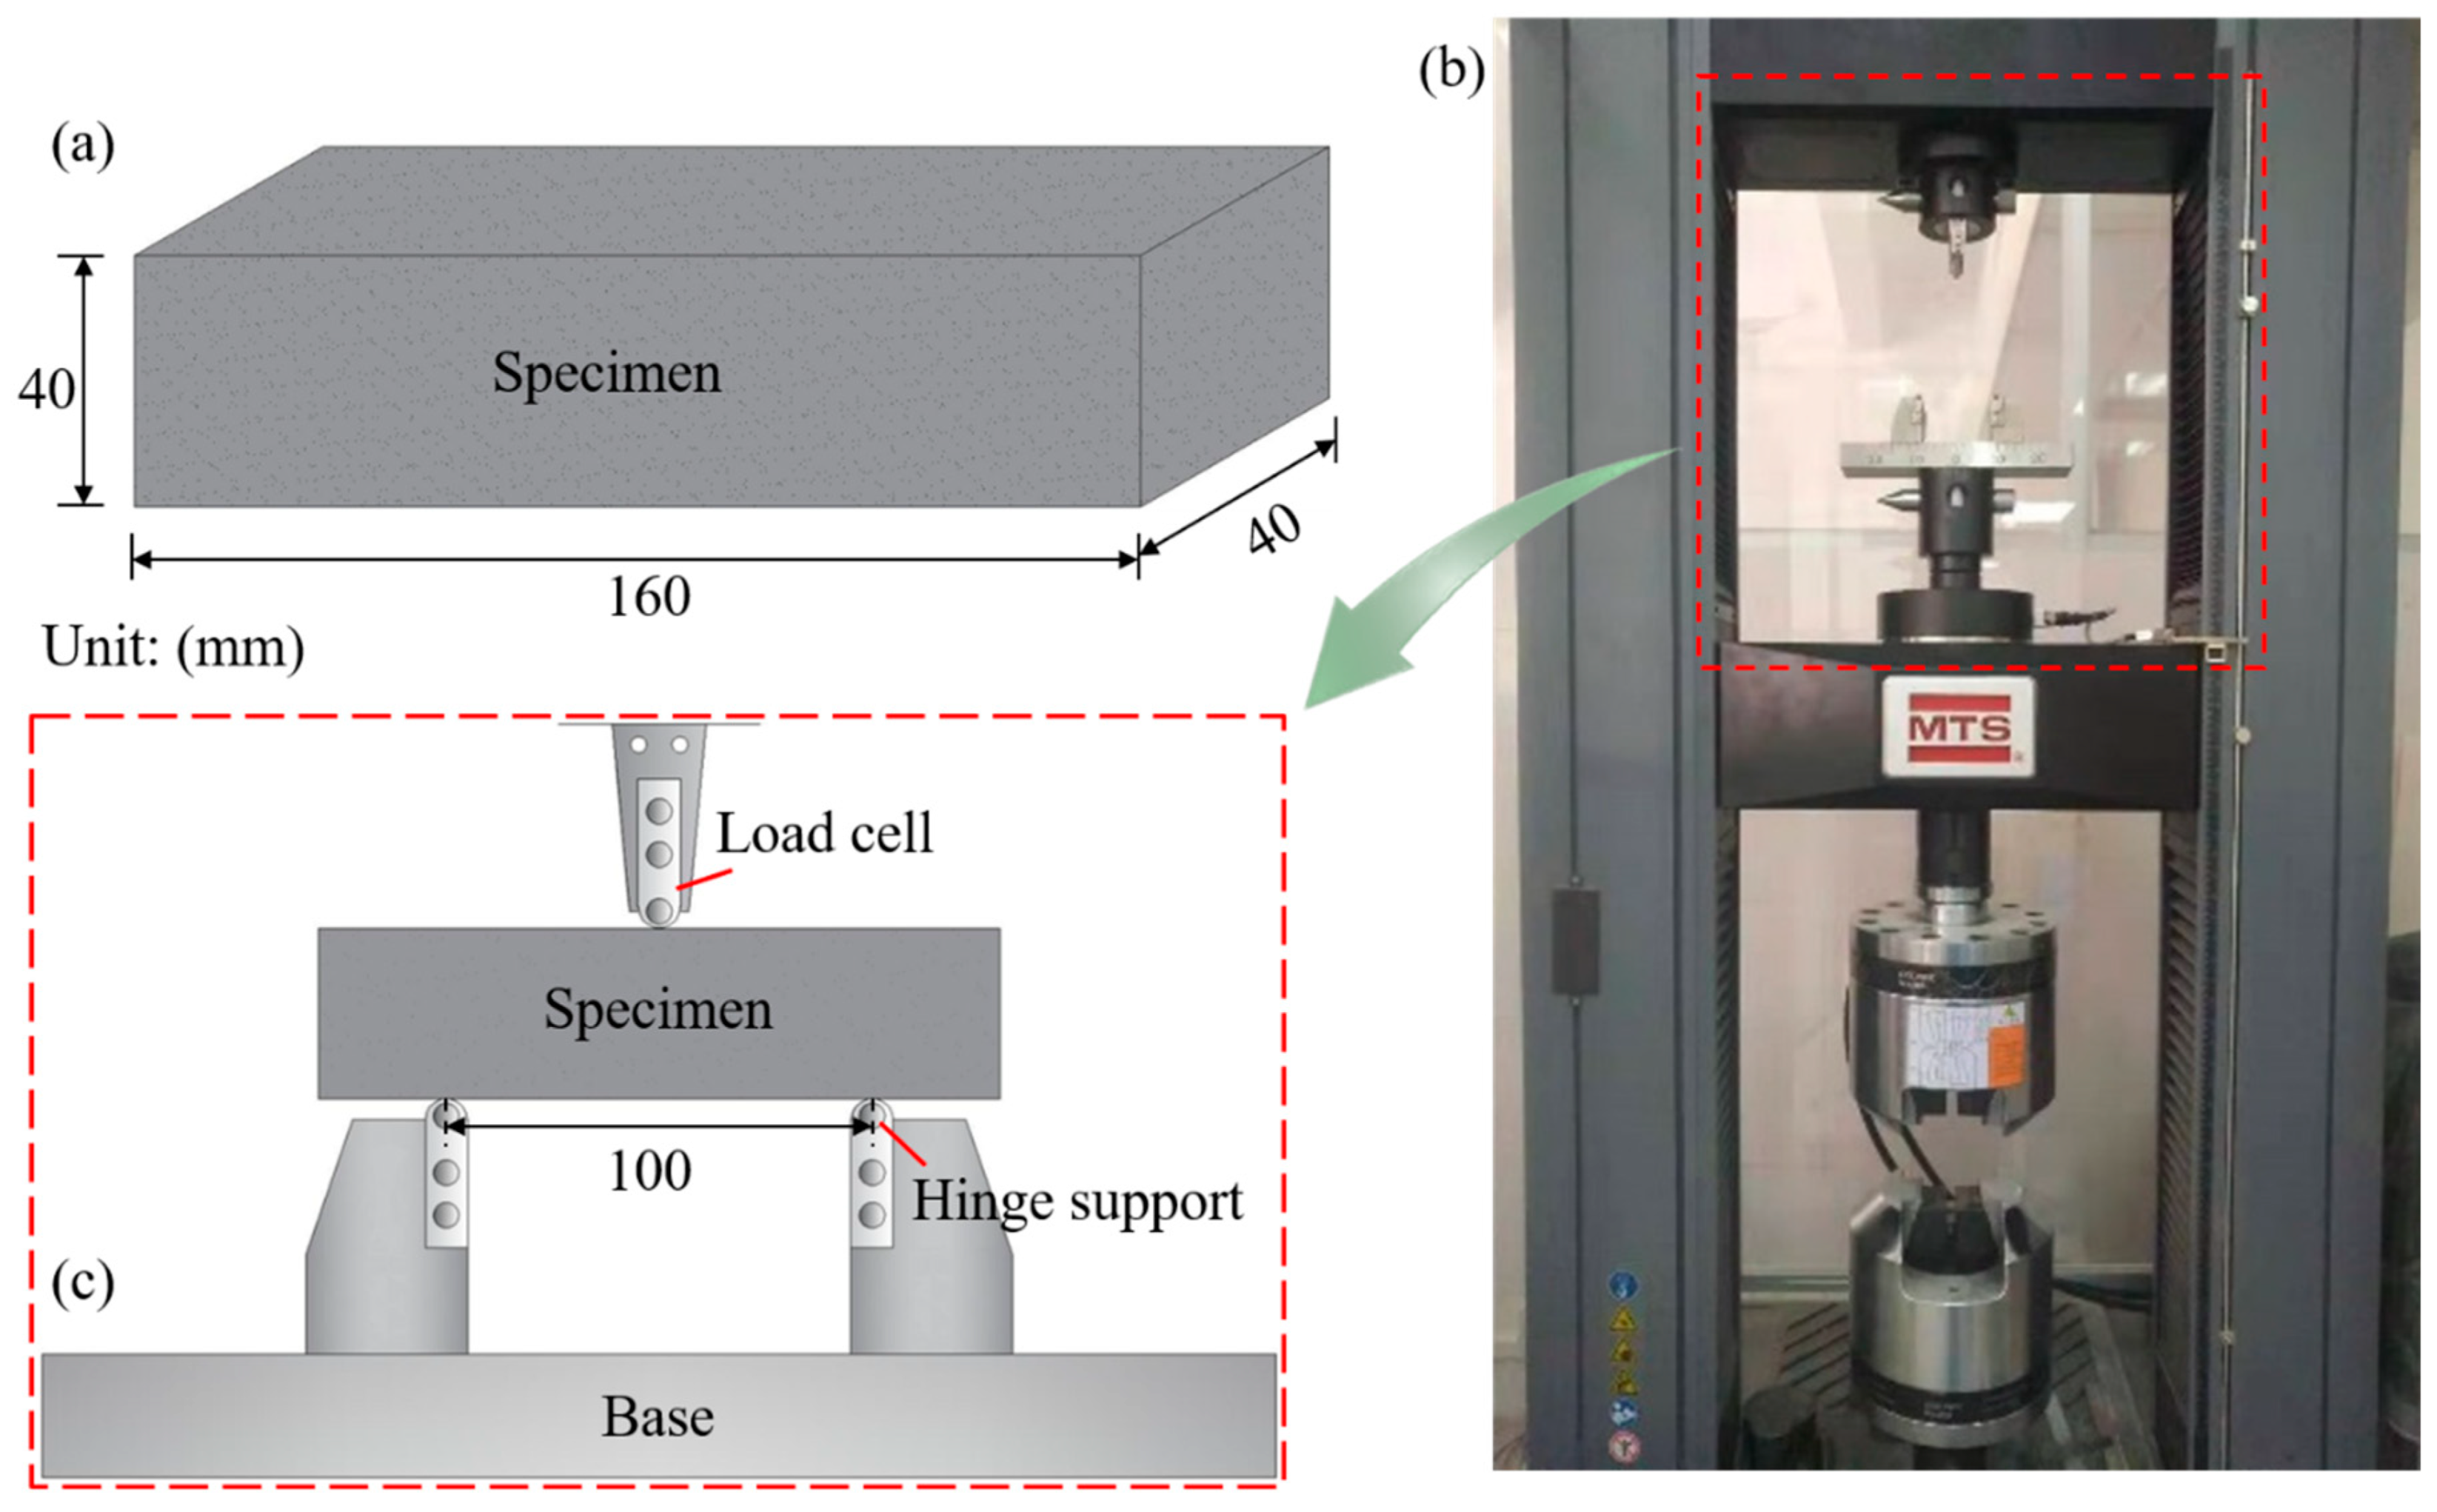
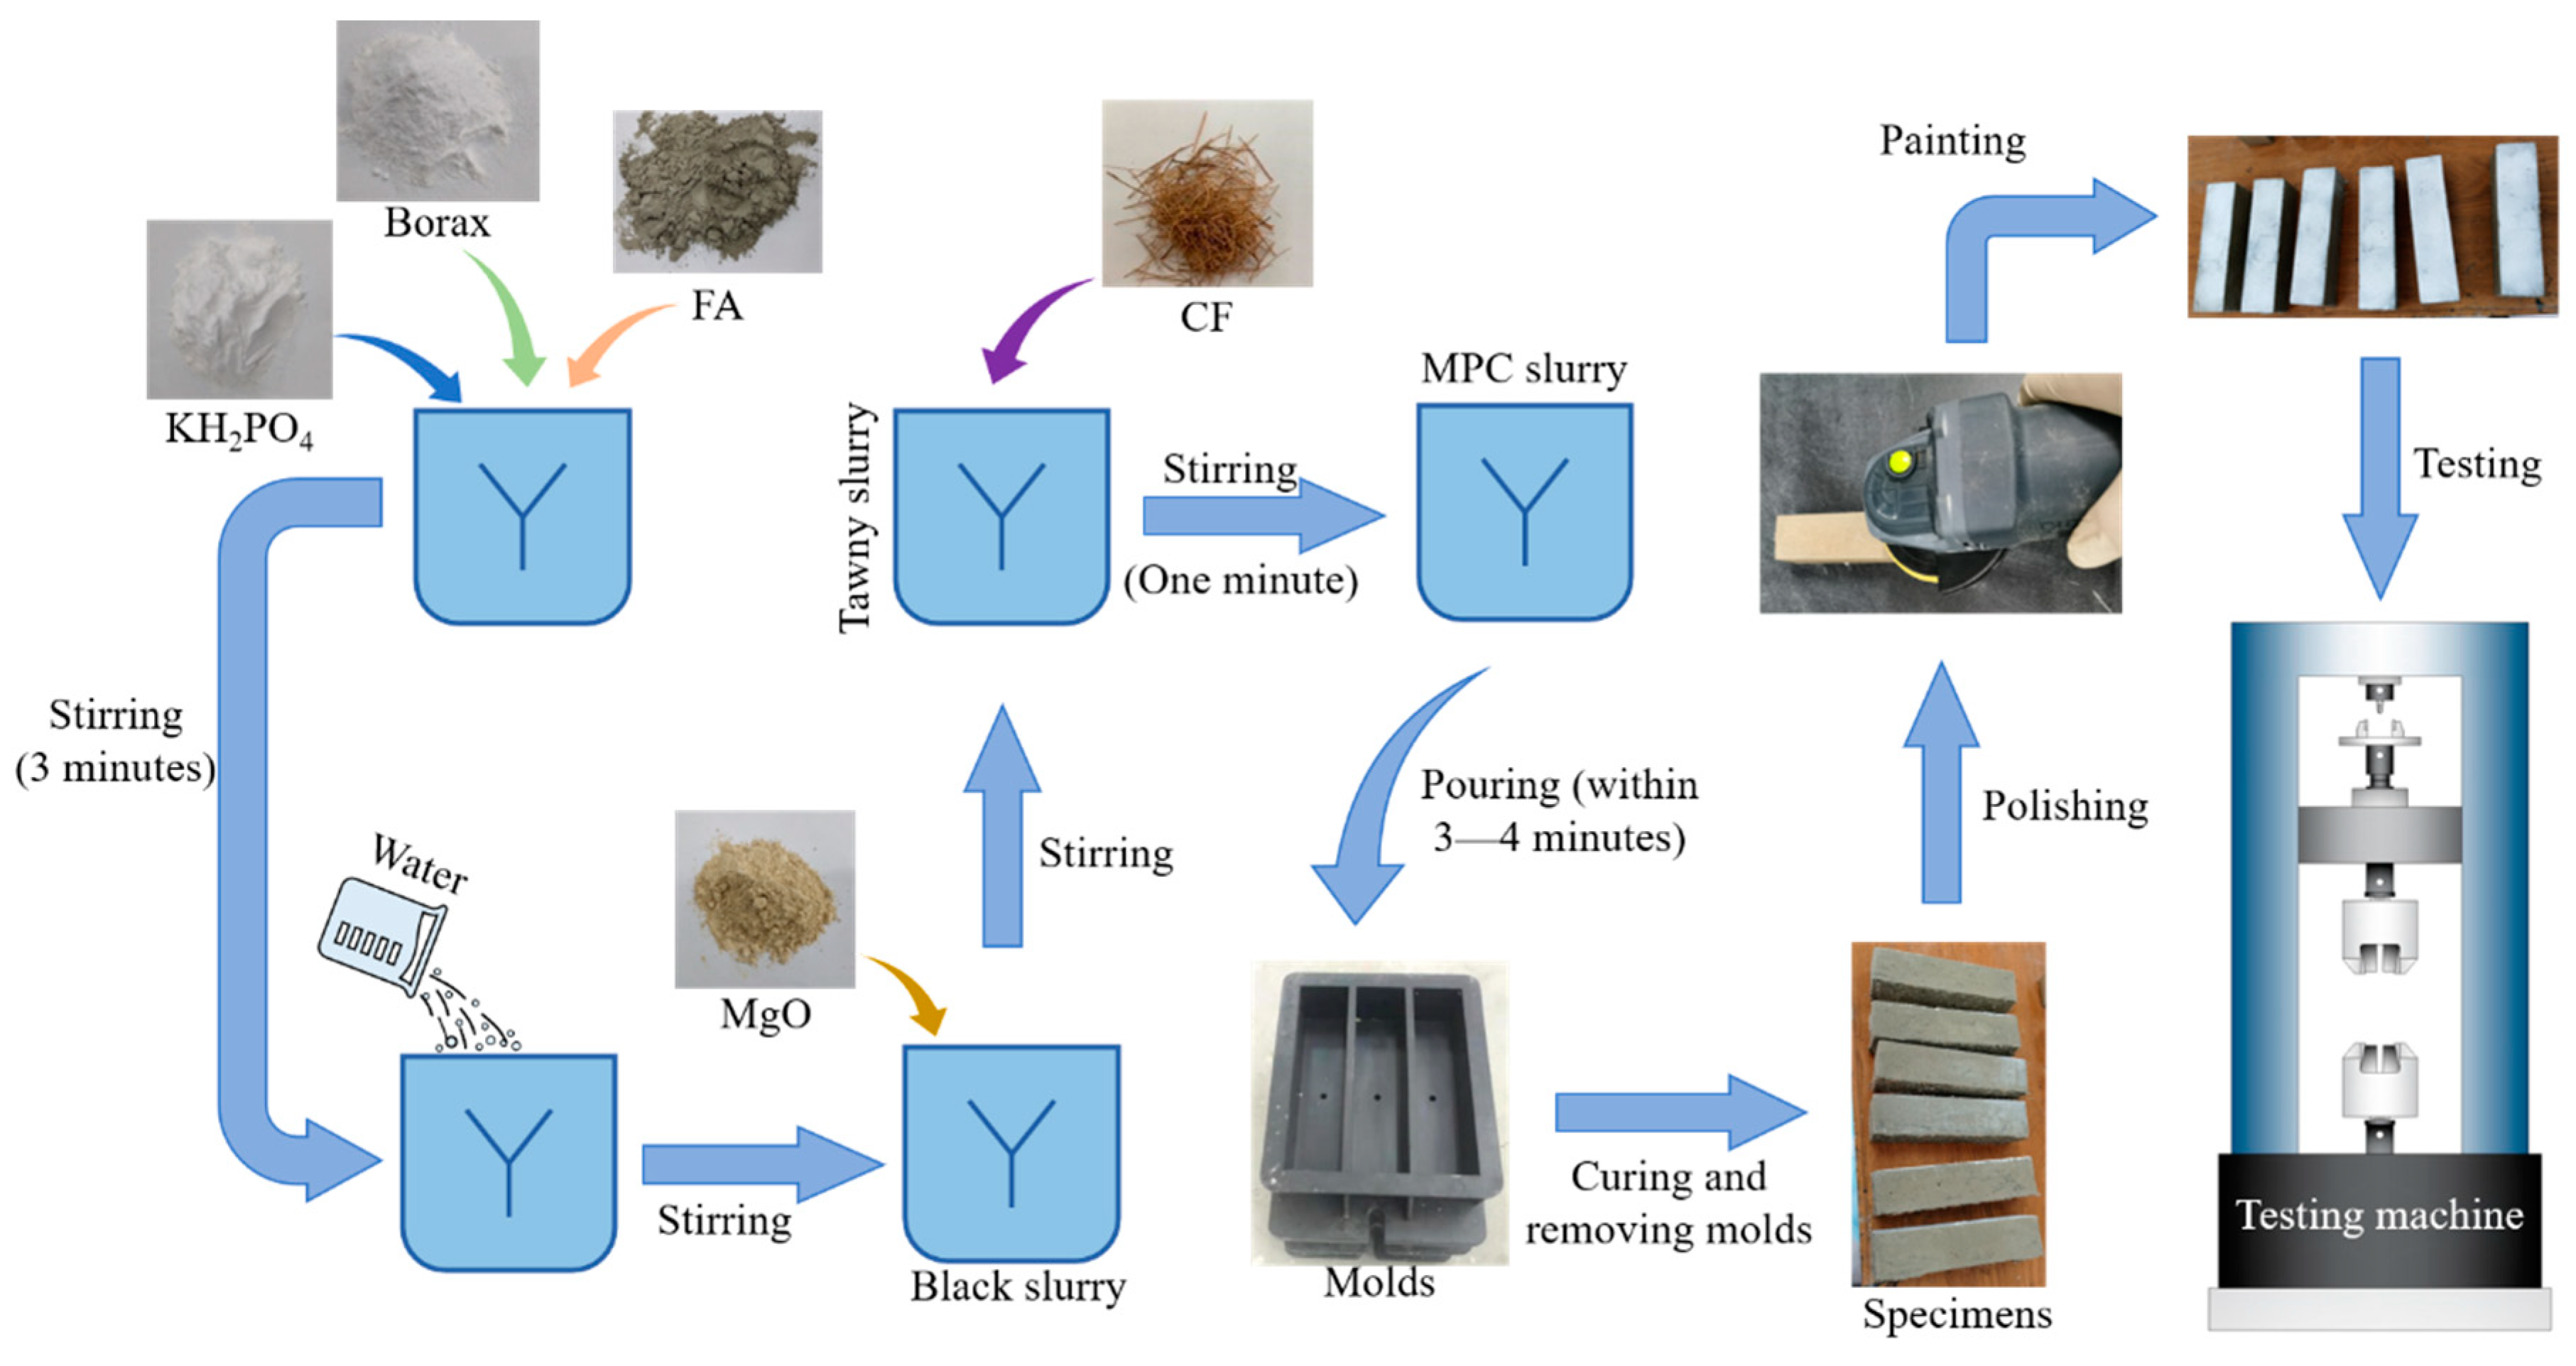
2.1. Test Specimens
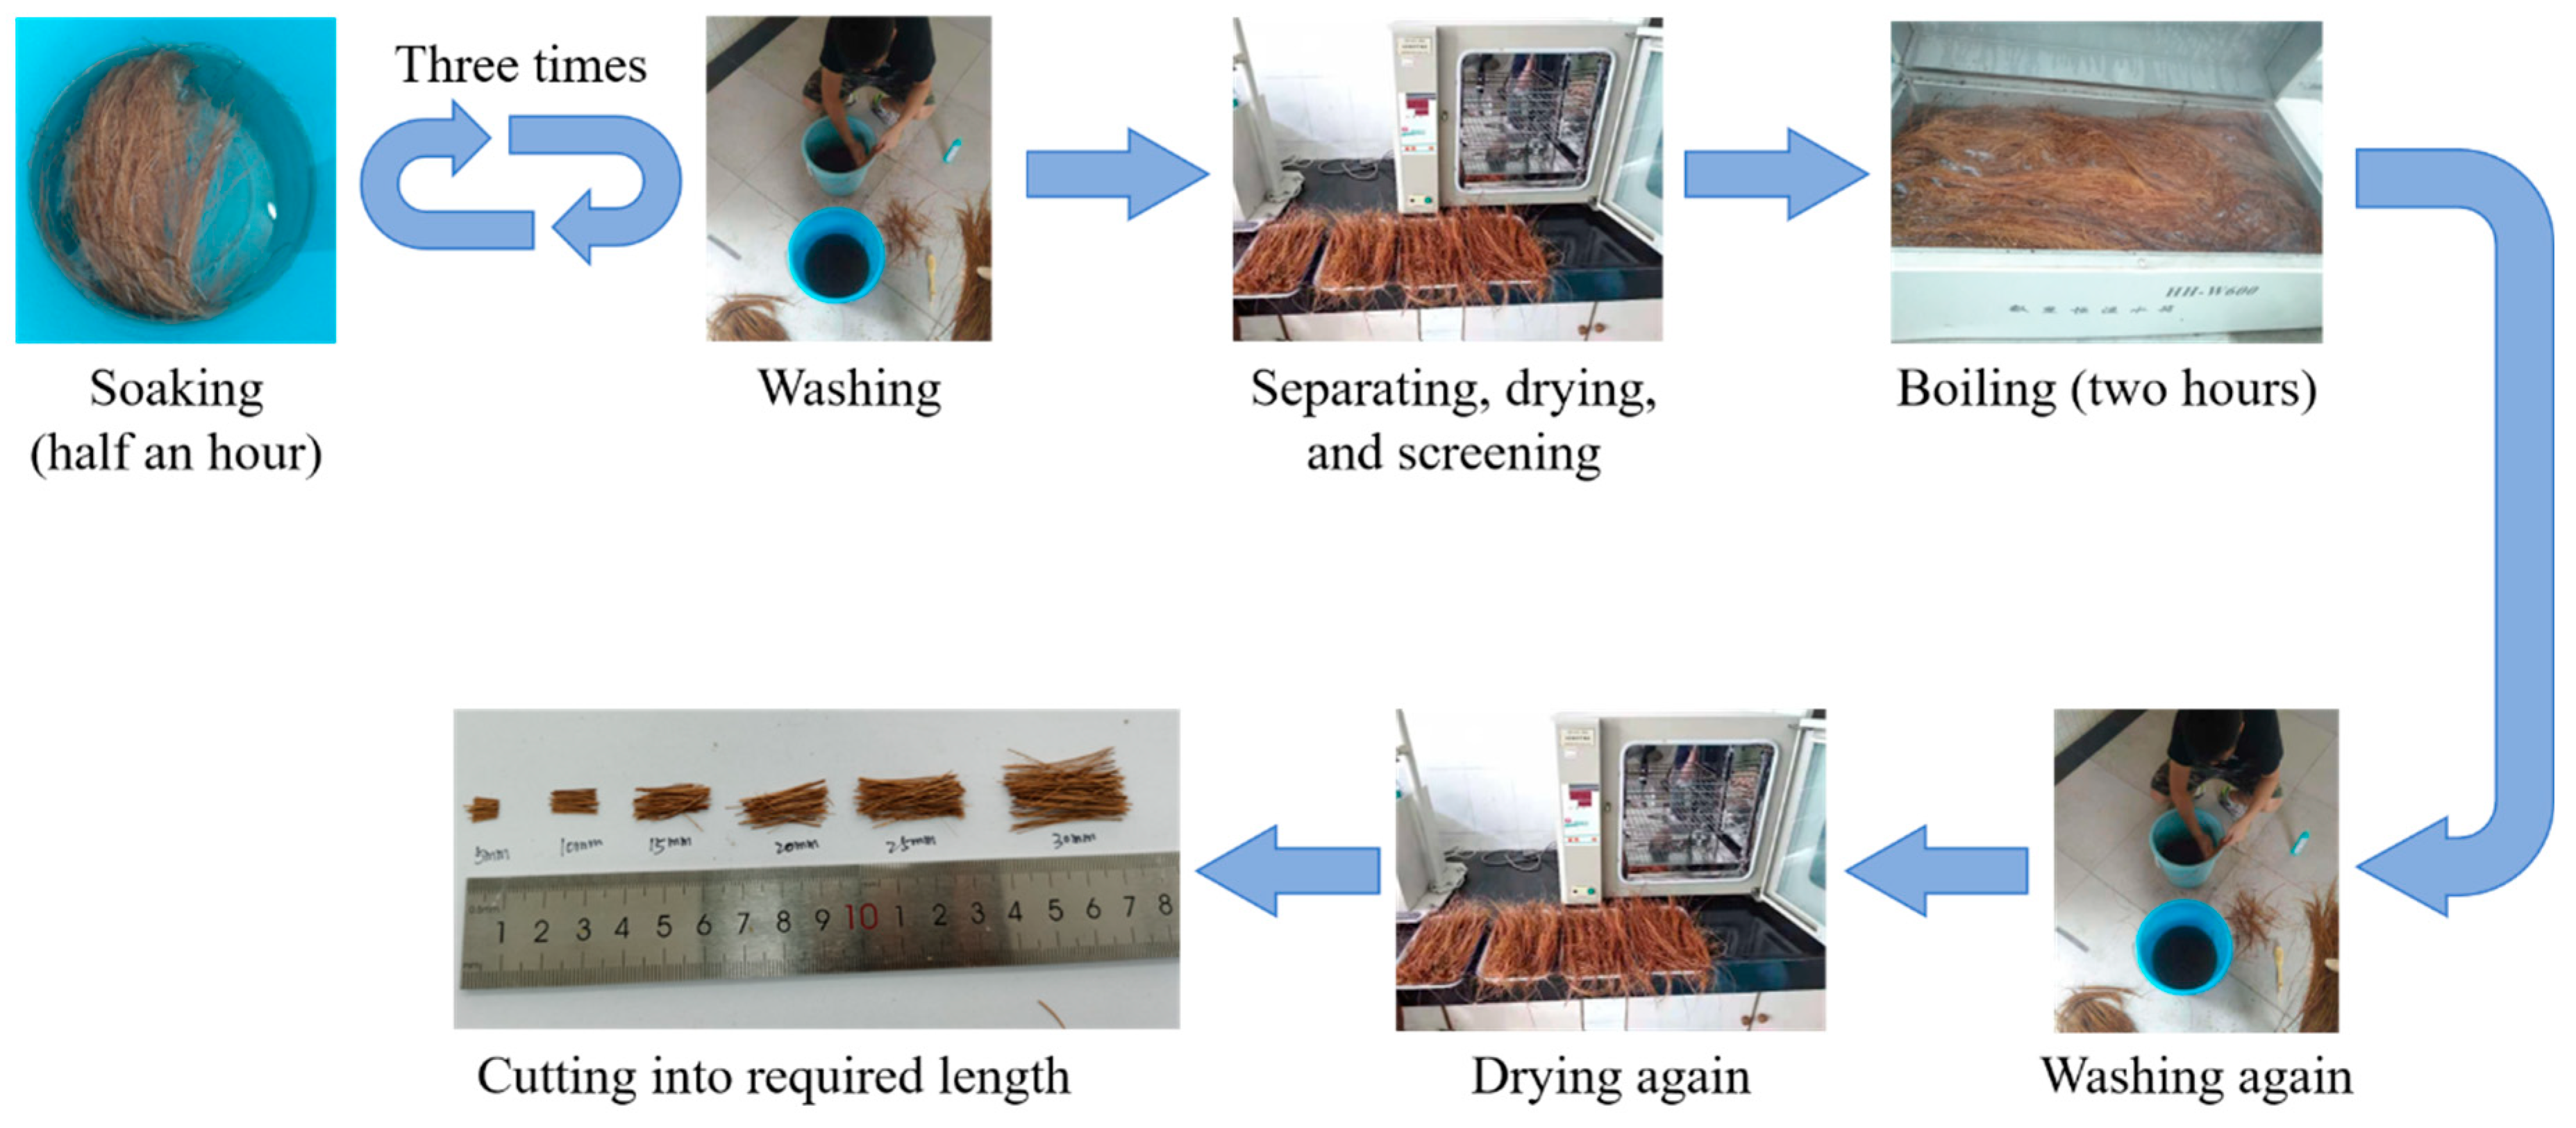
2.2. Material Properties
2.3. Test Setup
3. Results and Discussion
3.1. General
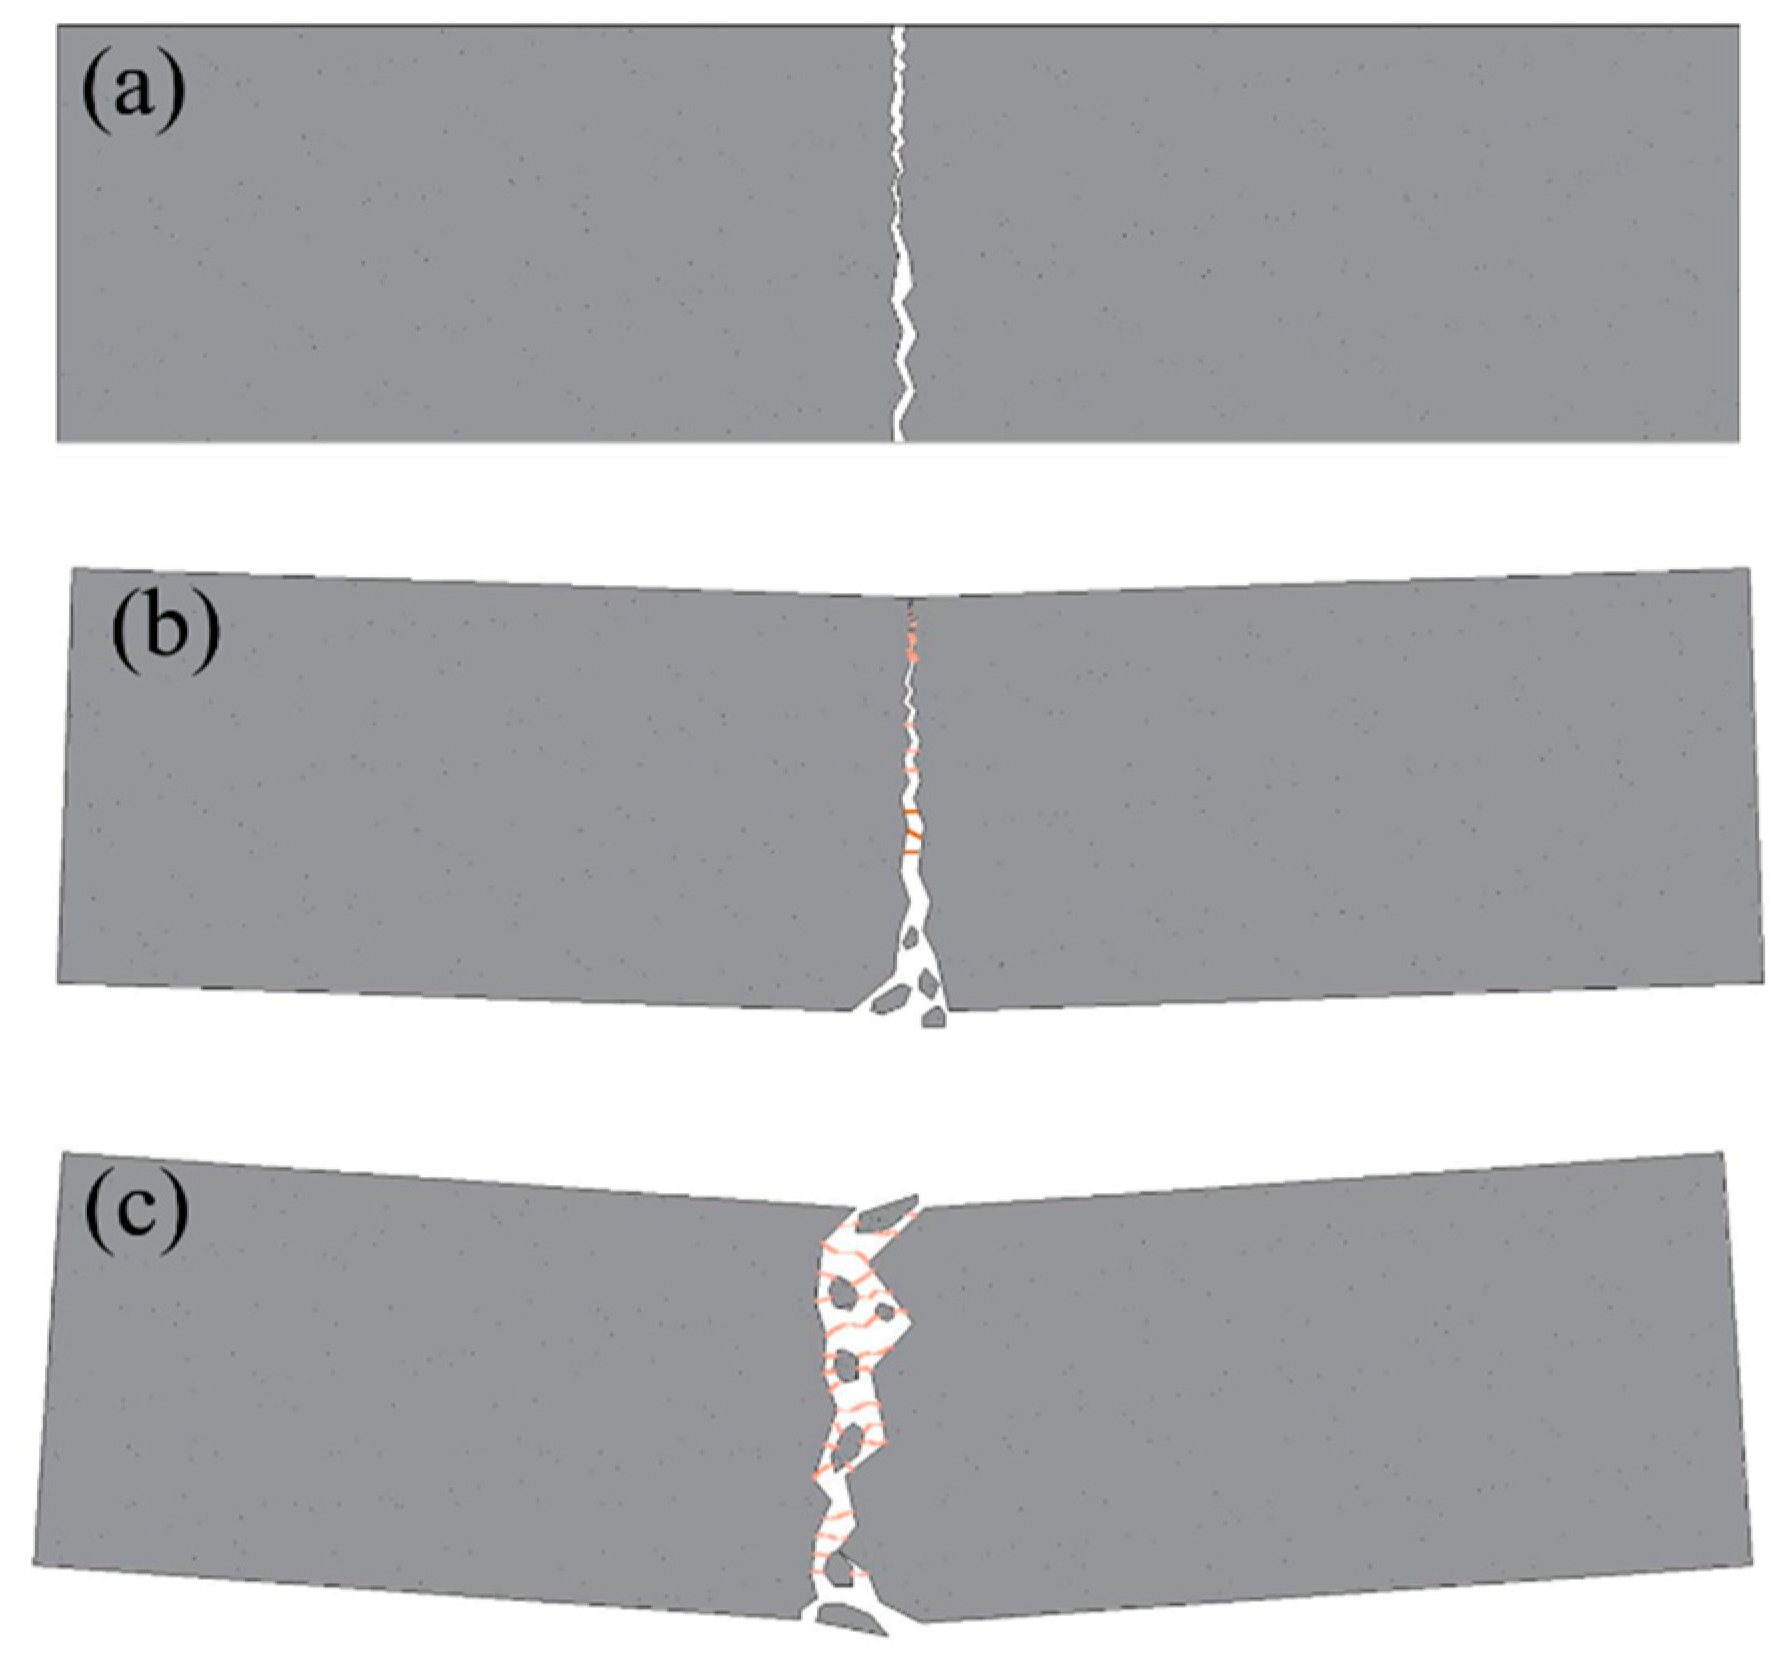
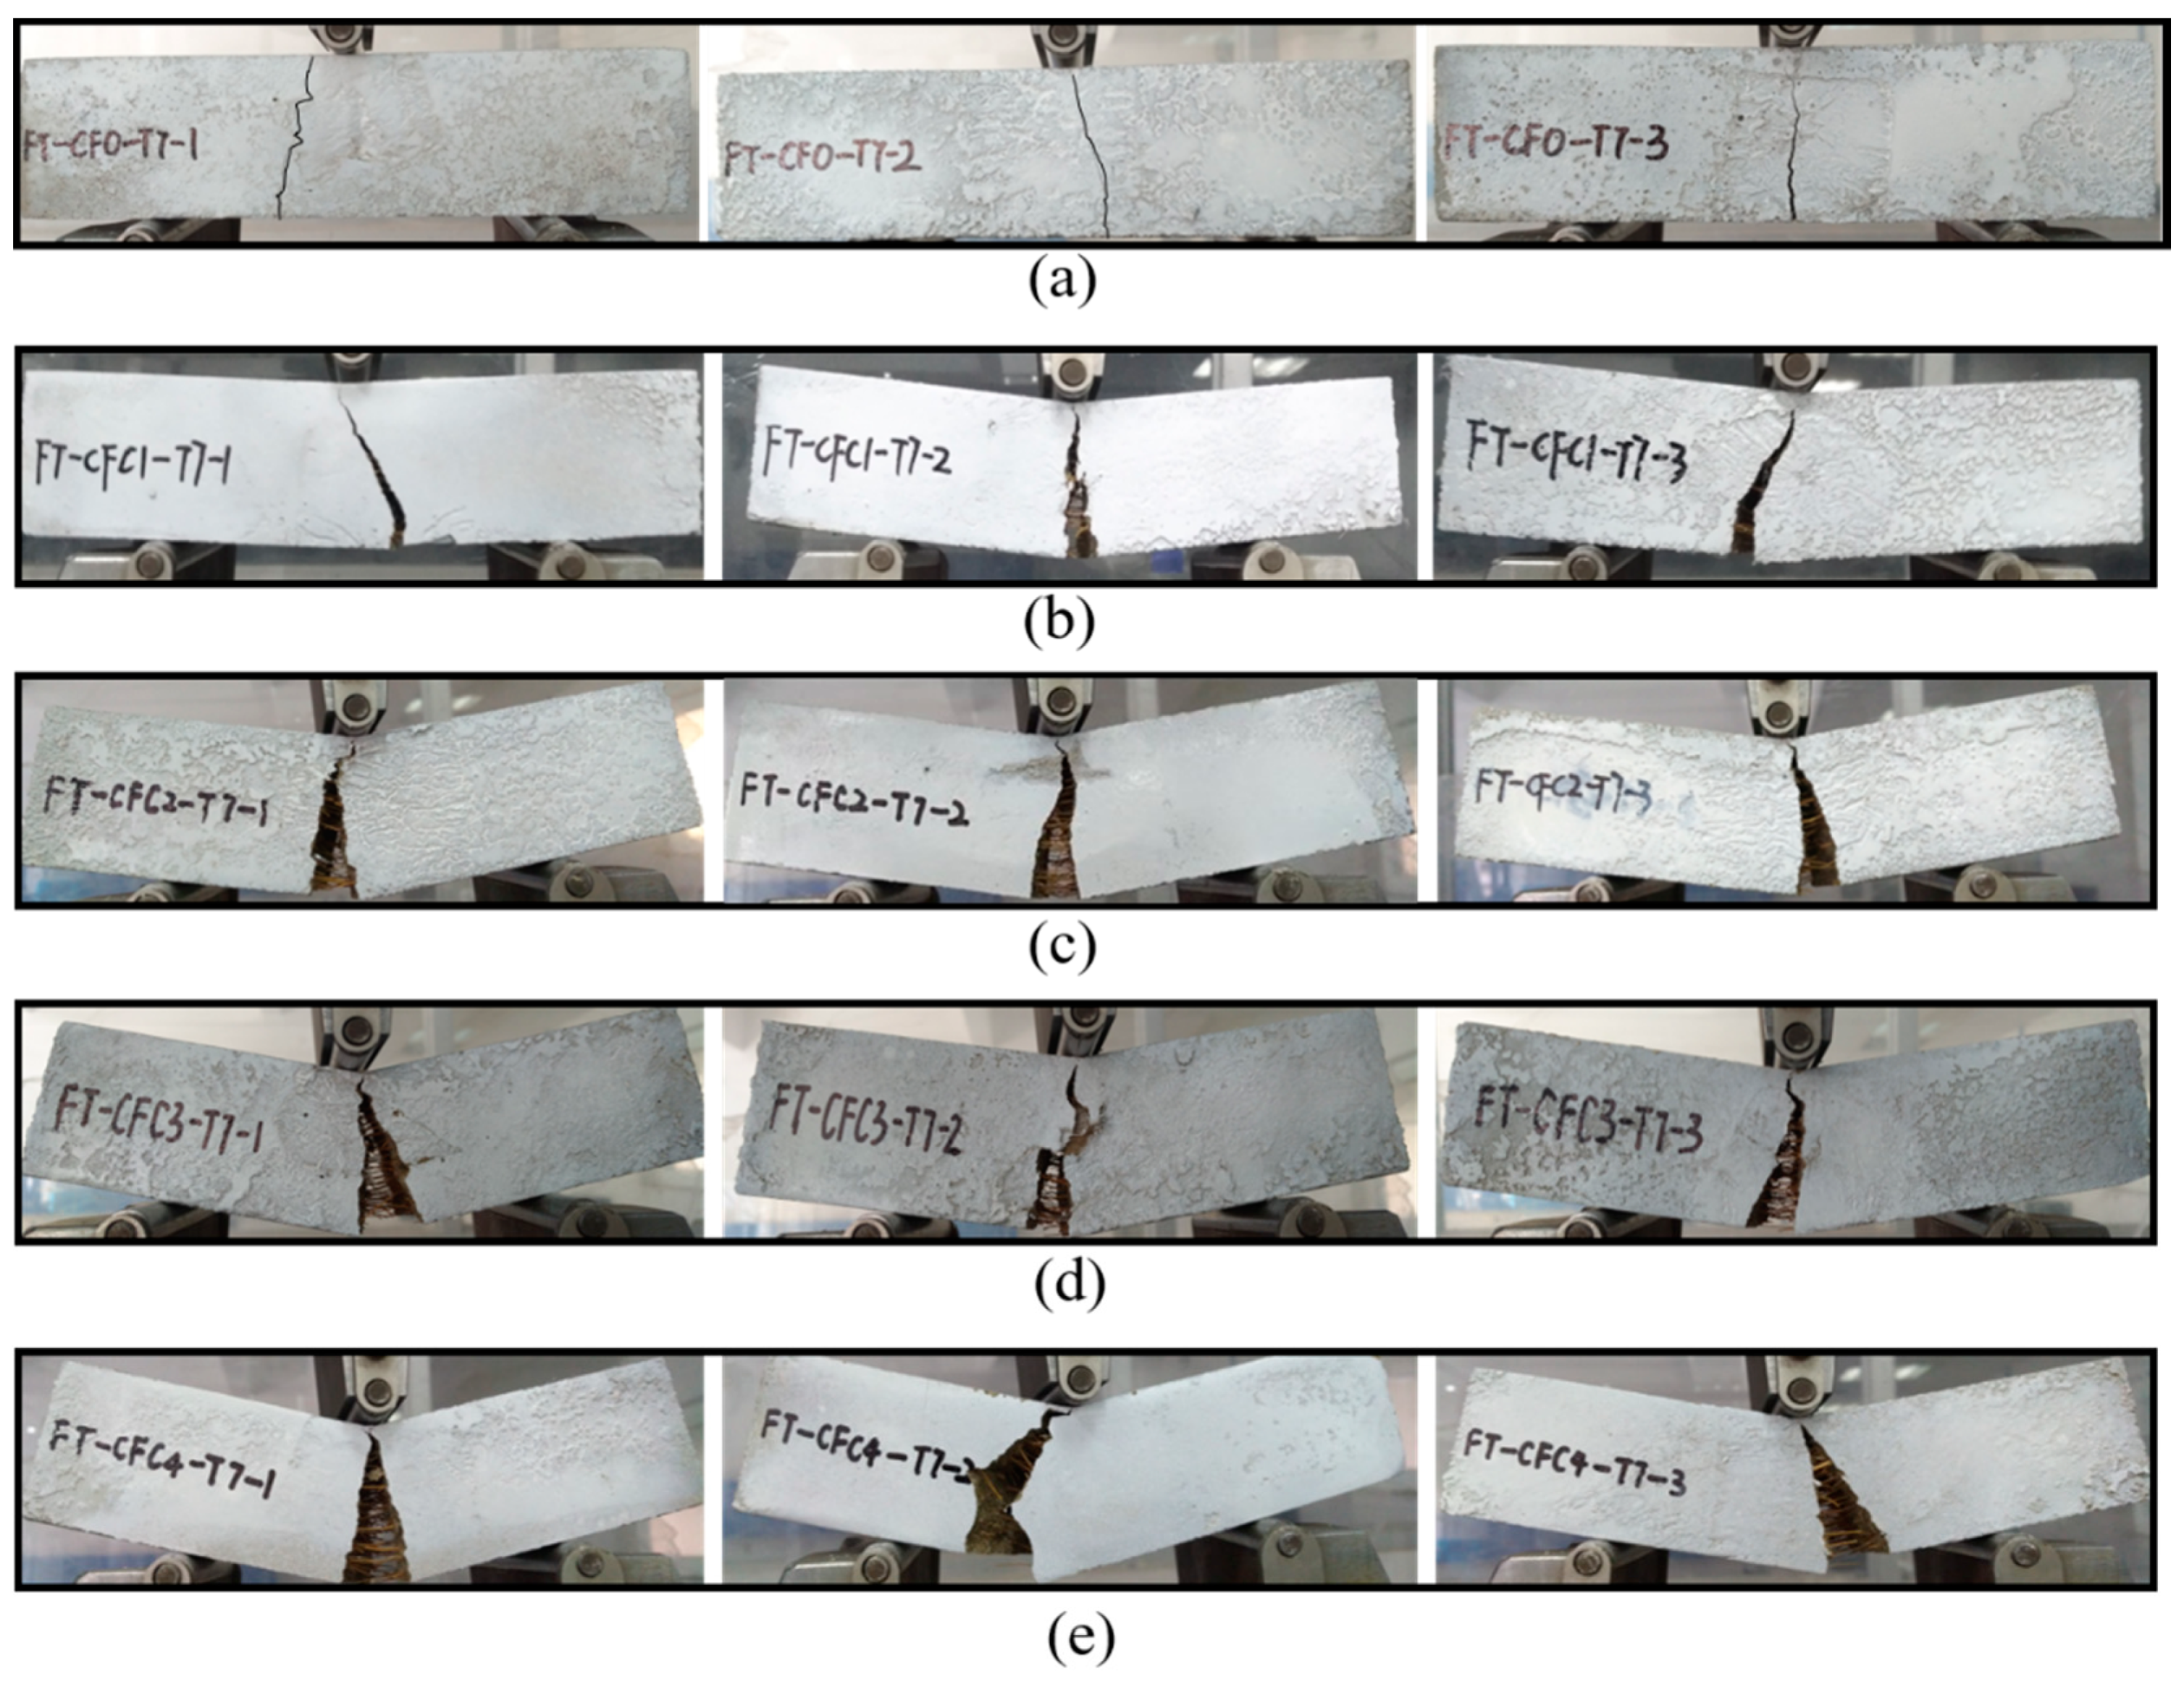
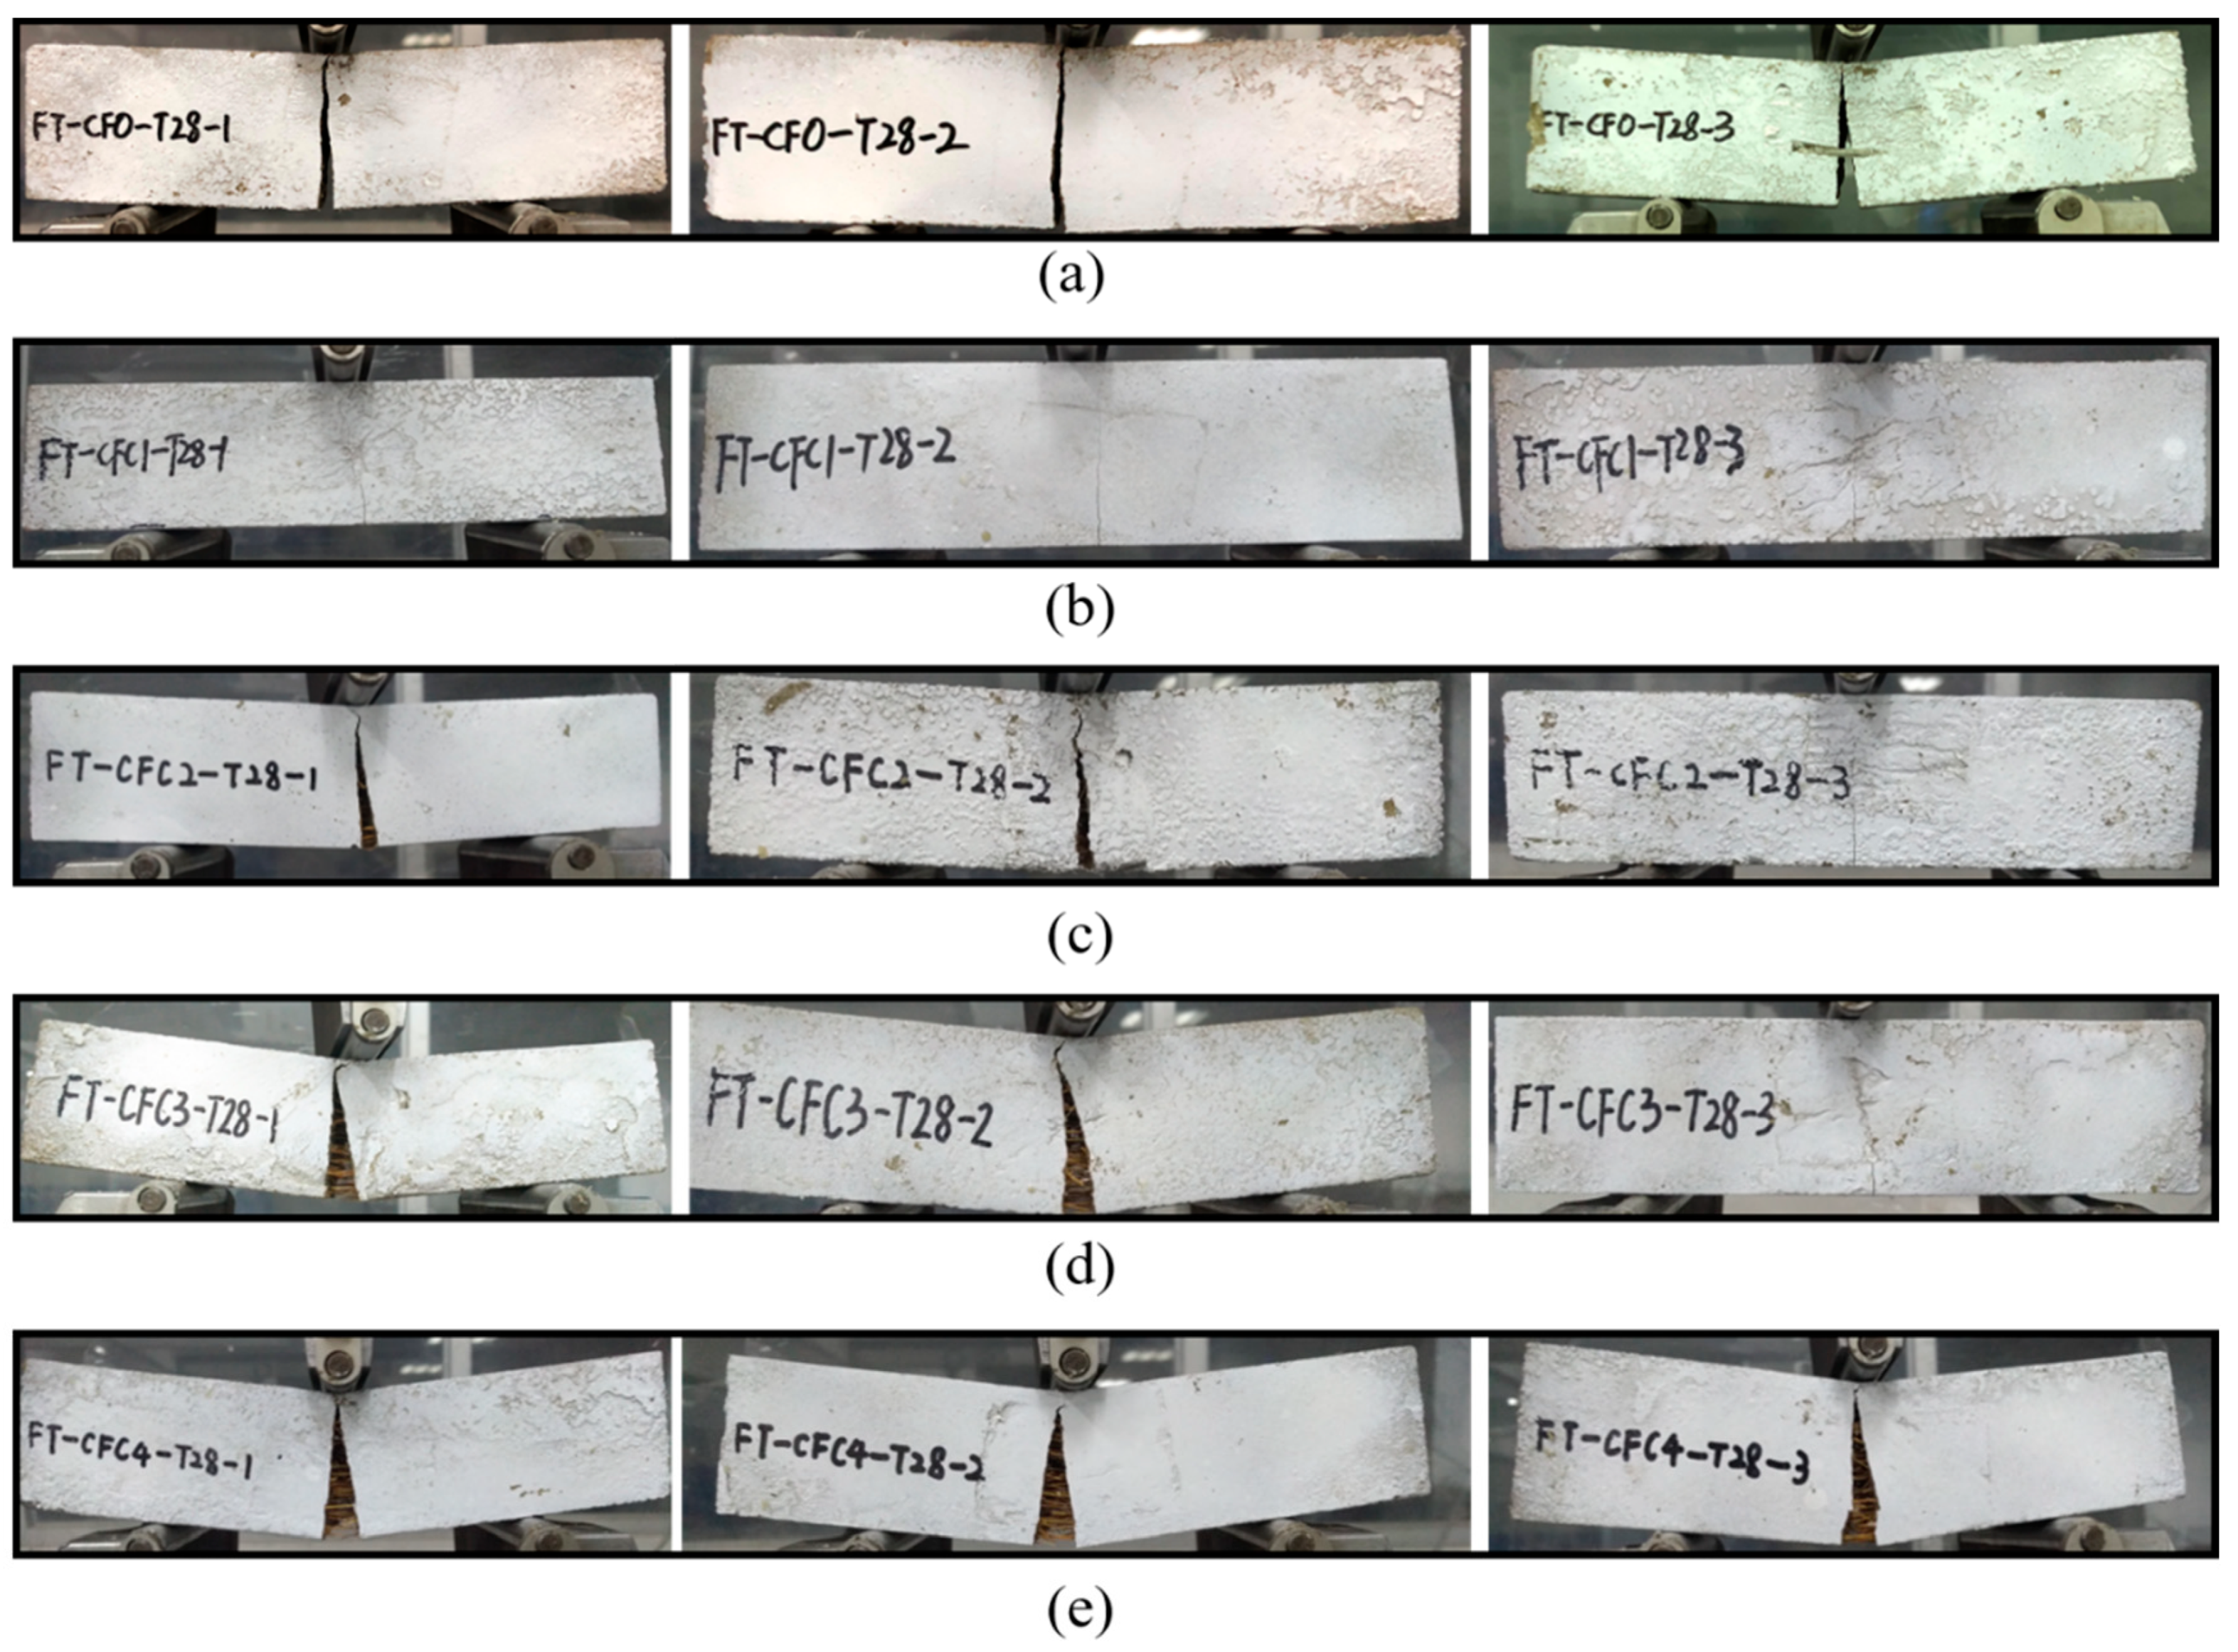
3.2. Failure Modes
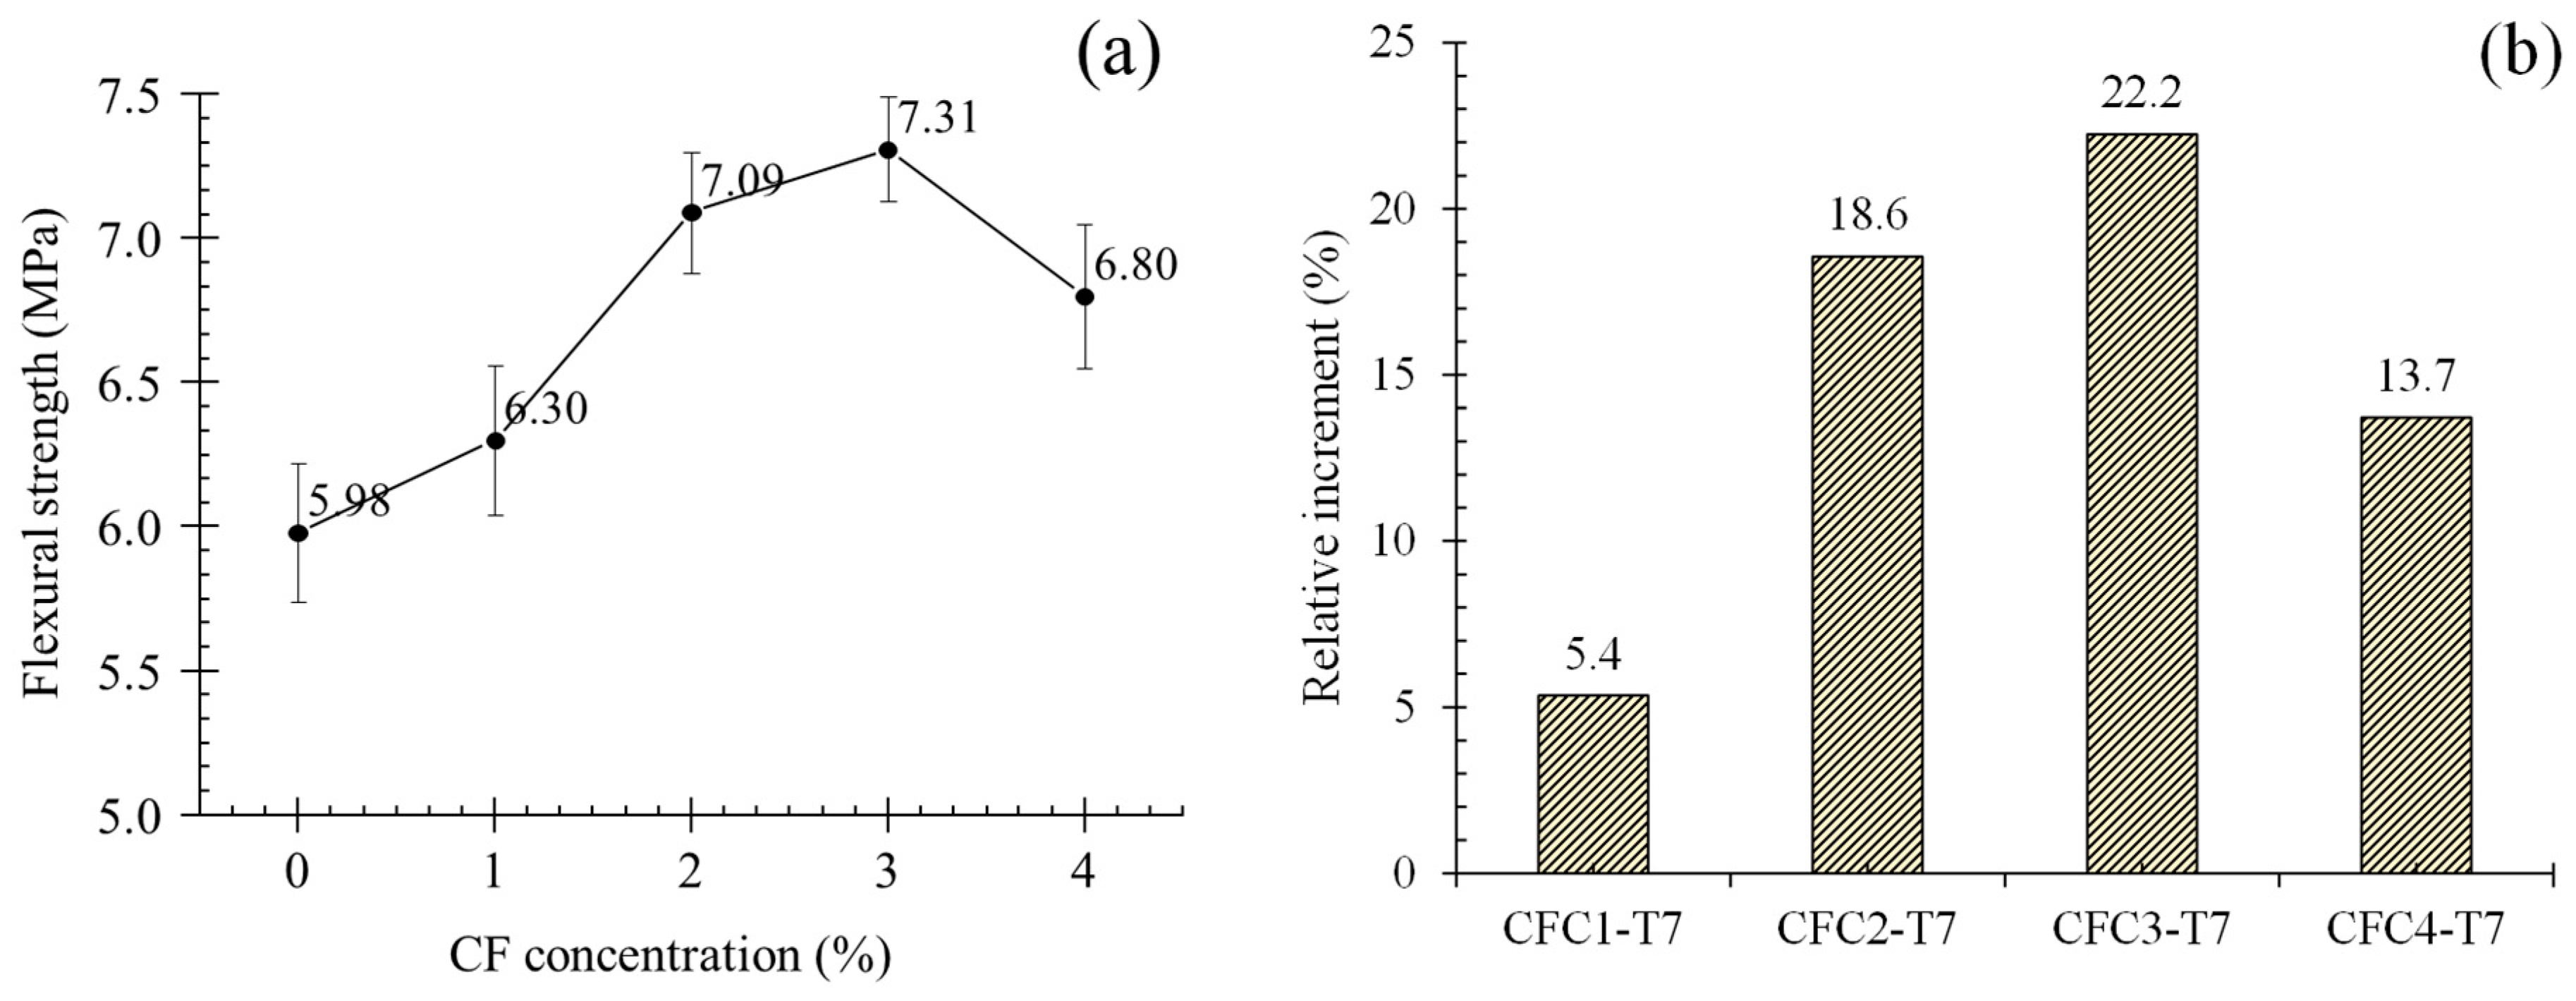
3.3. Flexural Strength
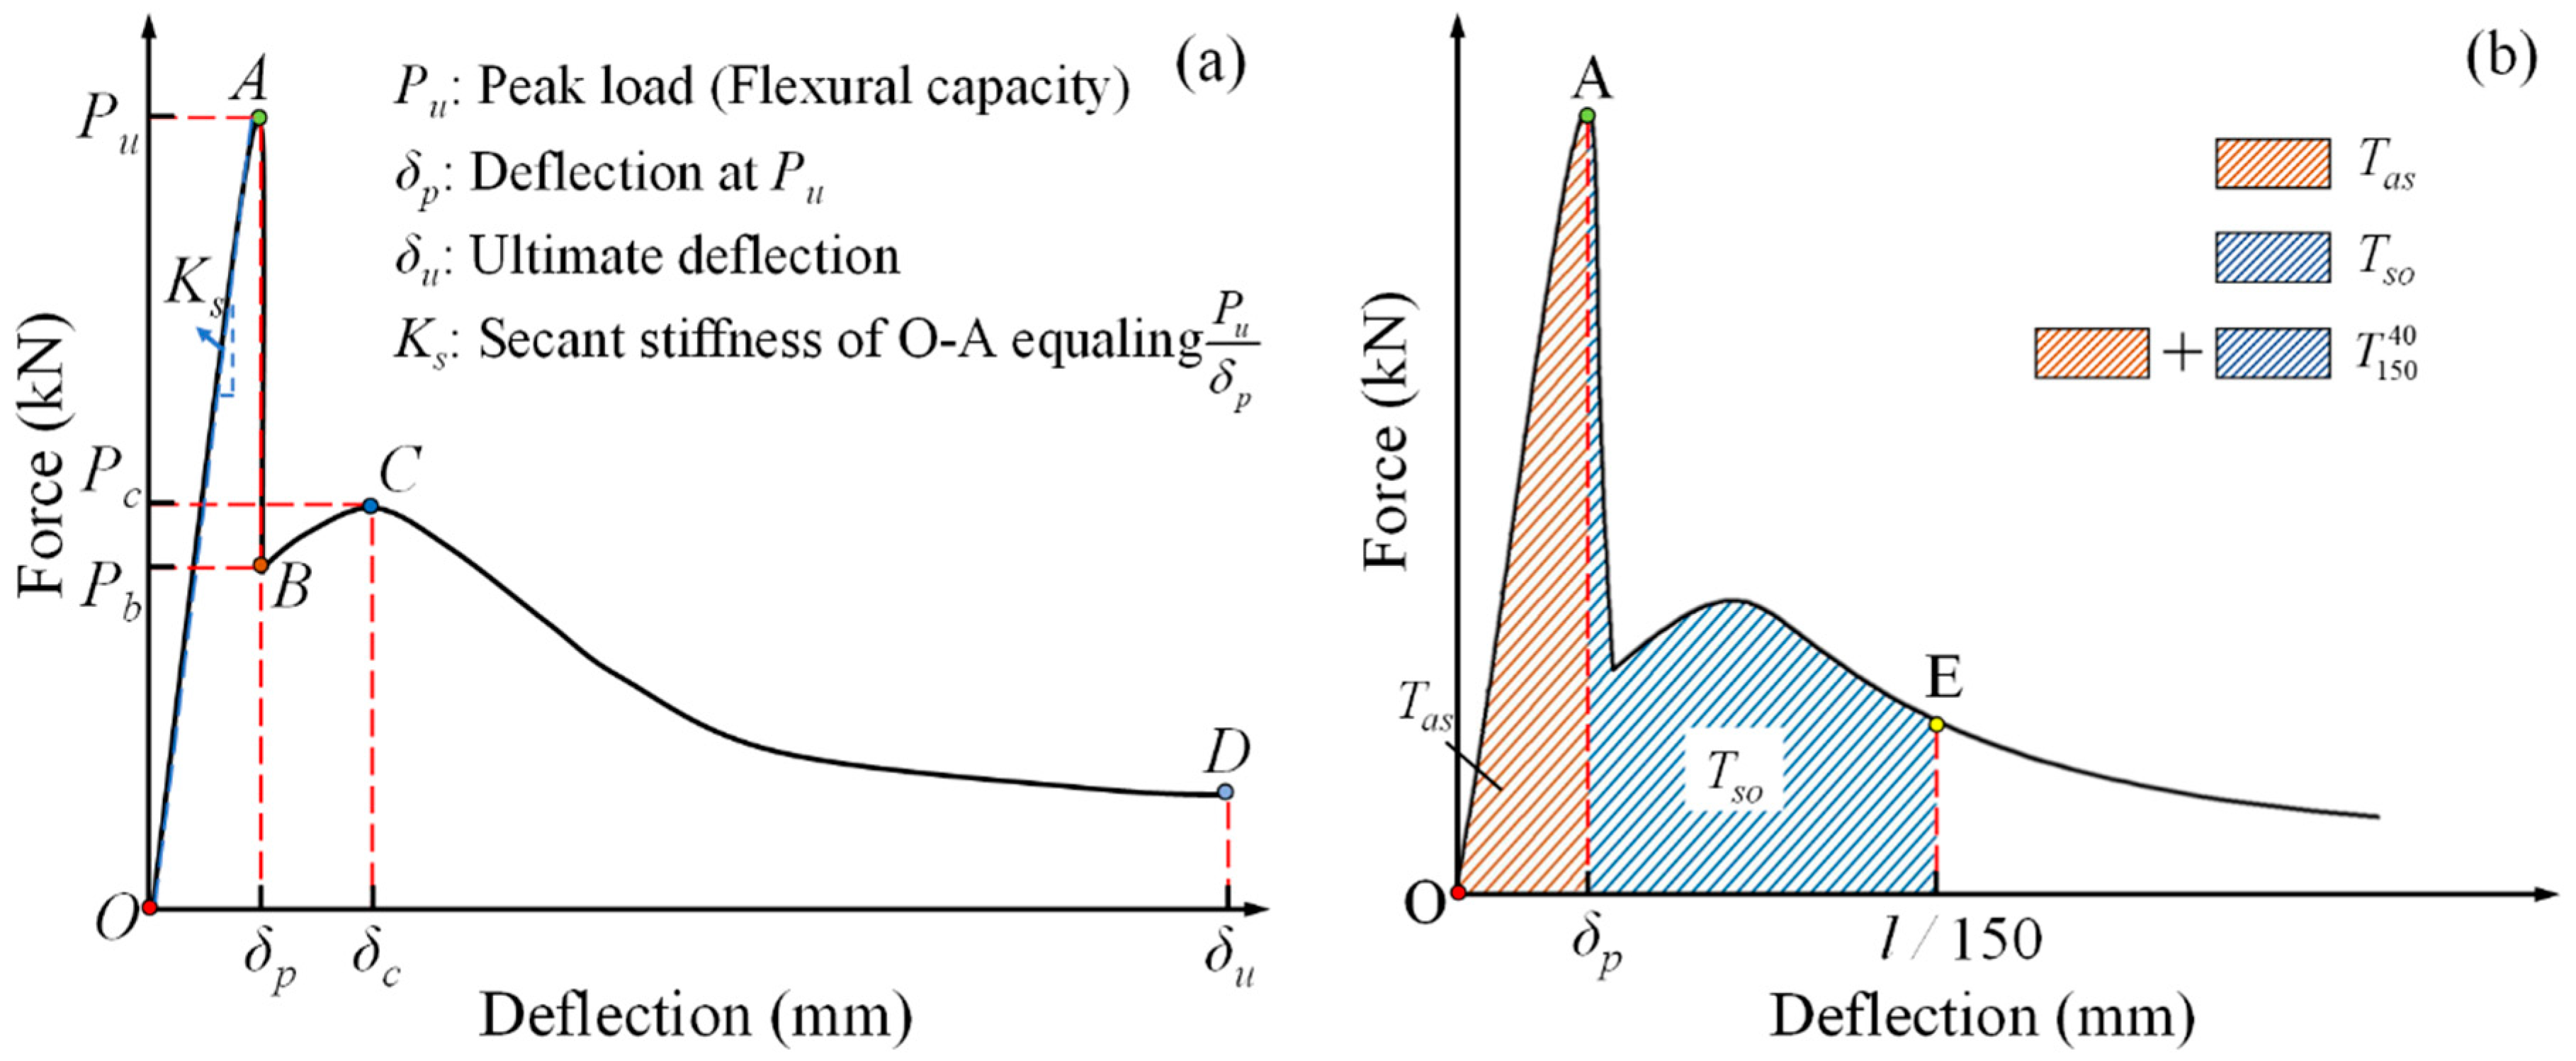
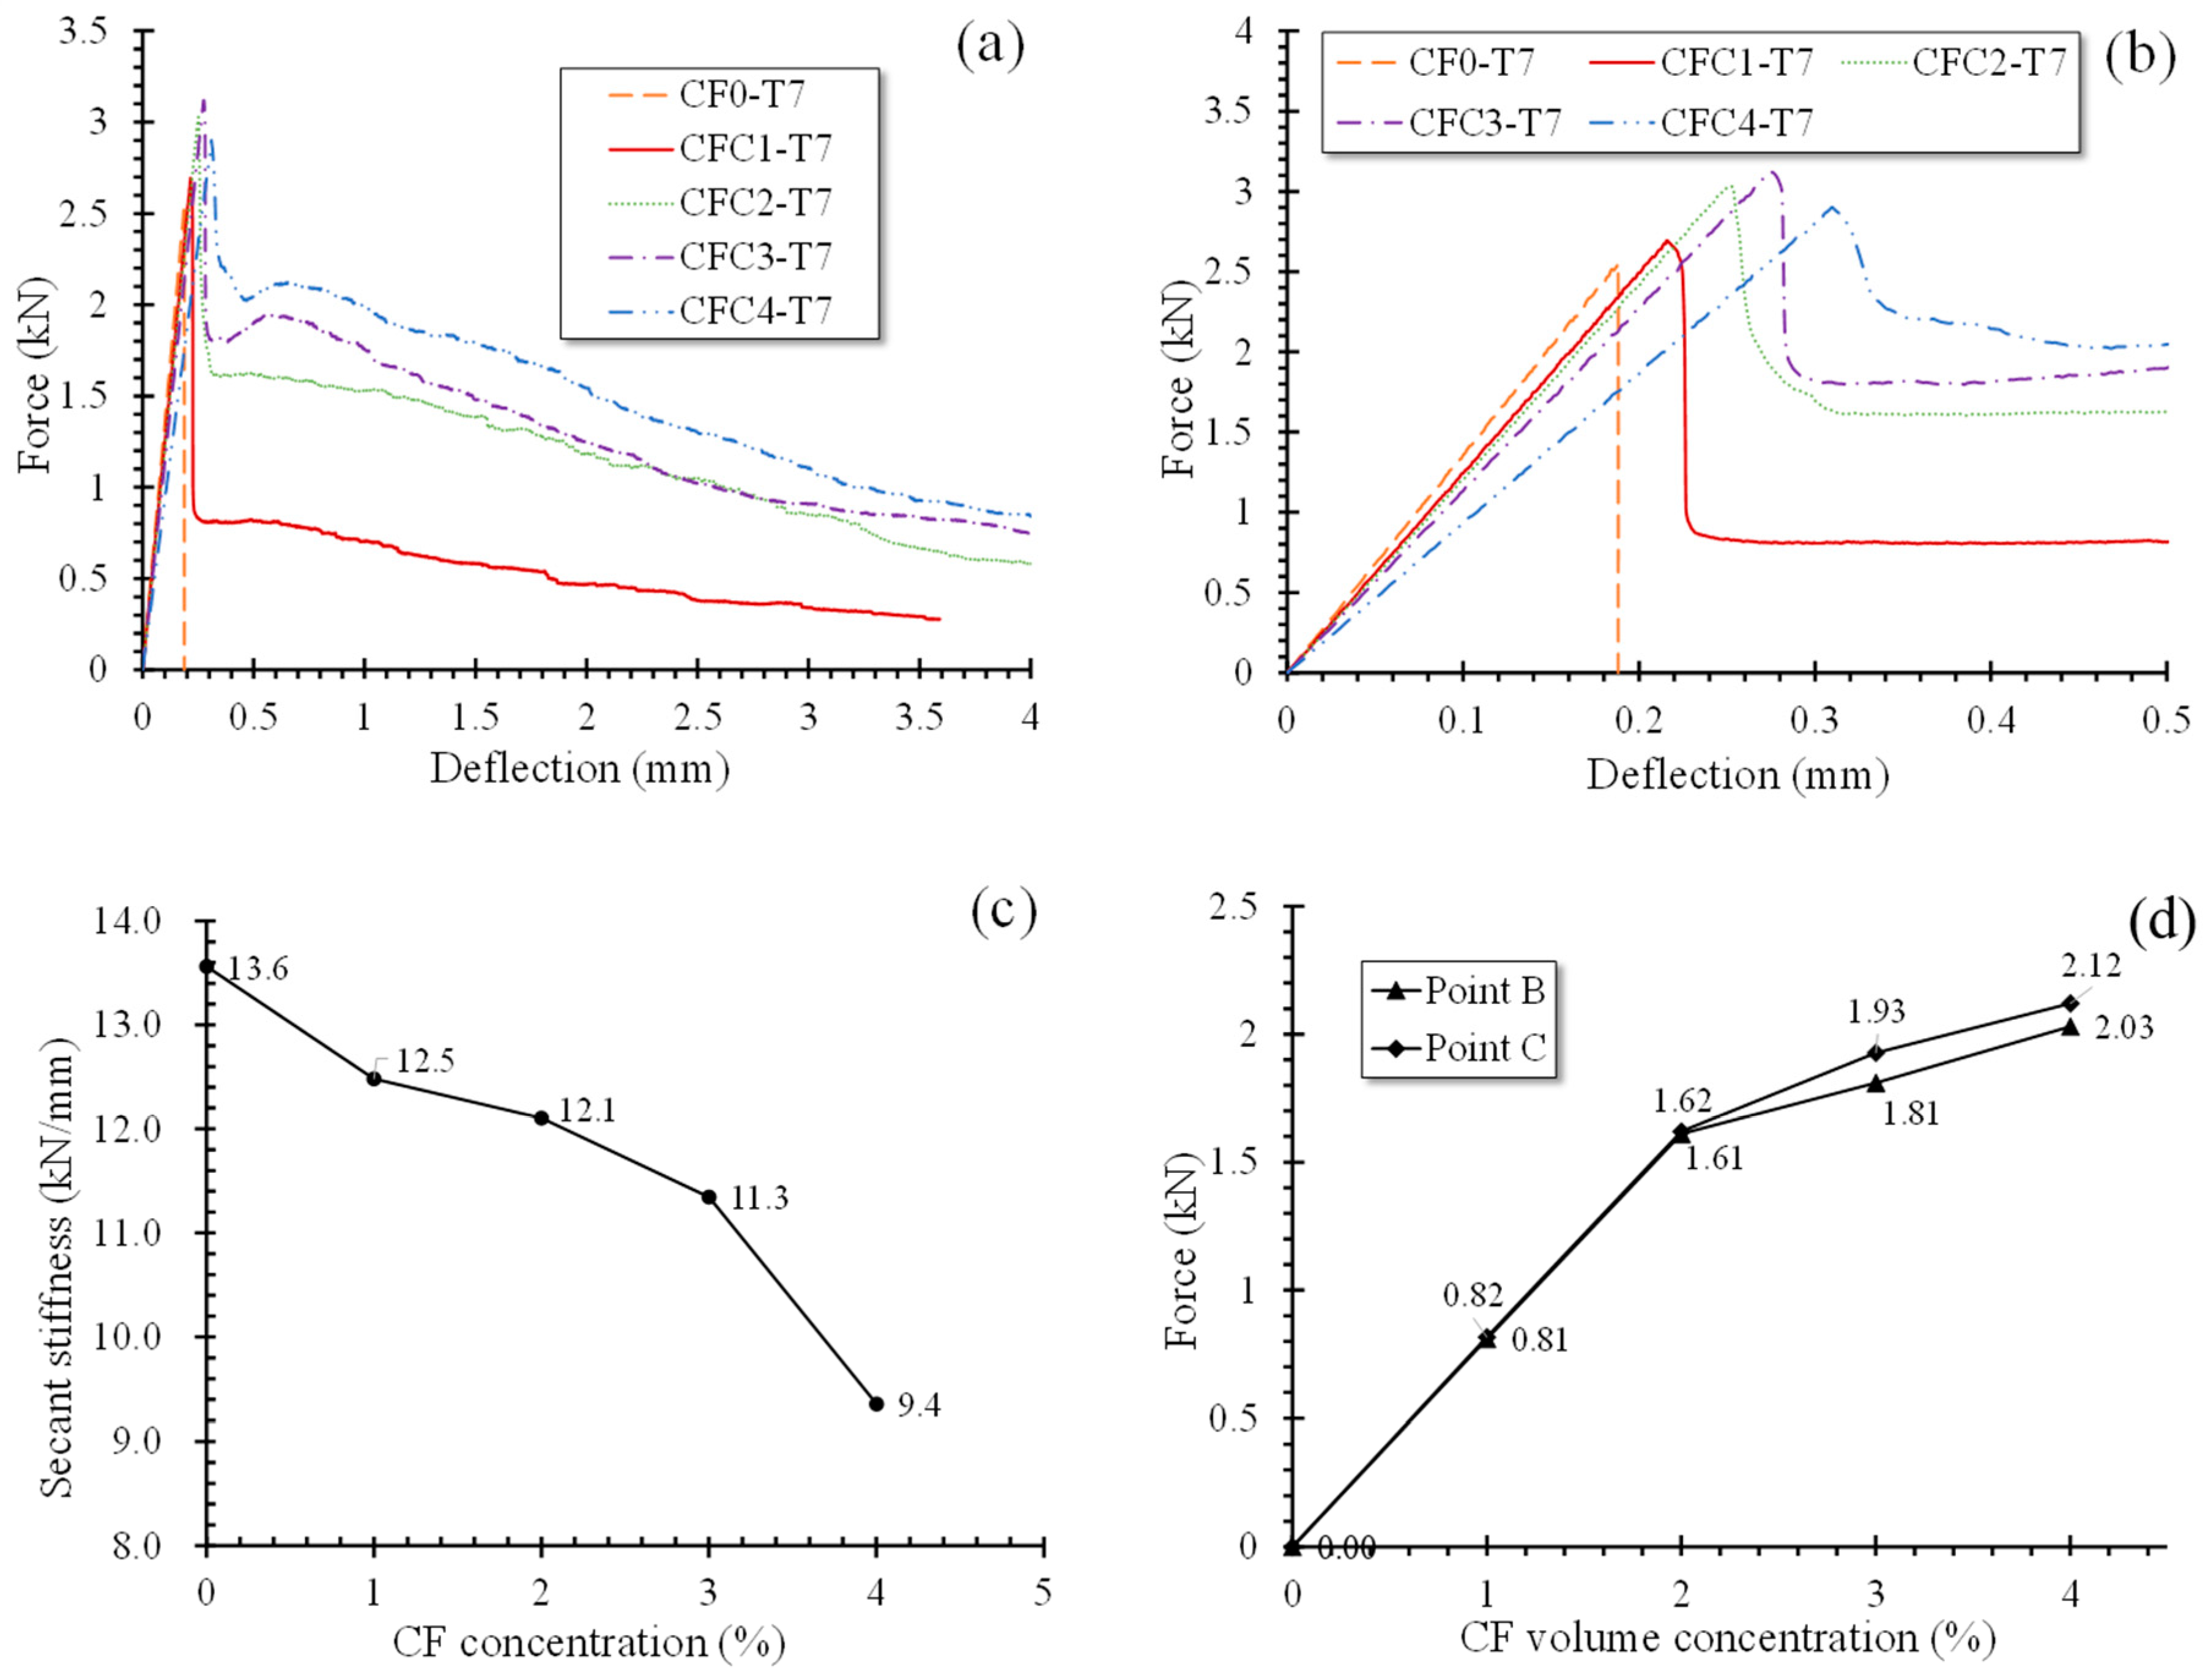
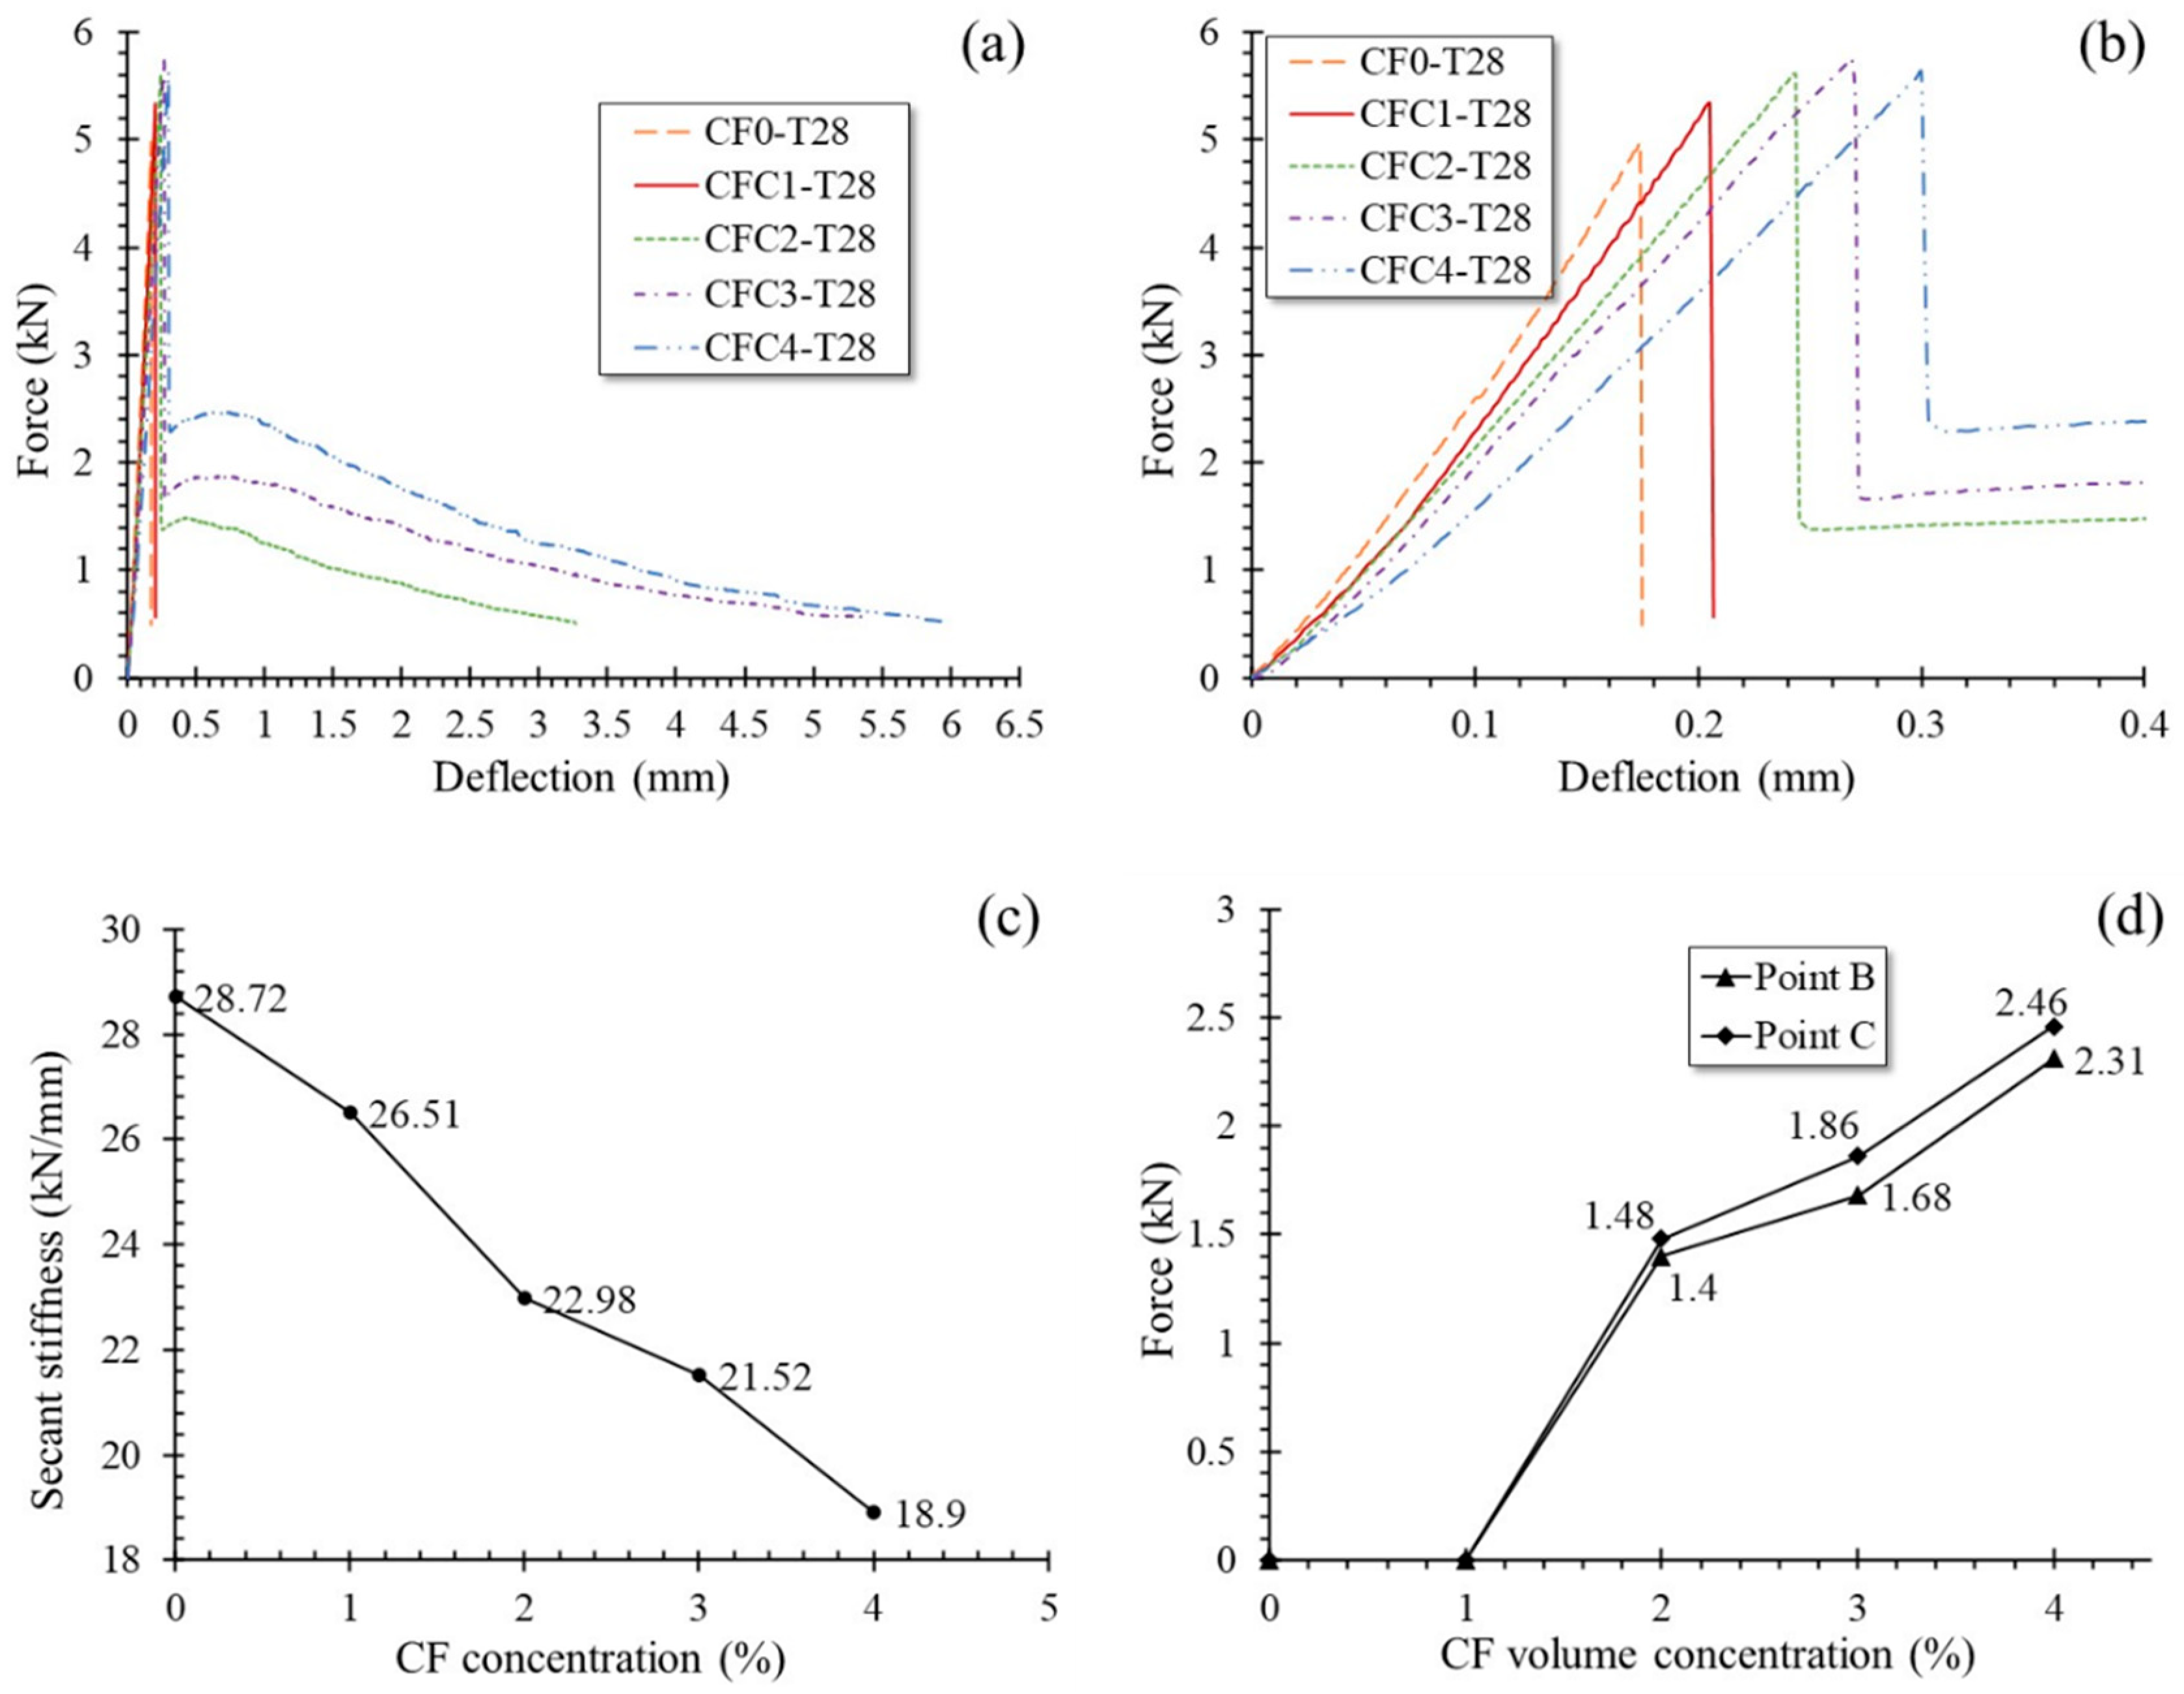
3.4. Load-Deflection Curves
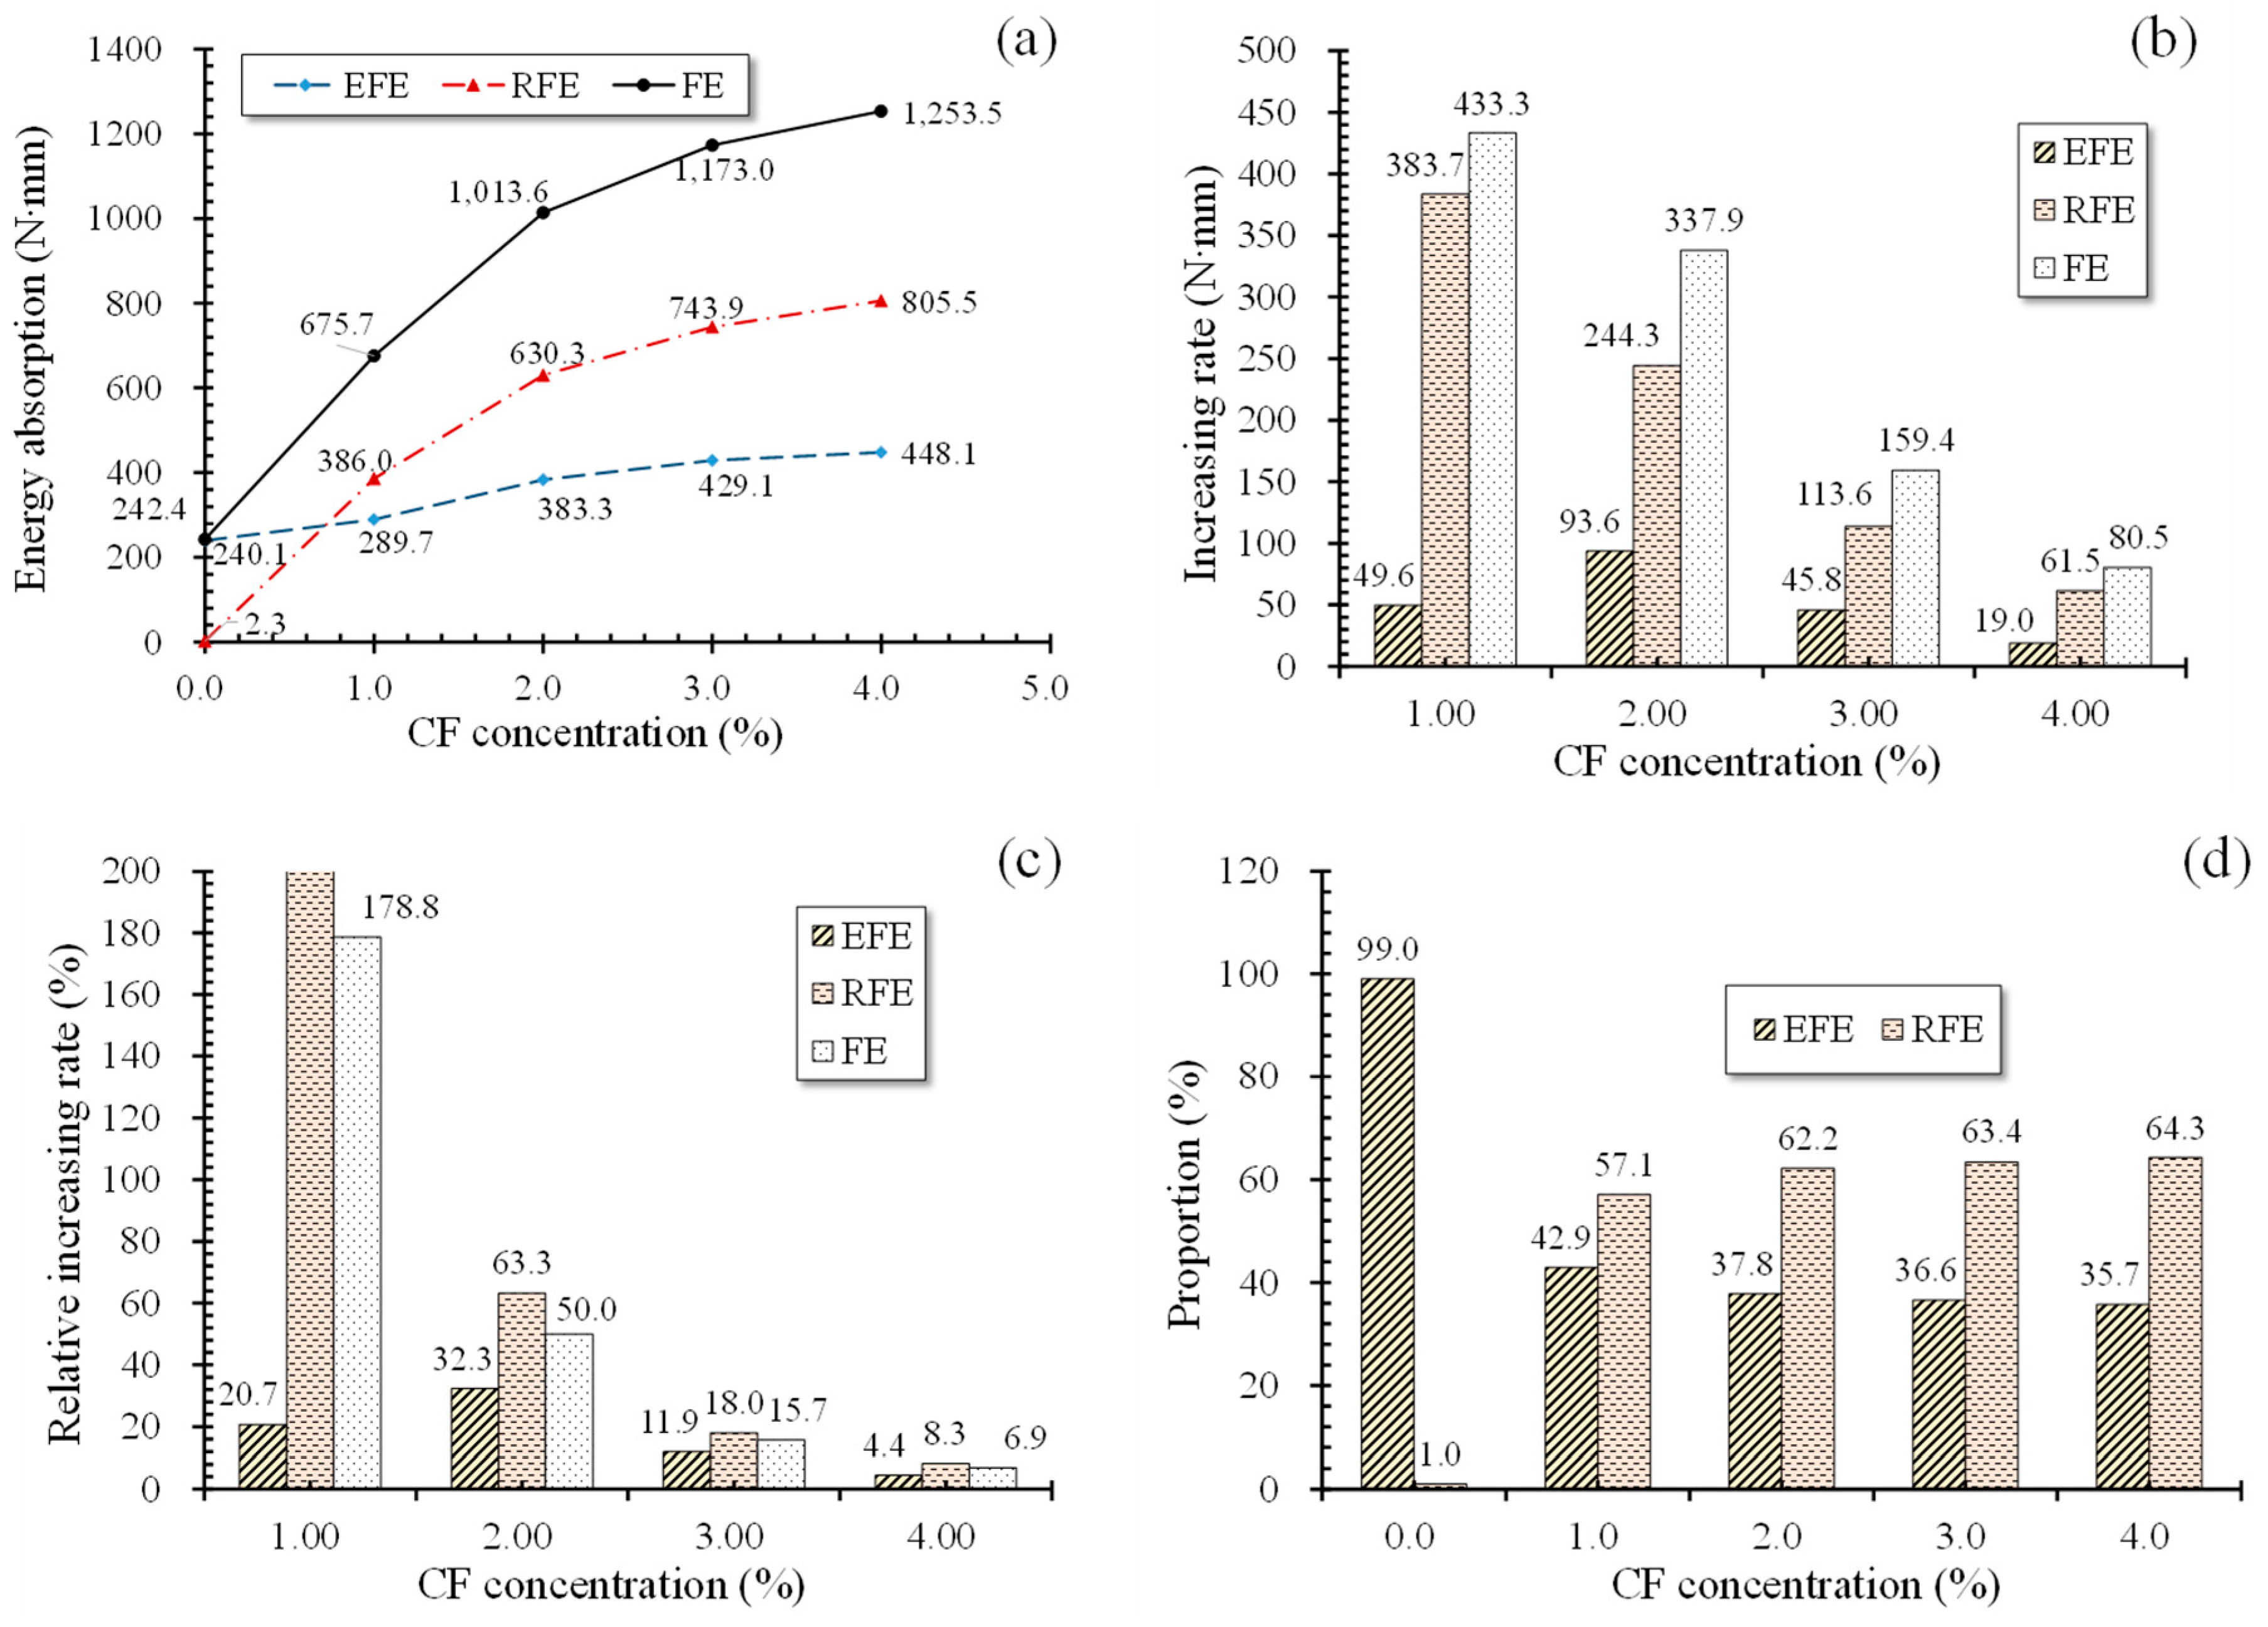
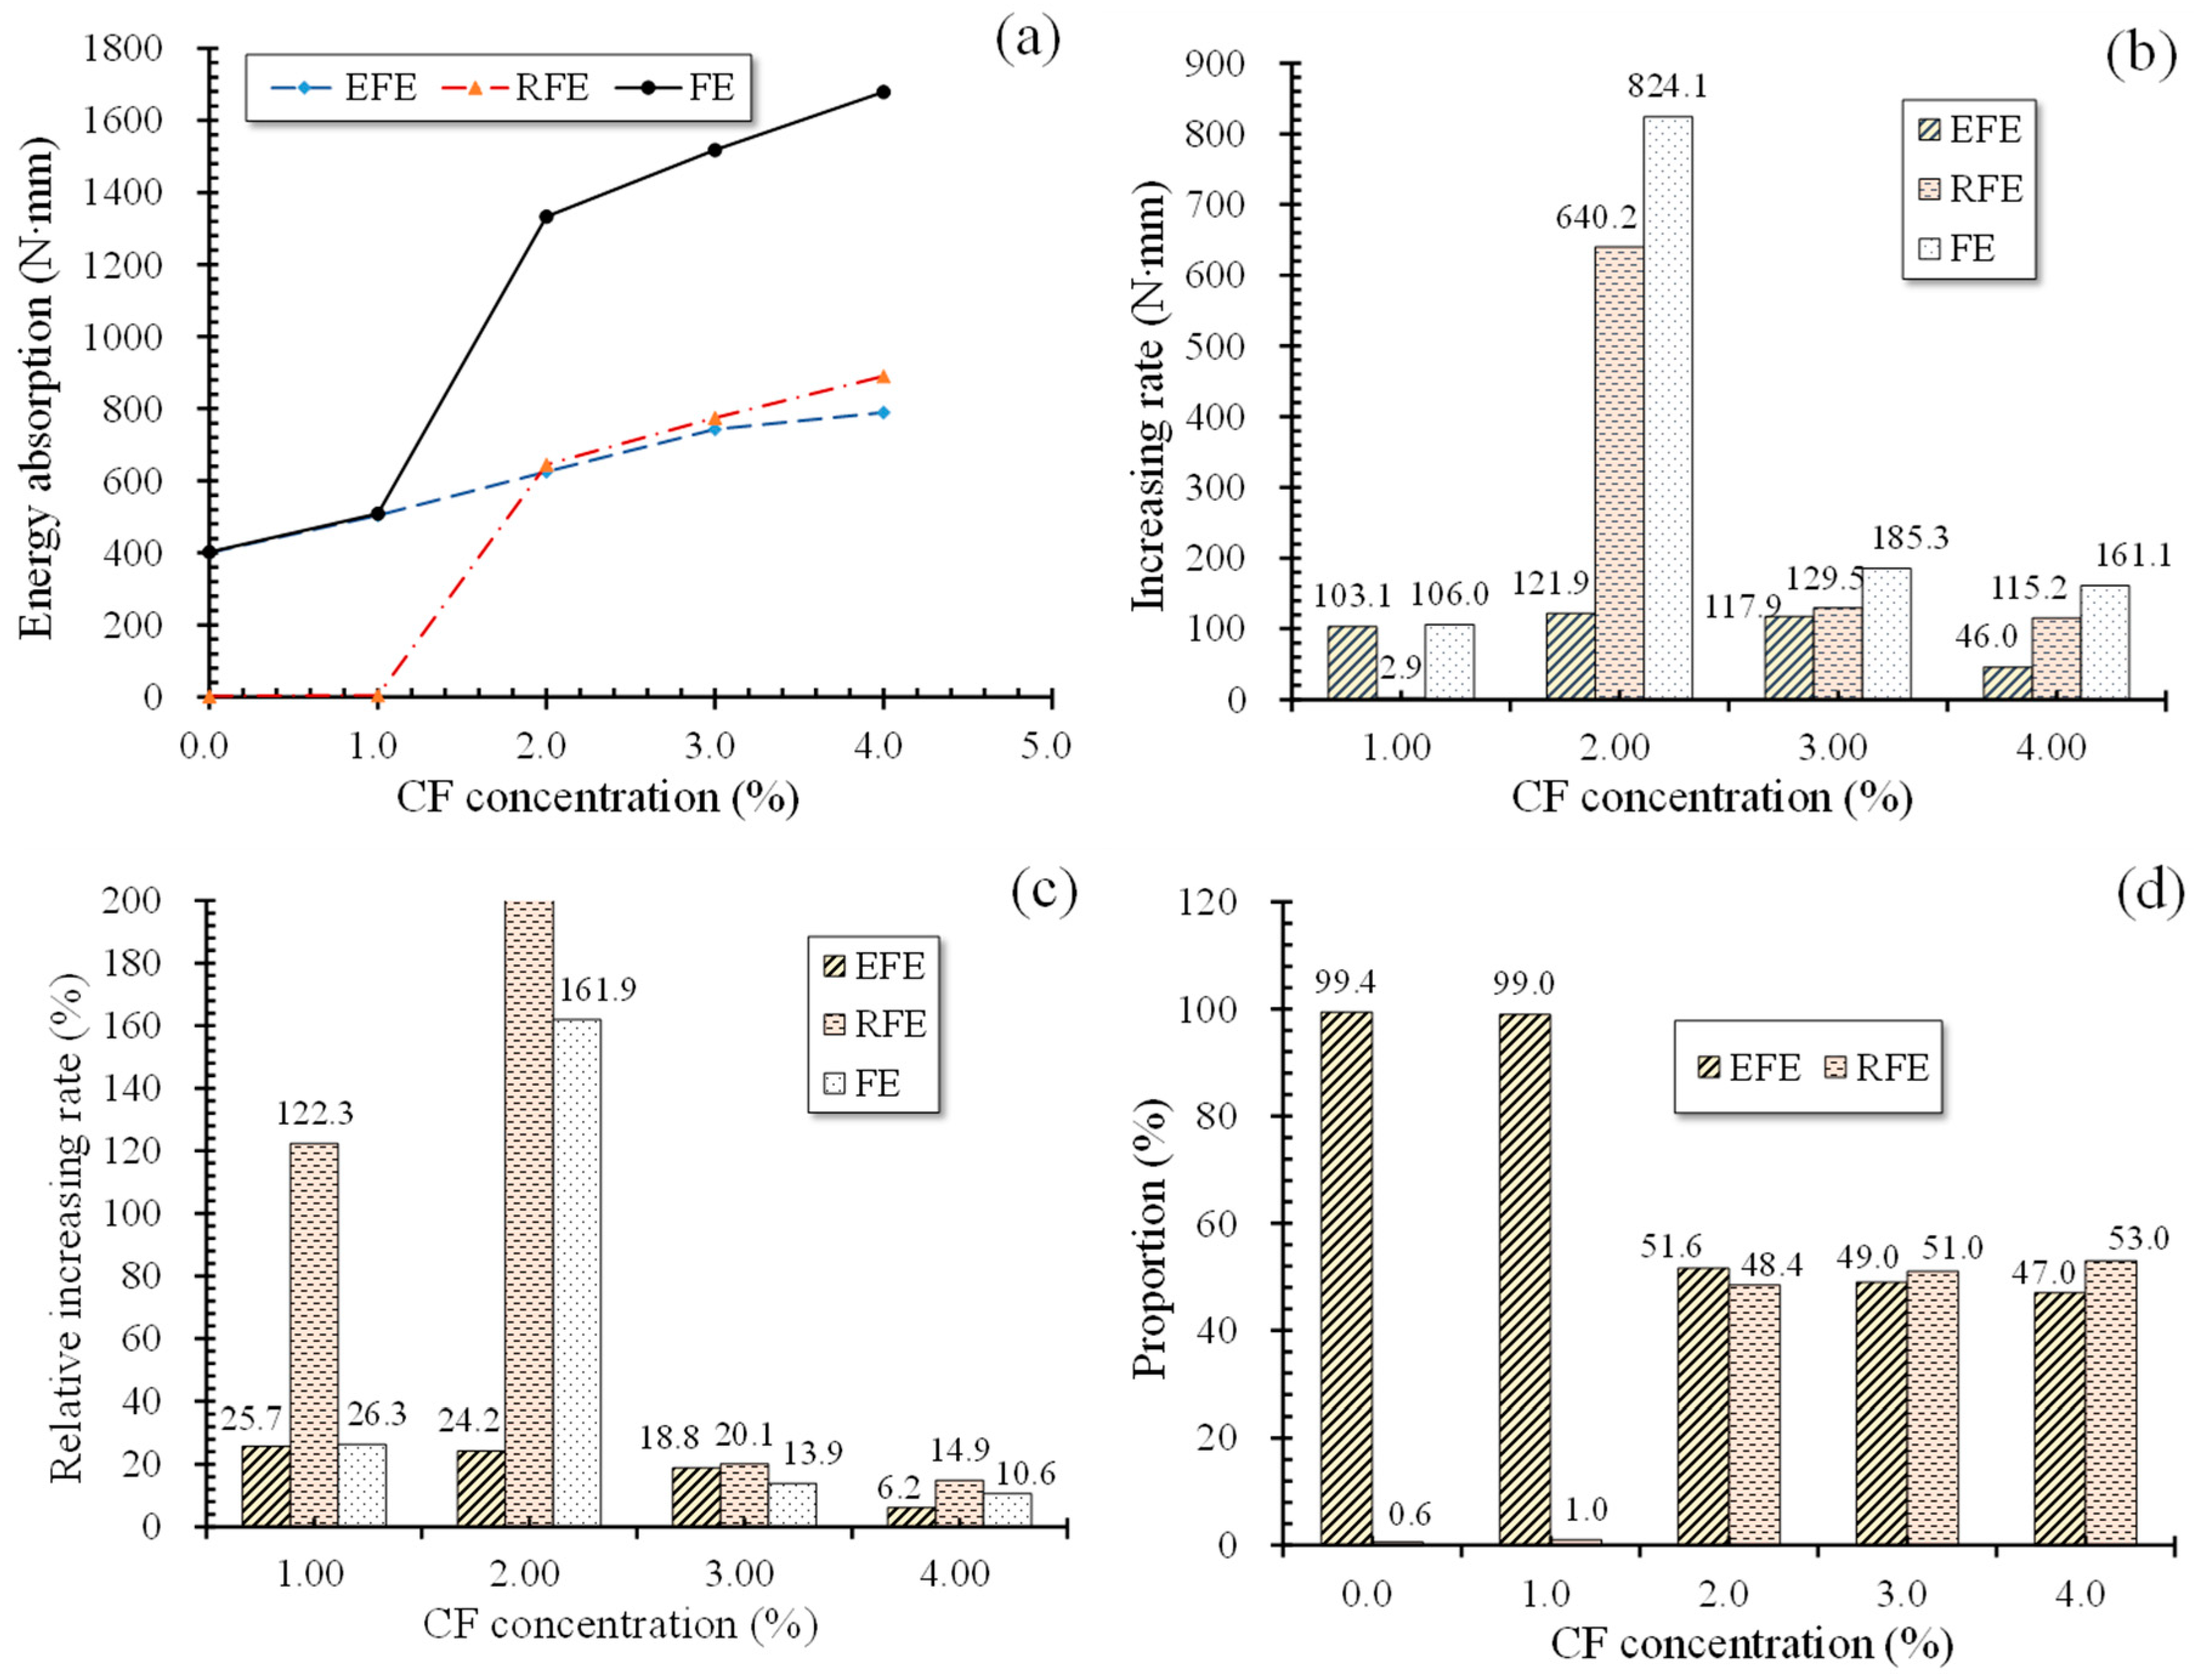
3.5. Flexural Toughness
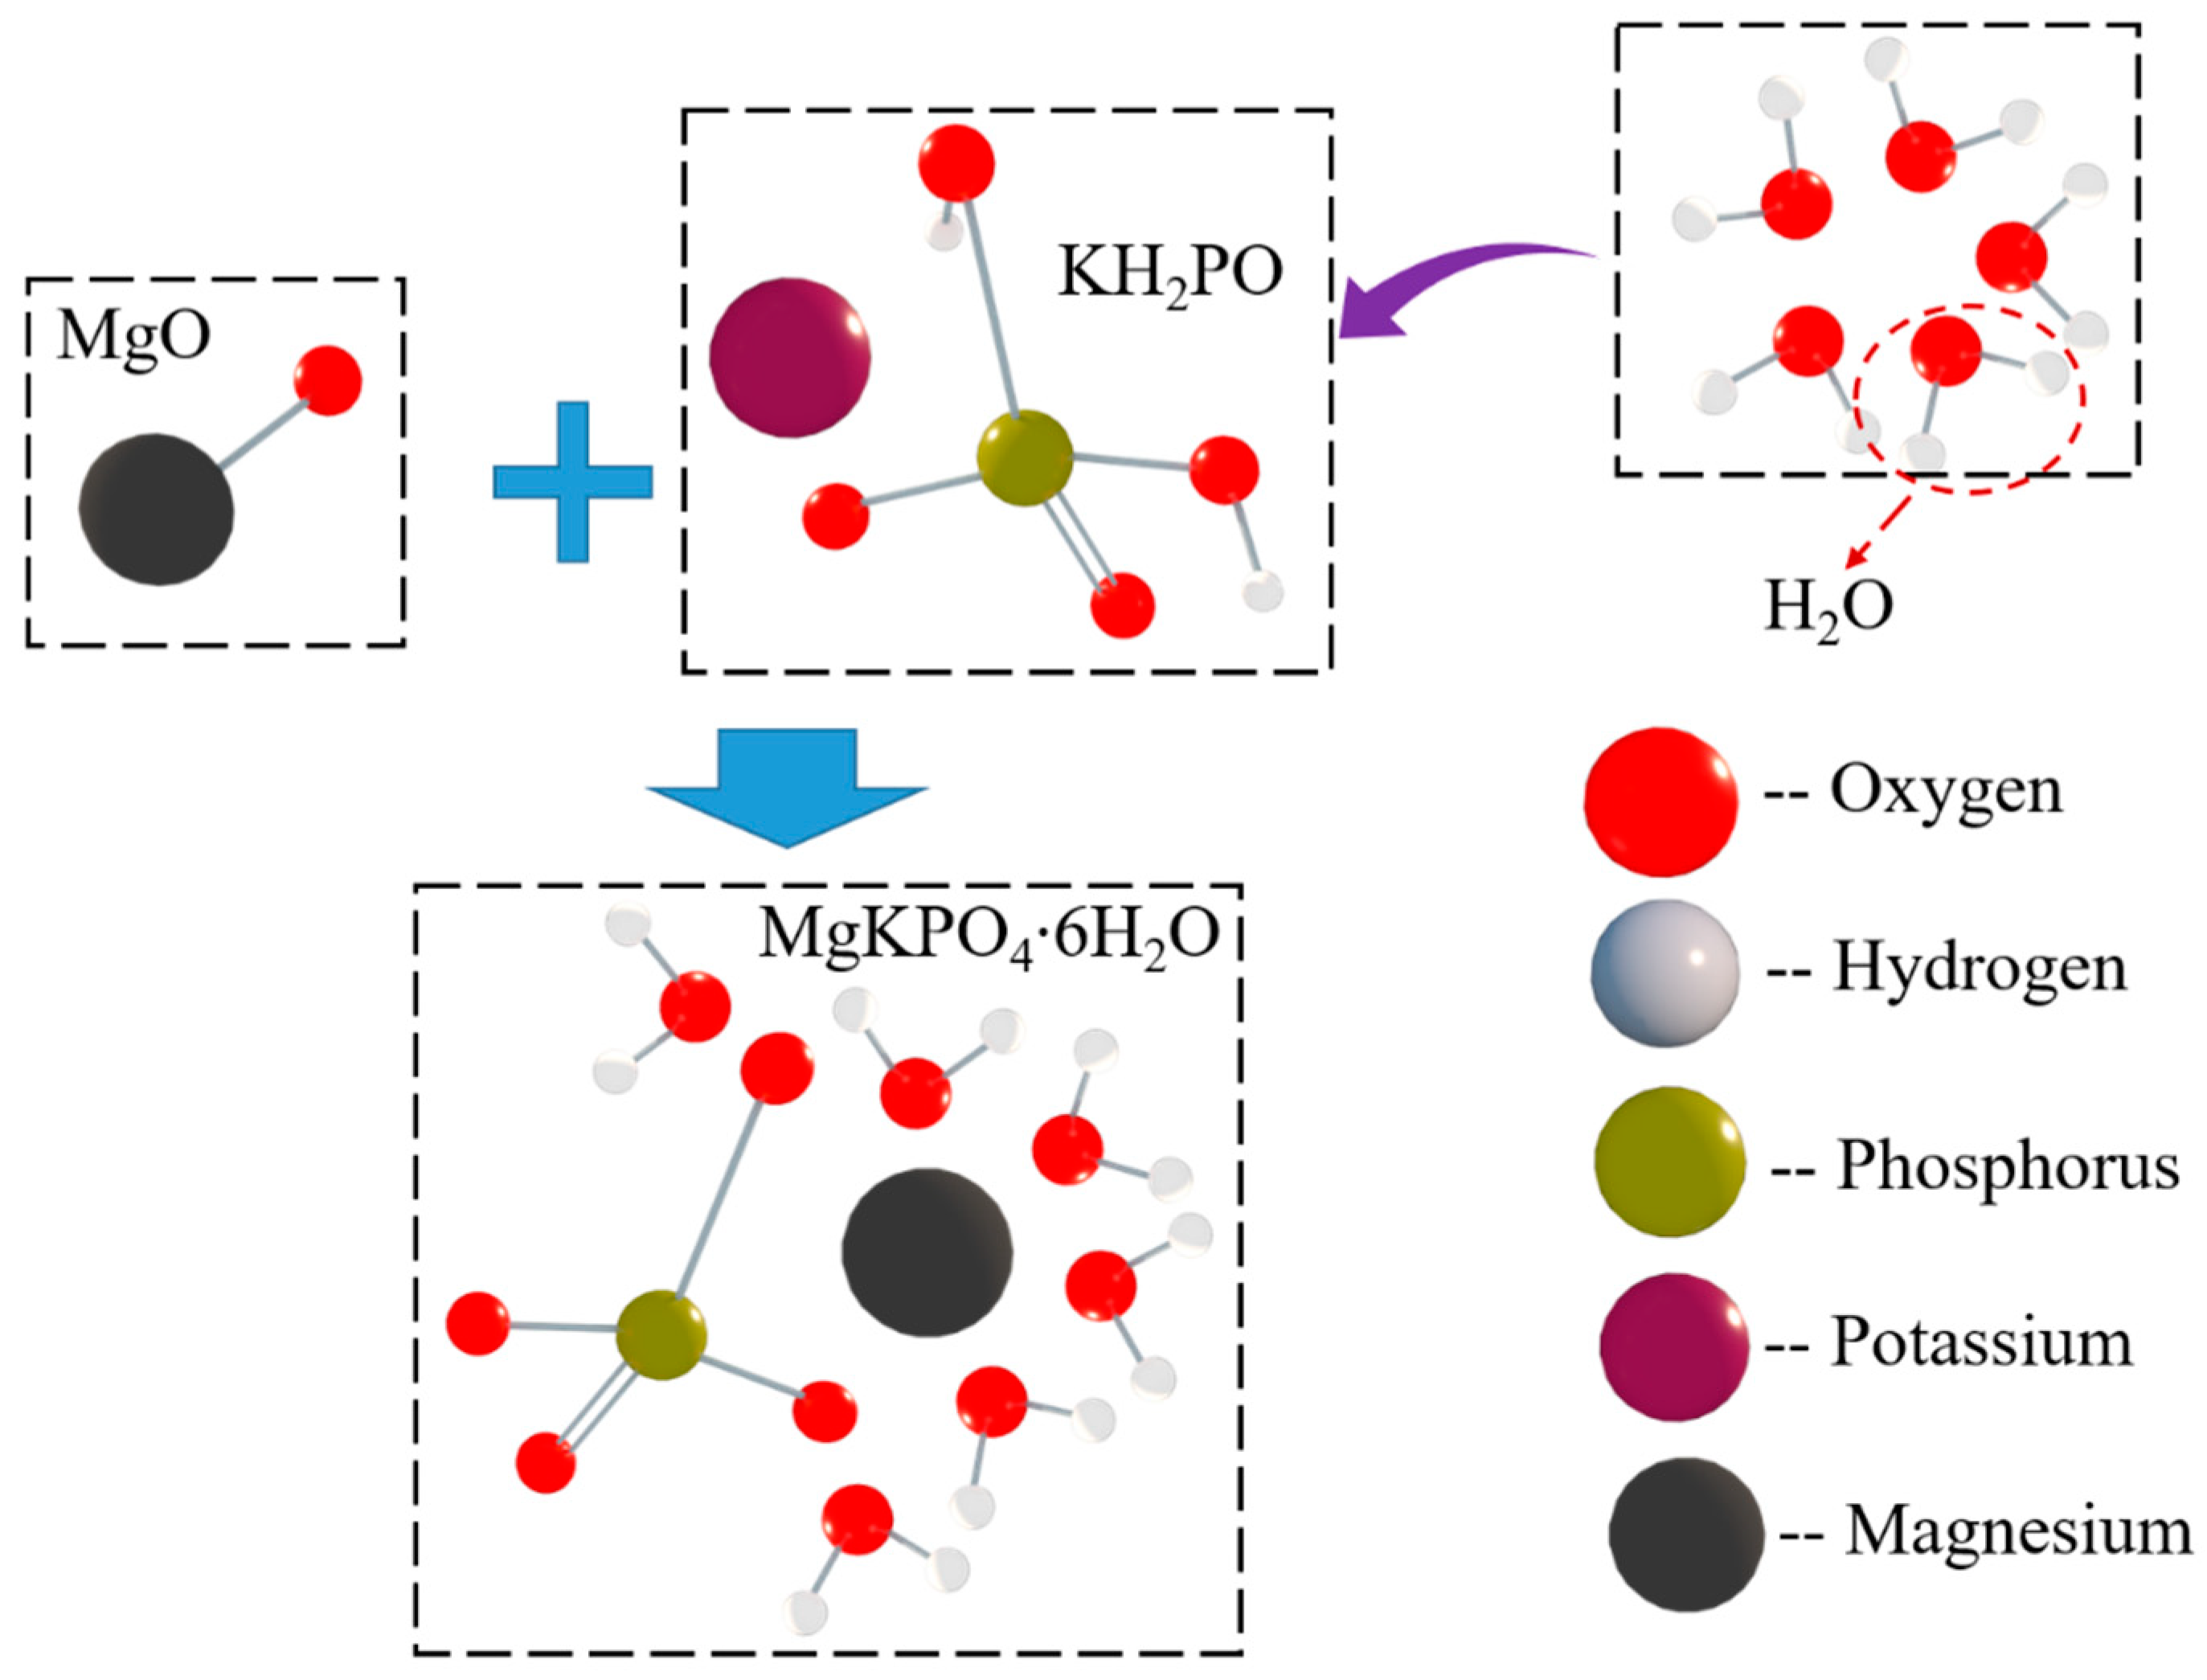
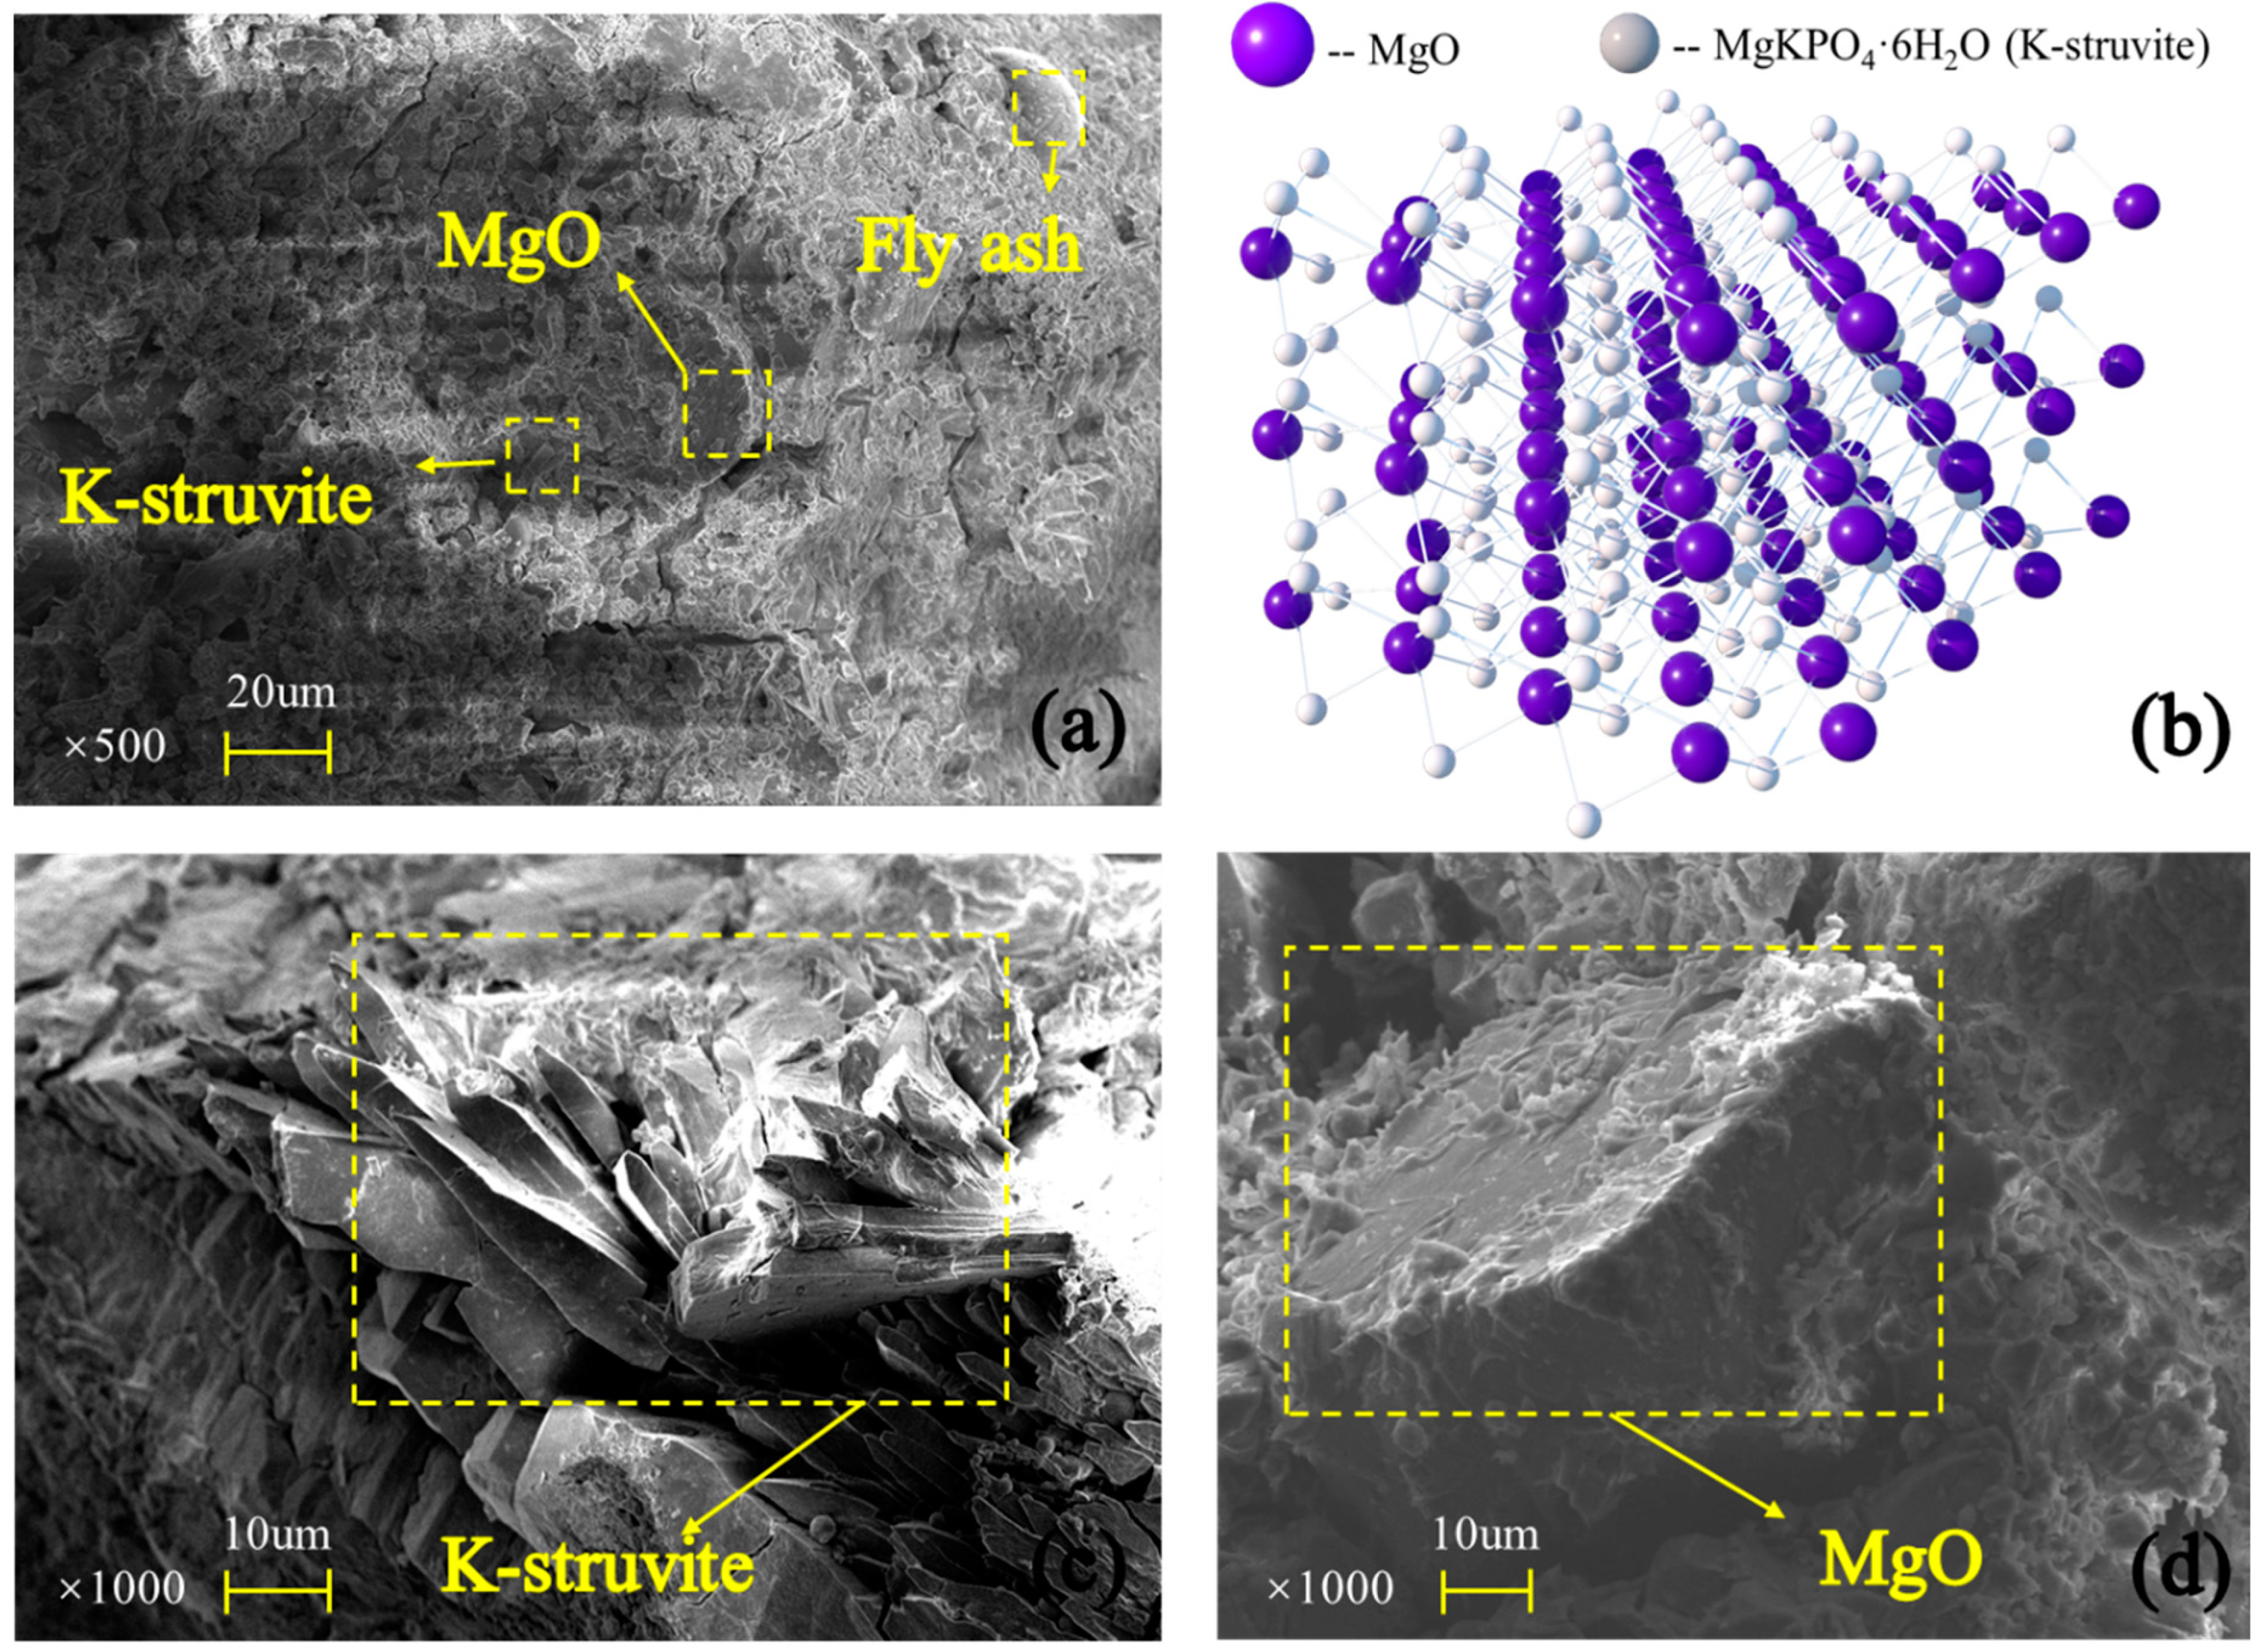
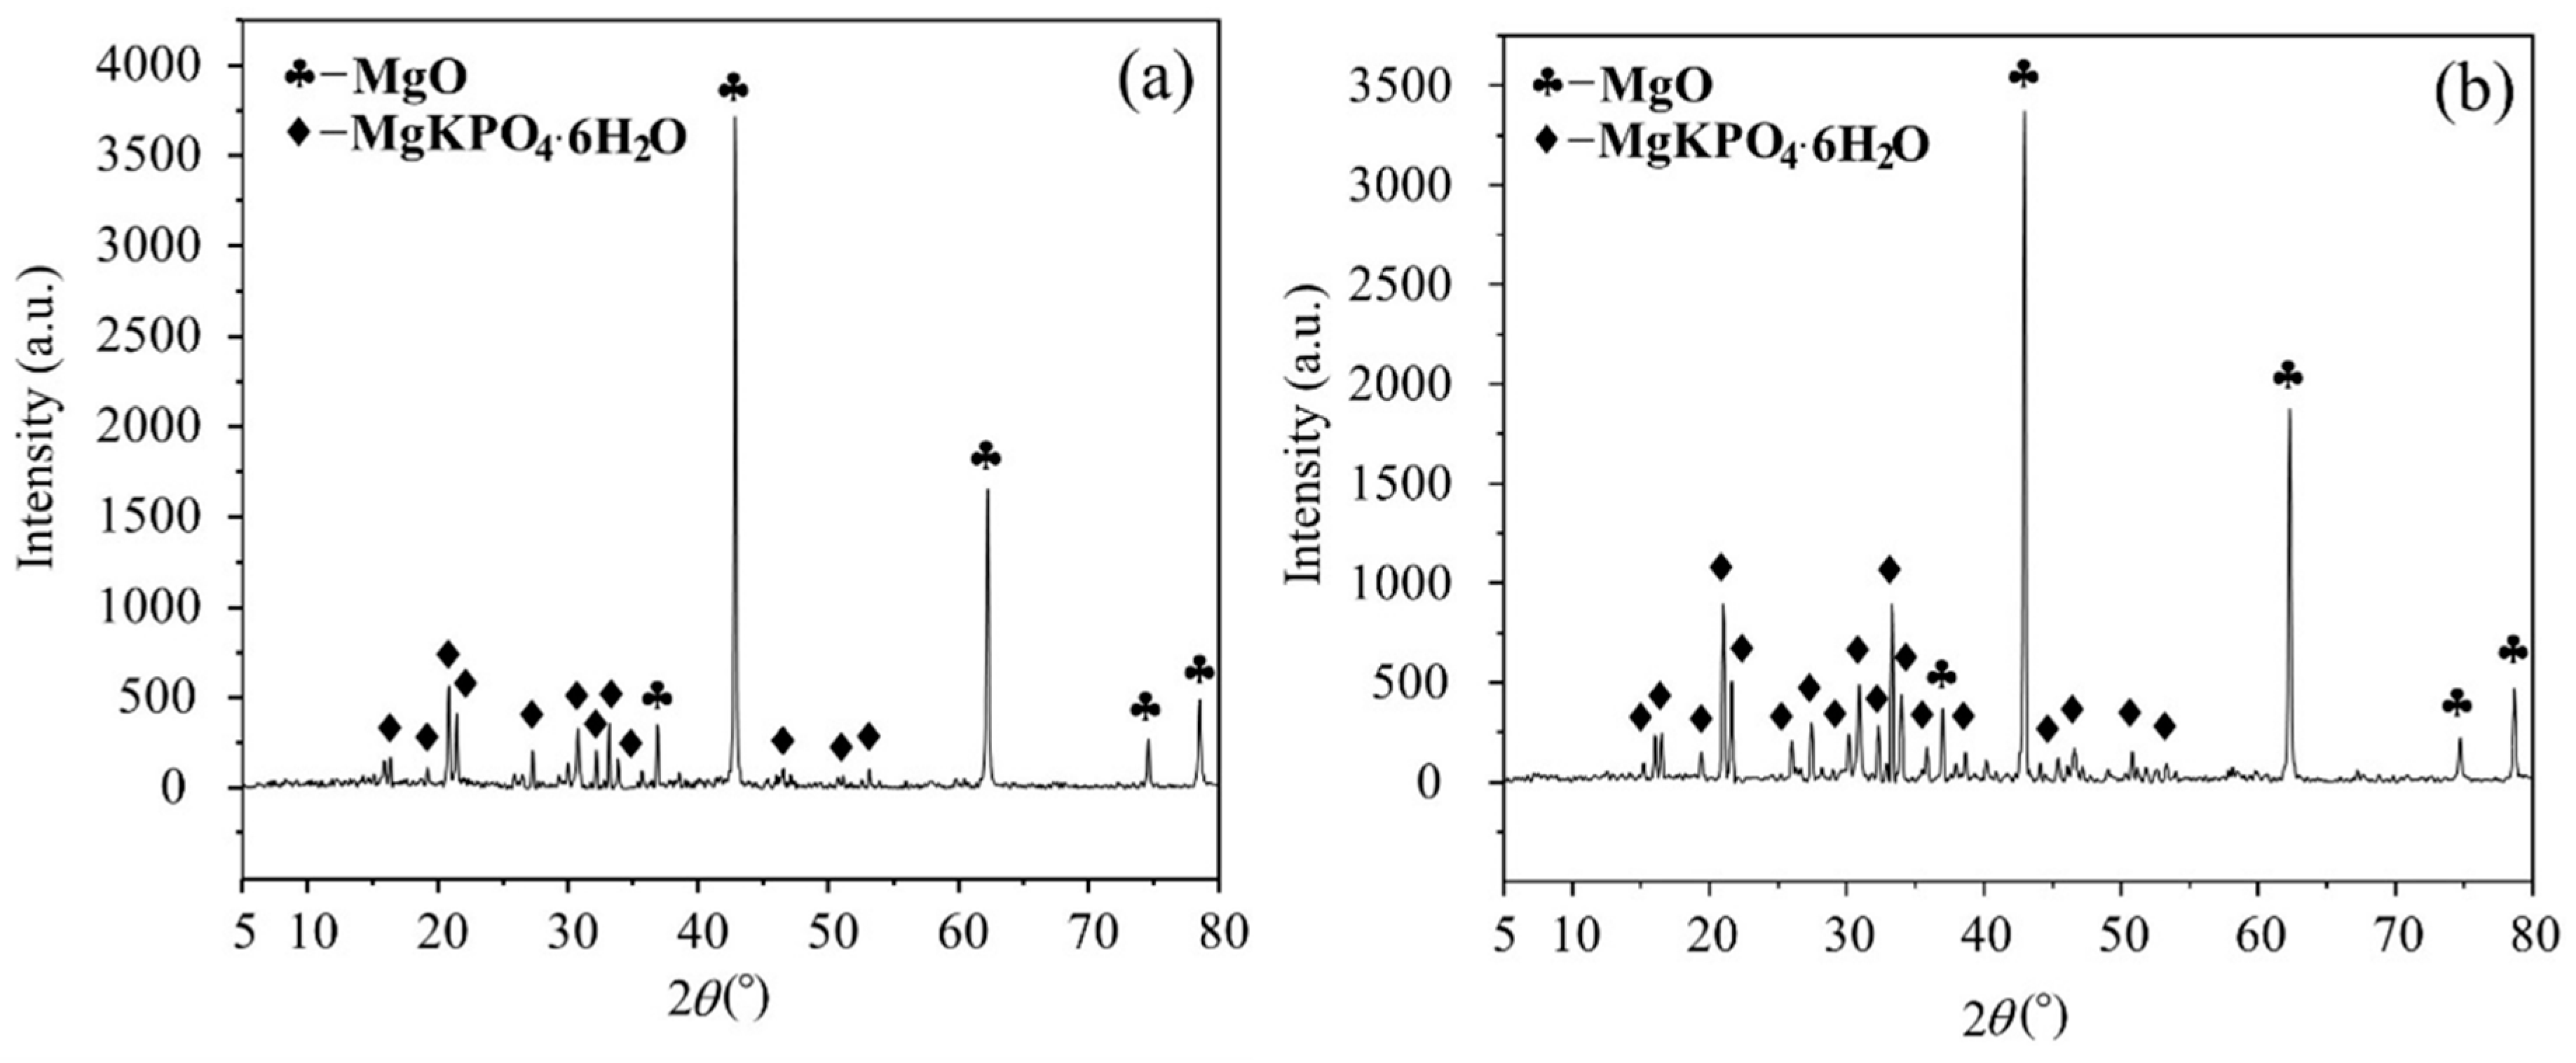
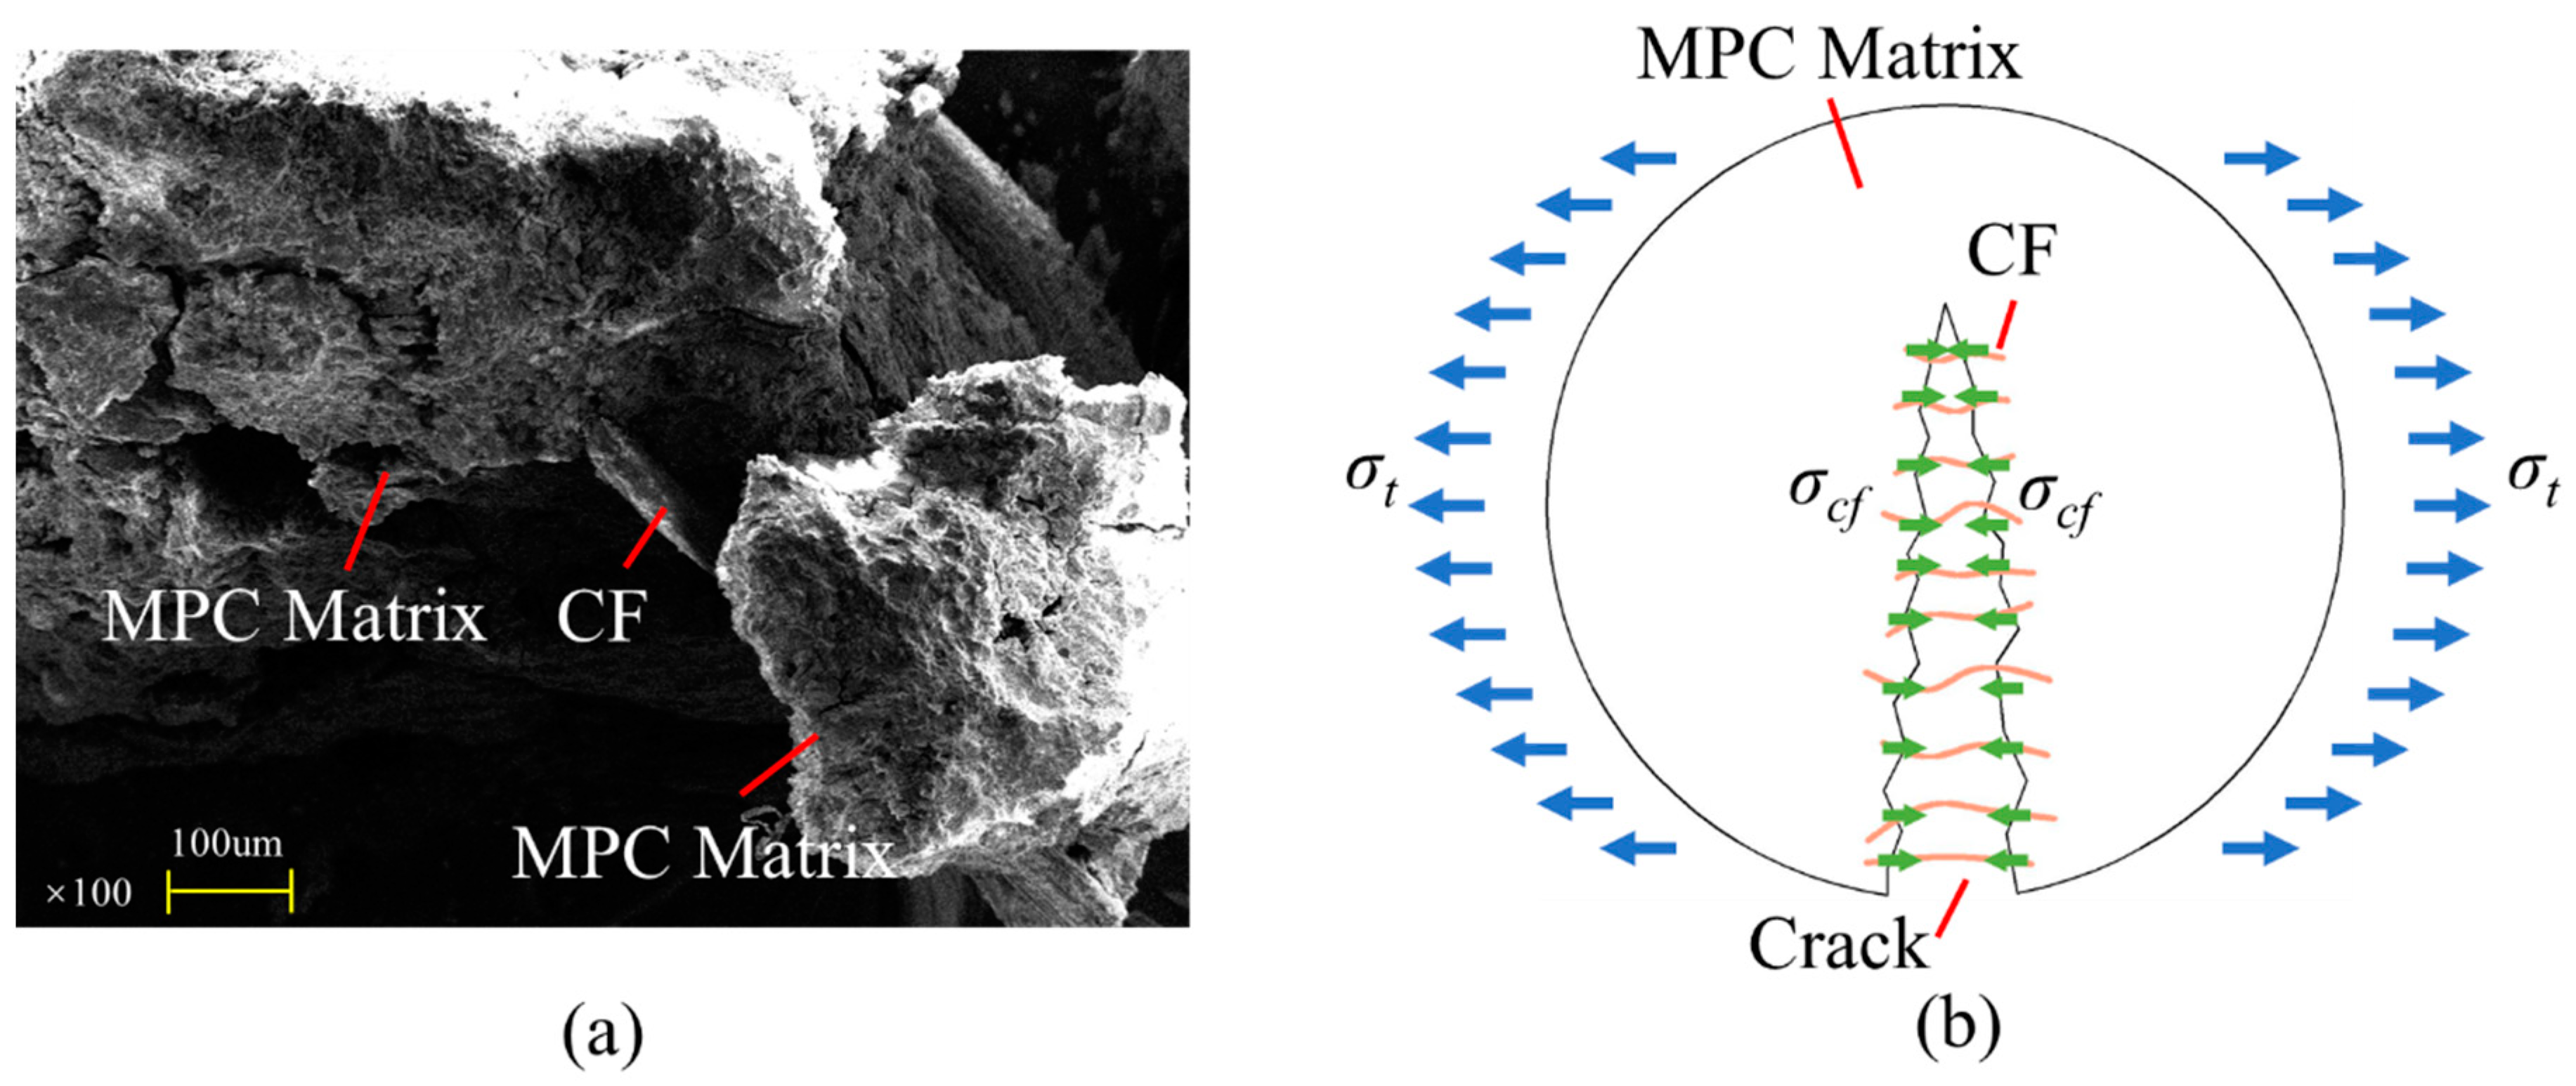
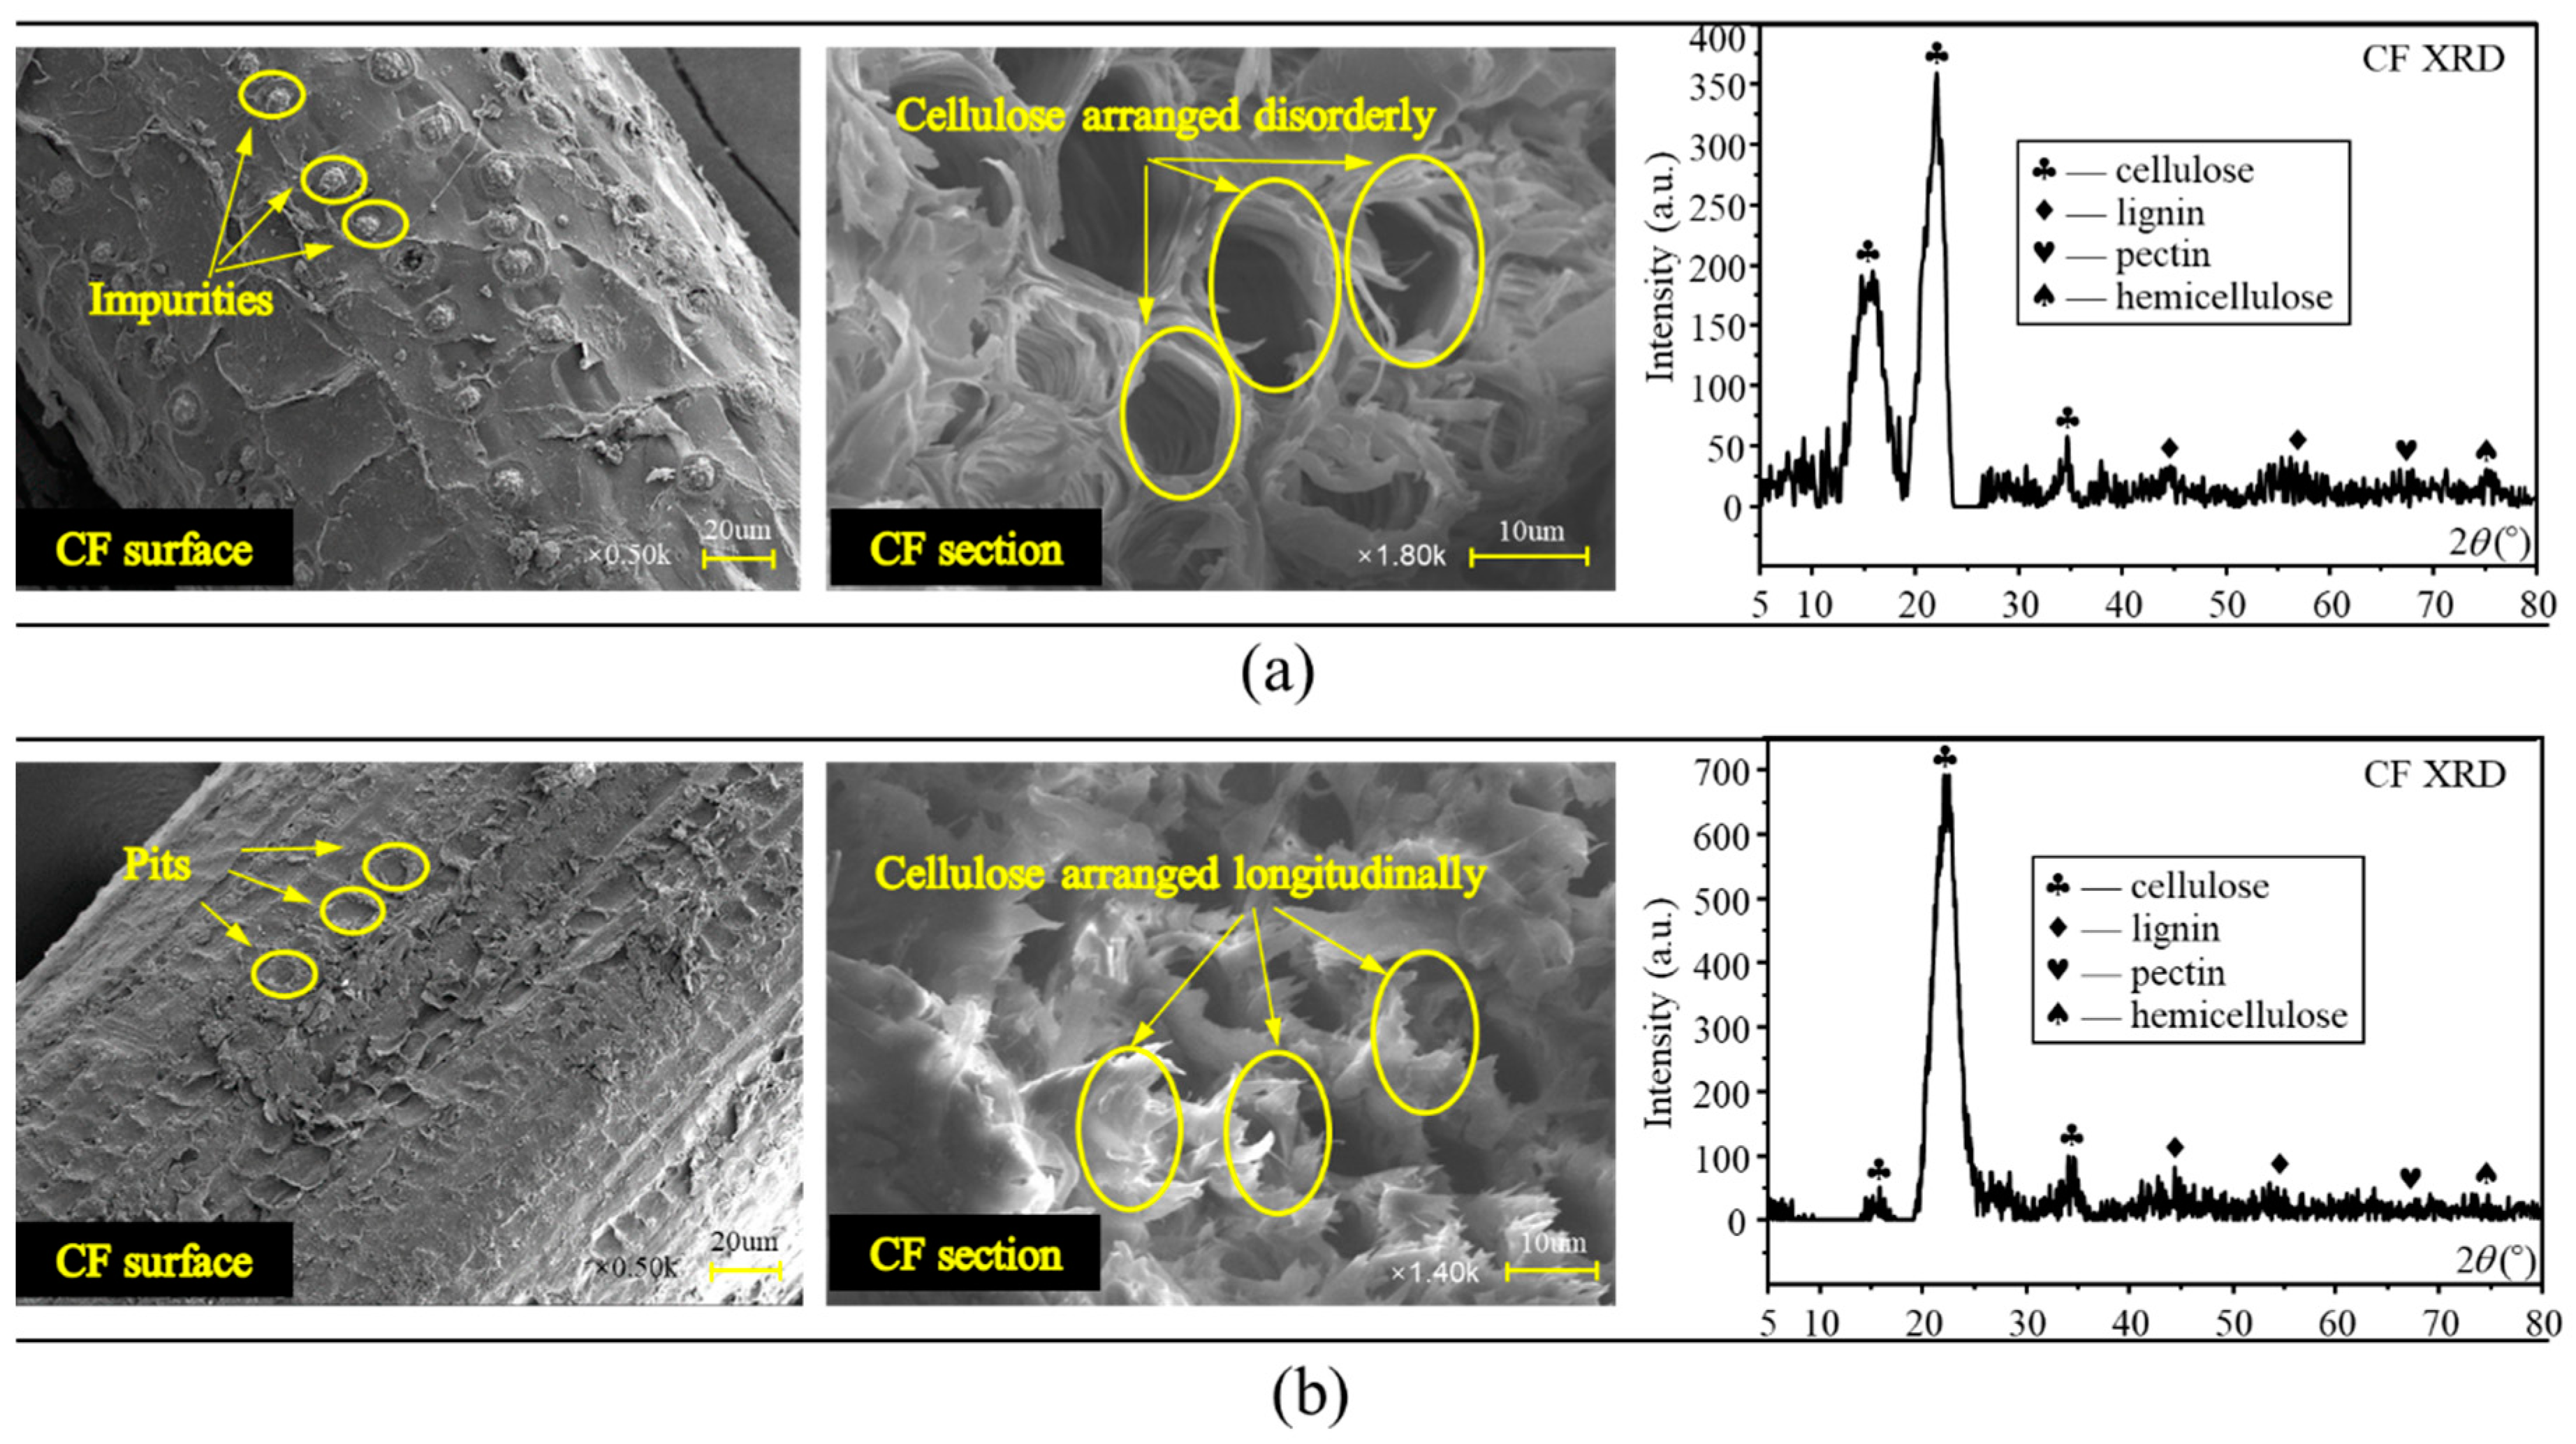
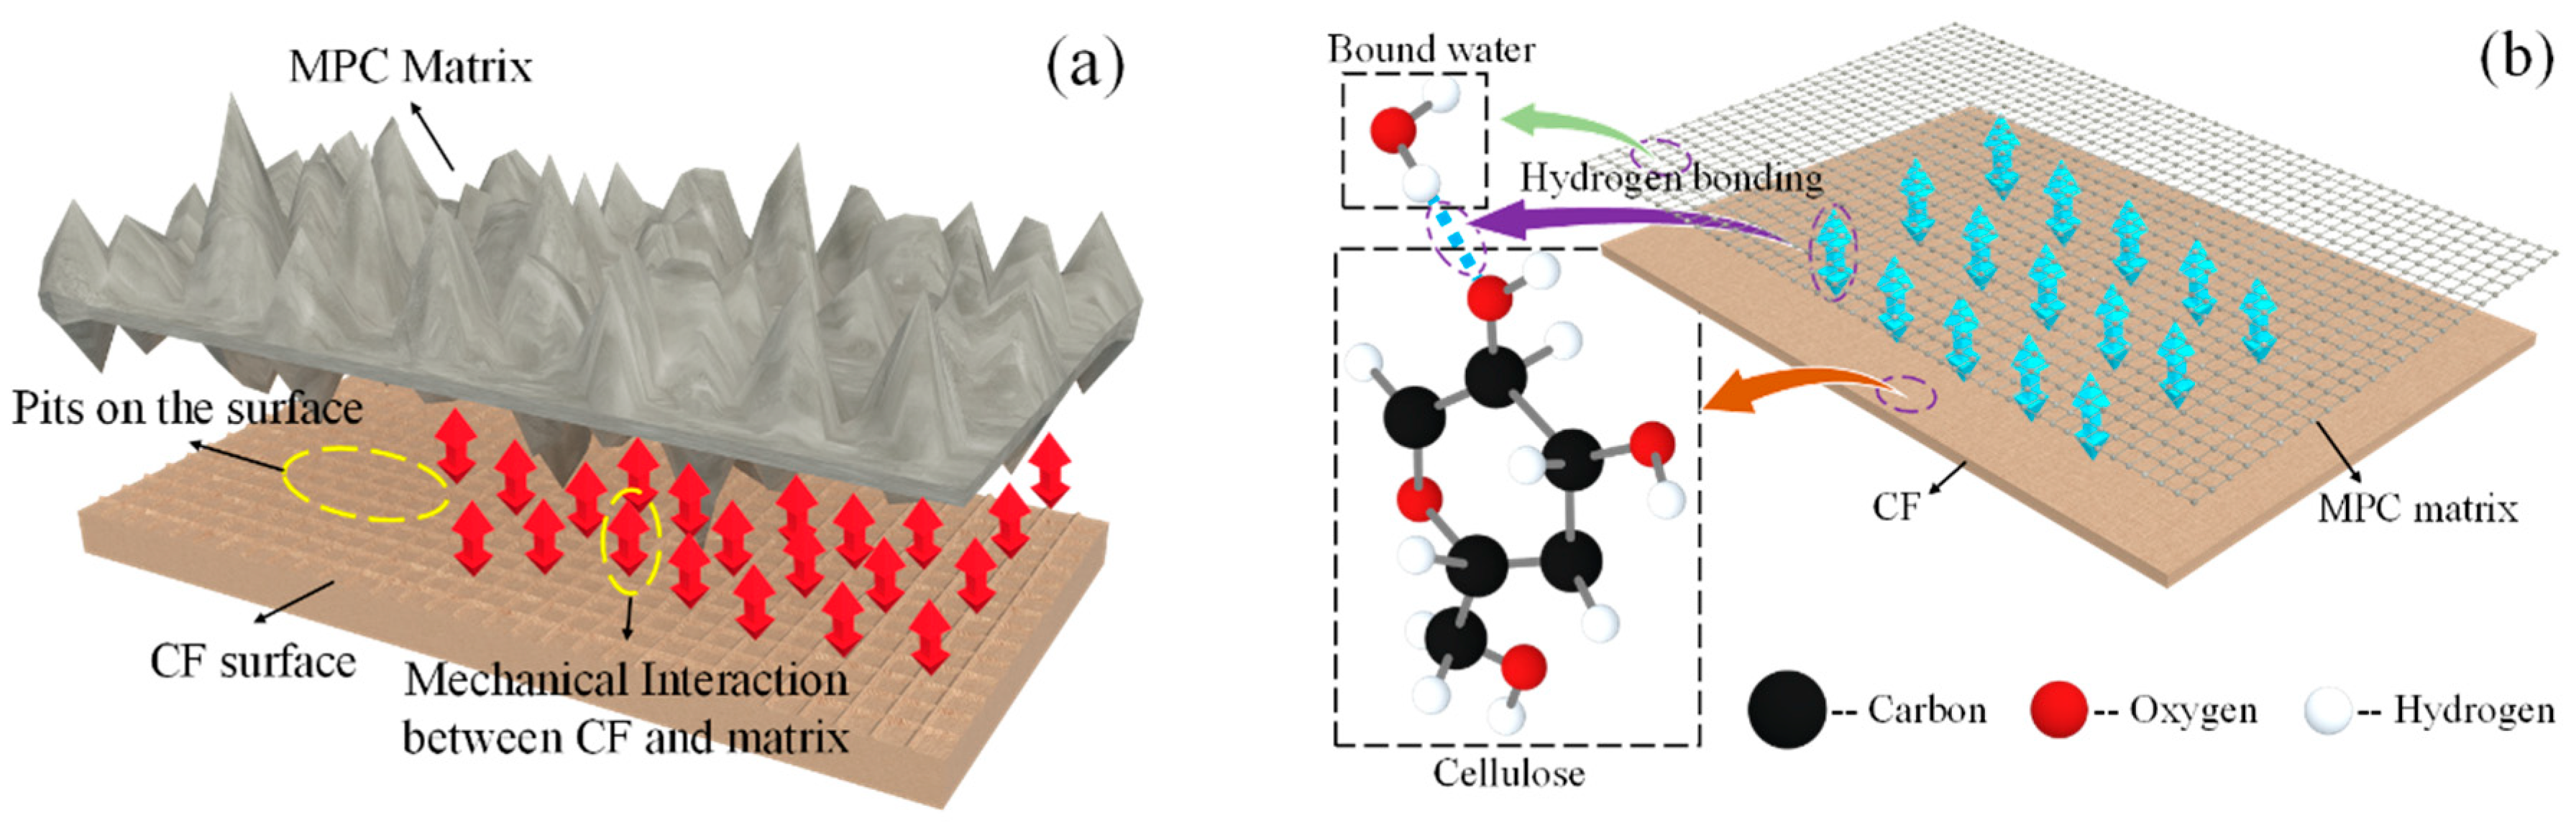
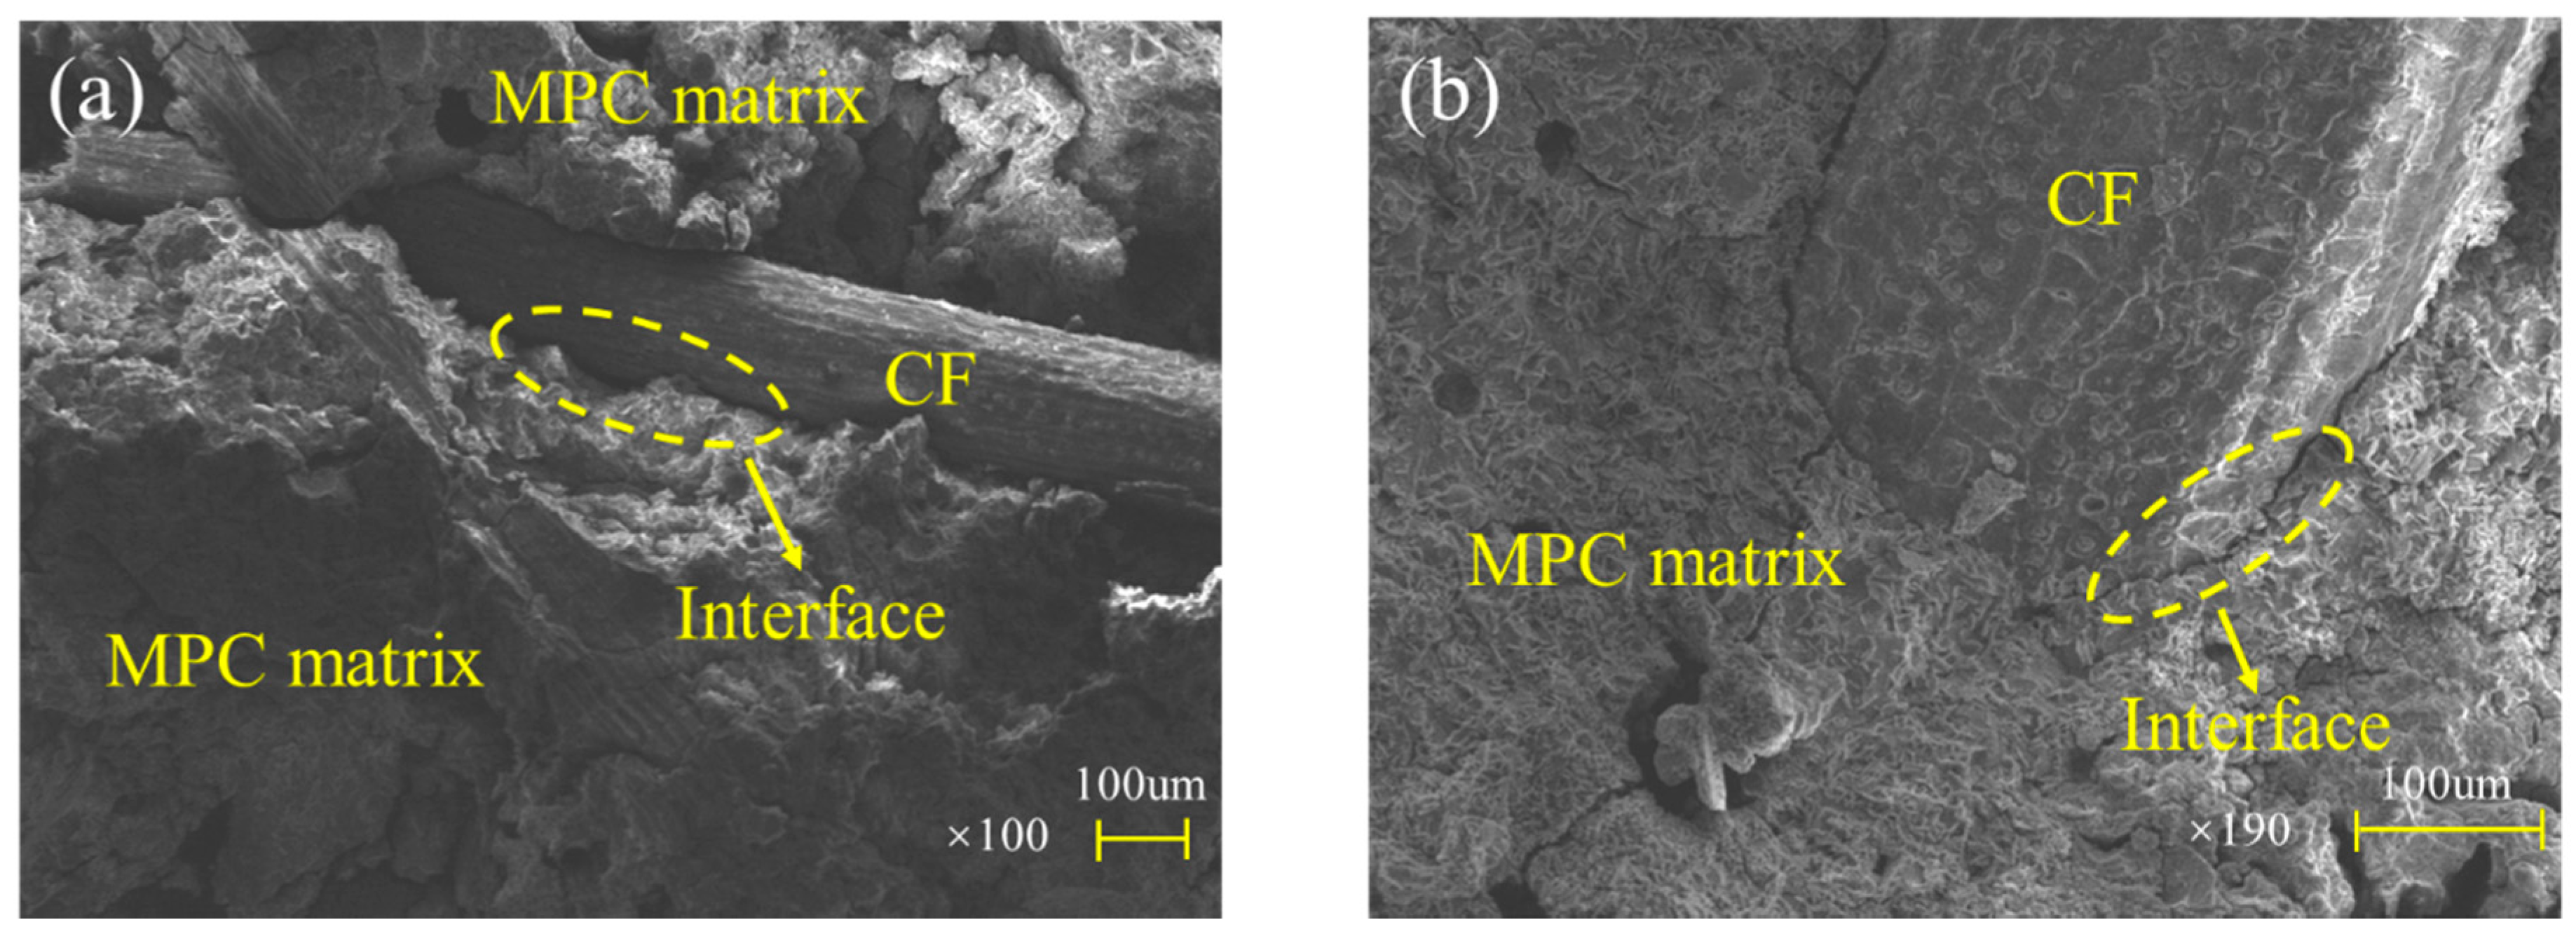
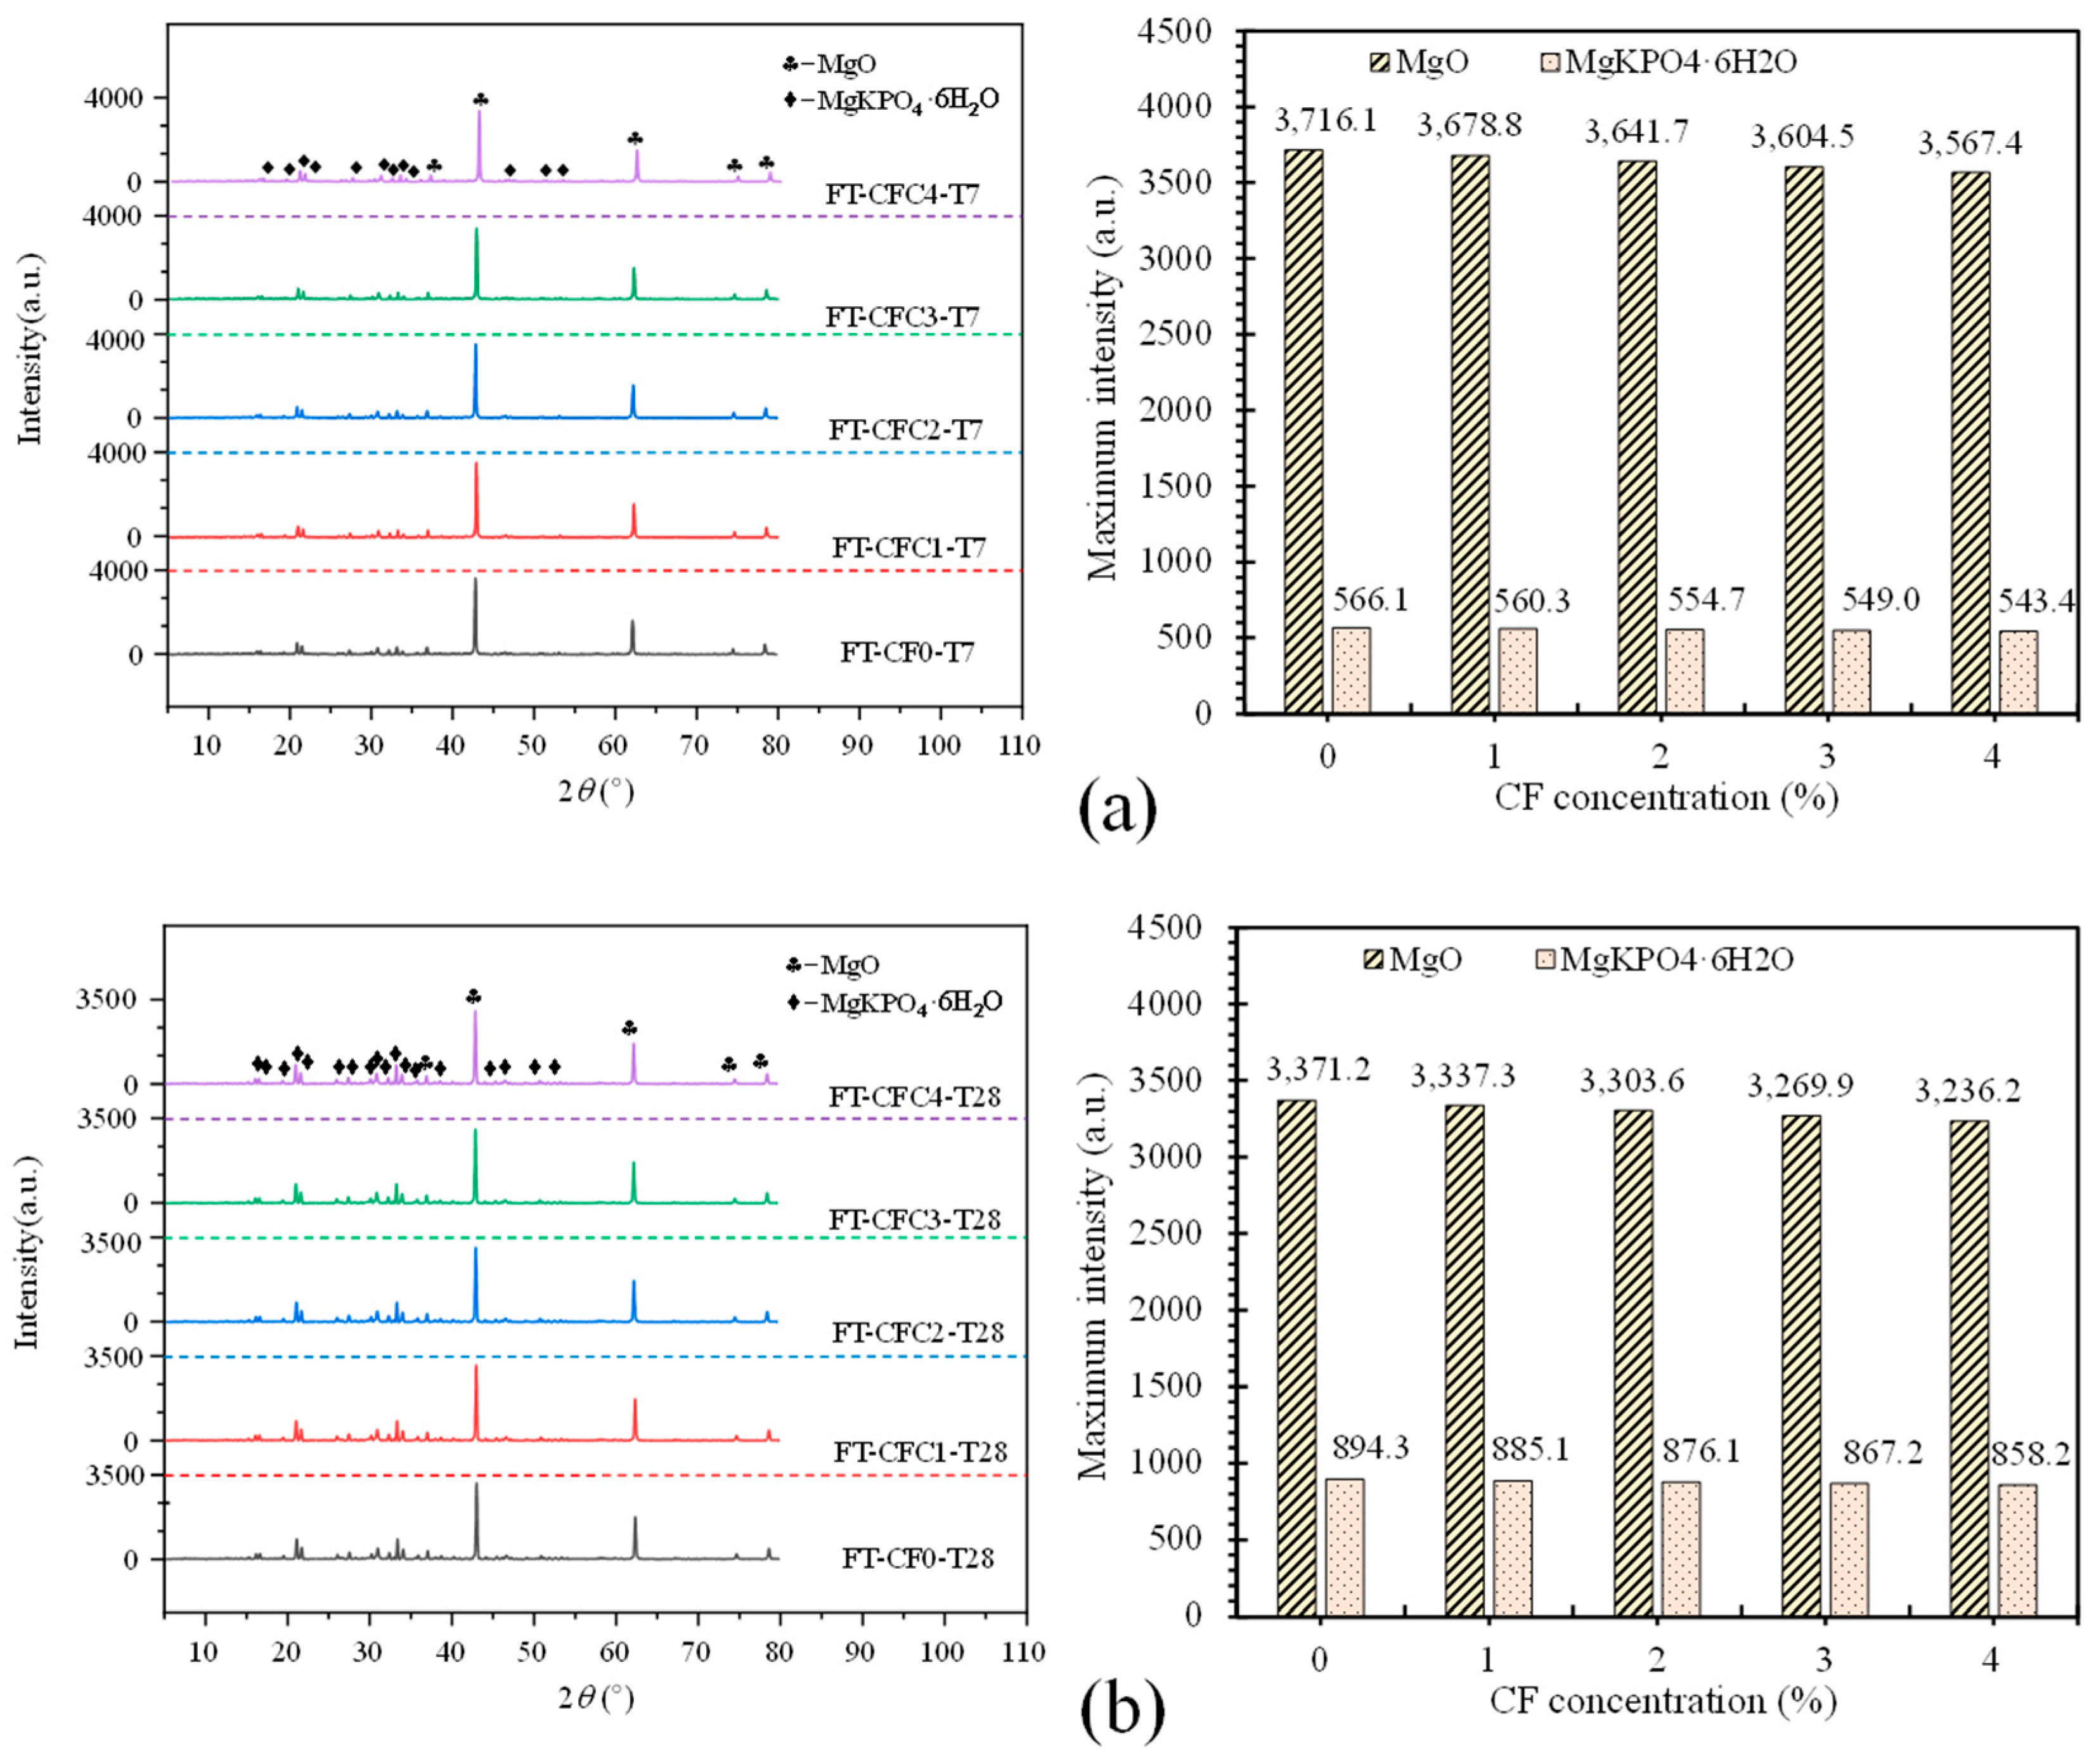
4. Microanalysis and Mechanisms
5. Conclusions
Author Contributions
Funding
Acknowledgments
Conflicts of Interest
References
- Yang, N.; Shi, C.; Yang, J.; Chang, Y. Research progresses in magnesium phosphate cement–based materials. J. Mater. Civil. Eng. 2014, 26, 1–8. [Google Scholar] [CrossRef]
- Ostrowski, N.; Roy, A.; Kumta, P.N. Magnesium phosphate cement systems for hard tissue applications: A review. ACS Biomater. Sci. Eng. 2016, 2, 1067–1083. [Google Scholar] [CrossRef]
- Haque, M.A.; Chen, B. Research progresses on magnesium phosphate cement: A review. Constr. Build. Mater. 2019, 211, 885–898. [Google Scholar] [CrossRef]
- Li, Y.; Li, Y.; Shi, T.; Li, J. Experimental study on mechanical properties and fracture toughness of magnesium phosphate cement. Constr. Build. Mater. 2015, 96, 346–352. [Google Scholar] [CrossRef]
- Feng, H.; Chen, G.; Gao, D.; Zhao, K.; Zhang, C. Mechanical properties of steel fiber-reinforced magnesium phosphate cement mortar. Adv. Civ. Eng. 2018, 2018, 1–11. [Google Scholar] [CrossRef]
- Fang, Y.; Chen, B.; Oderji, S.Y. Experimental research on magnesium phosphate cement mortar reinforced by glass fiber. Constr. Build. Mater. 2018, 188, 729–736. [Google Scholar] [CrossRef]
- Aminul, H.M.; Chen, B.; Ahmad, M.R.; Shah, S.F.A. Evaluating the physical and strength properties of fibre reinforced magnesium phosphate cement mortar considering mass loss. Constr. Build. Mater. 2019, 217, 427–440. [Google Scholar] [CrossRef]
- Péra, J.; Ambroise, J. Fiber-reinforced magnesia-phosphate cement composites for rapid repair. Cement Concrete Comp. 1998, 20, 31–39. [Google Scholar] [CrossRef]
- Ahmad, M.R.; Chen, B.; Haque, M.A. Development of a sustainable and innovant hygrothermal bio-composite featuring the enhanced mechanical properties. J. Clean. Prod. 2019, 229, 128–143. [Google Scholar] [CrossRef]
- Ahmad, M.R.; Chen, B. Effect of silica fume and basalt fiber on the mechanical properties and microstructure of magnesium phosphate cement (mpc) mortar. Constr. Build. Mater. 2018, 190, 466–478. [Google Scholar] [CrossRef]
- Fang, Y.; Cui, P.; Ding, Z.; Zhu, J. Properties of a magnesium phosphate cement-based fire-retardant coating containing glass fiber or glass fiber powder. Constr. Build. Mater. 2018, 162, 553–560. [Google Scholar] [CrossRef]
- Sagar, B.S.V.; Varun, C.S.; Divyaprabandha, K.; Raju, L.S.; Jyothi, Y. Fabrication and characterization of foam coir concrete. AIP Conf. Proc. 2018, 1992, 040010. [Google Scholar]
- Mohamad, N.; Iman, M.A.; Othuman, M.M.A.; Samad, A.A.A.; Rosli, J.A.; Noorwirdawati, A. Mechanical properties and flexure behaviour of lightweight foamed concrete incorporating coir fibre. IOP Conf. Ser. Earth Environ. Sci. 2018, 140, 1–8. [Google Scholar] [CrossRef]
- Abdullah, A.; Jamaludin, S.B.; Noor, M.M.; Hussin, K. Mechanical properties and fracture behaviour of coconut fibre-based green composites. Rom. J. Mater. 2011, 41, 262–268. [Google Scholar]
- Reis, J.M.L. Fracture and flexural characterization of natural fiber-reinforced polymer concrete. Constr. Build. Mater. 2006, 20, 673–678. [Google Scholar] [CrossRef]
- Thanushan, K.; Yogananth, Y.; Sangeeth, P.; Coonghe, J.G.; Sathiparan, N. Strength and Durability Characteristics of Coconut Fiber Reinforced Earth Cement Blocks. J. Nat. Fibers 2019. [Google Scholar] [CrossRef]
- Li, Z.; Wang, L.; Wang, X. Flexural characteristics of coir fiber reinforced cementitious composites. Fibers Polym. 2006, 7, 286–294. [Google Scholar] [CrossRef]
- Sekar, A.; Kandasamy, G. Optimization of Coconut Fiber in Coconut Shell Concrete and Its Mechanical and Bond Properties. Materials 2018, 11, 1726. [Google Scholar] [CrossRef]
- Rajak, D.K.; Pagar, D.D.; Menezes, P.L.; Linul, E. Fiber-Reinforced Polymer Composites: Manufacturing, Properties, and Applications. Polymers 2019, 11, 1667. [Google Scholar] [CrossRef]
- GB/T 17671-1999. Method of Testing Cements-Determination of Strength; China National Standards: Beijing, China, 1999. [Google Scholar]
- Farooqi, M.U.; Ali, M. Effect of pre-treatment and content of wheat straw on energy absorption capability of concrete. Constr. Build. Mater. 2019, 224, 572–583. [Google Scholar] [CrossRef]
- Vantadori, S.; Carpinteri, A.; Zanichelli, A. Lightweight construction materials: Mortar reinforced with date-palm mesh fibres. Theor. Appl. Fract. Mec. 2019, 100, 39–45. [Google Scholar] [CrossRef]
- Zhang, L.W.; Liu, Z.Q.; Geng, T.; Zhang, W.H.; Shang, Q.H.; Deng, Y.G. Study on performances on green and ecological concrete of near surface mounted (NSM) with mpc adhesive based on ecological theory. Fresen. Environ. Bull. 2020, 29, 3840–3852. [Google Scholar]
- Zhang, L.W.; Geng, T.; Liu, Z.Q.; Zhang, W.H.; Shang, Q.H. Effect of silica fume and calcium carbonate whisker on interfacial behavior of near surface-mounted FRP with magnesium phosphate cement. Arch. Civ. Mech. Eng. 2020, 20, 1–16. [Google Scholar] [CrossRef]
- Geng, T.; Jiang, Z.Q.; Li, J.; Zhang, L.W. Effect of fiber type on mechanical properties of magnesium phosphate cements. In Sustainable Building and Structure: Building a Sustainable Tomorrow, 1st ed.; Papadikis, K., Chin, C.S., Galobardes, I., Gong, G., Guo, F., Eds.; Taylor & Francis Group: London, UK, 2019. [Google Scholar]
- ASTM C1609-10. Standard Test Method for Flexural Performance of Fiber-Reinforced Concrete; American Society for Testing and Materials, ASTM International: West Conshohocken, PA, USA, 2010. [Google Scholar]
- ASTM C293-10. Standard Test Method for Flexural Strength of Concrete (Using Simple Beam with Center-Point Loading); American Society for Testing and Materials, ASTM International: West Conshohocken, PA, USA, 2010. [Google Scholar]
- Jiang, Z.Q.; Zhang, L.W.; Geng, T.; Lai, Y.S.; Zheng, W.L.; Huang, M. Study on the Compressive Properties of Magnesium Phosphate Cement Mixing with Eco-Friendly Coir Fiber Considering Fiber Length. Materials 2020, 13, 3194. [Google Scholar] [CrossRef] [PubMed]
- Zhang, L.W.; Jiang, Z.Q.; Wu, H.; Zhang, W.H.; Lai, Y.S.; Zheng, W.L.; Li, J. Flexural Properties of Renewable Coir Fiber Reinforced Magnesium Phosphate Cement, Considering Fiber Length. Materials 2020, 13, 3692. [Google Scholar] [CrossRef]
- Wu, Z.; Shi, C.; Kamal, H.; Khayat, K.H. Multi-scale investigation of microstructure, fiber pullout behavior, and mechanical properties of ultra-high-performance concrete with nano-CaCO3 particles. Cement Concrete Comp. 2018, 86, 255–265. [Google Scholar] [CrossRef]
- Alomayri, T.; Shaikh, F.U.A.; Low, I.M. Characterisation of cotton fibre-reinforced geopolymer composites. Compos. Part B-Eng. 2013, 50, 1–6. [Google Scholar] [CrossRef]
- Swamy, P.A.V.B. Efficient inference in a random coefficient regression model. Econometrica 1970, 38, 311–323. [Google Scholar] [CrossRef]
- Xu, B.; Lothenbach, B.; Leemann, A.; Winnefeld, F. Reaction mechanism of magnesium potassium phosphate cement with high magnesium-to-phosphate ratio. Cement Concrete Res. 2018, 108, 140–151. [Google Scholar] [CrossRef]
- Asasutjarit, C.; Hirunlabh, J.; Khedari, J.; Charoenvai, S.; Zeghmati, B.; Shin, U.C. Development of coconut coir-based lightweight cement board. Constr. Build. Mater. 2007, 21, 277–288. [Google Scholar] [CrossRef]


| Group | Set | Specimen Number | Curing Age (Day) | Coir Fiber (CF) | ||
|---|---|---|---|---|---|---|
| L1 (mm) | VC2 (%) | Mass (g) | ||||
| T7 | CF0-T7 | FT-CF0-T7-1 | 7 | 0 | 0 | 0 |
| FT-CF0-T7-2 | ||||||
| FT-CF0-T7-3 | ||||||
| CFC1-T7 | FT-CFC1-T7-1 | 20 | 1 | 3 | ||
| FT-CFC1-T7-2 | ||||||
| FT-CFC1-T7-3 | ||||||
| CFC2-T7 | FT-CFC2-T7-1 | 2 | 6 | |||
| FT-CFC2-T7-2 | ||||||
| FT-CFC2-T7-3 | ||||||
| CFC3-T7 | FT-CFC3-T7-1 | 3 | 9 | |||
| FT-CFC3-T7-2 | ||||||
| FT-CFC3-T7-3 | ||||||
| CFC4-T7 | FT-CFC4-T7-1 | 4 | 12 | |||
| FT-CFC4-T7-2 | ||||||
| FT-CFC4-T7-3 | ||||||
| T28 | CF0-T28 | FT-CF0-T28-1 | 28 | 0 | 0 | 0 |
| FT-CF0-T28-2 | ||||||
| FT-CF0-T28-3 | ||||||
| CFC1-T28 | FT-CFC1-T28-1 | 20 | 1 | 3 | ||
| FT-CFC1-T28-2 | ||||||
| FT-CFC1-T28-3 | ||||||
| CFC2-T28 | FT-CFC2-T28-1 | 2 | 6 | |||
| FT-CFC2-T28-2 | ||||||
| FT-CFC2-T28-3 | ||||||
| CFC3-T28 | FT-CFC3-T28-1 | 3 | 9 | |||
| FT-CFC3-T28-2 | ||||||
| FT-CFC3-T28-3 | ||||||
| CFC4-T28 | FT-CFC4-T28-1 | 4 | 12 | |||
| FT-CFC4-T28-2 | ||||||
| FT-CFC4-T28-3 | ||||||
| MgO | KH2PO4 | Borax | Fly Ash (FA) | Water |
|---|---|---|---|---|
| 1171.87 | 797.26 | 117.18 | 295.31 | 328.3 |
| Compositions | MgO | Al2O3 | Fe2O3 | CaO | SiO2 | LOI |
| Mass of Concentration (%) | 96.25 | 0.29 | 1.09 | 1.18 | 1.16 | 0.03 |
| Compositions | SiO2 | Al2O3 | Fe2O3 | CaO | TiO2 | MgO | SO3 | LOI |
| Mass of Concentration (%) | 56.74 | 24.58 | 6.55 | 4.87 | 1.86 | 3.3 | 0.8 | 1.3 |
| Diameter (µm) | Density (kg/m3) | Tensile Strength (MPa) | Elasticity Modulus (GPa) | Elongation (%) |
|---|---|---|---|---|
| 150–350 | 1200 | 112–146 | 2.3–3.4 | 14–28 |
Publisher’s Note: MDPI stays neutral with regard to jurisdictional claims in published maps and institutional affiliations. |
© 2020 by the authors. Licensee MDPI, Basel, Switzerland. This article is an open access article distributed under the terms and conditions of the Creative Commons Attribution (CC BY) license (http://creativecommons.org/licenses/by/4.0/).
Share and Cite
Zhang, L.; Jiang, Z.; Zhang, W.; Peng, S.; Chen, P. Flexural Properties and Microstructure Mechanisms of Renewable Coir-Fiber-Reinforced Magnesium Phosphate Cement-Based Composite Considering Curing Ages. Polymers 2020, 12, 2556. https://doi.org/10.3390/polym12112556
Zhang L, Jiang Z, Zhang W, Peng S, Chen P. Flexural Properties and Microstructure Mechanisms of Renewable Coir-Fiber-Reinforced Magnesium Phosphate Cement-Based Composite Considering Curing Ages. Polymers. 2020; 12(11):2556. https://doi.org/10.3390/polym12112556
Chicago/Turabian StyleZhang, Liwen, Zuqian Jiang, Wenhua Zhang, Sixue Peng, and Pengfei Chen. 2020. "Flexural Properties and Microstructure Mechanisms of Renewable Coir-Fiber-Reinforced Magnesium Phosphate Cement-Based Composite Considering Curing Ages" Polymers 12, no. 11: 2556. https://doi.org/10.3390/polym12112556
APA StyleZhang, L., Jiang, Z., Zhang, W., Peng, S., & Chen, P. (2020). Flexural Properties and Microstructure Mechanisms of Renewable Coir-Fiber-Reinforced Magnesium Phosphate Cement-Based Composite Considering Curing Ages. Polymers, 12(11), 2556. https://doi.org/10.3390/polym12112556