Correlation of the Abbe Number, the Refractive Index, and Glass Transition Temperature to the Degree of Polymerization of Norbornane in Polycarbonate Polymers


Abstract
1. Introduction
2. Experimental Section
2.1. General
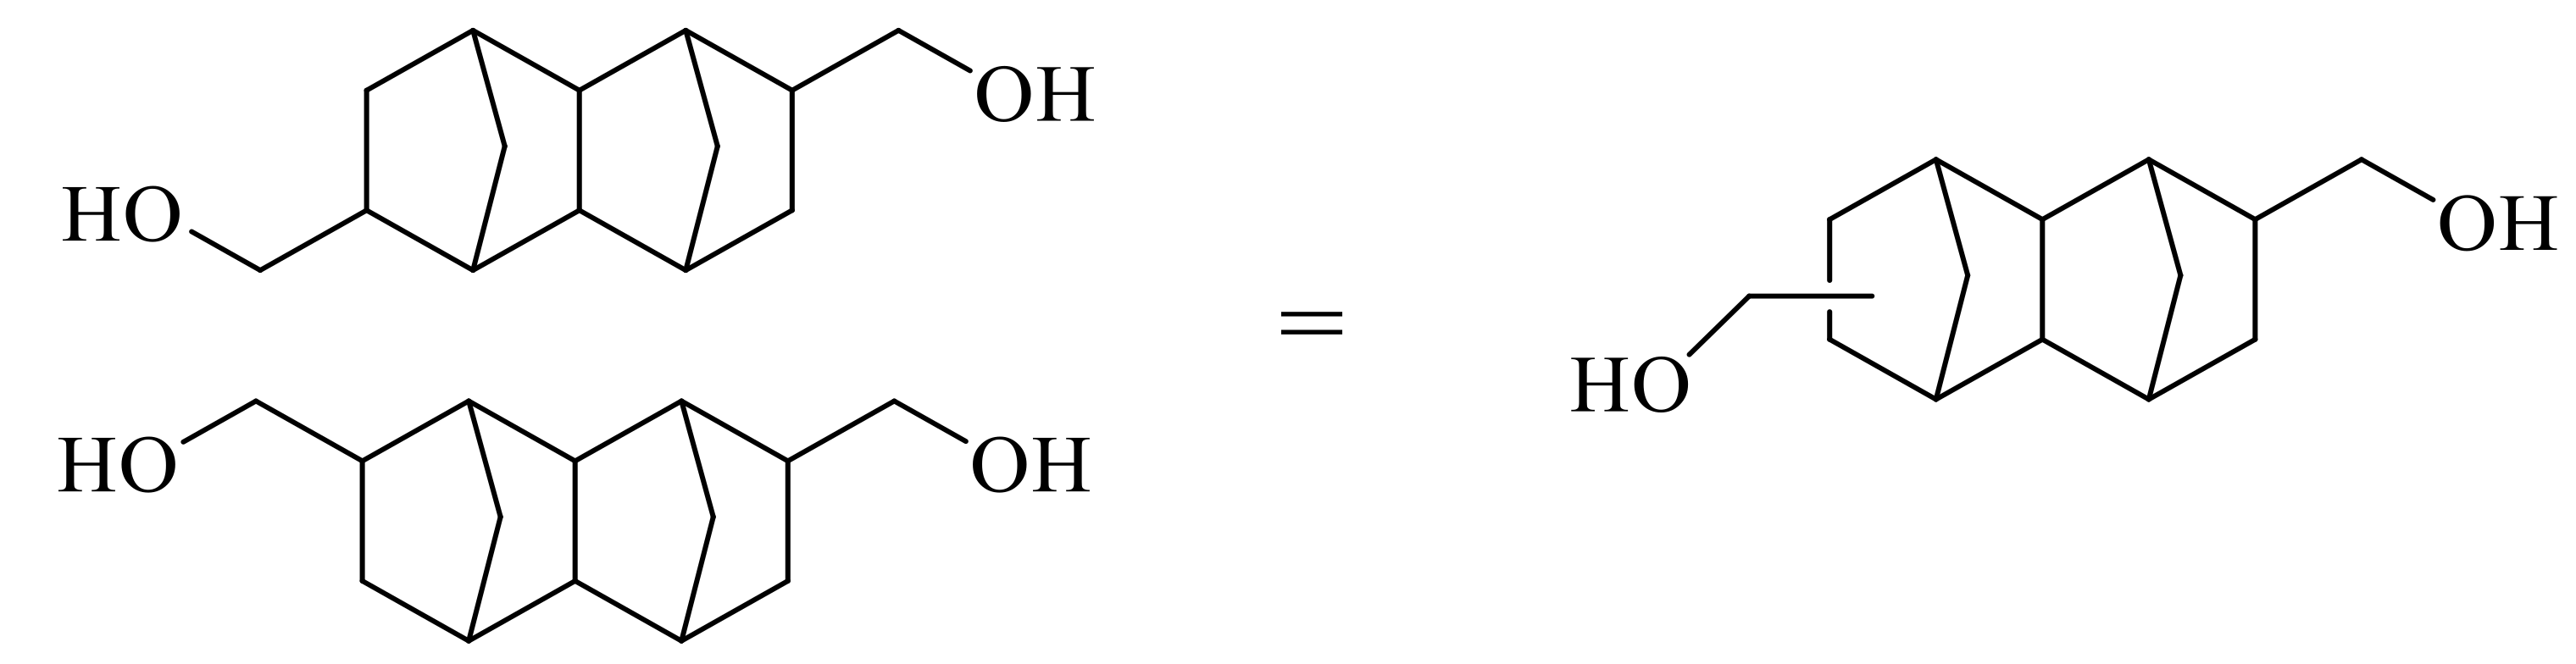
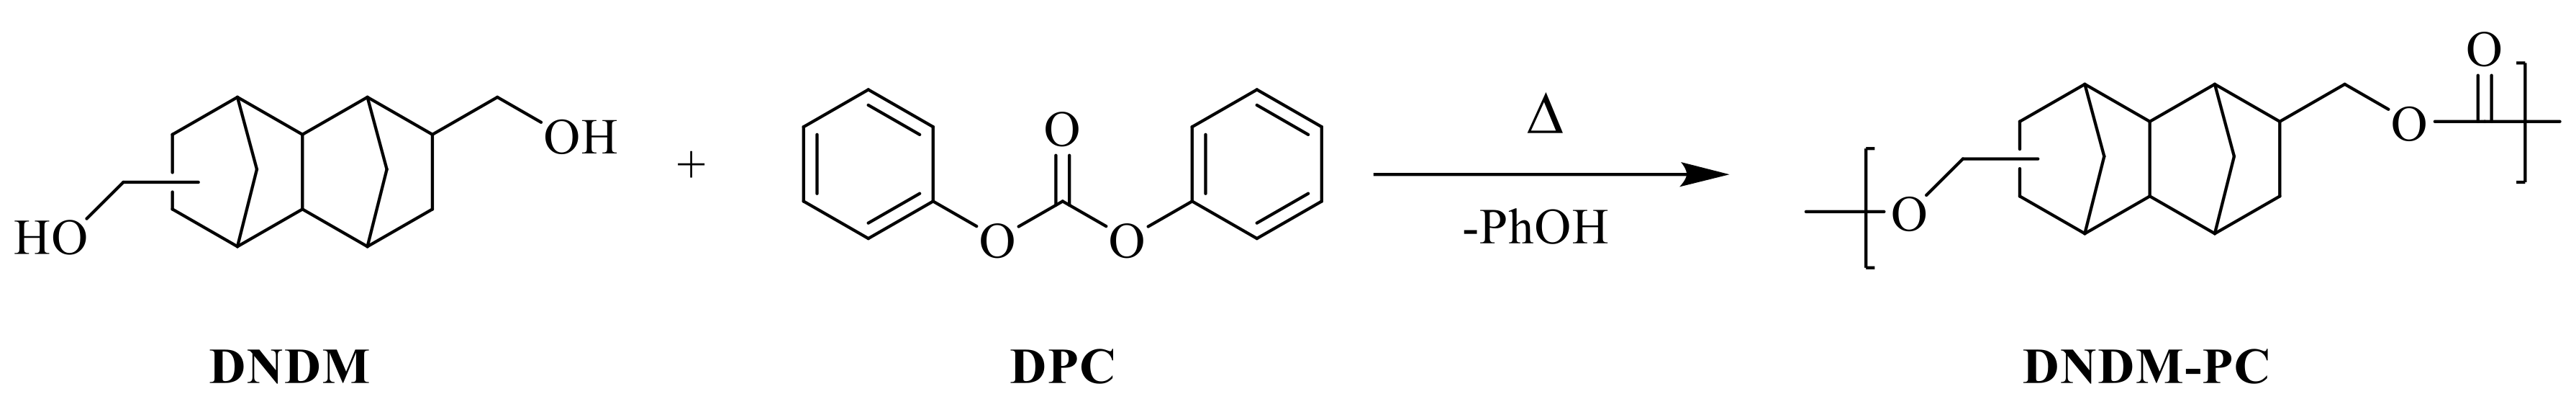
2.2. Monomer Synthesis
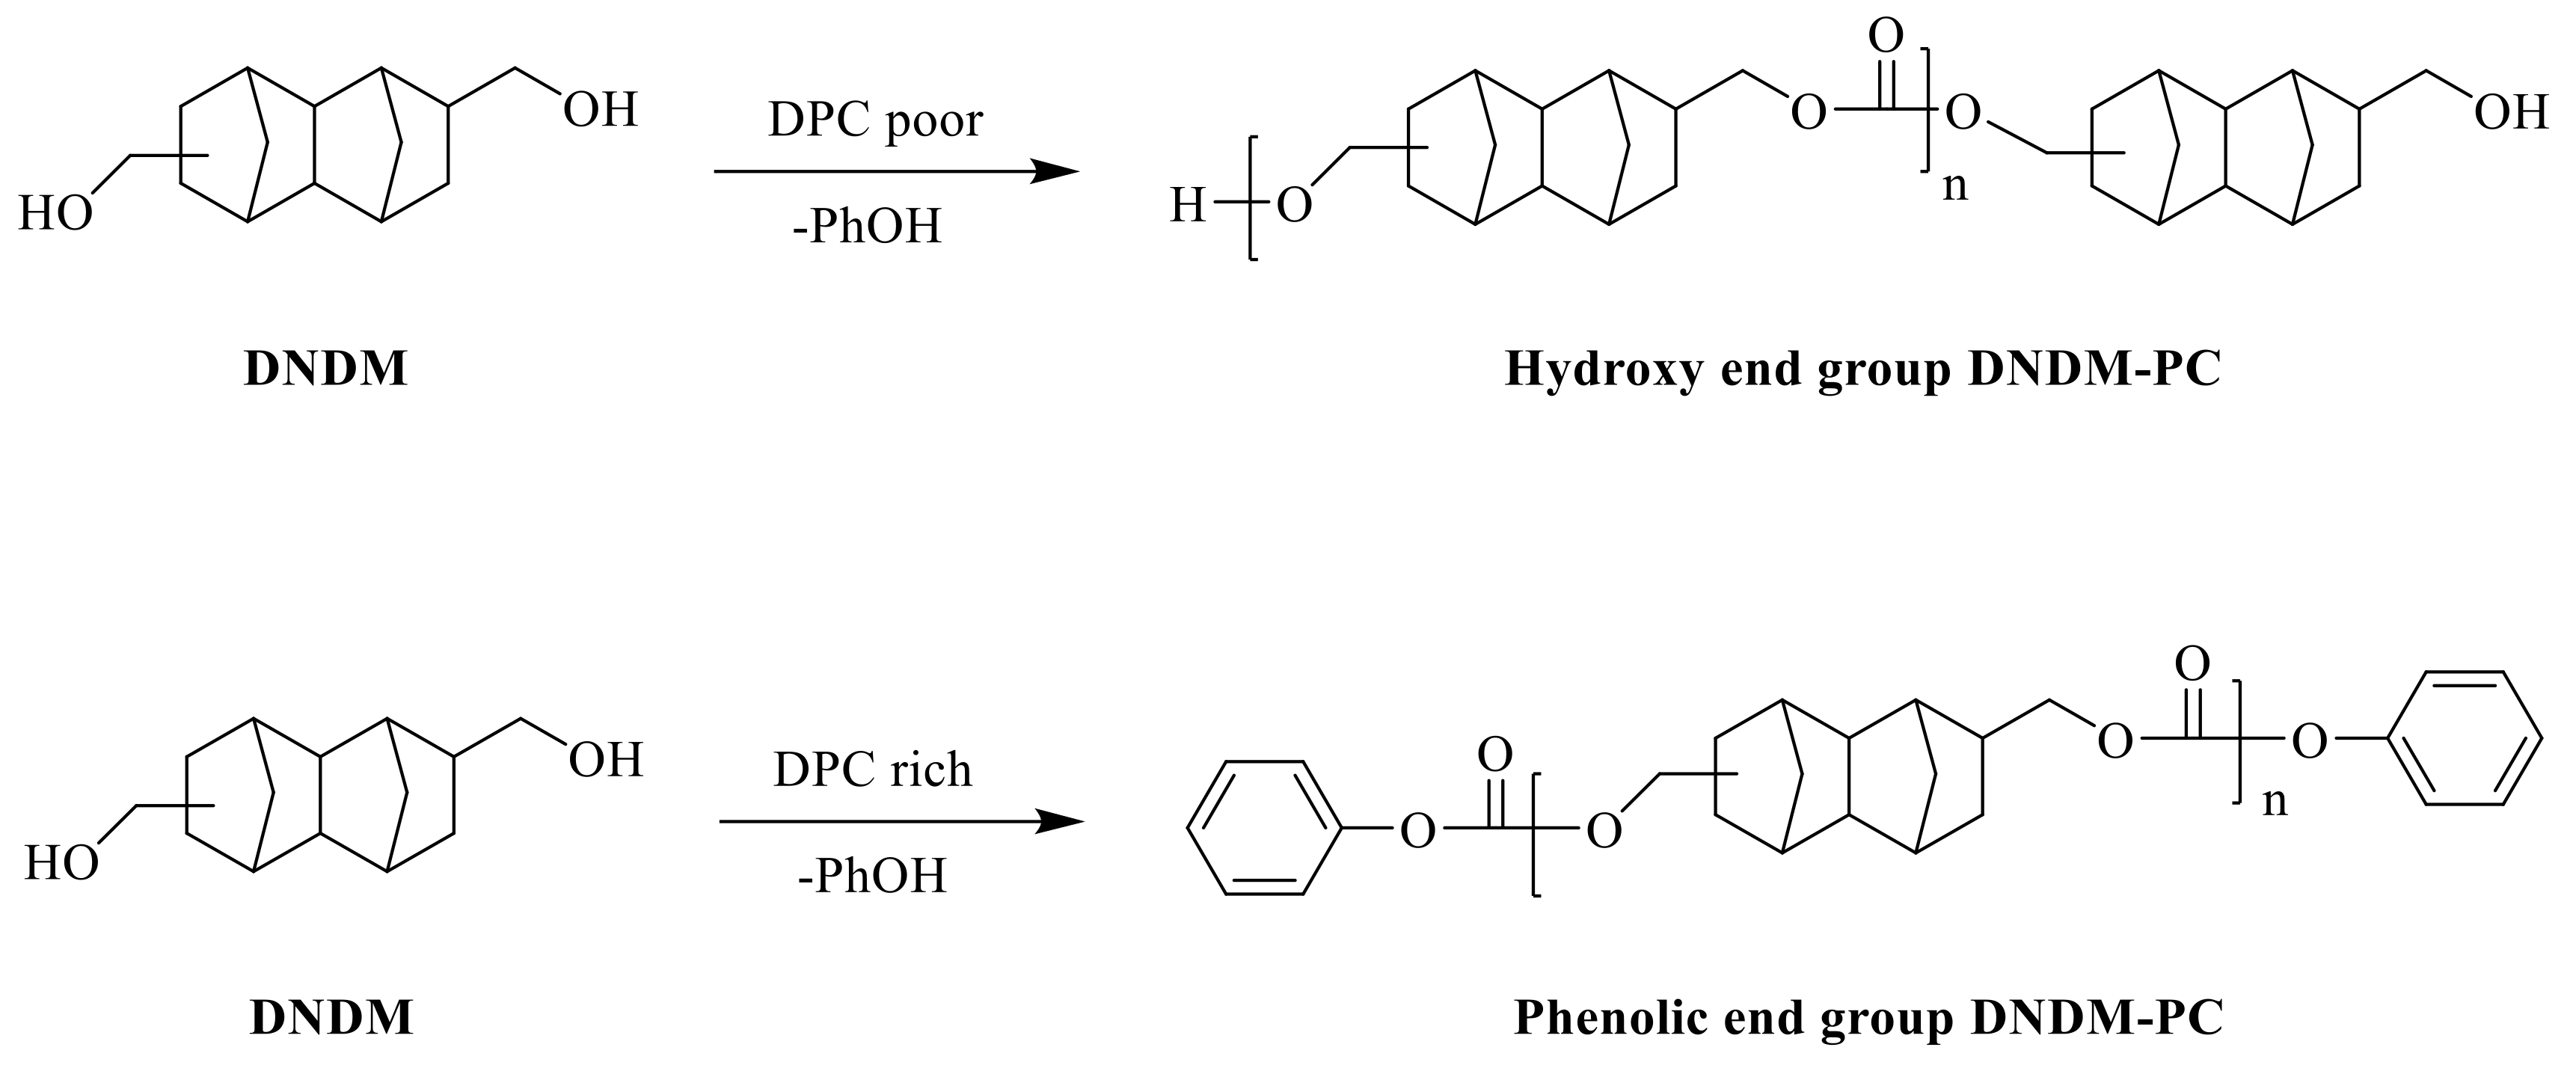
2.3. Oligomer and Polymer Synthesis
3. Results and Discussions
- a is the molecular weight of carbonyl groups; 28.01.
- b is the molecular weight of DNDM; 222.33.
- c is the molecular weight of hydrogen; 1.01.
- d is the molecular weight of benzene ring; 93.11.
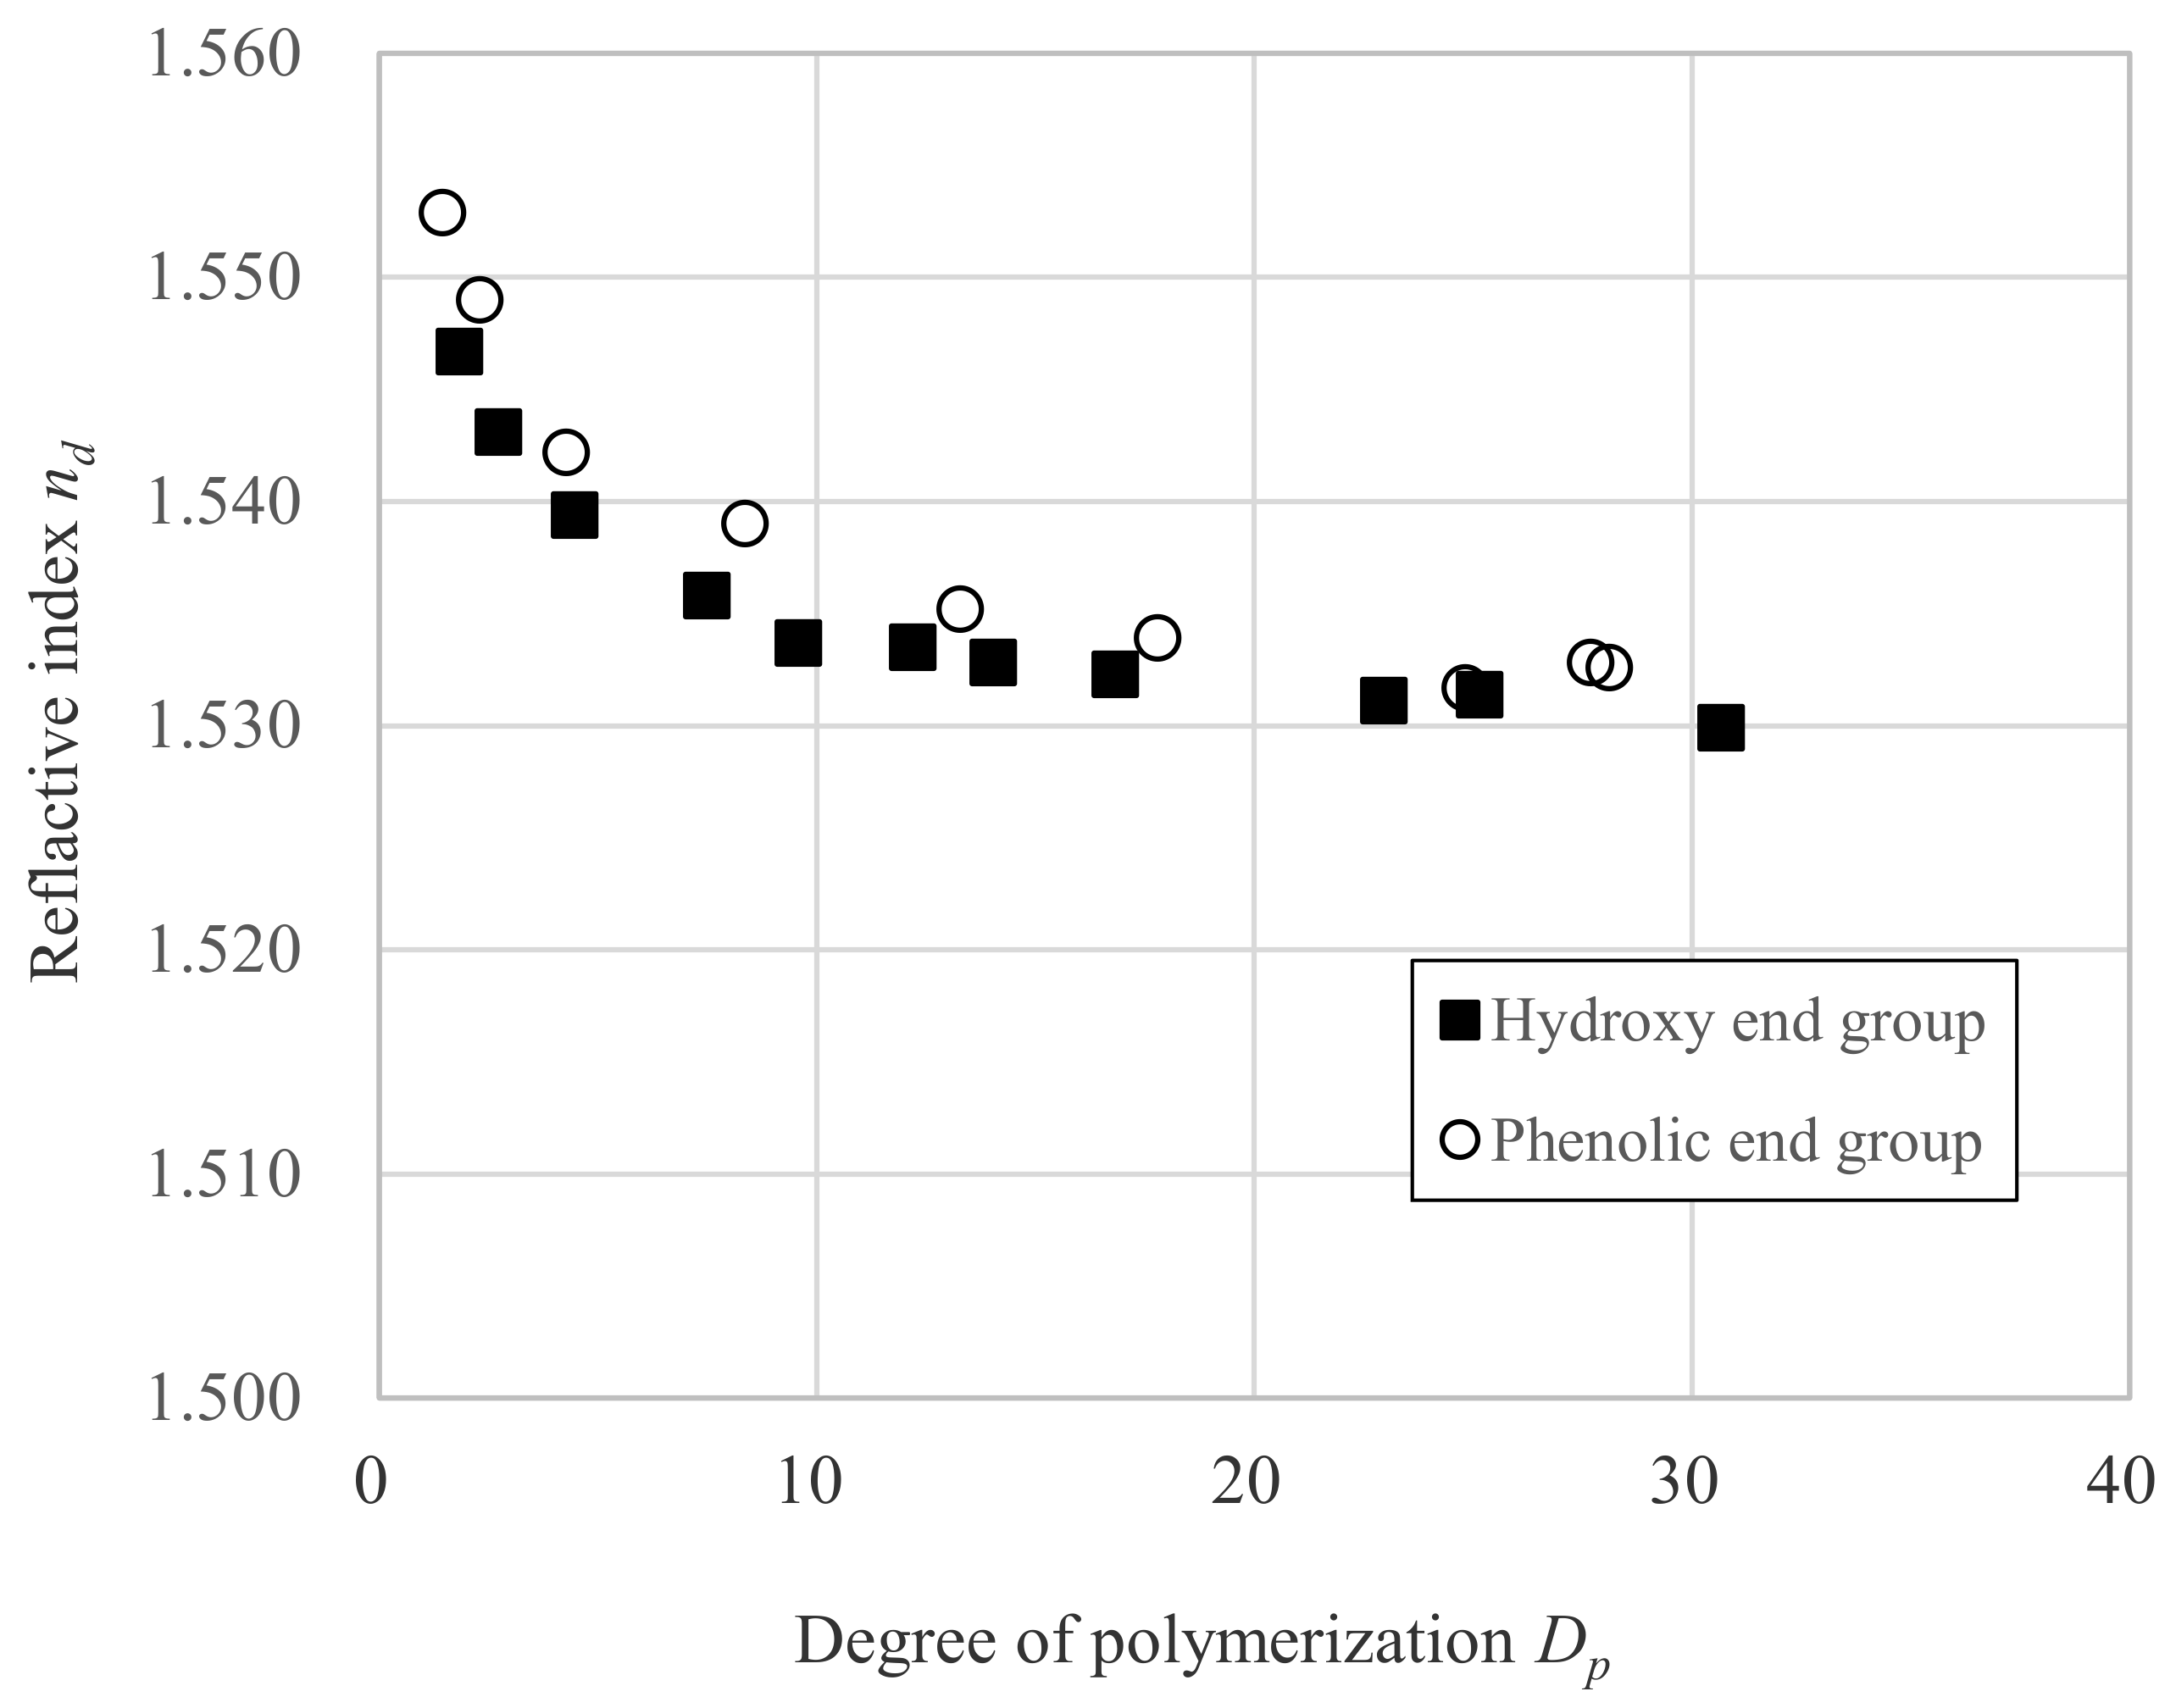
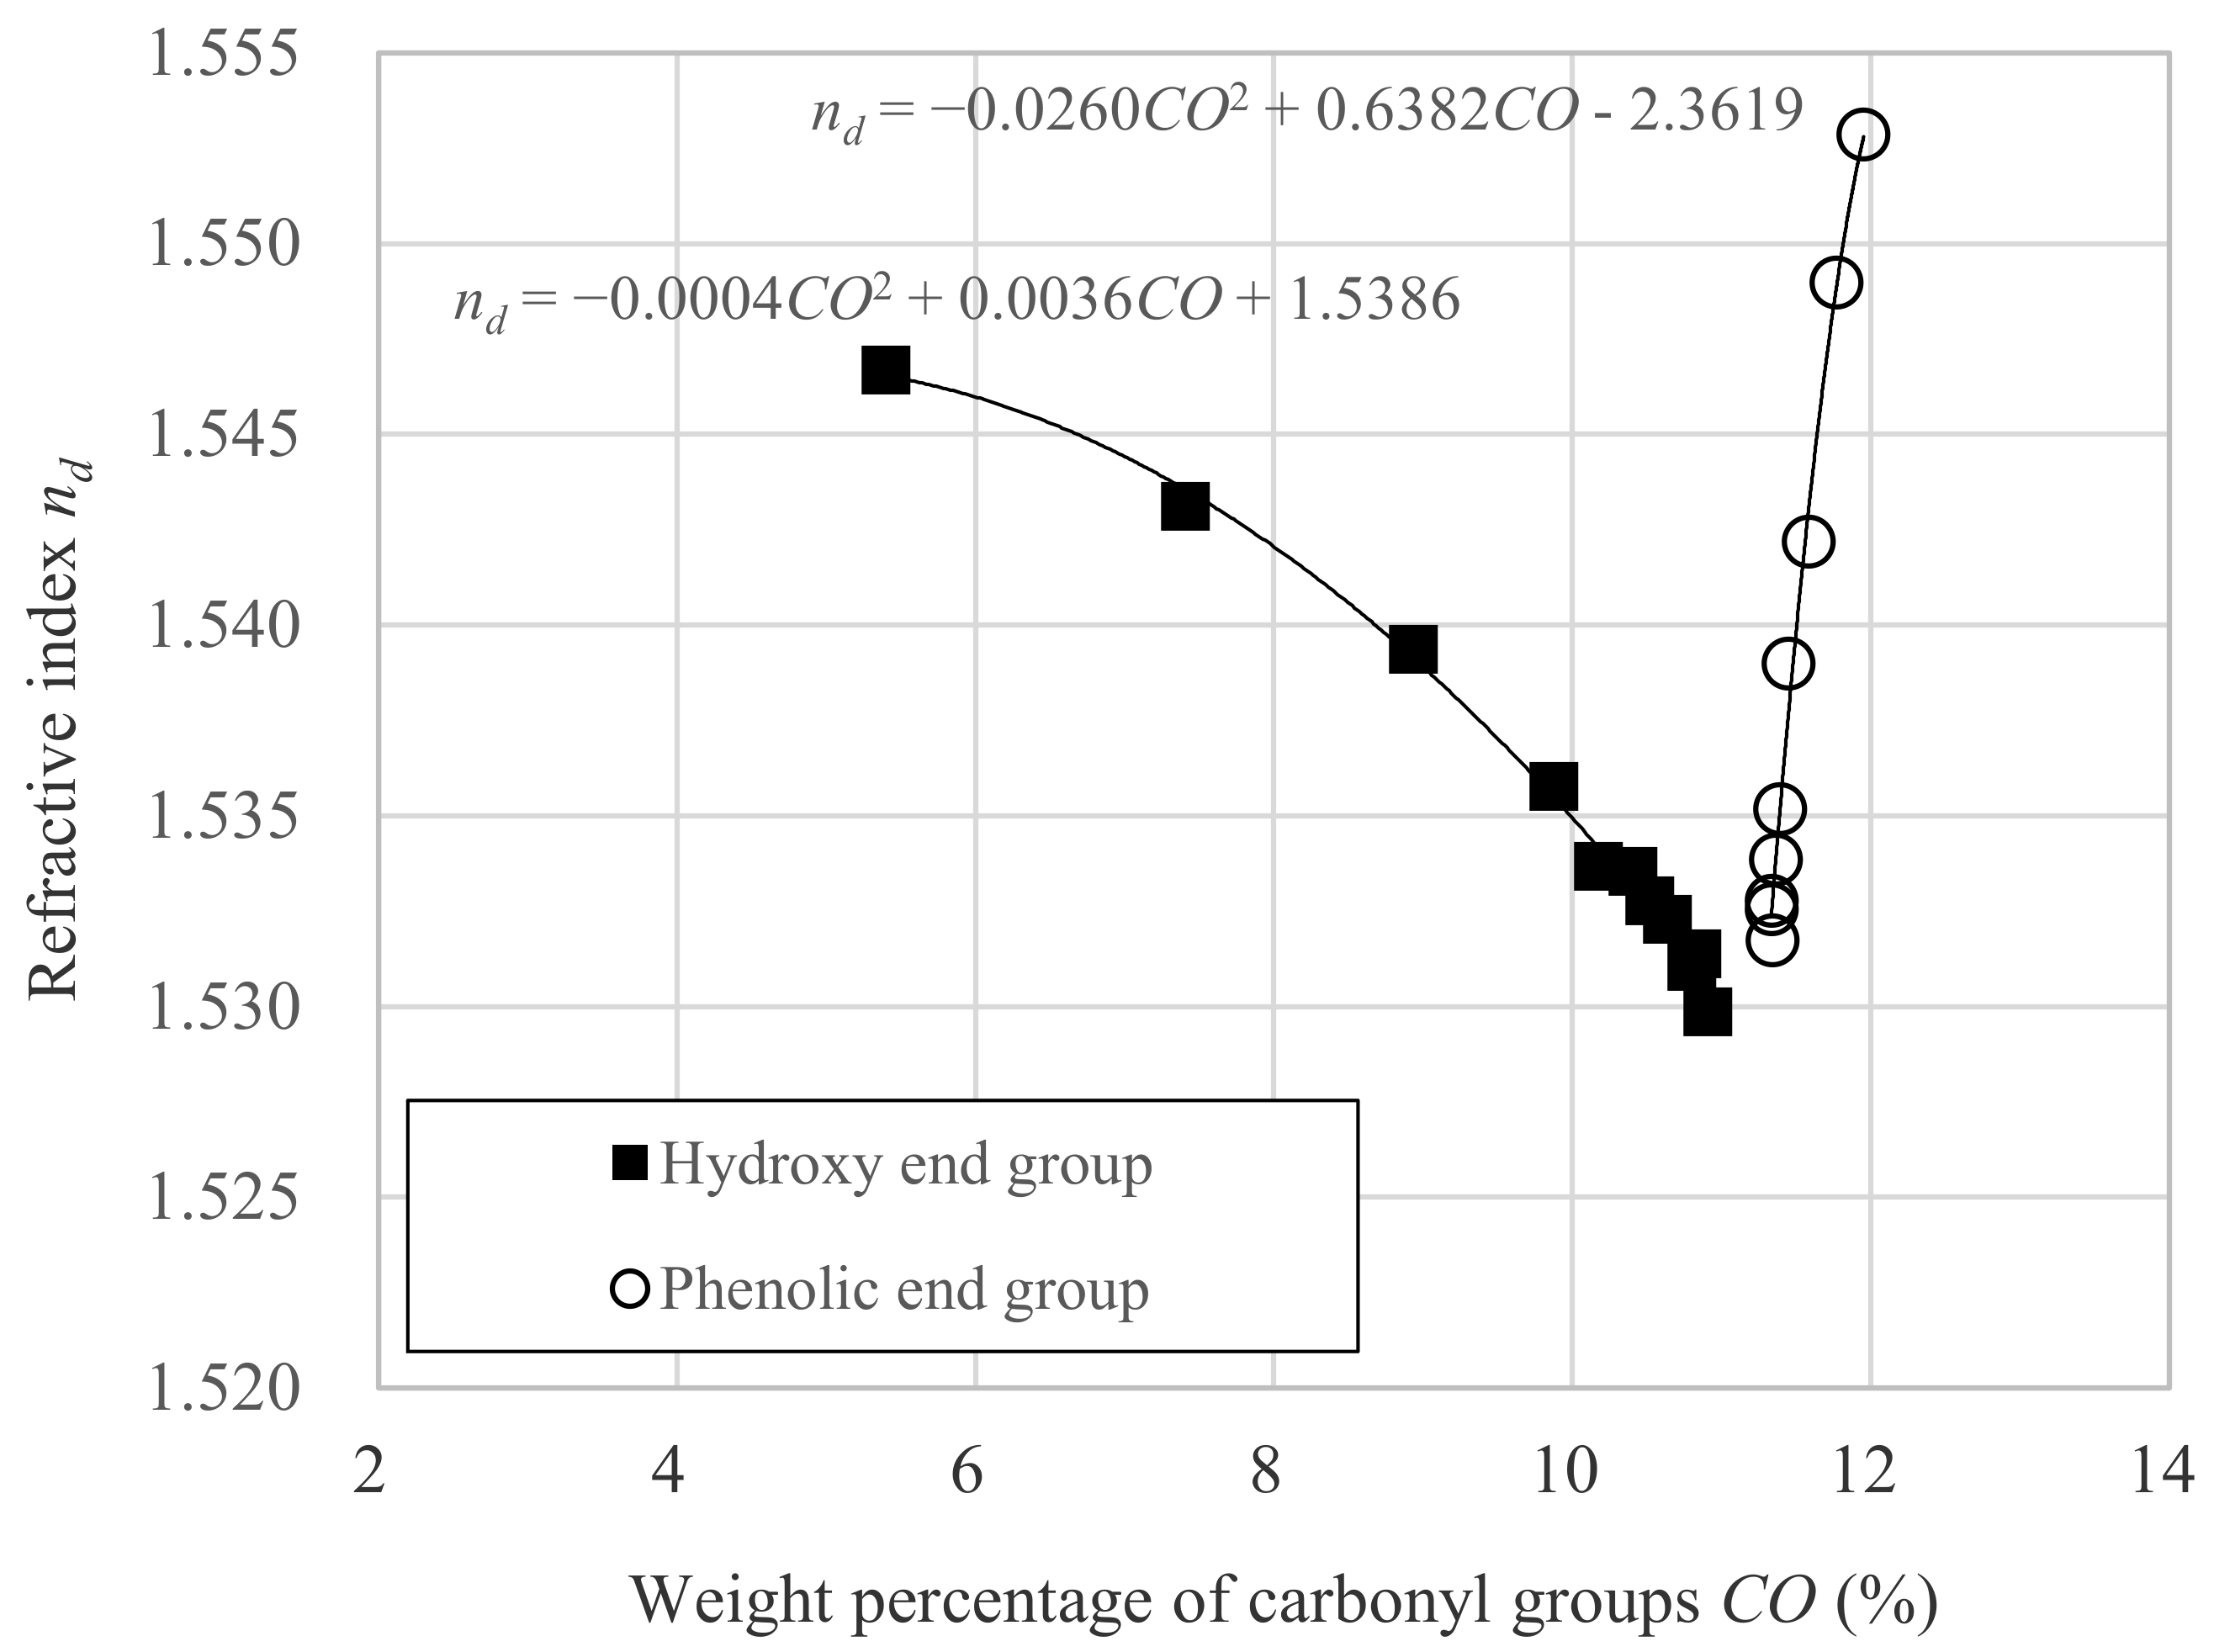
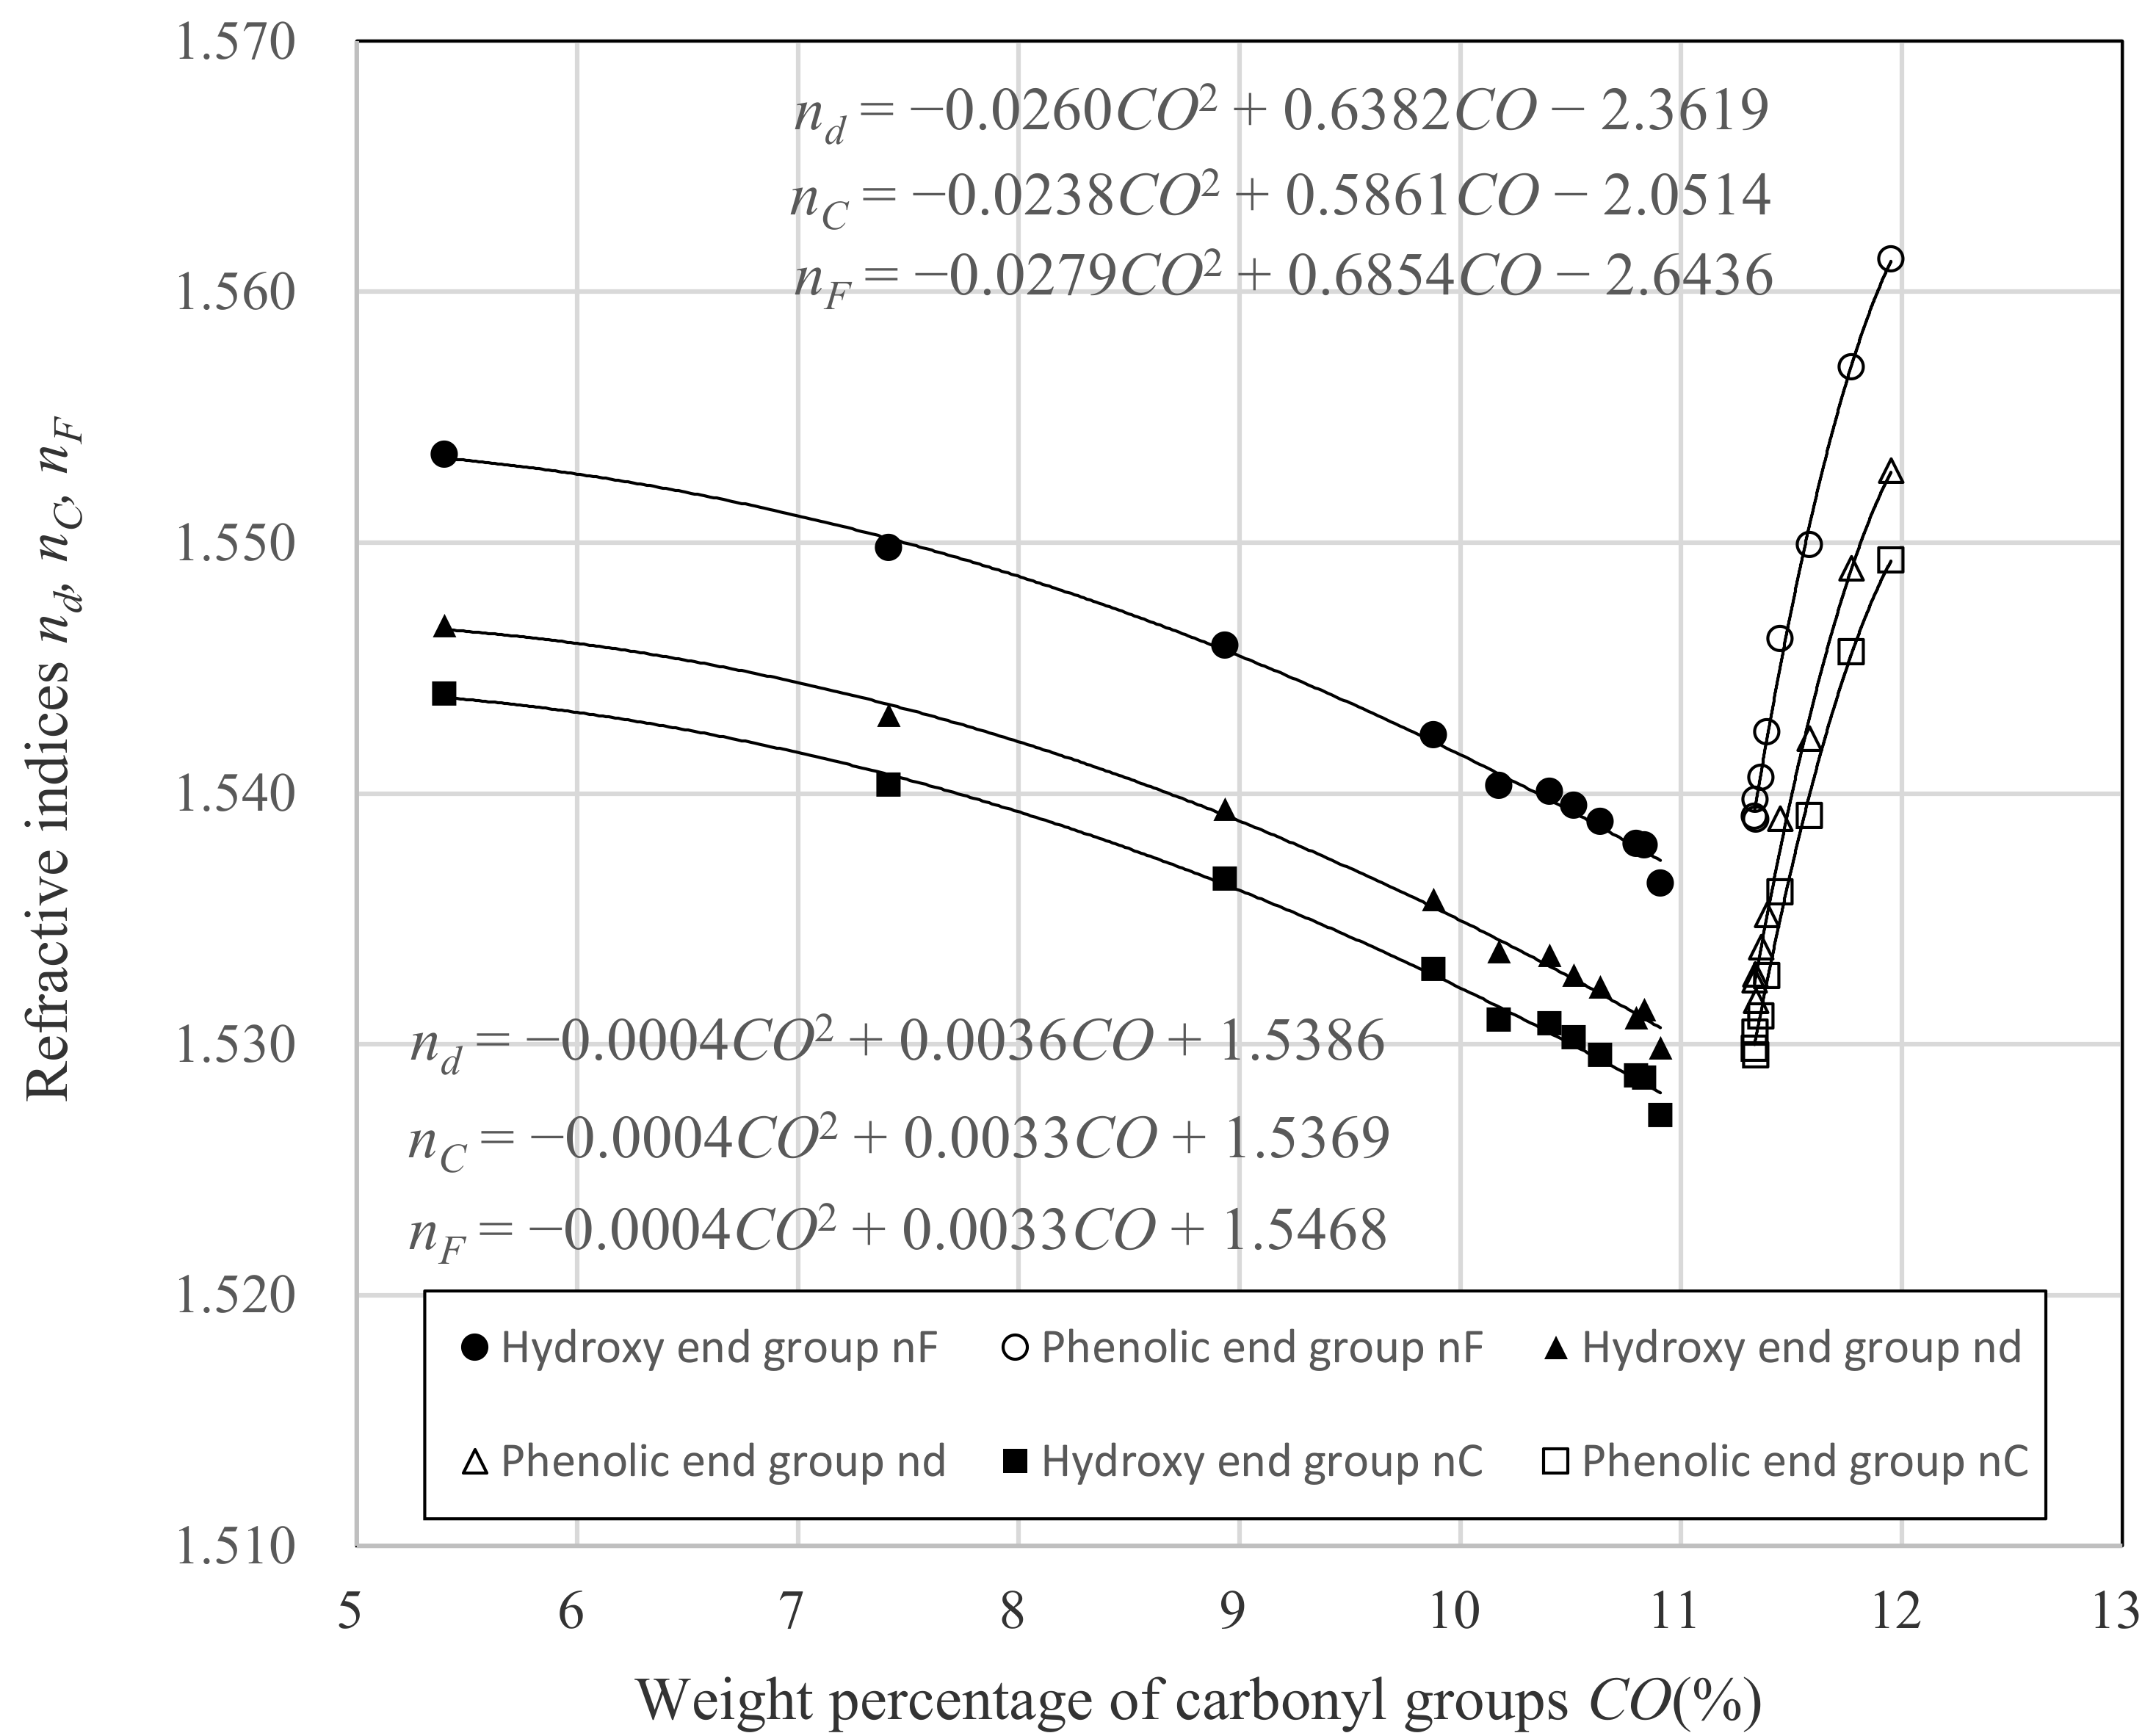
3.1. Relation between nd and Dp
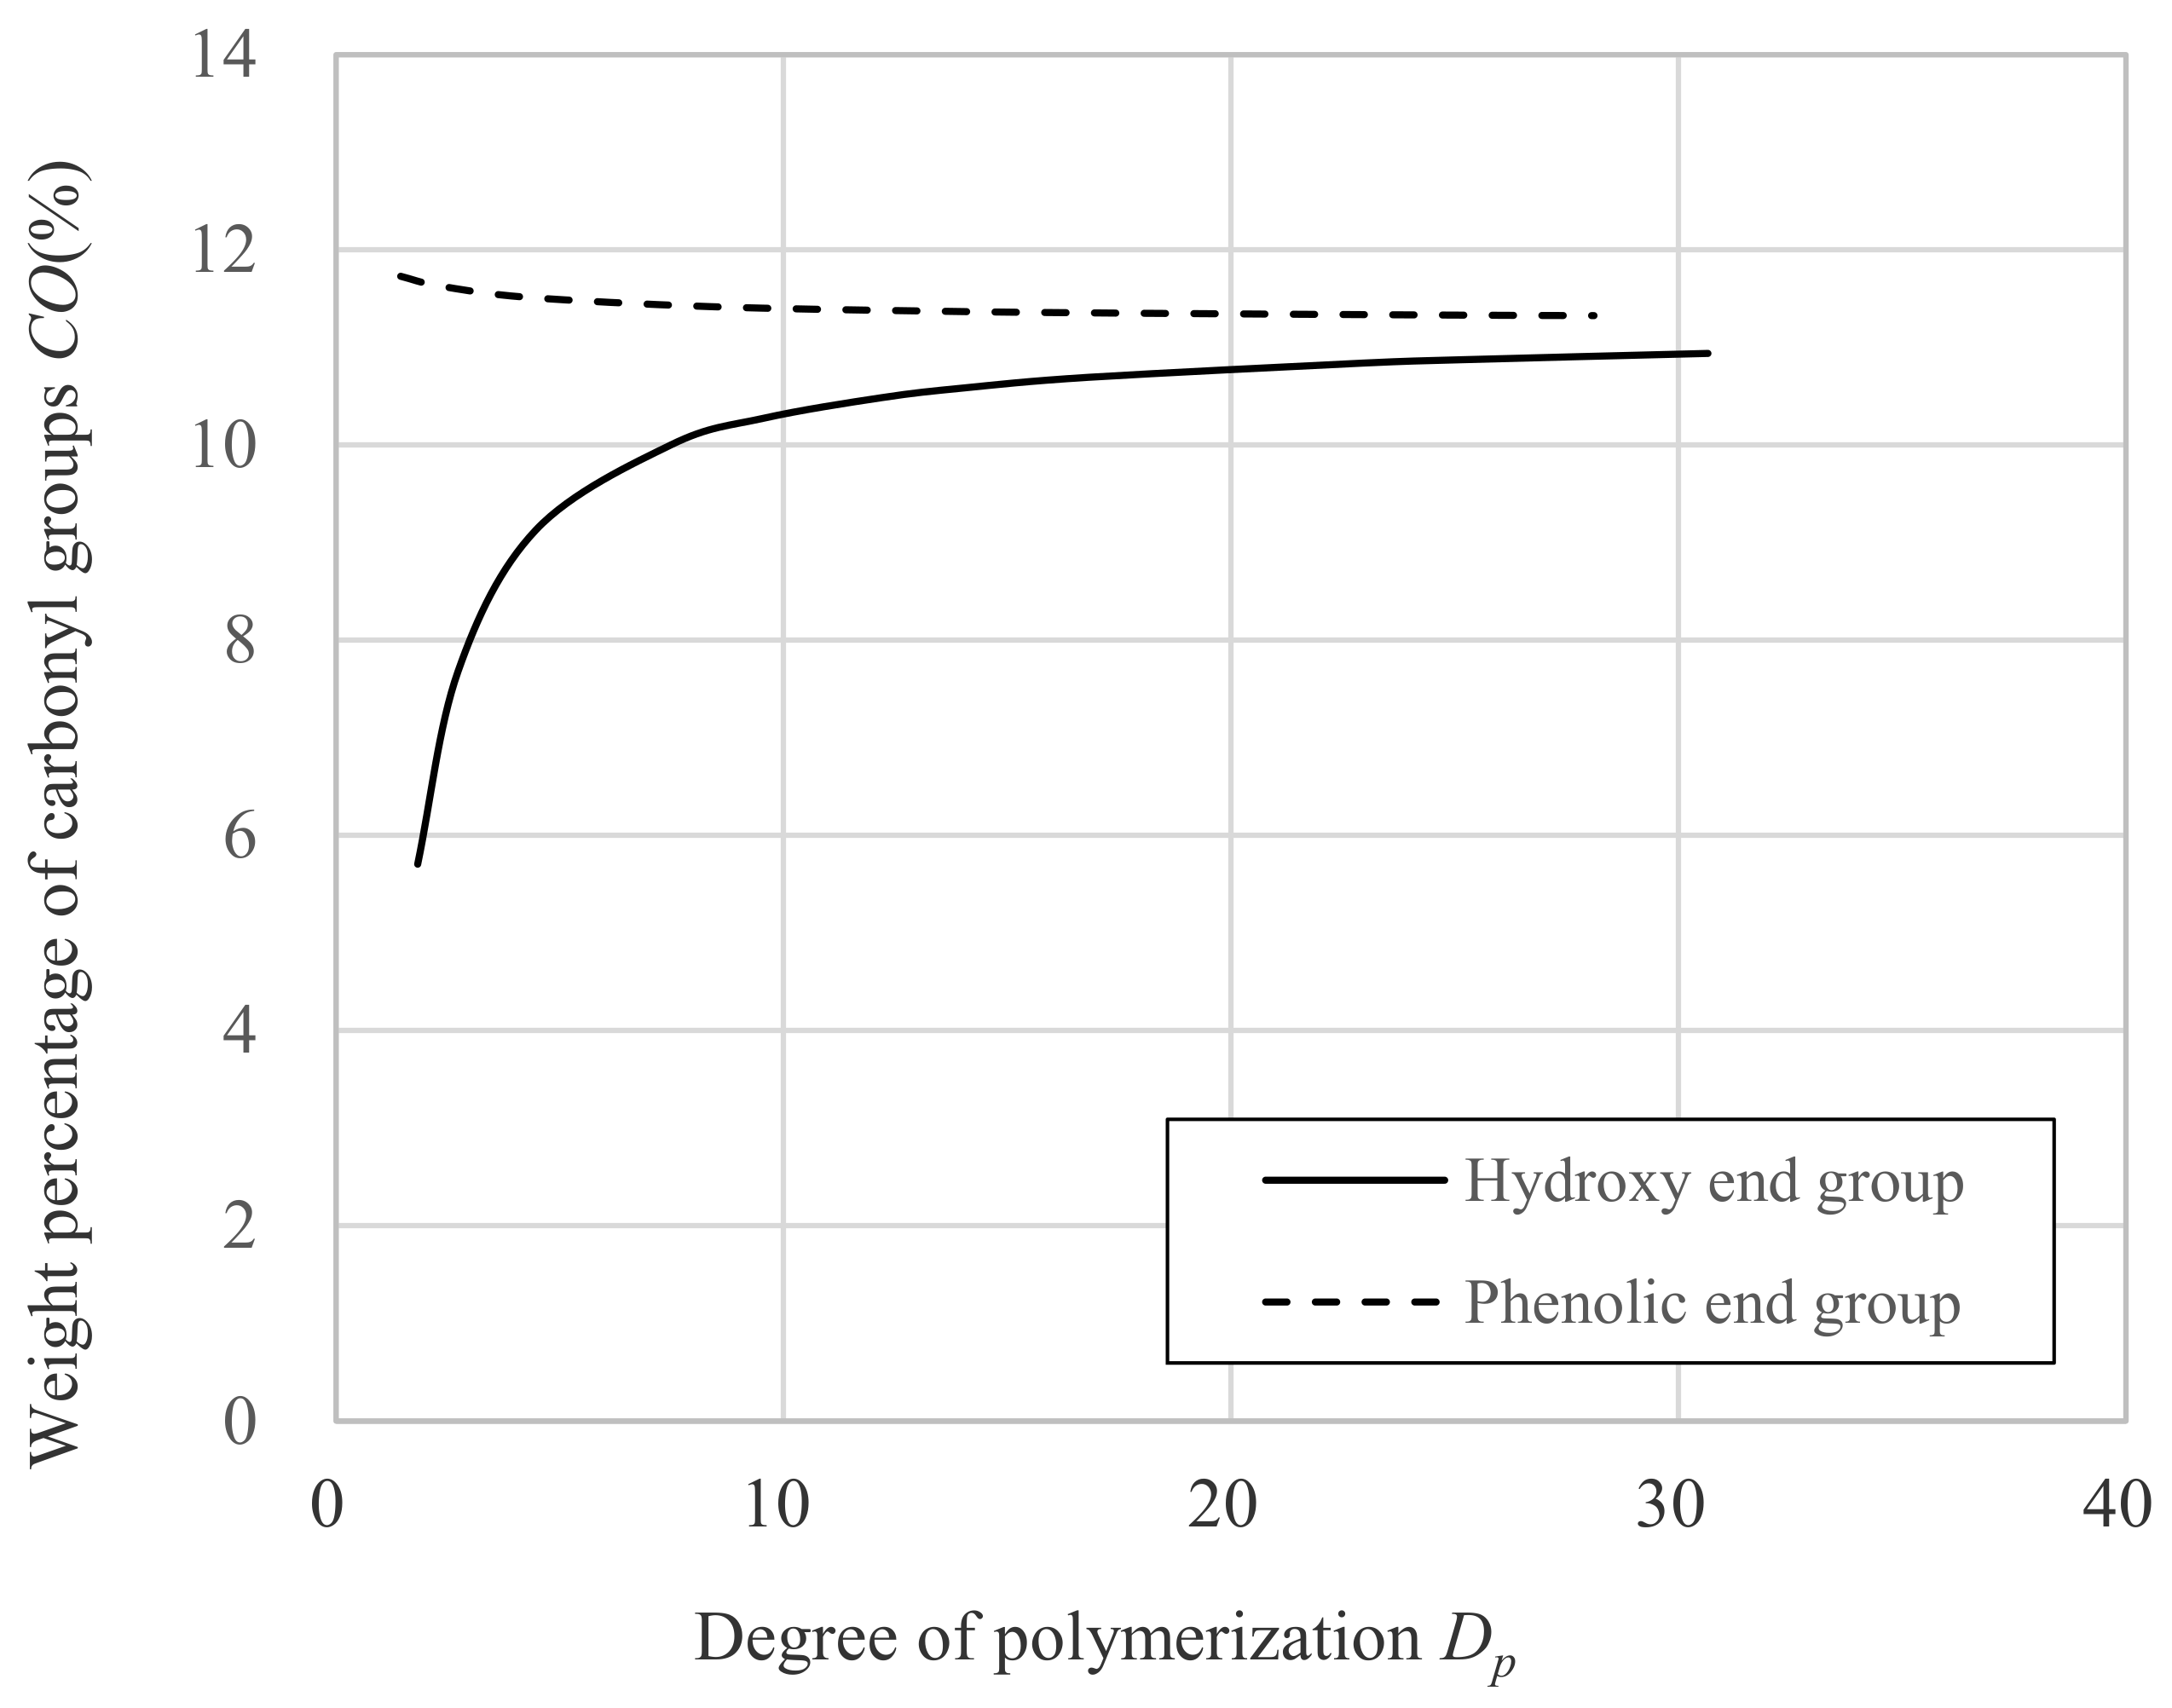
- CO is weight percentage of carbonyl groups against whole molecular weight.
- Dp is degree of polymerization.
- a is molecular weight of carbonyl groups, 28.01.
- b is molecular weight of DNDM; 222.33.
- c is molecular weight of hydrogen; 1.01.
- CO is weight percentage of carbonyl groups against whole molecular weight.
- Dp is degree of polymerization.
- a is molecular weight of carbonyl groups, 28.01.
- b is molecular weight of DNDM; 222.33.
- c is molecular weight of hydrogen; 1.01.
- d is molecular weight of benzene ring; 93.11.
- CO is the weight percentage of carbonyl group against whole molecular weight.
- α is the constant intrinsic to the molecule.
- β is the constant intrinsic to the molecule.
- γ is the constant intrinsic to the molecule.
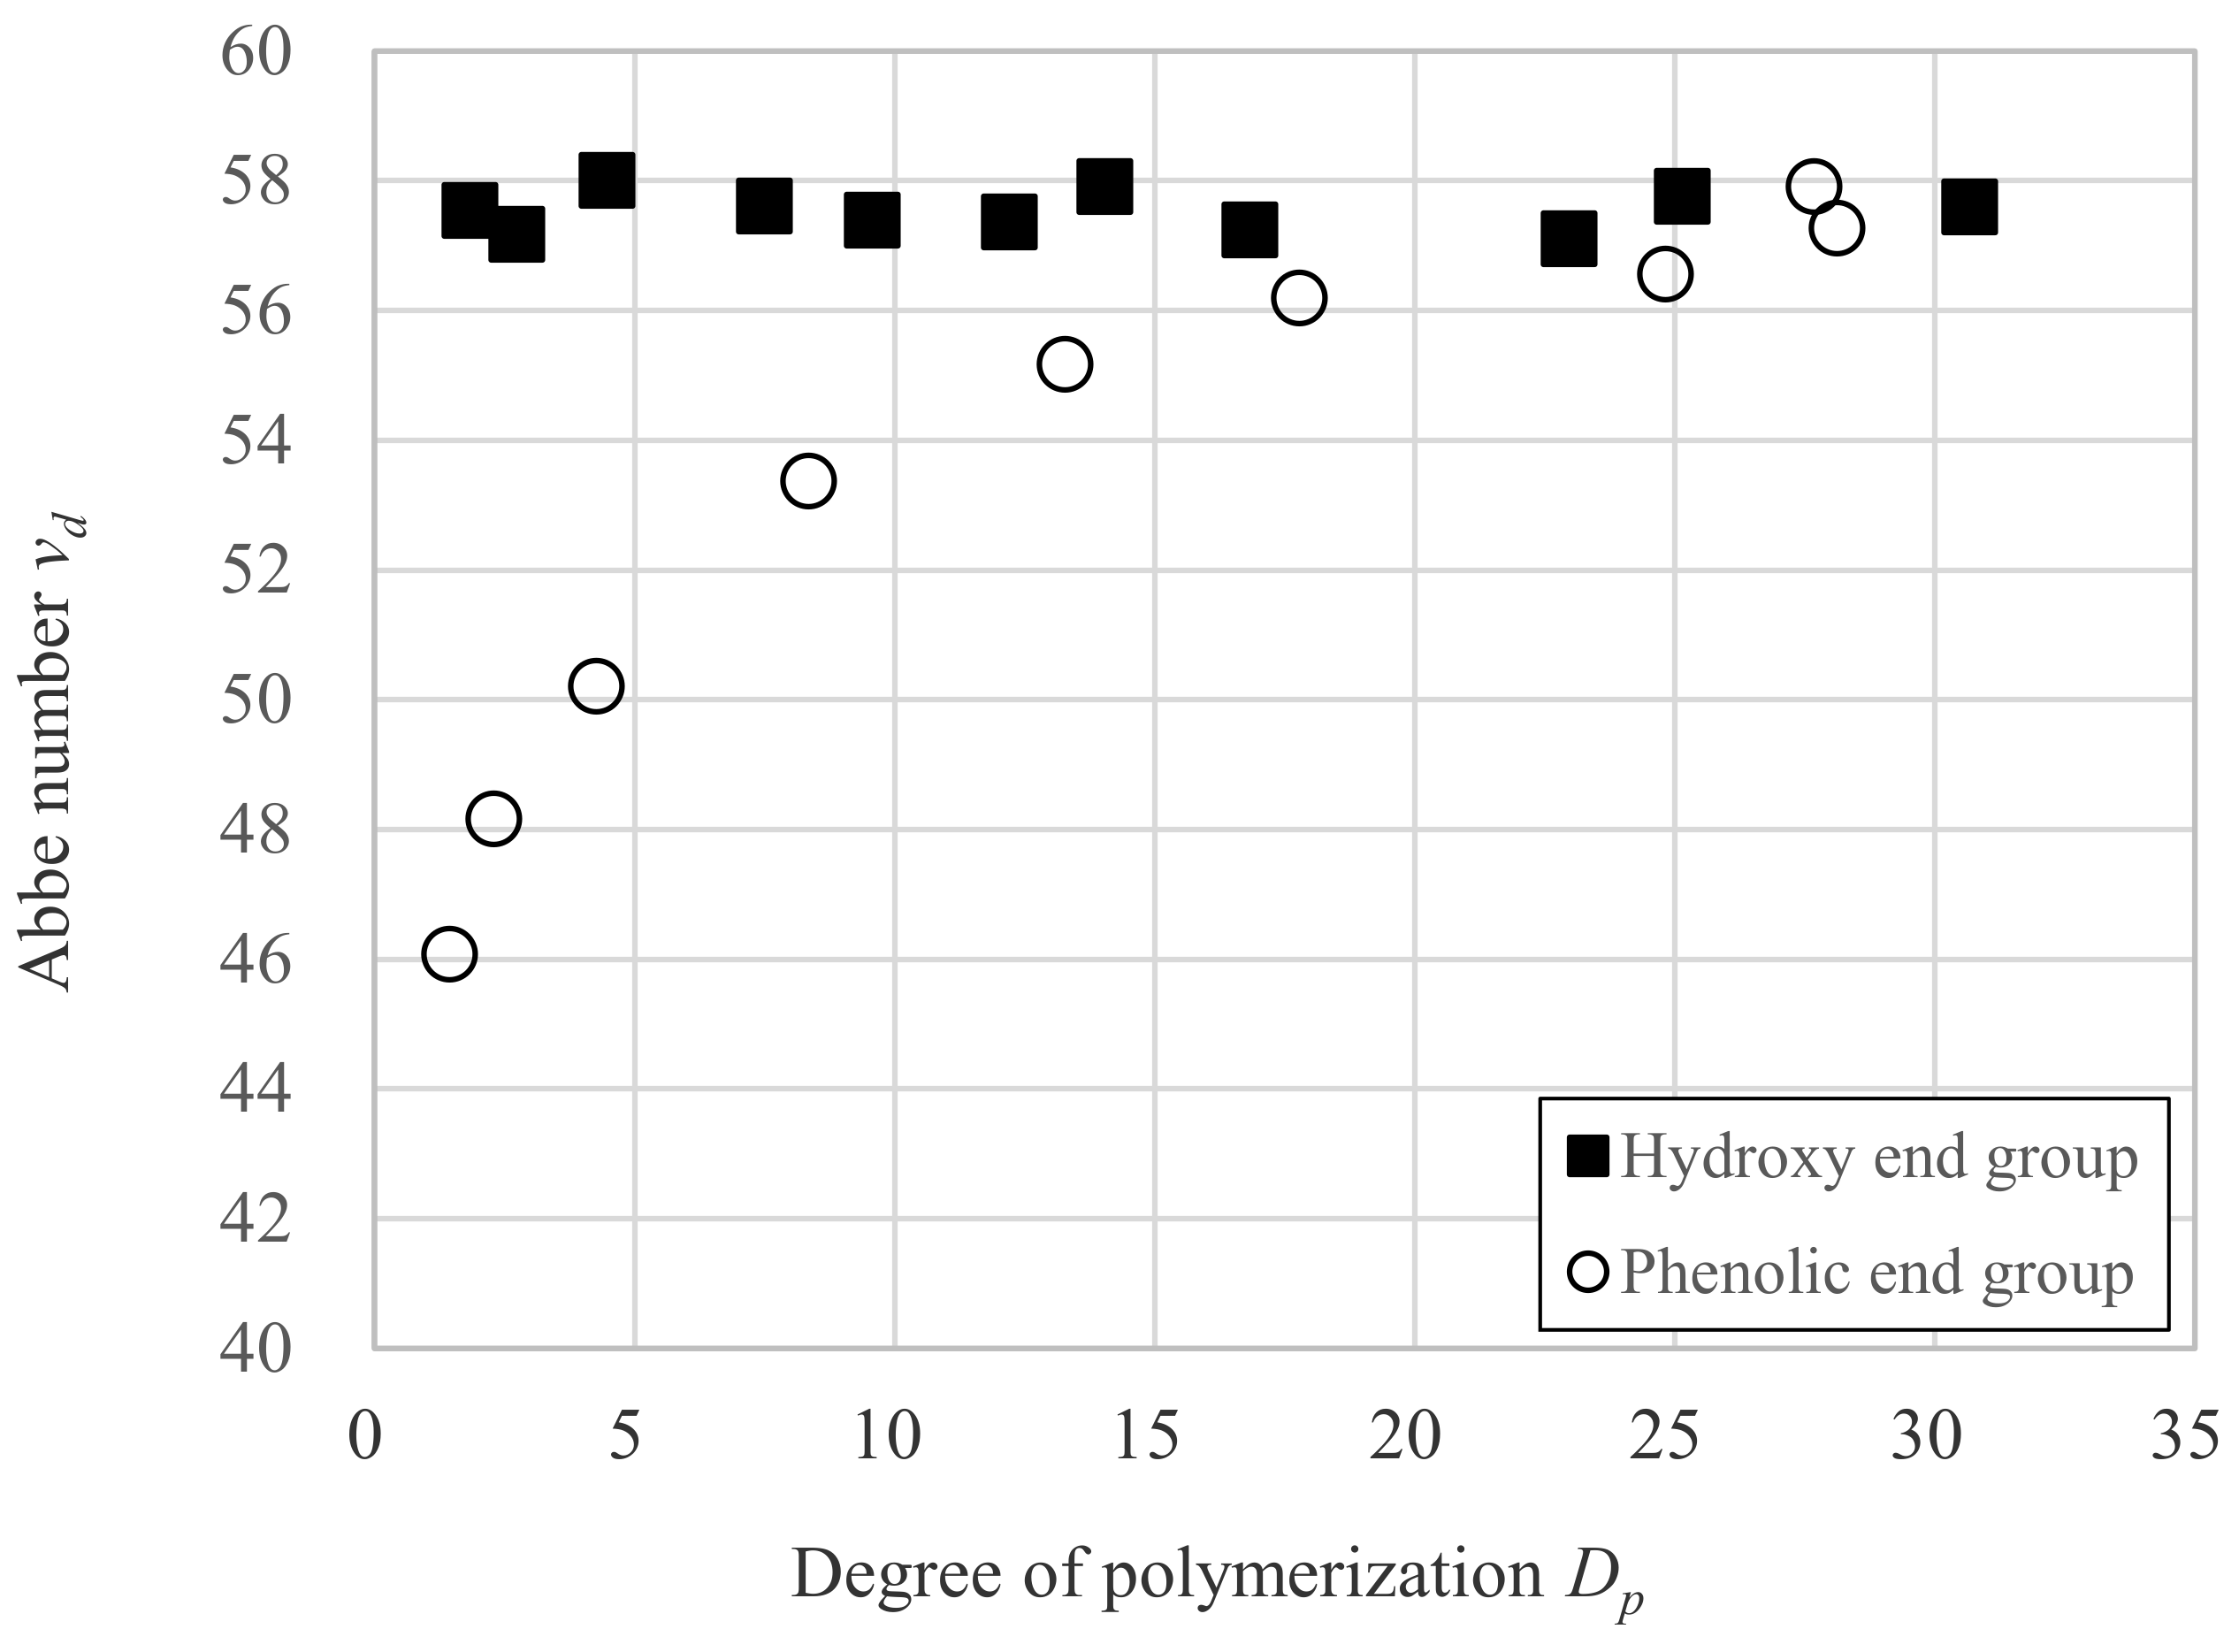
3.2. Relation between vd and Dp
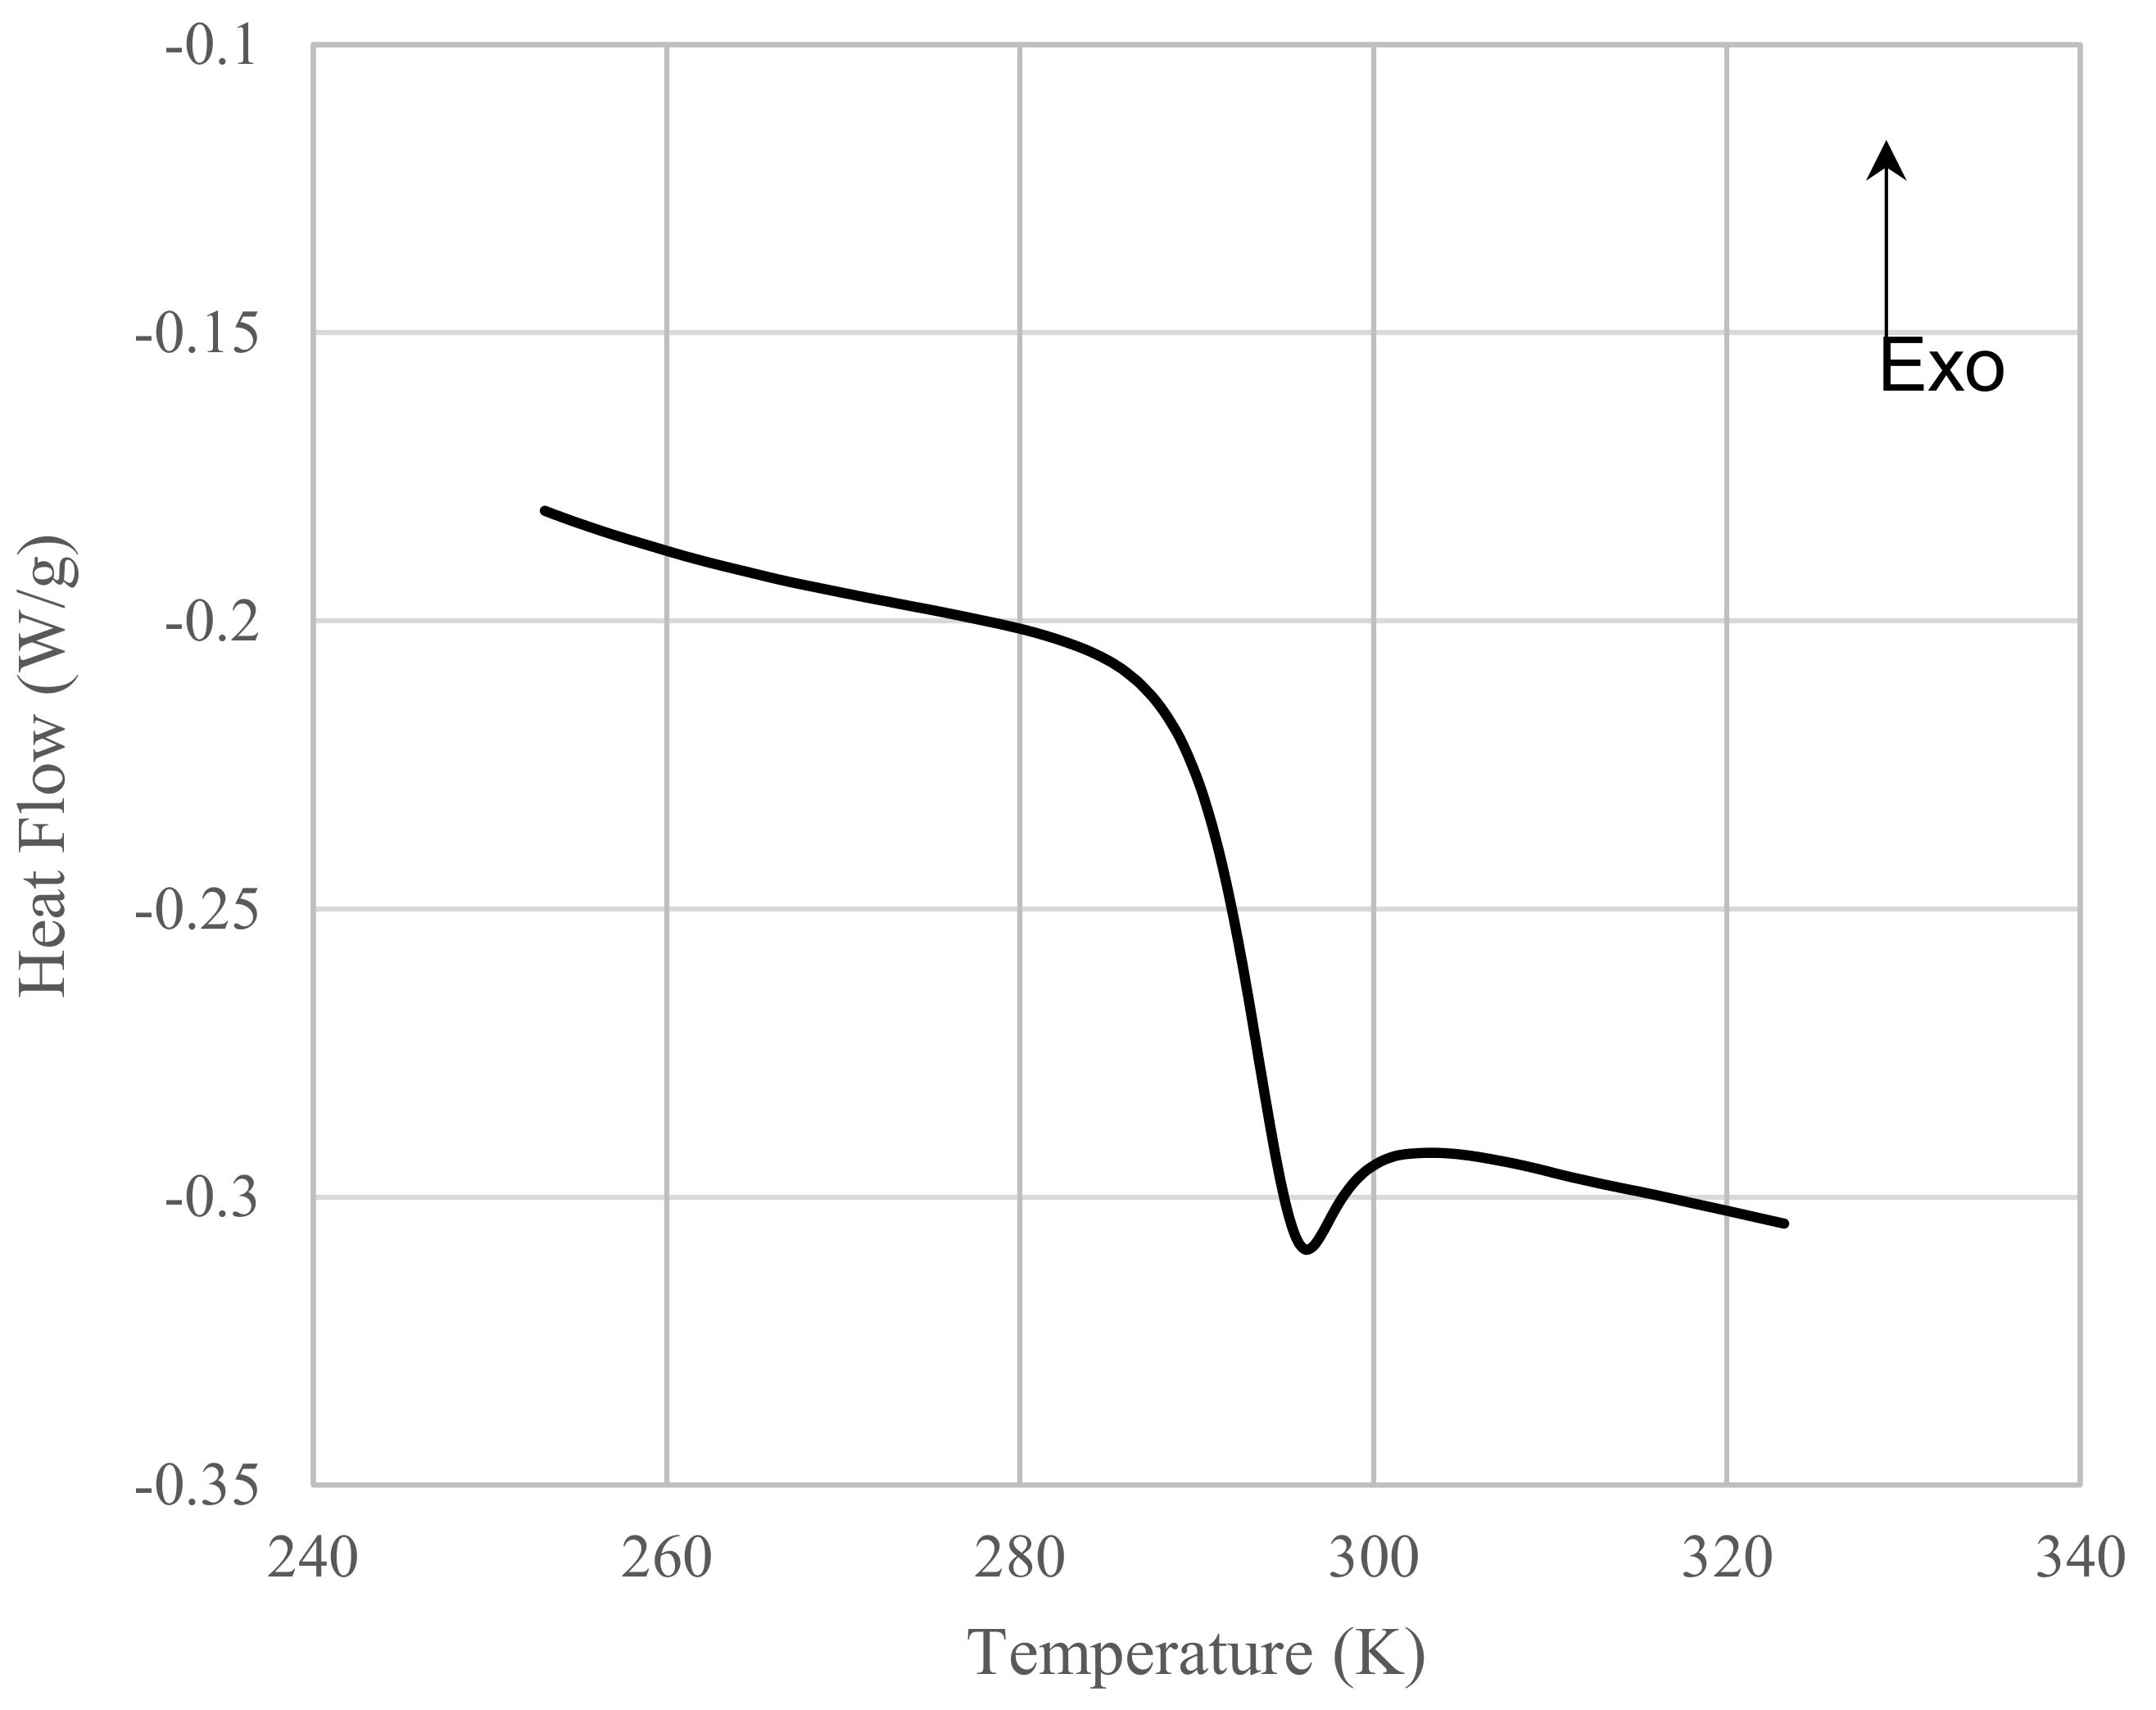
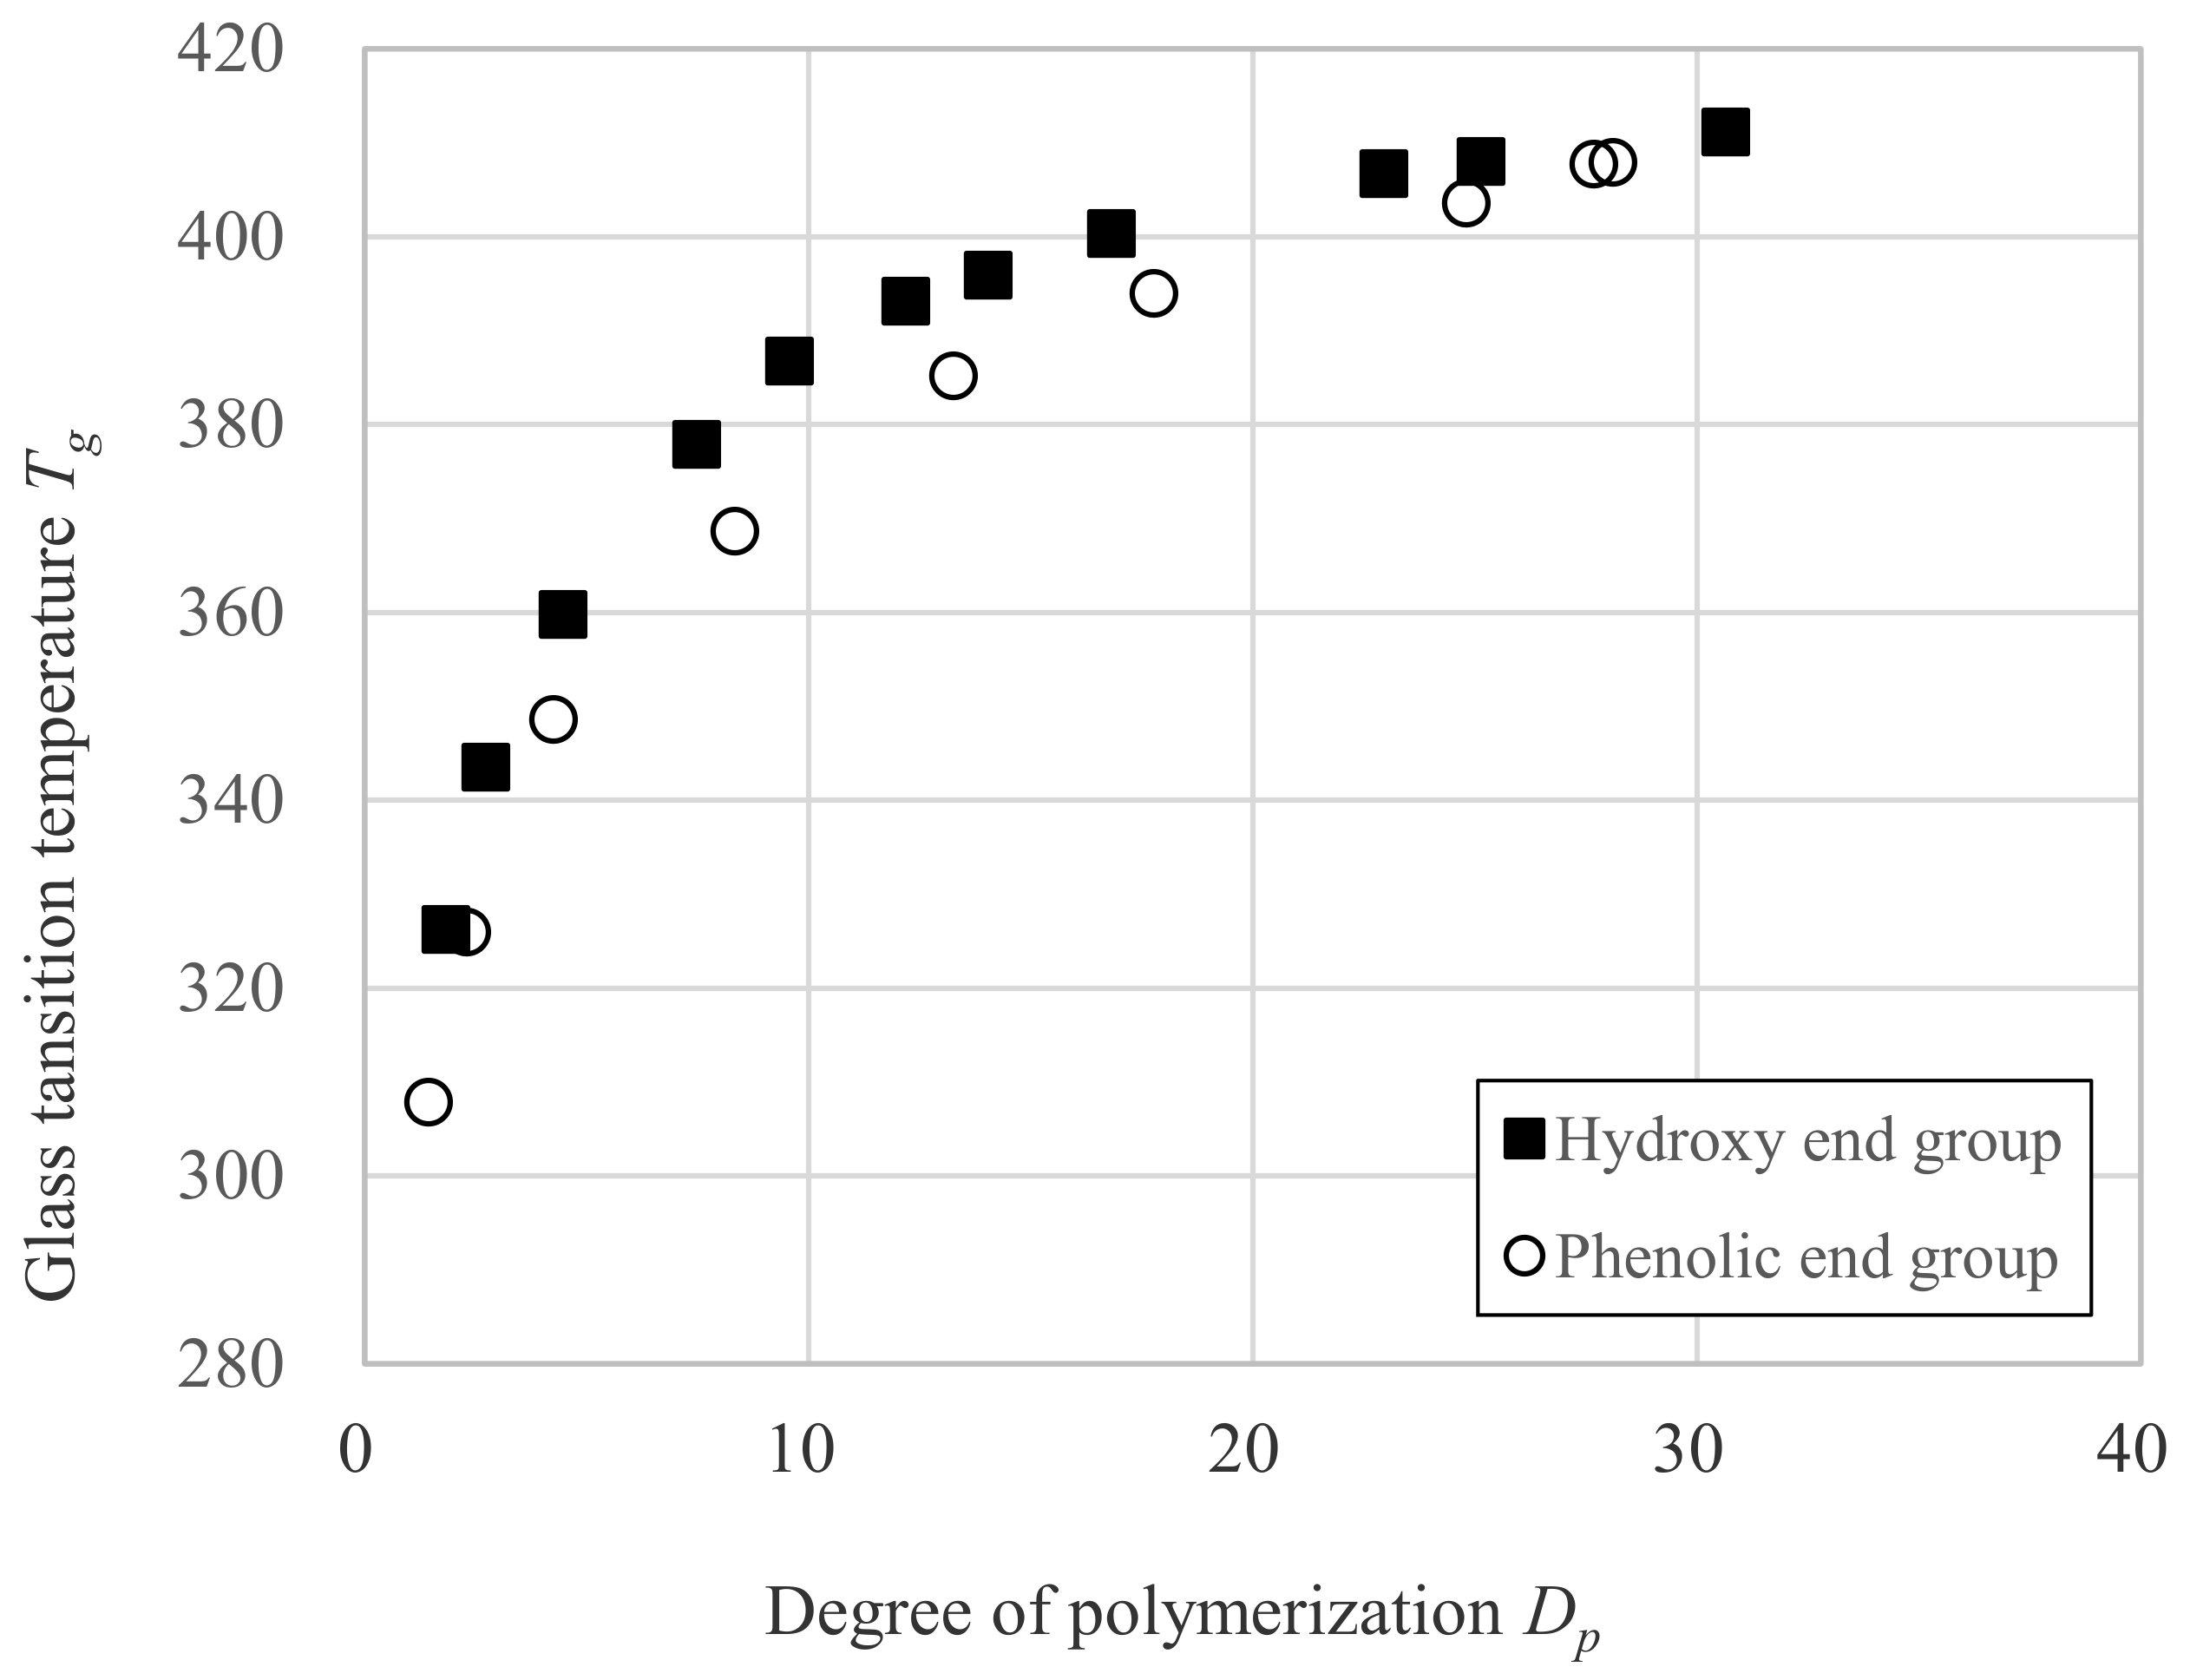
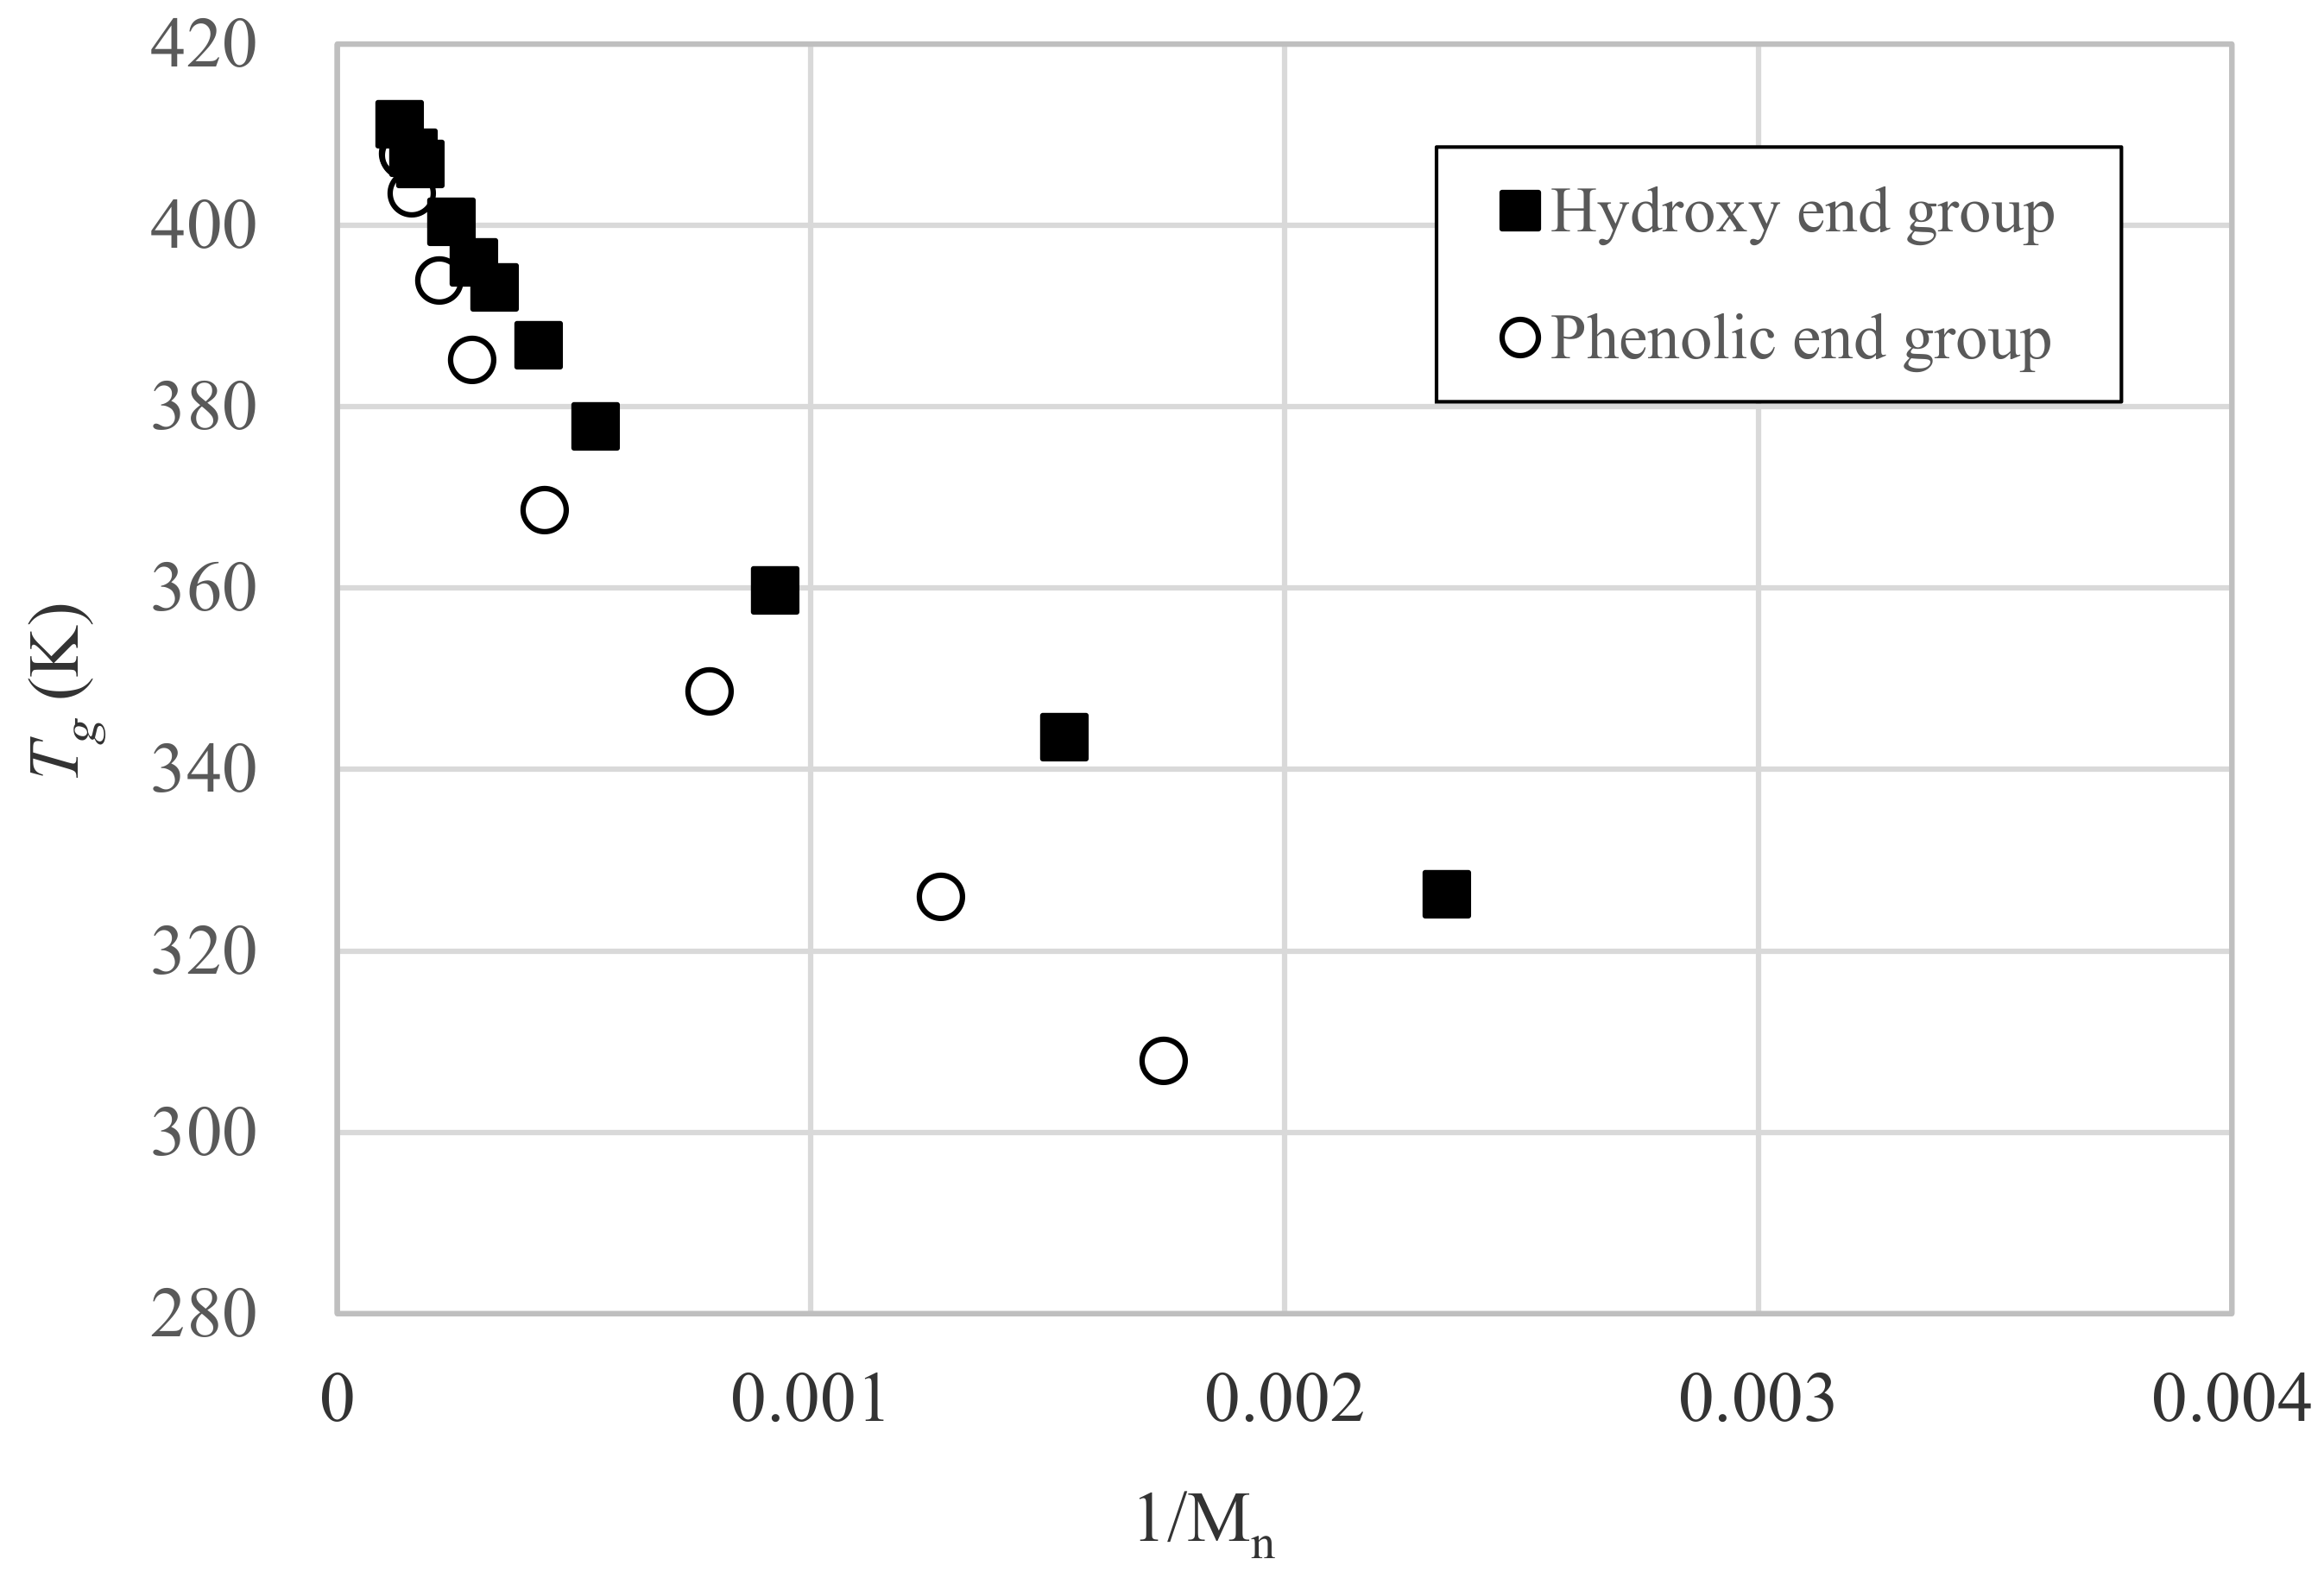
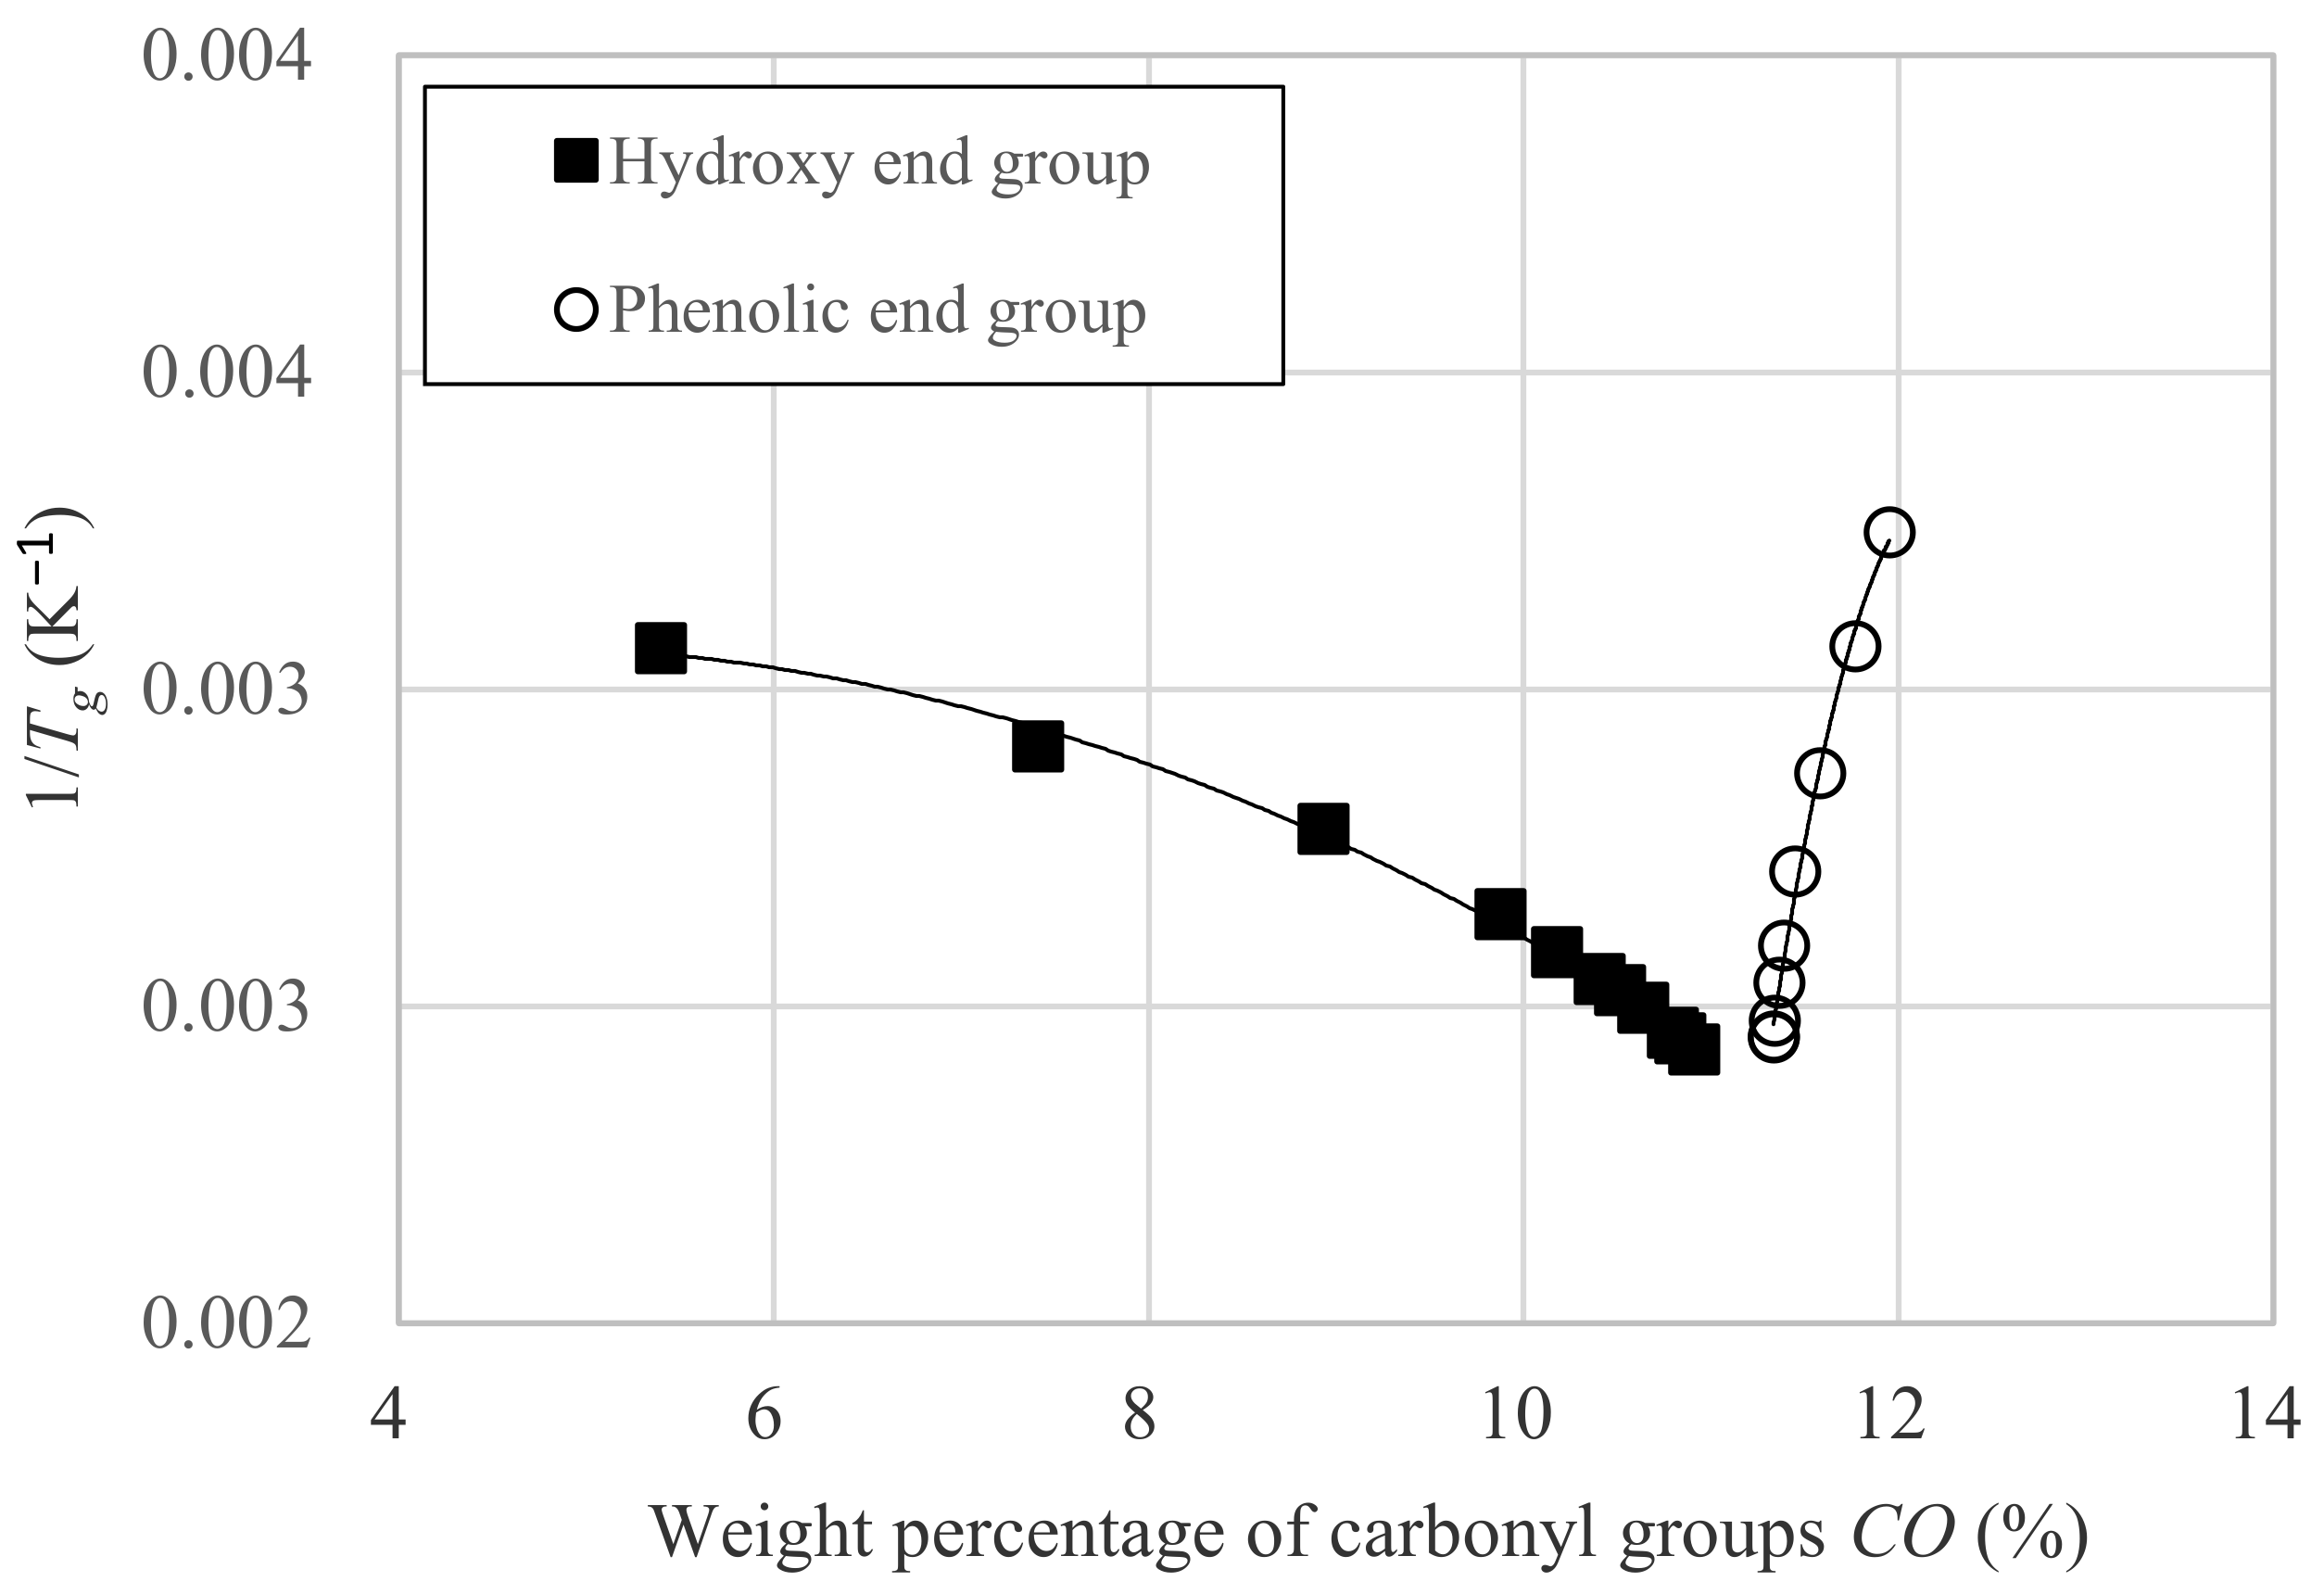
3.3. Relation between Tg and Dp
4. Conclusions
Author Contributions
Funding
Conflicts of Interest
References
- Kato, M.; Ito, H. Optical characteristics of injection-molded fluorene polymers. J. Polym. Eng. 2013, 33, 557–563. [Google Scholar] [CrossRef]
- Hasegawa, T.; Koyama, Y.; Seto, R.; Kojima, T.; Hosokawa, K.; Takata, T. Diphenolic 9,9-Diarylfluorene Trimers and Derivatives Possessing Flexible Alkylene Chain Spacers: Synthesis of the Monomers, Their Polymerization, and Properties of the Resulting Polymers. Macromolecules 2010, 43, 131–136. [Google Scholar] [CrossRef]
- Bäumer, S. Handbook of Plastic Optics, 2nd ed.; Wiley-VCH: Weinheim, Germany, 2011; ISBN 978-3-527-63545-0. [Google Scholar]
- Nakazono, K.; Yamashita, C.; Ogawa, T.; Iguchi, H.; Takata, T. Synthesis and properties of pendant fluorene moiety-tethered aliphatic polycarbonates. Polym. J. 2015, 47, 355–361. [Google Scholar] [CrossRef]
- Sakurai, K.; Fuji, M. Optical Properties of a Low Birefringence Polyester Containing Fluorene Side Chain I. Polym. J. 2000, 32, 676–682. [Google Scholar] [CrossRef]
- Seesukphronrarak, S.; Kawasaki, S.; Kobori, K.; Takata, T. Fluorene-rich high performance polyesters: Synthesis and characterization of 9,9-fluorenylidene and 2,7-fluorenylene-based polyesters with excellent optical property. J. Polym. Sci. Part. A Polym. Chem. 2008, 46, 2549–2556. [Google Scholar] [CrossRef]
- Saegusa, Y.; Kuriki, M.; Kawai, A.; Nakamura, S. Preparation and characterization of fluorine-containing aromatic condensation polymers. I. Preparation and characterization of fluorine-containing polycarbonate and copolycarbonates by two-phase phase-transfer-catalyzed polycondensation of 2,2-bis (4-hydroxyphenyl)-1,1,1,3,3,3-hexafluoropropane and/or 2,2-bis (4-hydroxyphenyl)propane with trichloromethyl chloroformate. J. Polym. Sci. Part. A Polym. Chem. 1990, 28, 3327–3335. [Google Scholar] [CrossRef]
- Murakami, O.; Kotaki, M.; Hamada, H. Effect of molecular weight and molding conditions on the replication of injection moldings with micro-scale v-groove features. Polym. Eng. Sci. 2008, 48, 697–704. [Google Scholar] [CrossRef]
- Kohara, T. Development of new cyclic olefin polymers for optical uses. Macromol. Symp. 1996, 101, 571–579. [Google Scholar] [CrossRef]
- Konishi, Y.; Sawaguchi, T.; Kubomura, K.; Minami, K. Advancements in Polymer Optics Design, Fabrication, and Materials. In Proceedings of the SPIE, Bellingham, WA, USA, 8 June 2005; 5872, pp. 18–25. [Google Scholar]
- Yamazaki, M. Industrialization and application development of cyclo-olefin polymer. J. Mol. Catal. A Chem. 2004, 213, 81–87. [Google Scholar] [CrossRef]
- Khanarian, G. Optical properties of cyclic olefin copolymers. Opt. Eng. 2001, 40, 1024. [Google Scholar] [CrossRef]
- Mol, J. Industrial applications of olefin metathesis. J. Mol. Catal. A Chem. 2004, 213, 39–45. [Google Scholar] [CrossRef]
- Brydson, J. Plastics Materials; Elsevier: London, UK, 2013; pp. 557–559. [Google Scholar]
- Kato, N.; Hirakawa, M.; Motoi, T.; Kitamura, M. Polycarbonate Resin and Optical Lens. U.S. Patent WO 2016/052370 A1, 7 April 2016. [Google Scholar]
- Kato, N.; Ikeda, S.; Hirakawa, M.; Ito, H. Relationship between degree of polymerization and optical and thermal properties of fluorene in polycarbonate polymers. J. Appl. Polym. Sci. 2017, 134, 45042. [Google Scholar] [CrossRef]
- Kato, N.; Ikeda, S.; Hirakwa, M.; Nishimori, A.; Ito, H. Relationship between Degree of Polymerization and Optical-and Thermal–Properties of Ordinary Bisphenol-A Polycarbonate Polymers. In Proceedings of the AIP Conference Proceedings, Taipei, Taiwan, 25 May 2018; 2065, p. 030018. [Google Scholar]
- Riffle, J.S.; Shchori, E.; Banthia, A.K.; Freelin, R.G.; Ward, T.C.; McGrath, J.E. Synthesis of hydroxyl-terminated polycarbonates of controlled number-average molecular weight. J. Polym. Sci. Polym. Chem. Ed. 1982, 20, 2289–2301. [Google Scholar] [CrossRef]
- Brunelle, D.J.; Shannon, T.G. Preparation and polymerization of bisphenol A cyclic oligomeric carbonates. Macromolecules 1991, 24, 3035–3044. [Google Scholar] [CrossRef]
- Knauss, D.M.; E McGrath, J. Polycarbonate networks. 1. Synthesis and characterization of vinylphenylcarbonate terminated oligomers. Polymers 2002, 43, 6407–6414. [Google Scholar] [CrossRef]
- Fetters, L.J.; Lohse, D.J.; Richter, D.; Witten, T.A.; Zirkel, A. Connection between Polymer Molecular Weight, Density, Chain Dimensions, and Melt Viscoelastic Properties. Macromolecules 1994, 27, 4639–4647. [Google Scholar] [CrossRef]
- Higashihara, T.; Ueda, M. Recent Progress in High Refractive Index Polymers. Macromolecules 2015, 48, 1915–1929. [Google Scholar] [CrossRef]
- Norihisa, T.; Satoshi, T.; Hiroyuki, M. Development of Refractive Index Prediction System for Transparent Polymers. Polymer Preprints 2013, 62, 3748. [Google Scholar]
- Lorentz, H.A. Über die Beziehung zwischen der Fortpflanzungsgeschwindigkeit des Lichtes und der Körperdichte. Ann. Phys. 1880, 9, 641–665. [Google Scholar] [CrossRef]
- Lorenz, L. Über die Refractionsconstante. Ann. Phys. 1880, 11, 70–103. [Google Scholar] [CrossRef]
- Fox, T.G.; Flory, P.J. The glass temperature and related properties of polystyrene. Influence of molecular weight. J. Polym. Sci. 1954, 14, 315–319. [Google Scholar] [CrossRef]
- Macosko, C.W.; Miller, D.R. A New Derivation of Average Molecular Weights of Nonlinear Polymers. Macromolecules 1976, 9, 199–206. [Google Scholar] [CrossRef]
- Fox, T.G.; Flory, P.J. Influence of Molecular Weight. Second-order transition temperatures and related properties of polystyrene. J. Appl. Phys. 1950, 21, 581–591. [Google Scholar] [CrossRef]


| Sample a | DPC mol Ratio DPC mol/ DNDM mol | Degree of Polymerization b Dp | Refractive Index c nd | Refractive Index d nc | Refractive Index e nF | vd | |
|---|---|---|---|---|---|---|---|
| OH-2 | 0.500 | 1.8 | 1.5467 | 1.544 | 1.5535 | 57.5 | |
| OH-3 | 0.667 | 2.7 | 1.5431 | 1.5403 | 1.5498 | 57.2 | |
| OH-4 | 0.800 | 4.5 | 1.5394 | 1.5366 | 1.5459 | 58.0 | |
| OH-7 | 0.889 | 7.5 | 1.5358 | 1.533 | 1.5423 | 57.6 | |
| OH-10 | 0.917 | 9.6 | 1.5337 | 1.531 | 1.5403 | 57.4 | |
| OH-12 | 0.940 | 12.2 | 1.5335 | 1.5308 | 1.5401 | 57.4 | |
| OH-14 | 0.952 | 14.0 | 1.5328 | 1.5303 | 1.5395 | 57.9 | |
| OH-17 | 0.963 | 16.8 | 1.5323 | 1.5296 | 1.5389 | 57.2 | |
| OH-23 | 0.980 | 23.0 | 1.5311 | 1.5287 | 1.538 | 57.1 | |
| OH-25 | 0.987 | 25.1 | 1.5314 | 1.5287 | 1.5379 | 57.8 | |
| OH-31 | 0.990 | 30.7 | 1.5299 | 1.5272 | 1.5364 | 57.6 | |
| Ph-1 | 1.550 | 1.4 | 1.5529 | 1.5493 | 1.5613 | 46.1 | |
| Ph-2 | 1.333 | 2.3 | 1.5490 | 1.5456 | 1.557 | 48.2 | |
| Ph-4 | 1.200 | 4.3 | 1.5422 | 1.5391 | 1.5499 | 50.2 | |
| Ph-8 | 1.110 | 8.3 | 1.5390 | 1.5361 | 1.5462 | 53.4 | |
| Ph-13 | 1.060 | 13.3 | 1.5352 | 1.5327 | 1.5424 | 55.2 | |
| Ph-18 | 1.038 | 17.8 | 1.5339 | 1.5311 | 1.5406 | 56.2 | |
| Ph-25 | 1.020 | 24.8 | 1.5317 | 1.5296 | 1.539 | 56.6 | |
| Ph-28-1 | 1.013 | 27.7 | 1.5328 | 1.5305 | 1.5397 | 57.9 | |
| Ph-28-2 | 1.010 | 28.1 | 1.5326 | 1.5298 | 1.5391 | 57.3 |
| Sample | DPC mol Ratio DPC mol/ DNDM mol | Degree of Polymerization Dp | Glass Transition Temperature Tg (K) | Mn (g/mol) | Mw (g/mol) | Mw/Mn |
|---|---|---|---|---|---|---|
| OH-1 | 0.000 | 1.0 | 291.8 | 222 | 222 | 1 |
| OH-2 | 0.500 | 1.8 | 326.3 | 427 | 679 | 1.59 |
| OH-3 | 0.667 | 2.7 | 343.6 | 651 | 1240 | 1.9 |
| OH-4 | 0.800 | 4.5 | 359.8 | 1082 | 2270 | 2.1 |
| OH-7 | 0.889 | 7.5 | 377.9 | 1833 | 4704 | 2.57 |
| OH-10 | 0.917 | 9.6 | 386.8 | 2350 | 6298 | 2.68 |
| OH-12 | 0.940 | 12.2 | 393.2 | 3002 | 8832 | 2.94 |
| OH-14 | 0.952 | 14.0 | 396.0 | 3459 | 10,147 | 2.93 |
| OH-17 | 0.963 | 16.8 | 400.4 | 4151 | 13,904 | 3.35 |
| OH-23 | 0.980 | 23.0 | 406.8 | 5675 | 22,080 | 3.89 |
| OH-25 | 0.987 | 25.1 | 408.1 | 6218 | 29,304 | 4.71 |
| OH-31 | 0.990 | 30.7 | 411.2 | 7587 | 42,205 | 5.56 |
| Ph-0 | 2.000 | 0.29 | 299.2 | 287 | 287 | 1 |
| Ph-1 | 1.550 | 1.44 | 307.9 | 573 | 792 | 1.38 |
| Ph-2 | 1.333 | 2.29 | 326.0 | 784 | 1237 | 1.58 |
| Ph-4 | 1.200 | 4.26 | 348.7 | 1273 | 2389 | 1.88 |
| Ph-8 | 1.110 | 8.35 | 368.7 | 2287 | 4950 | 2.16 |
| Ph-13 | 1.060 | 13.27 | 385.2 | 3509 | 9068 | 2.58 |
| Ph-18 | 1.038 | 17.78 | 394.0 | 4630 | 14,128 | 3.05 |
| Ph-25 | 1.020 | 24.81 | 403.6 | 6375 | 25,891 | 4.06 |
| Ph-28-1 | 1.013 | 27.68 | 407.8 | 7087 | 36,962 | 5.22 |
| Ph-28-2 | 1.010 | 28.11 | 408.0 | 7195 | 39,150 | 5.44 |
| Hydroxy End Group | Phenolic End Group |
|---|---|
| nd = −0.0004 × CO2 + 0.0036 × CO + 1.5386 | nd = −0.0260 × CO2 + 0.6382 × CO − 2.3619 |
| nC = −0.0004 × CO2 + 0.0033 × CO + 1.5369 | nC = −0.0238 × CO2 + 0.5861 × CO − 2.0514 |
| nF = −0.0004 × CO2 + 0.0033 × CO + 1.5468 | nF = −0.0279 × CO2 + 0.6854 × CO − 2.6436 |
Publisher’s Note: MDPI stays neutral with regard to jurisdictional claims in published maps and institutional affiliations. |
© 2020 by the authors. Licensee MDPI, Basel, Switzerland. This article is an open access article distributed under the terms and conditions of the Creative Commons Attribution (CC BY) license (http://creativecommons.org/licenses/by/4.0/).
Share and Cite
Kato, N.; Ikeda, S.; Hirakawa, M.; Ito, H. Correlation of the Abbe Number, the Refractive Index, and Glass Transition Temperature to the Degree of Polymerization of Norbornane in Polycarbonate Polymers. Polymers 2020, 12, 2484. https://doi.org/10.3390/polym12112484
Kato N, Ikeda S, Hirakawa M, Ito H. Correlation of the Abbe Number, the Refractive Index, and Glass Transition Temperature to the Degree of Polymerization of Norbornane in Polycarbonate Polymers. Polymers. 2020; 12(11):2484. https://doi.org/10.3390/polym12112484
Chicago/Turabian StyleKato, Noriyuki, Shinya Ikeda, Manabu Hirakawa, and Hiroshi Ito. 2020. "Correlation of the Abbe Number, the Refractive Index, and Glass Transition Temperature to the Degree of Polymerization of Norbornane in Polycarbonate Polymers" Polymers 12, no. 11: 2484. https://doi.org/10.3390/polym12112484
APA StyleKato, N., Ikeda, S., Hirakawa, M., & Ito, H. (2020). Correlation of the Abbe Number, the Refractive Index, and Glass Transition Temperature to the Degree of Polymerization of Norbornane in Polycarbonate Polymers. Polymers, 12(11), 2484. https://doi.org/10.3390/polym12112484