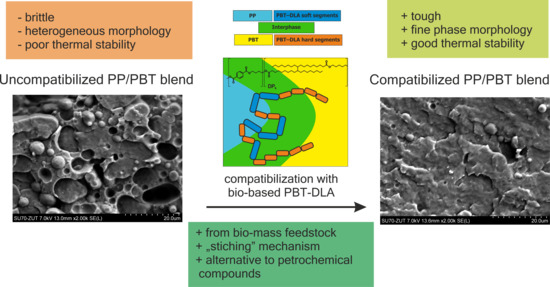
Bio-Based PBT–DLA Copolyester as an Alternative Compatibilizer of PP/PBT Blends
Abstract
1. Introduction
2. Materials and Methods
2.1. Material Selection
2.2. Characterization of Compatibilizers
2.3. Melt Blending
2.4. Characterization of Polymer Blends
3. Results and Discussion
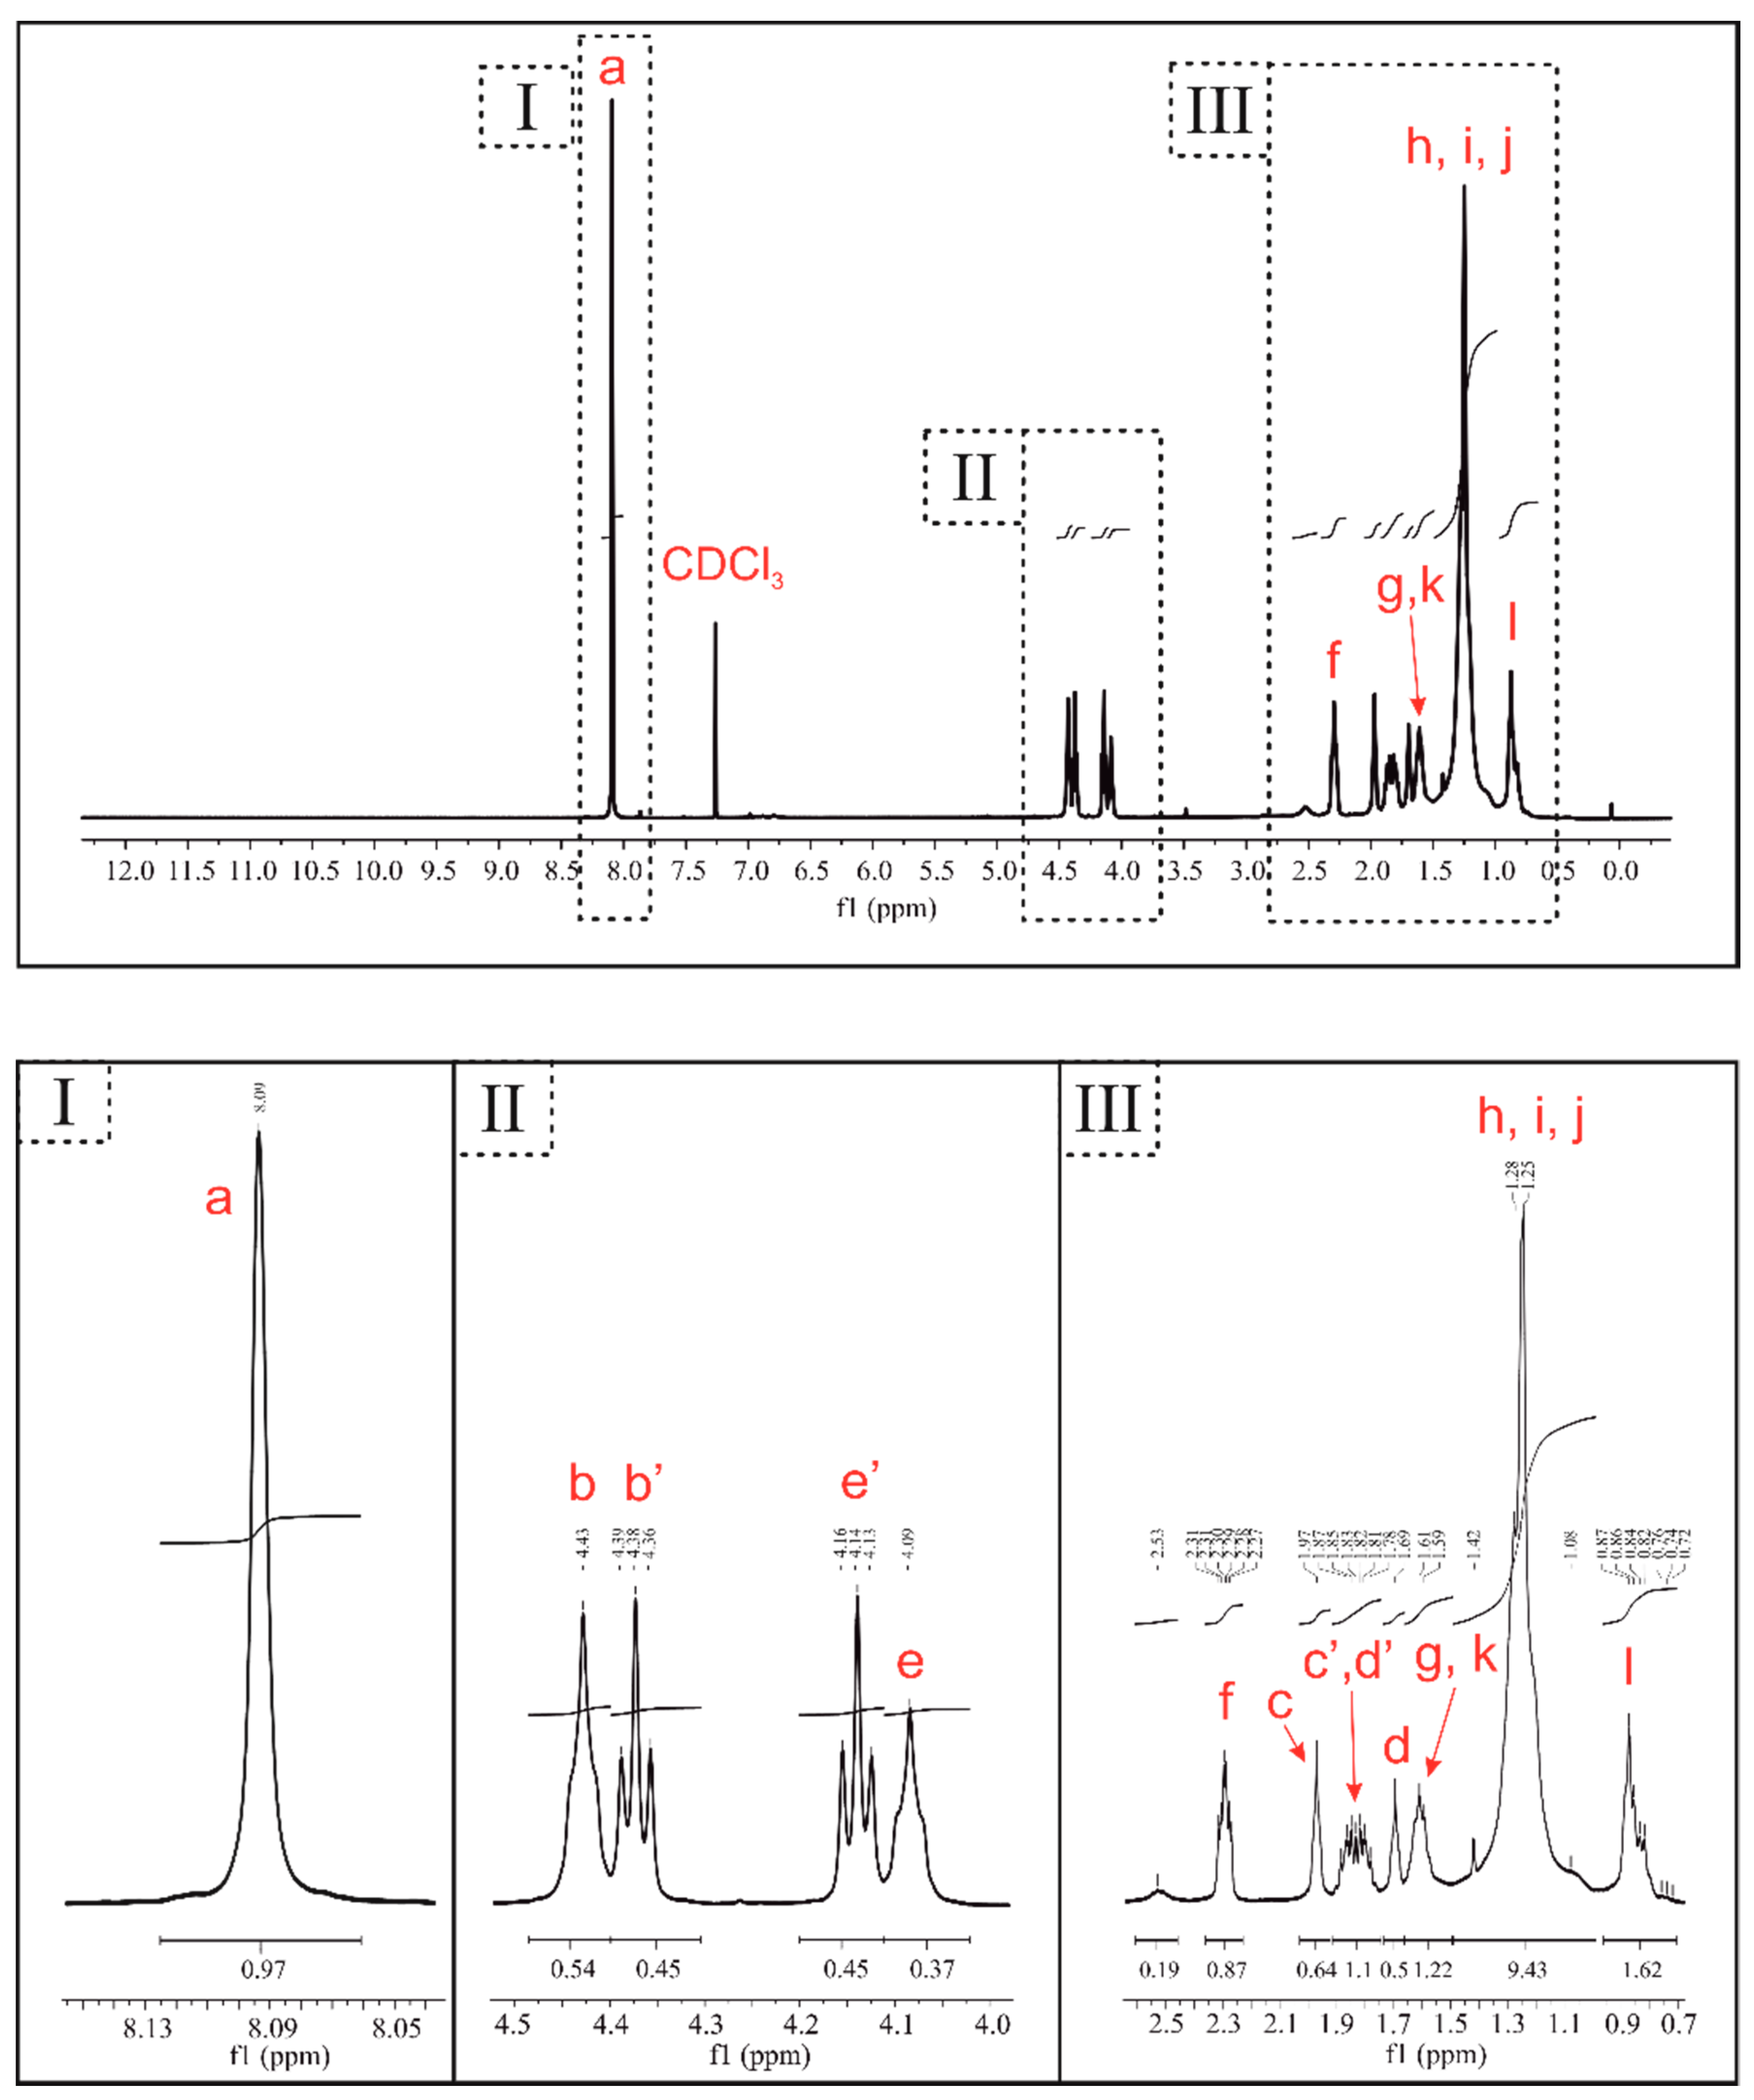
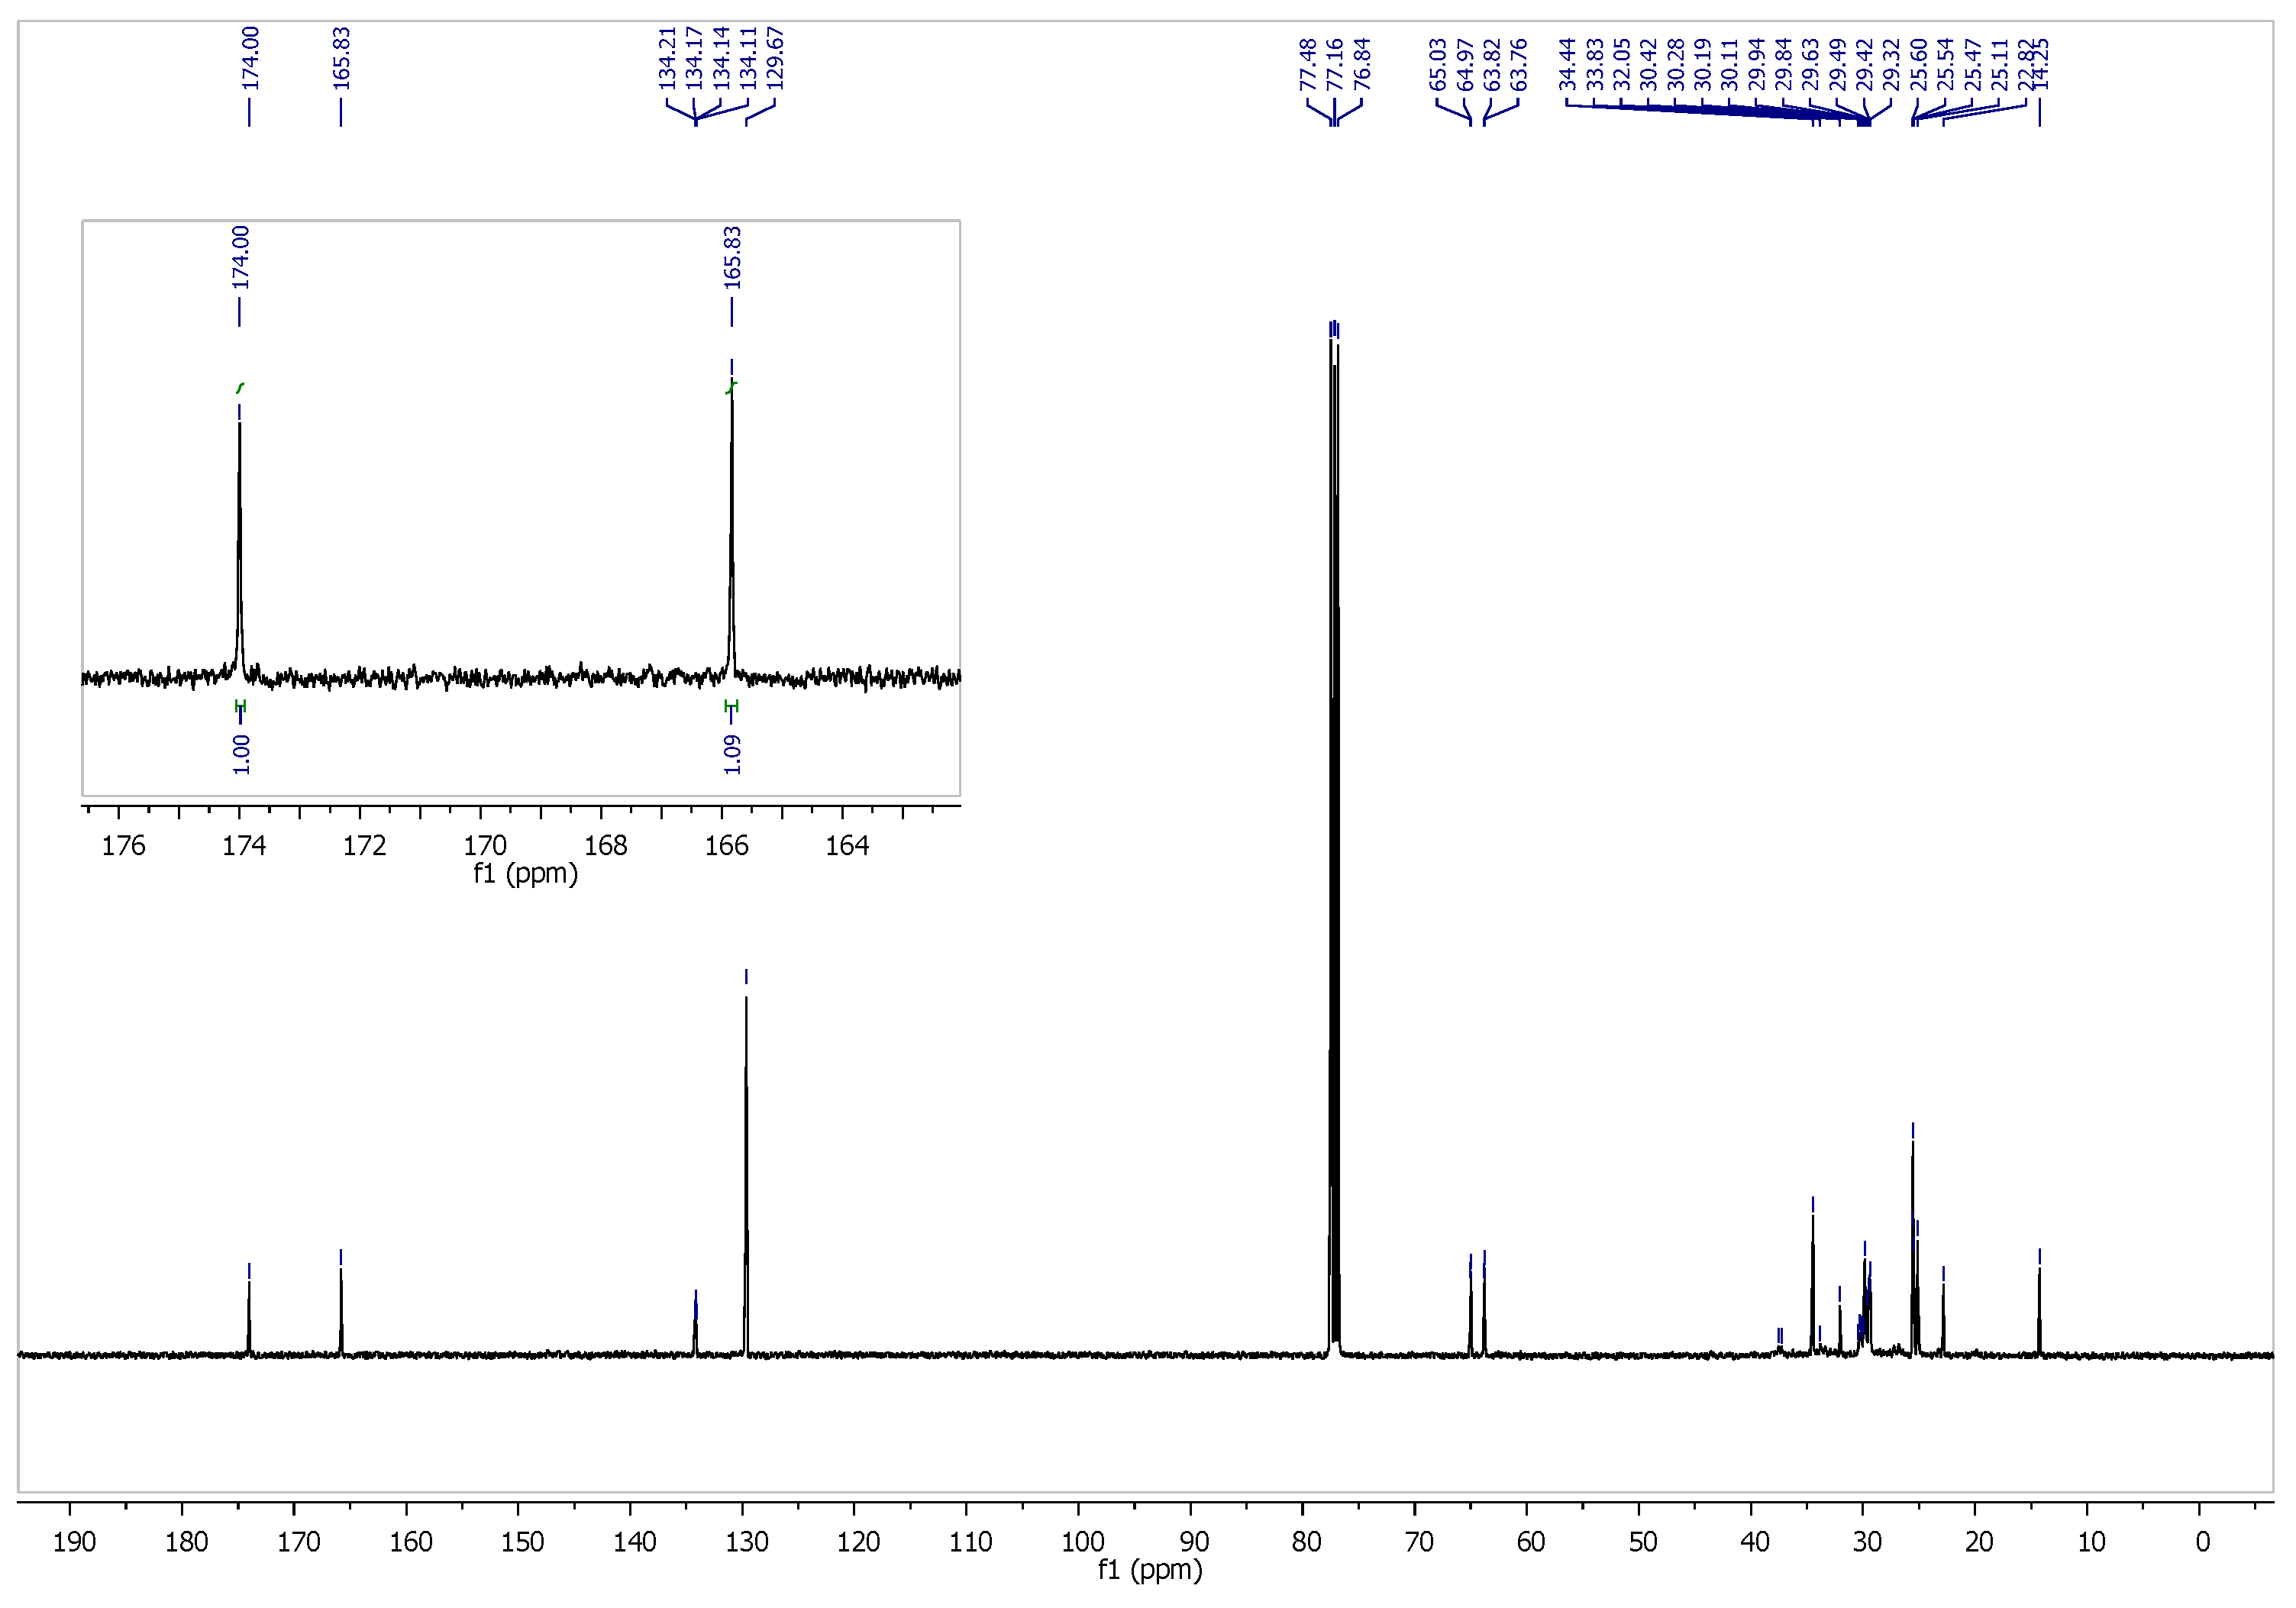
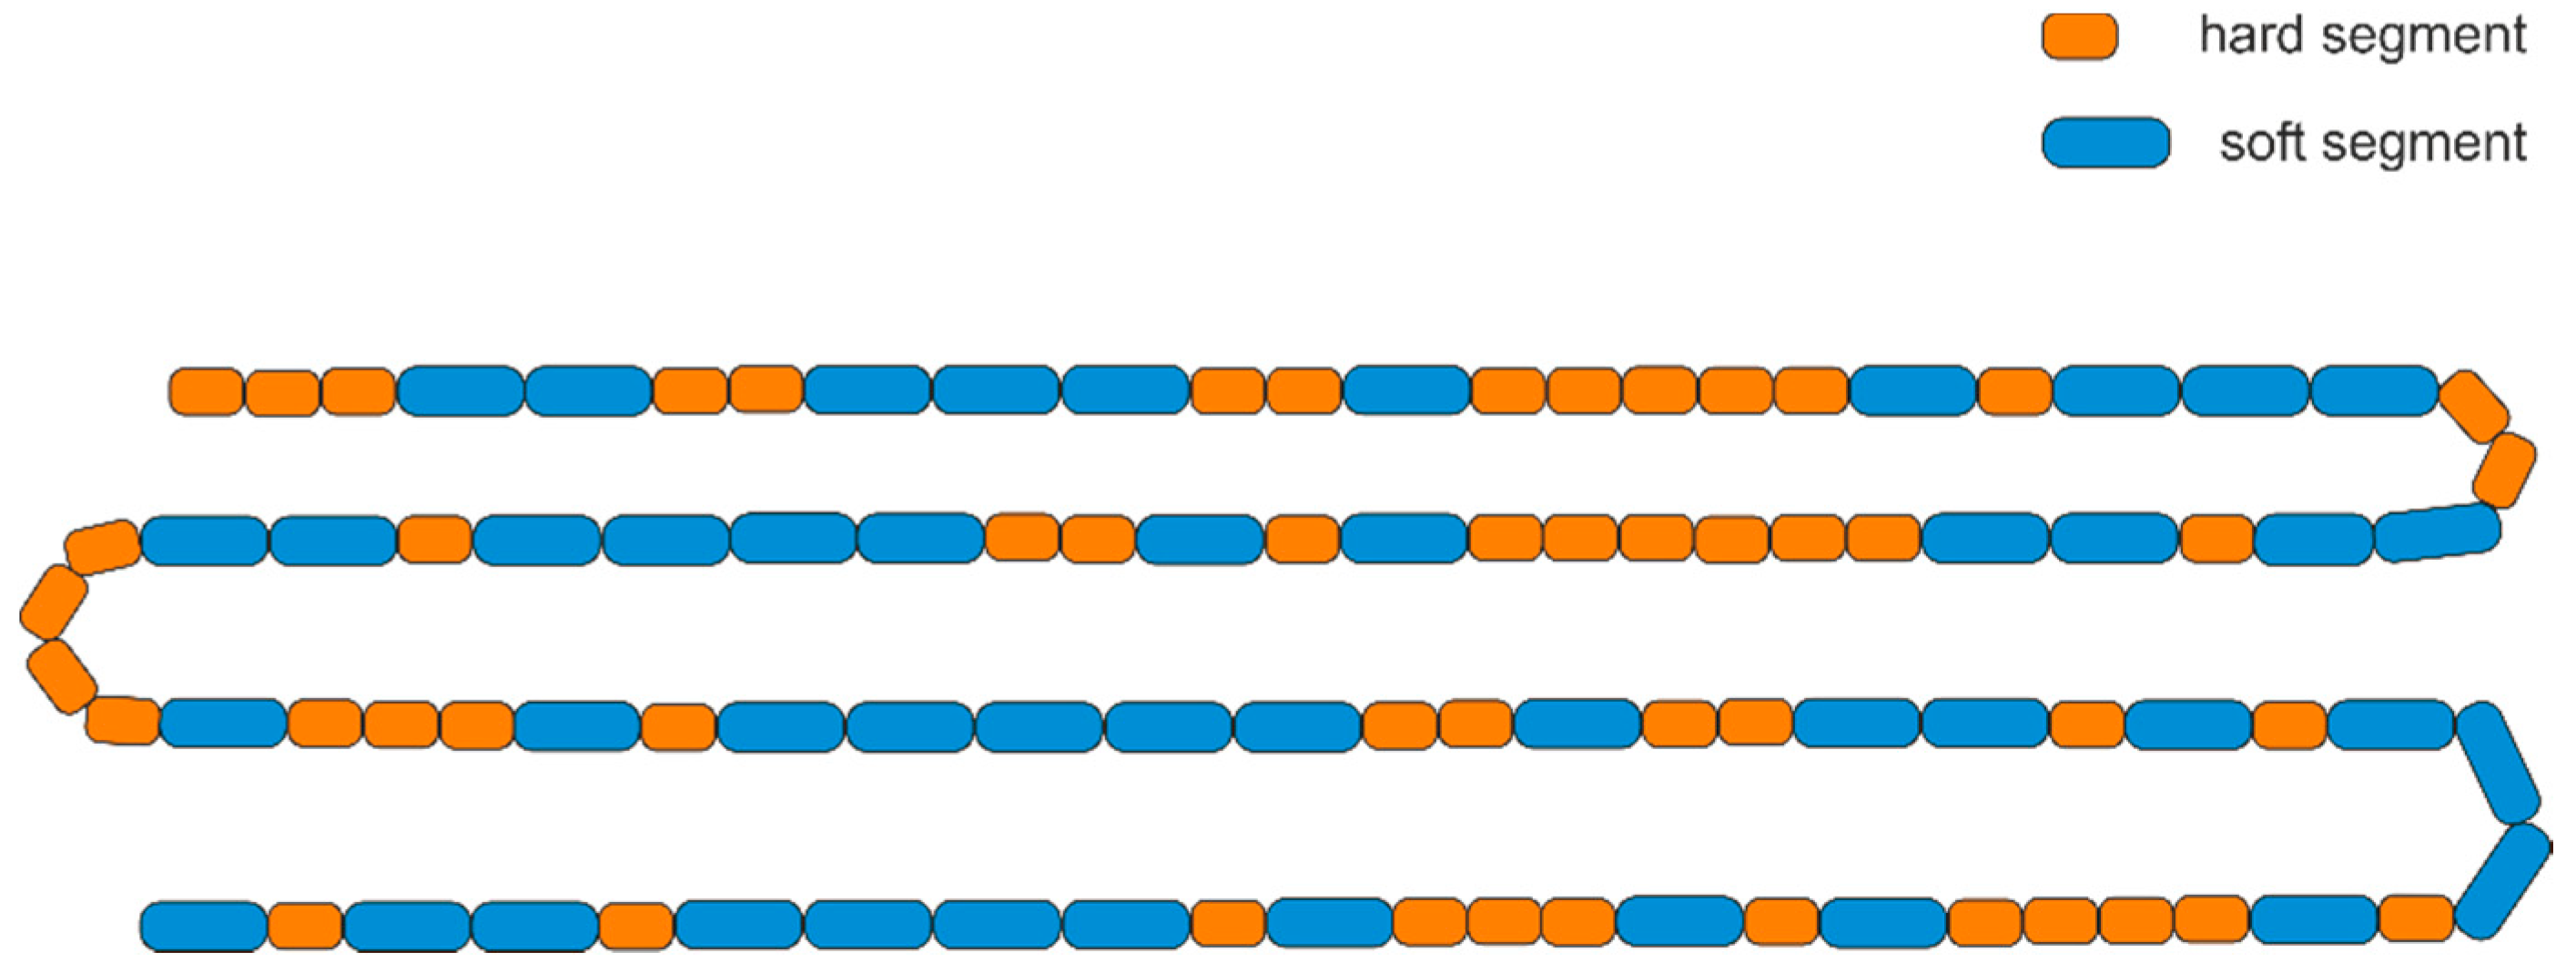
3.1. Characterization of PBT–DLA Structure
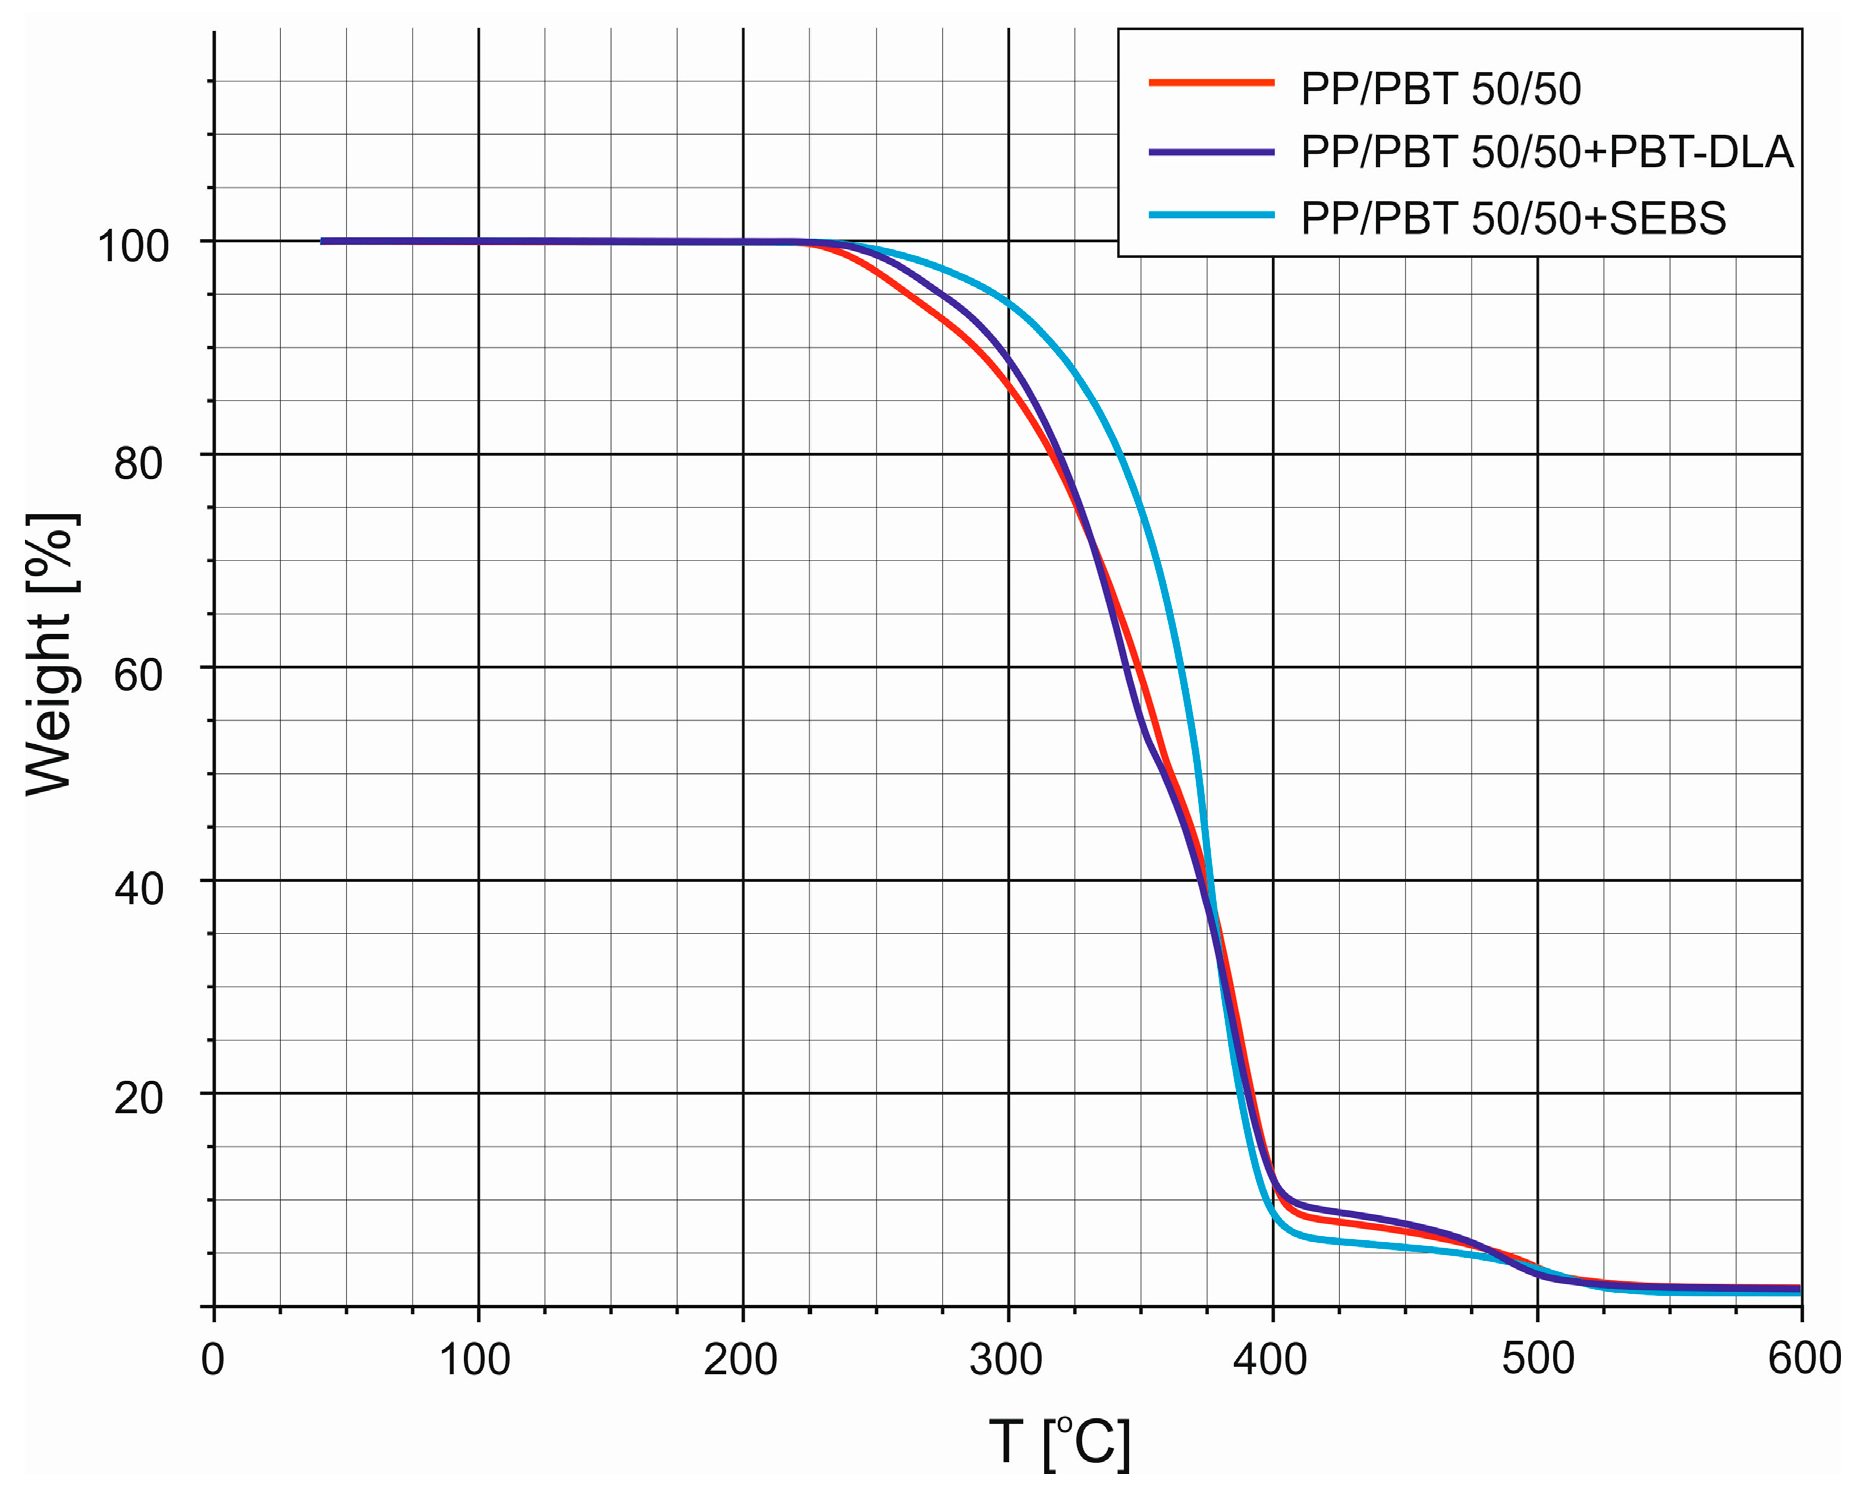
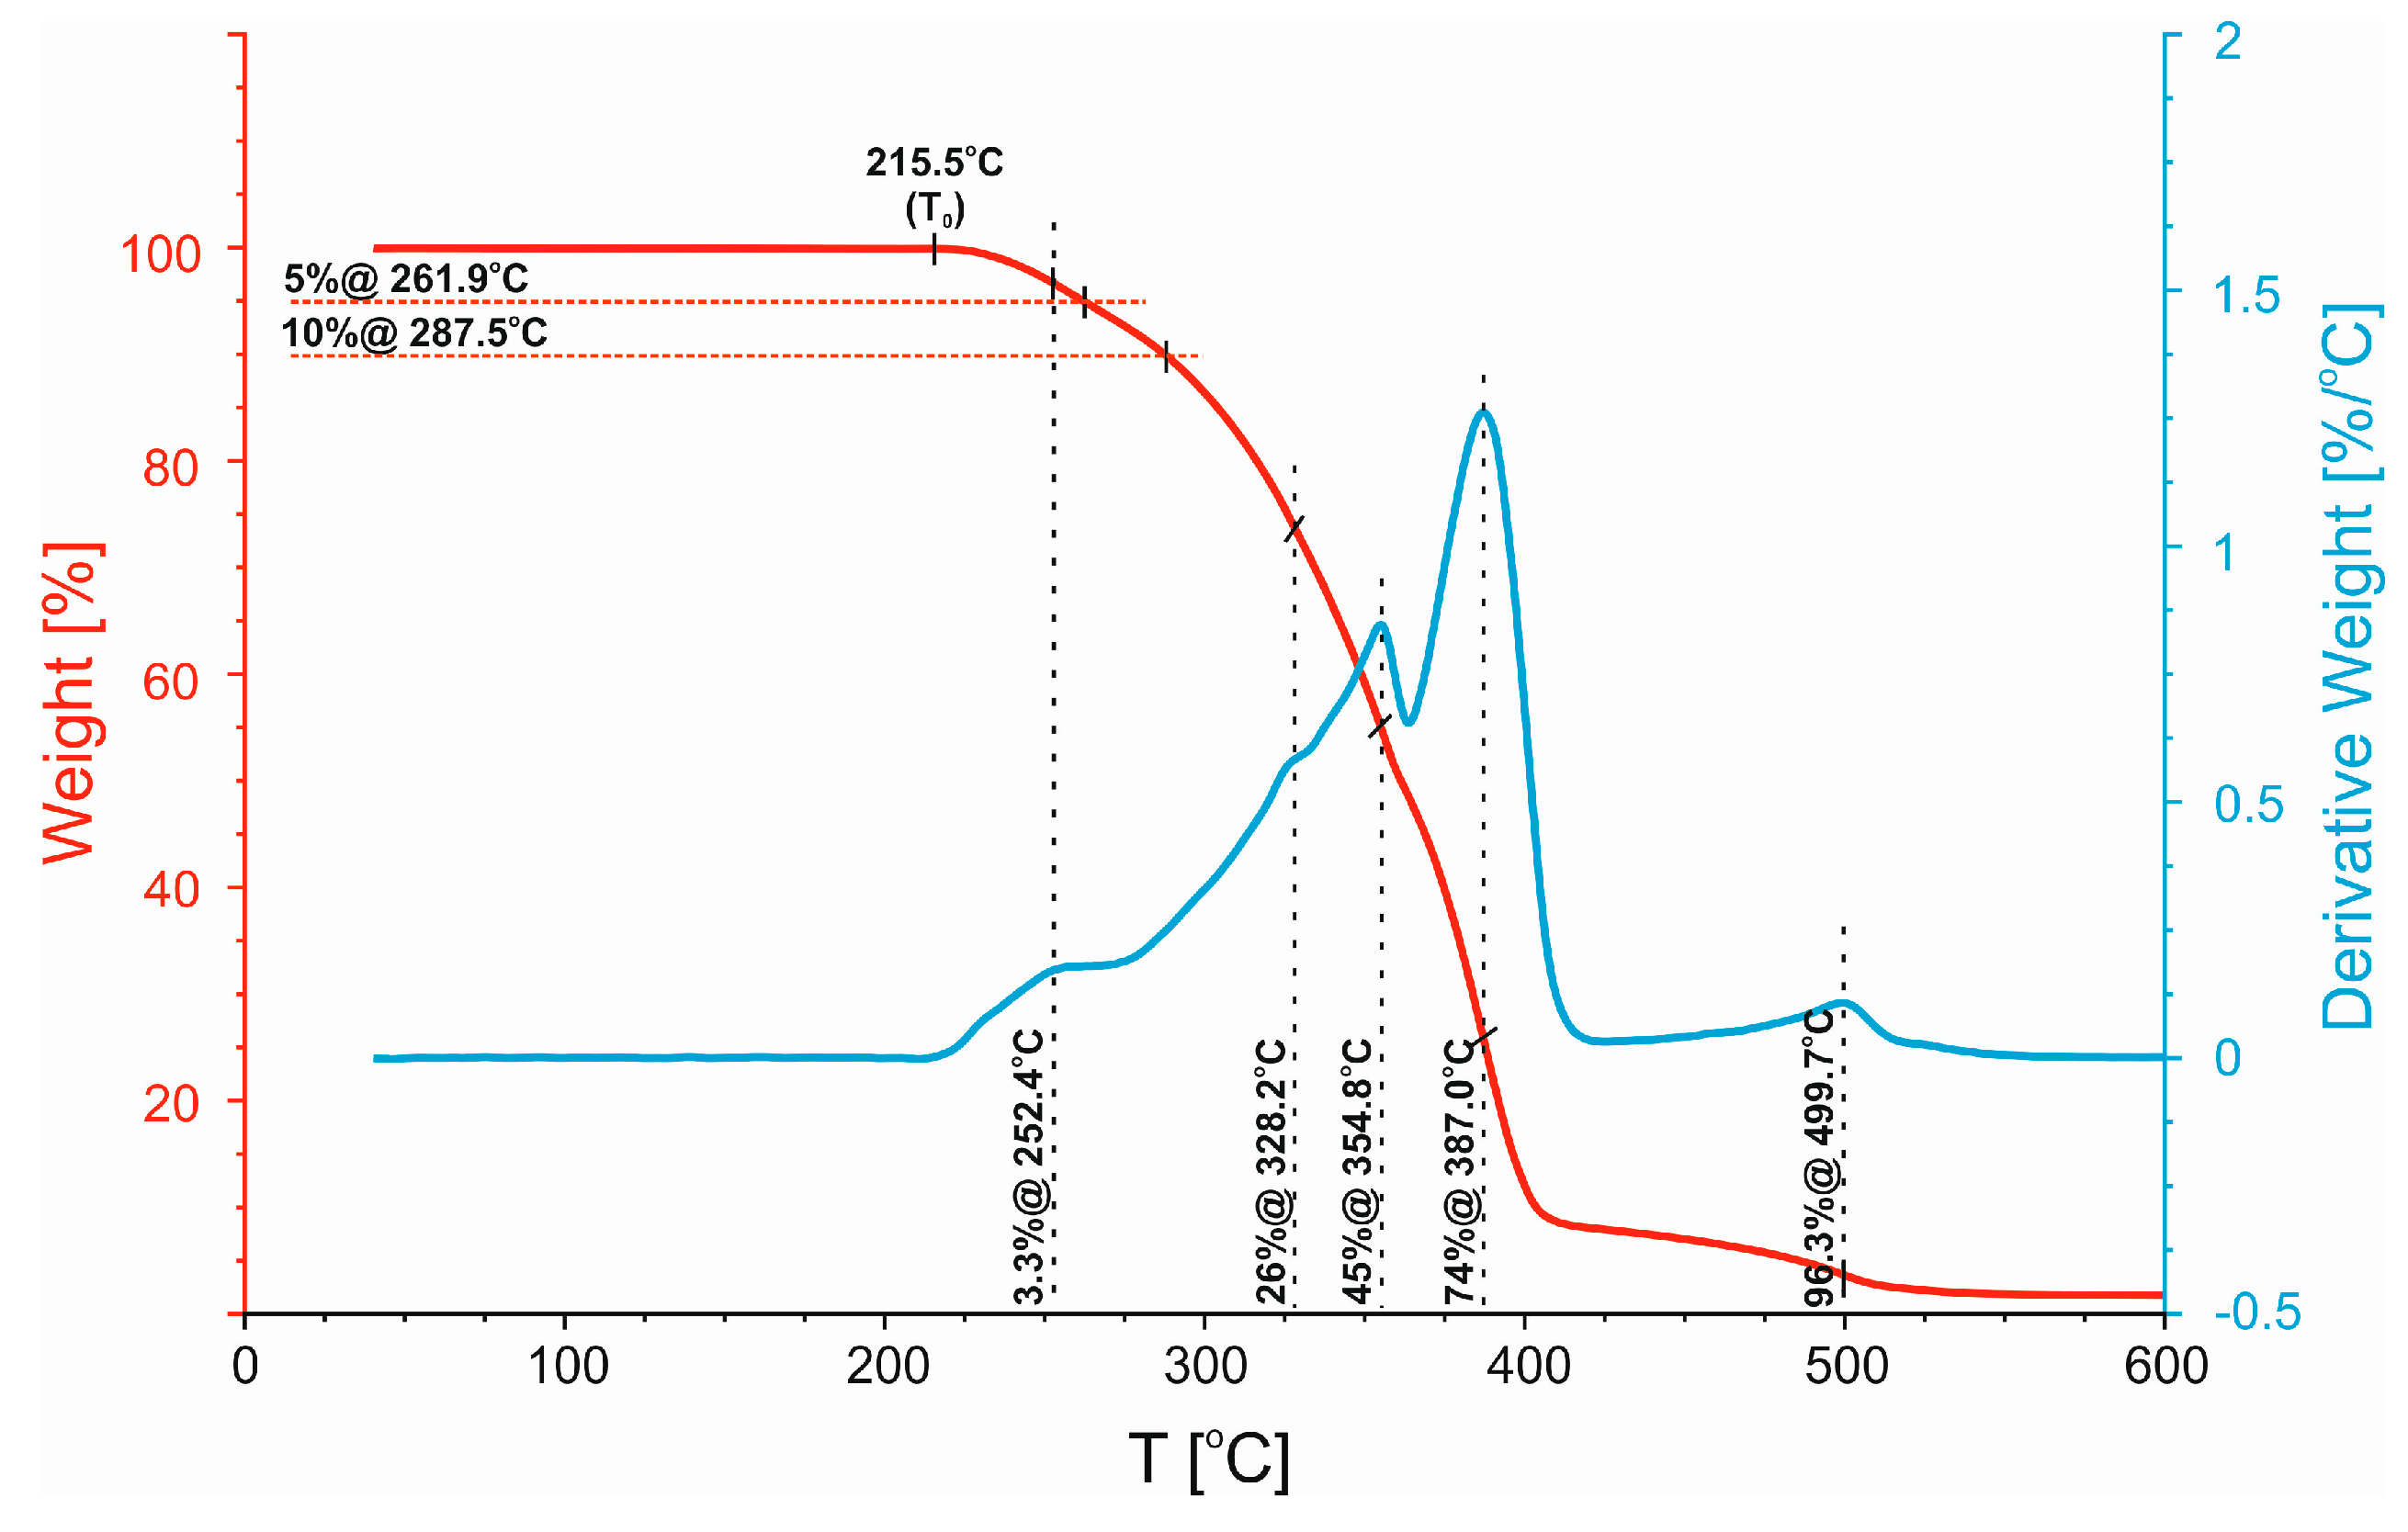
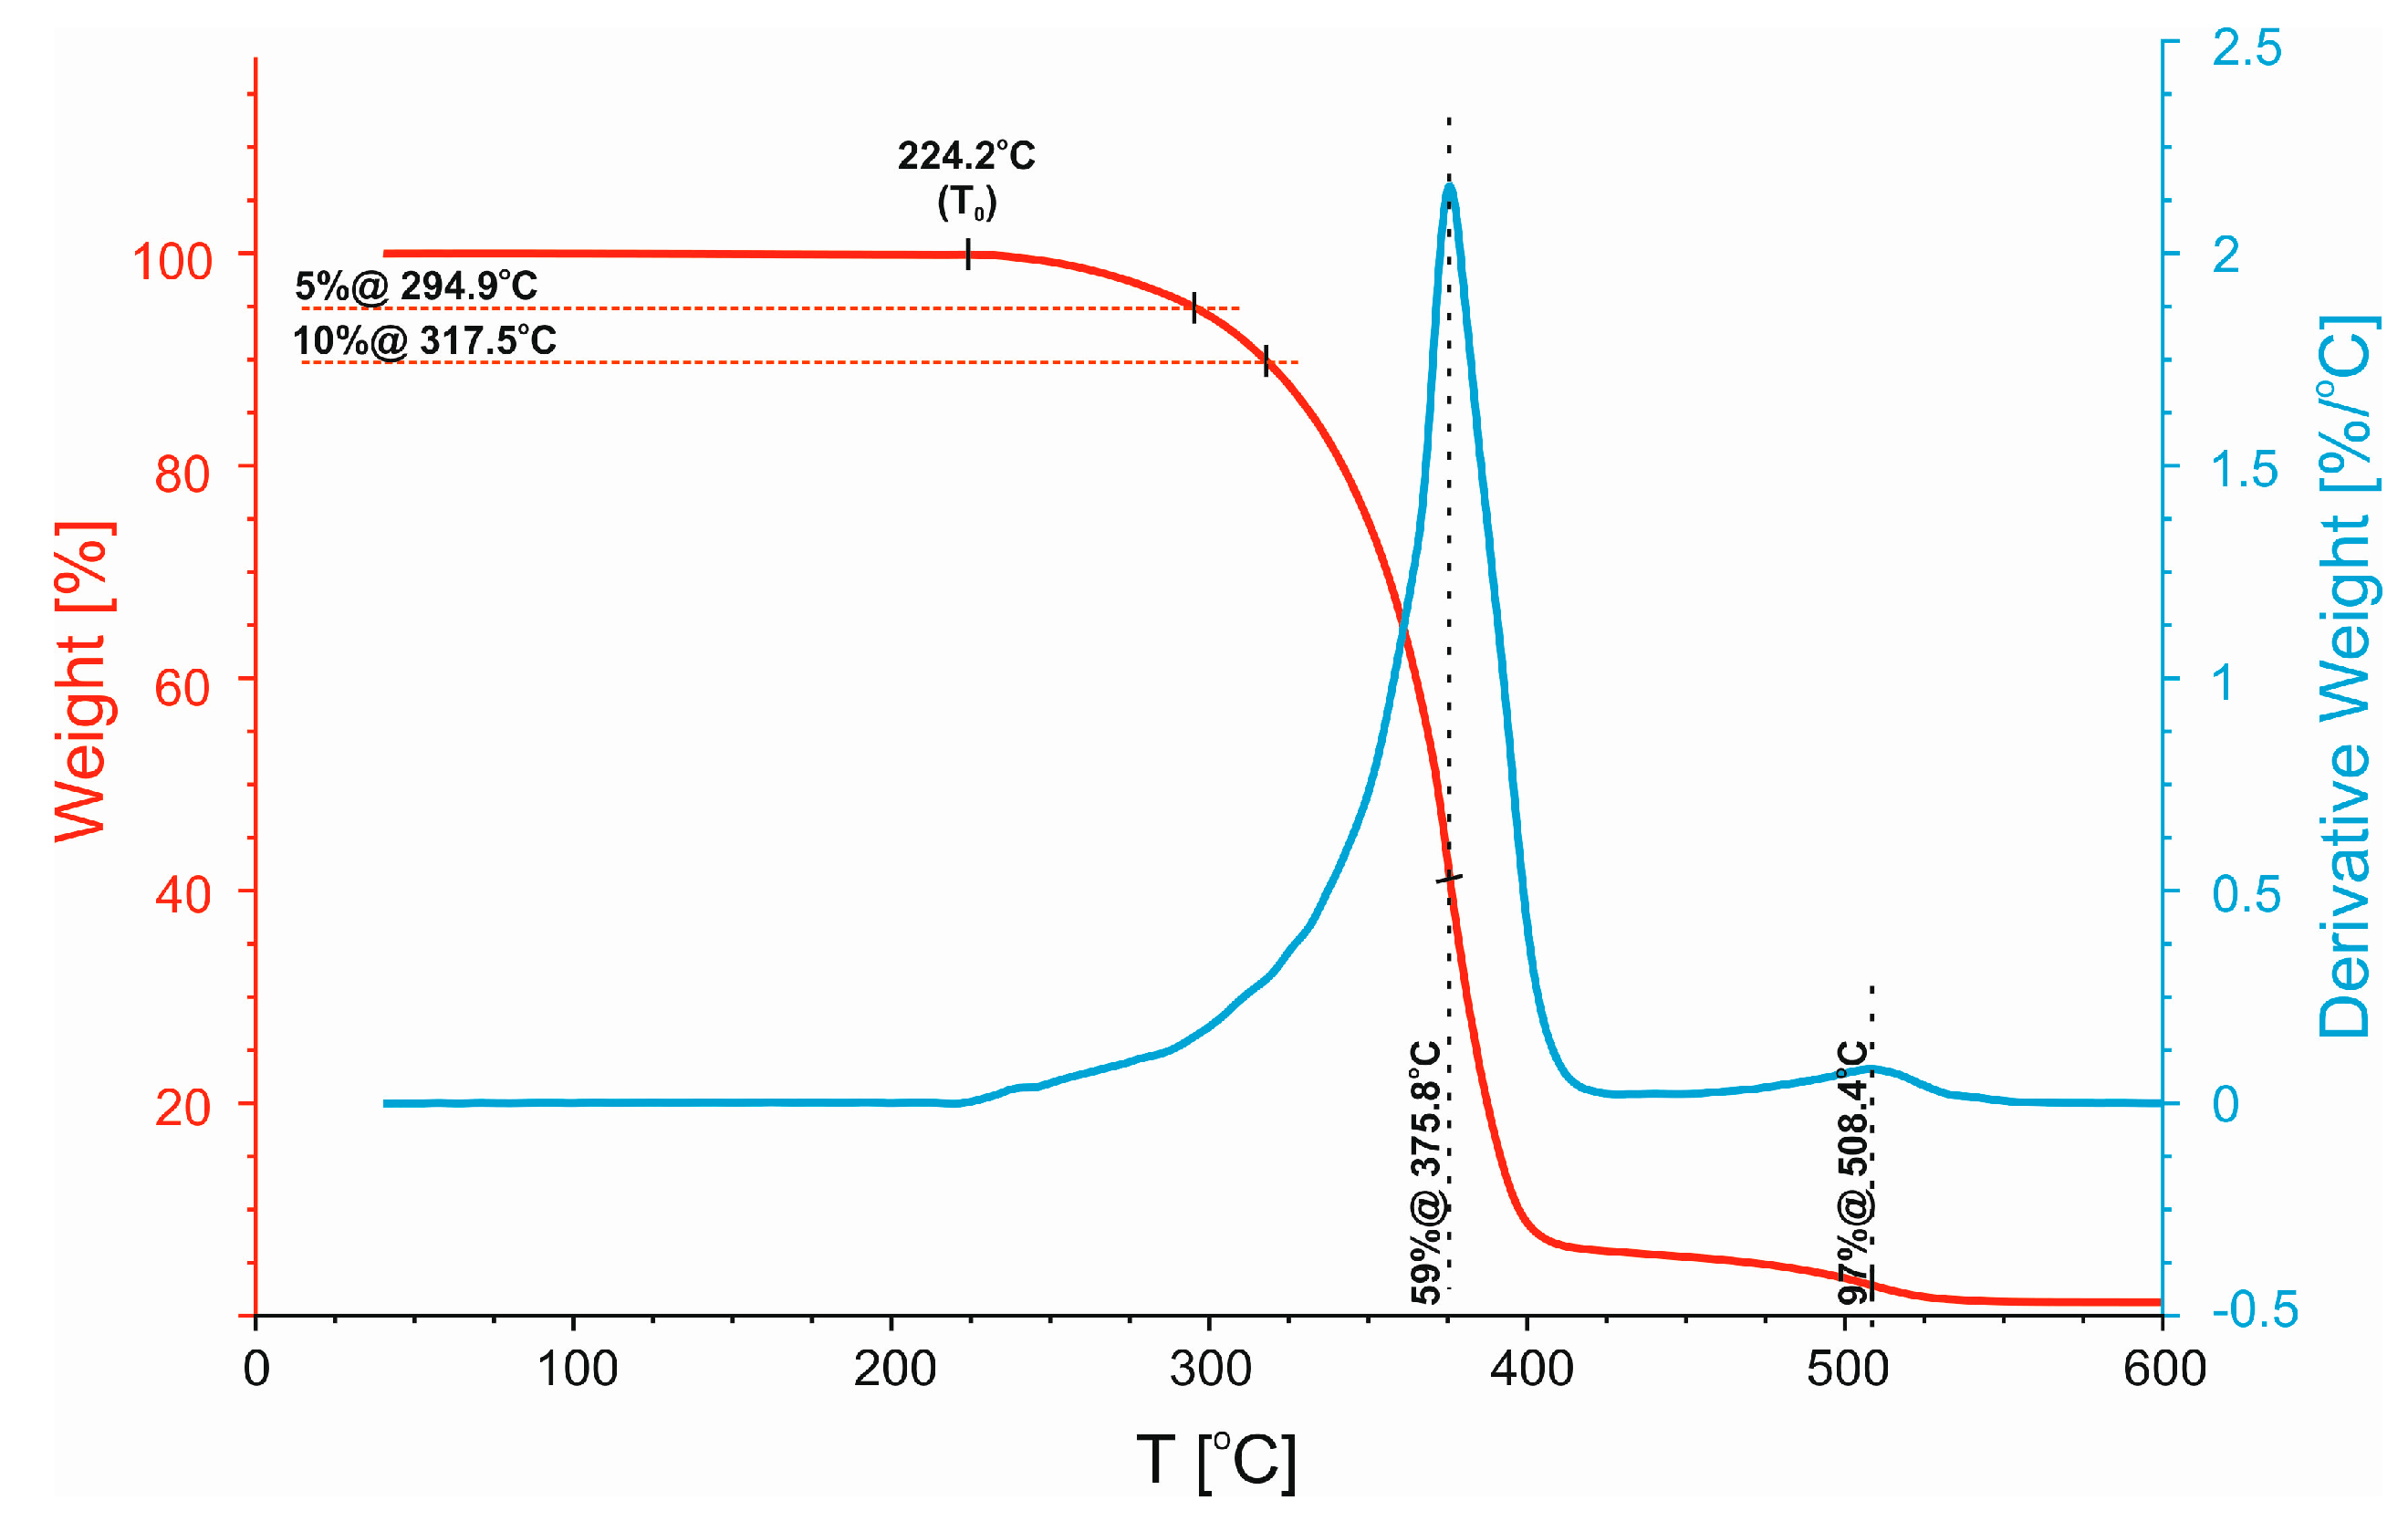
3.2. Thermogravimetric Analysis (TGA)
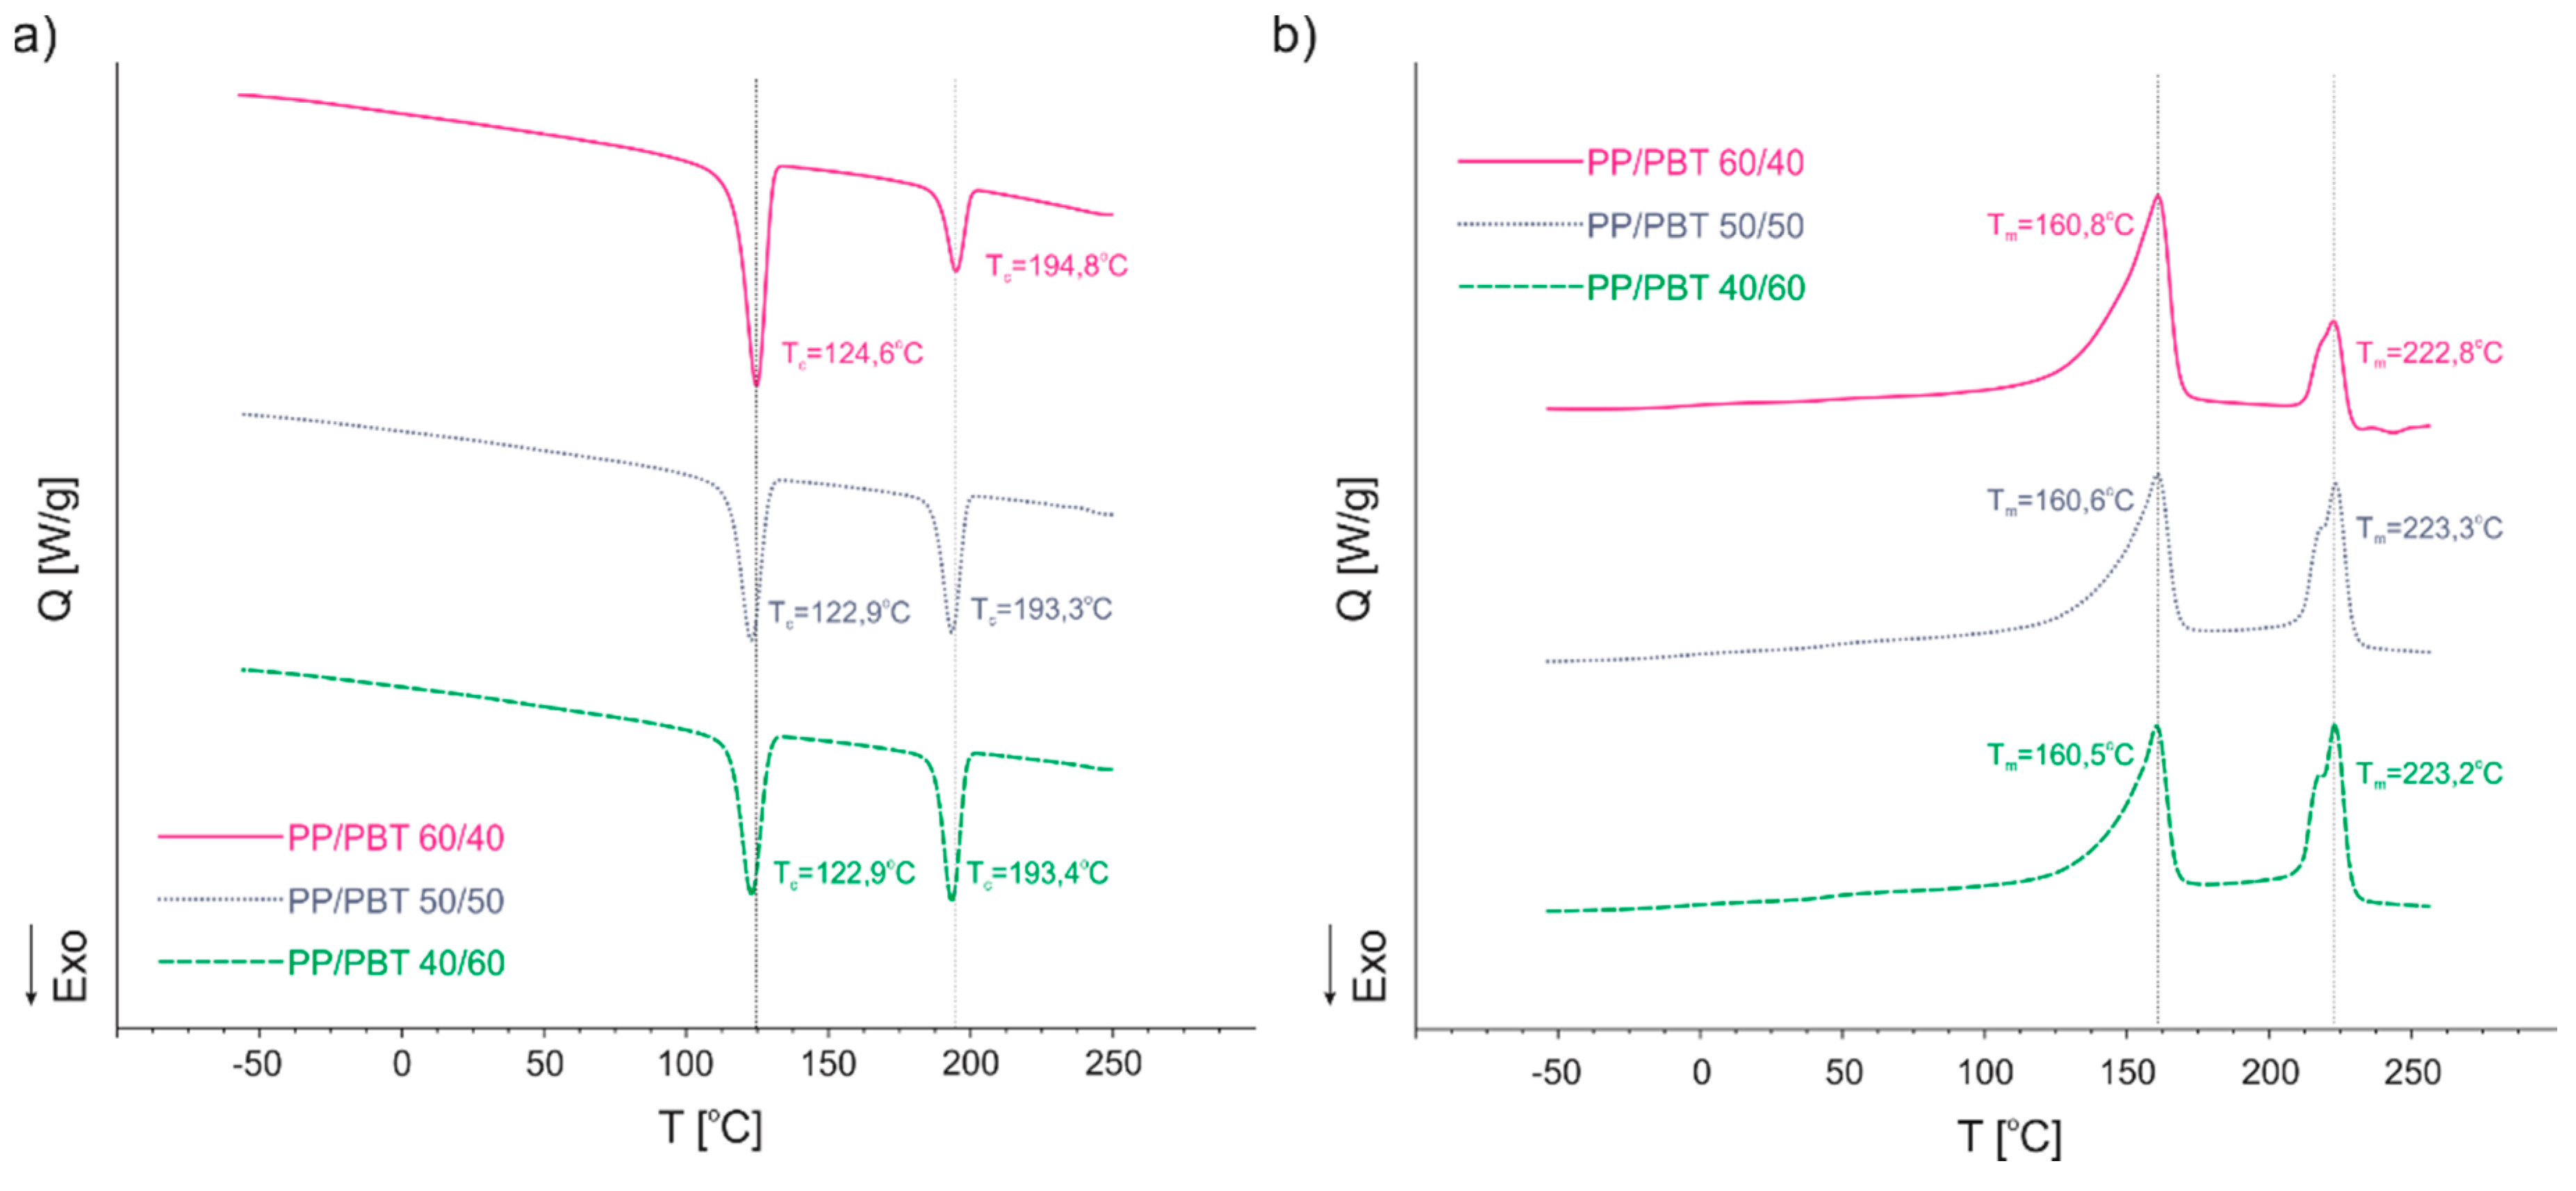
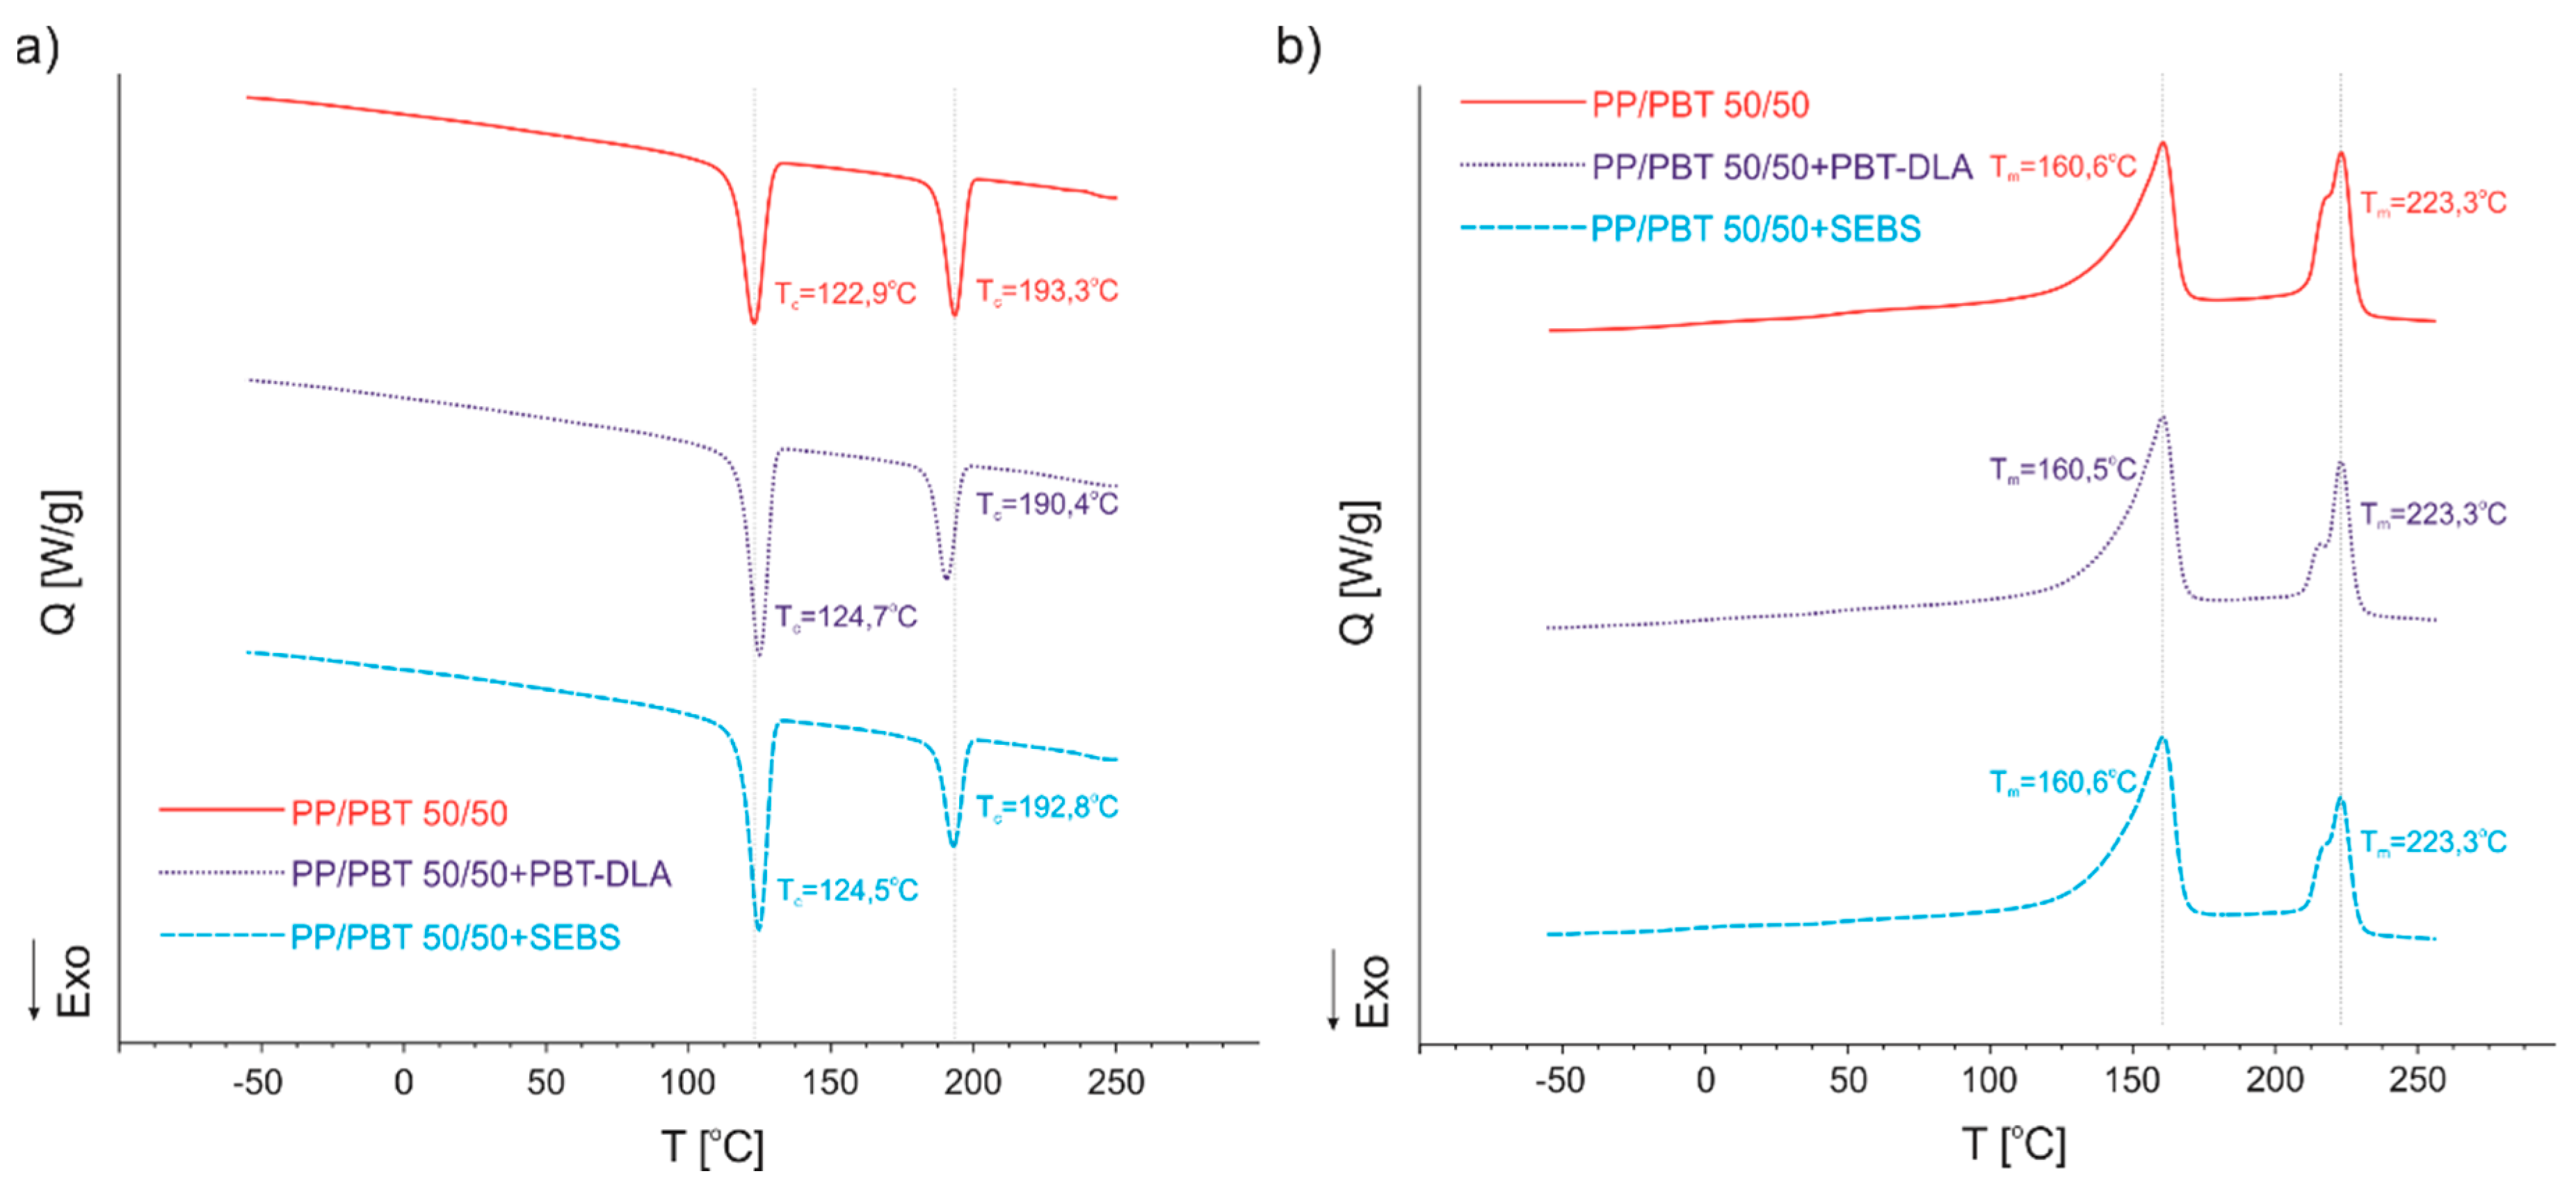
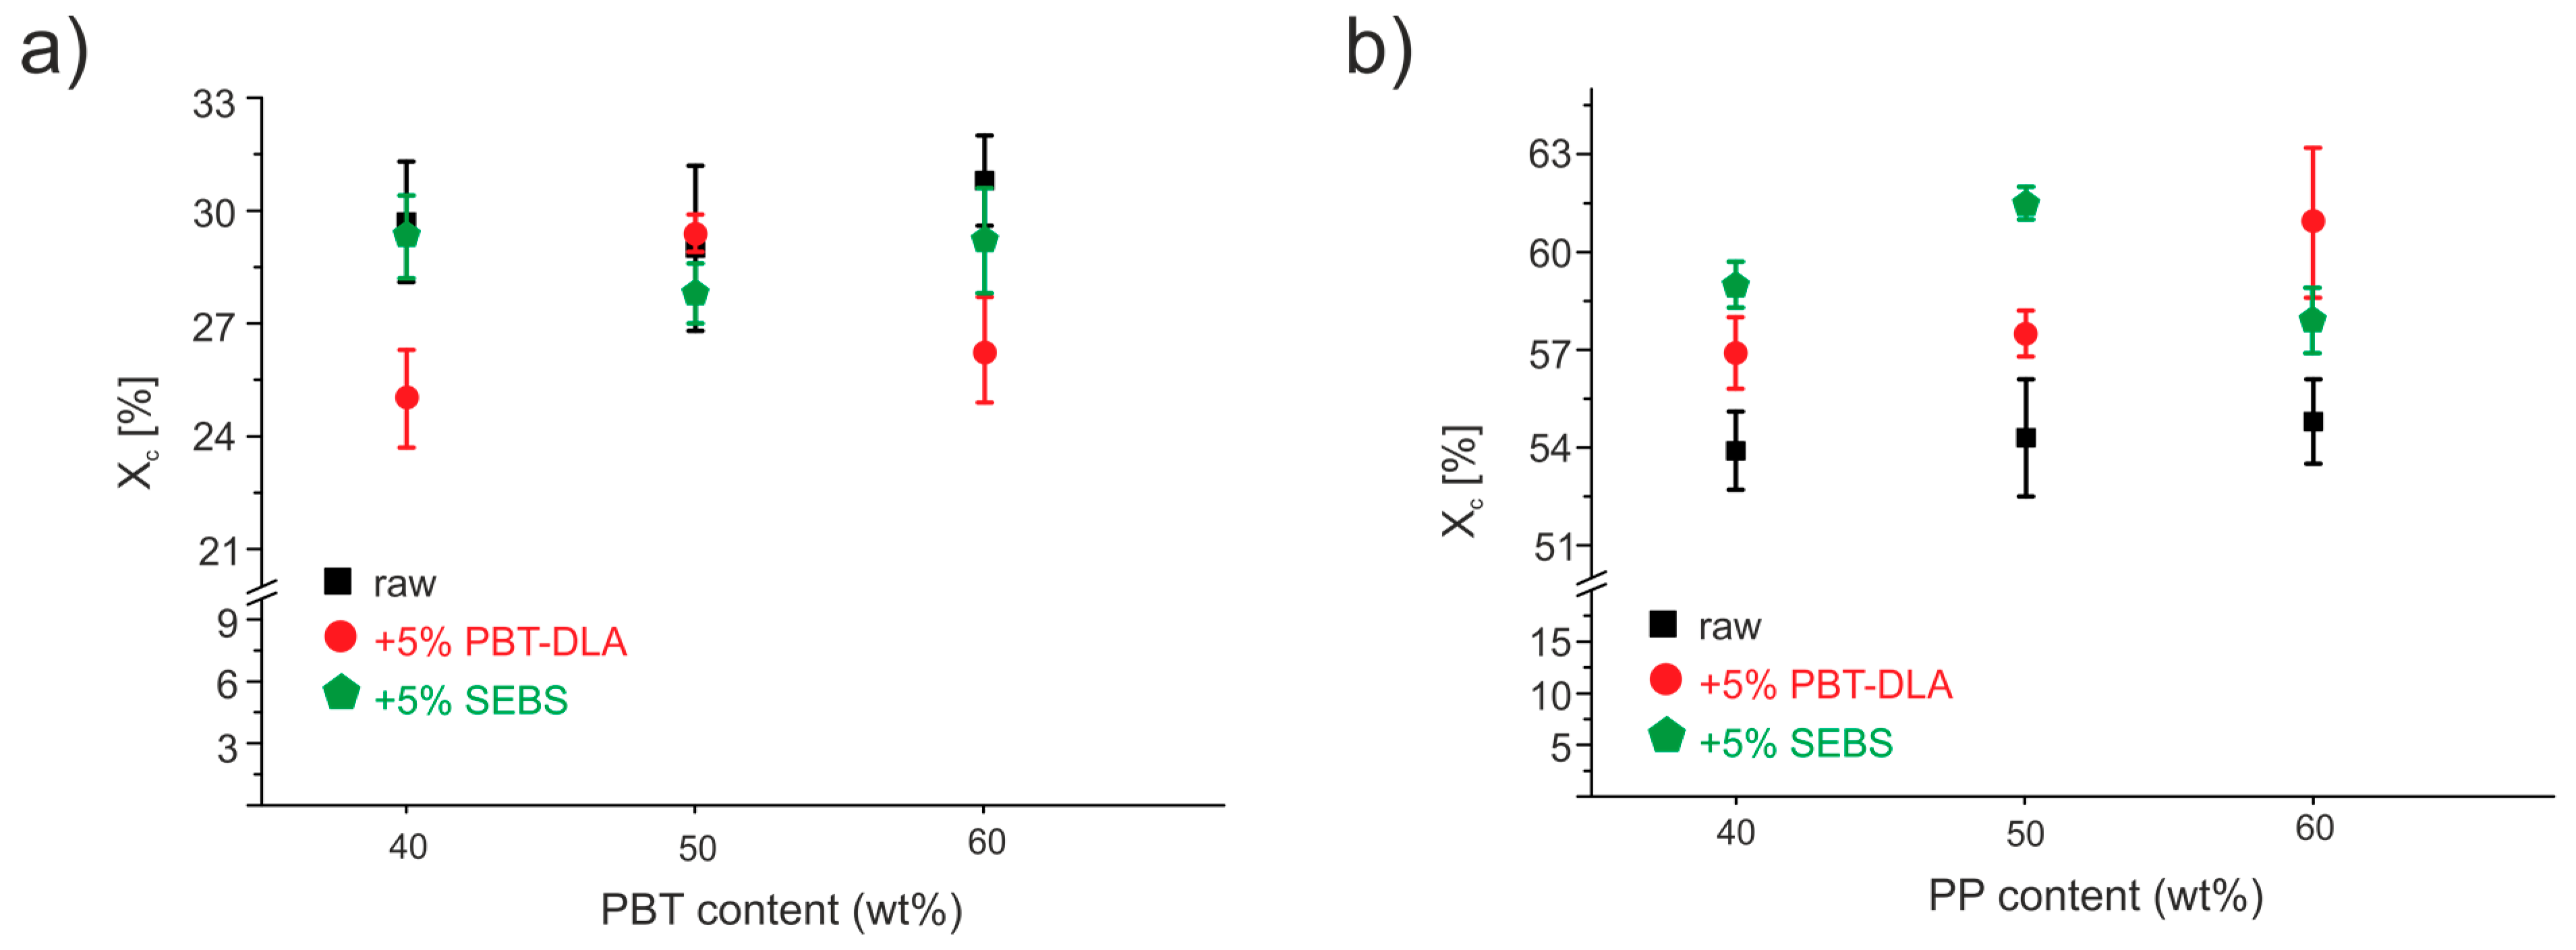
3.3. Differential Scanning Calorimetry (DSC)
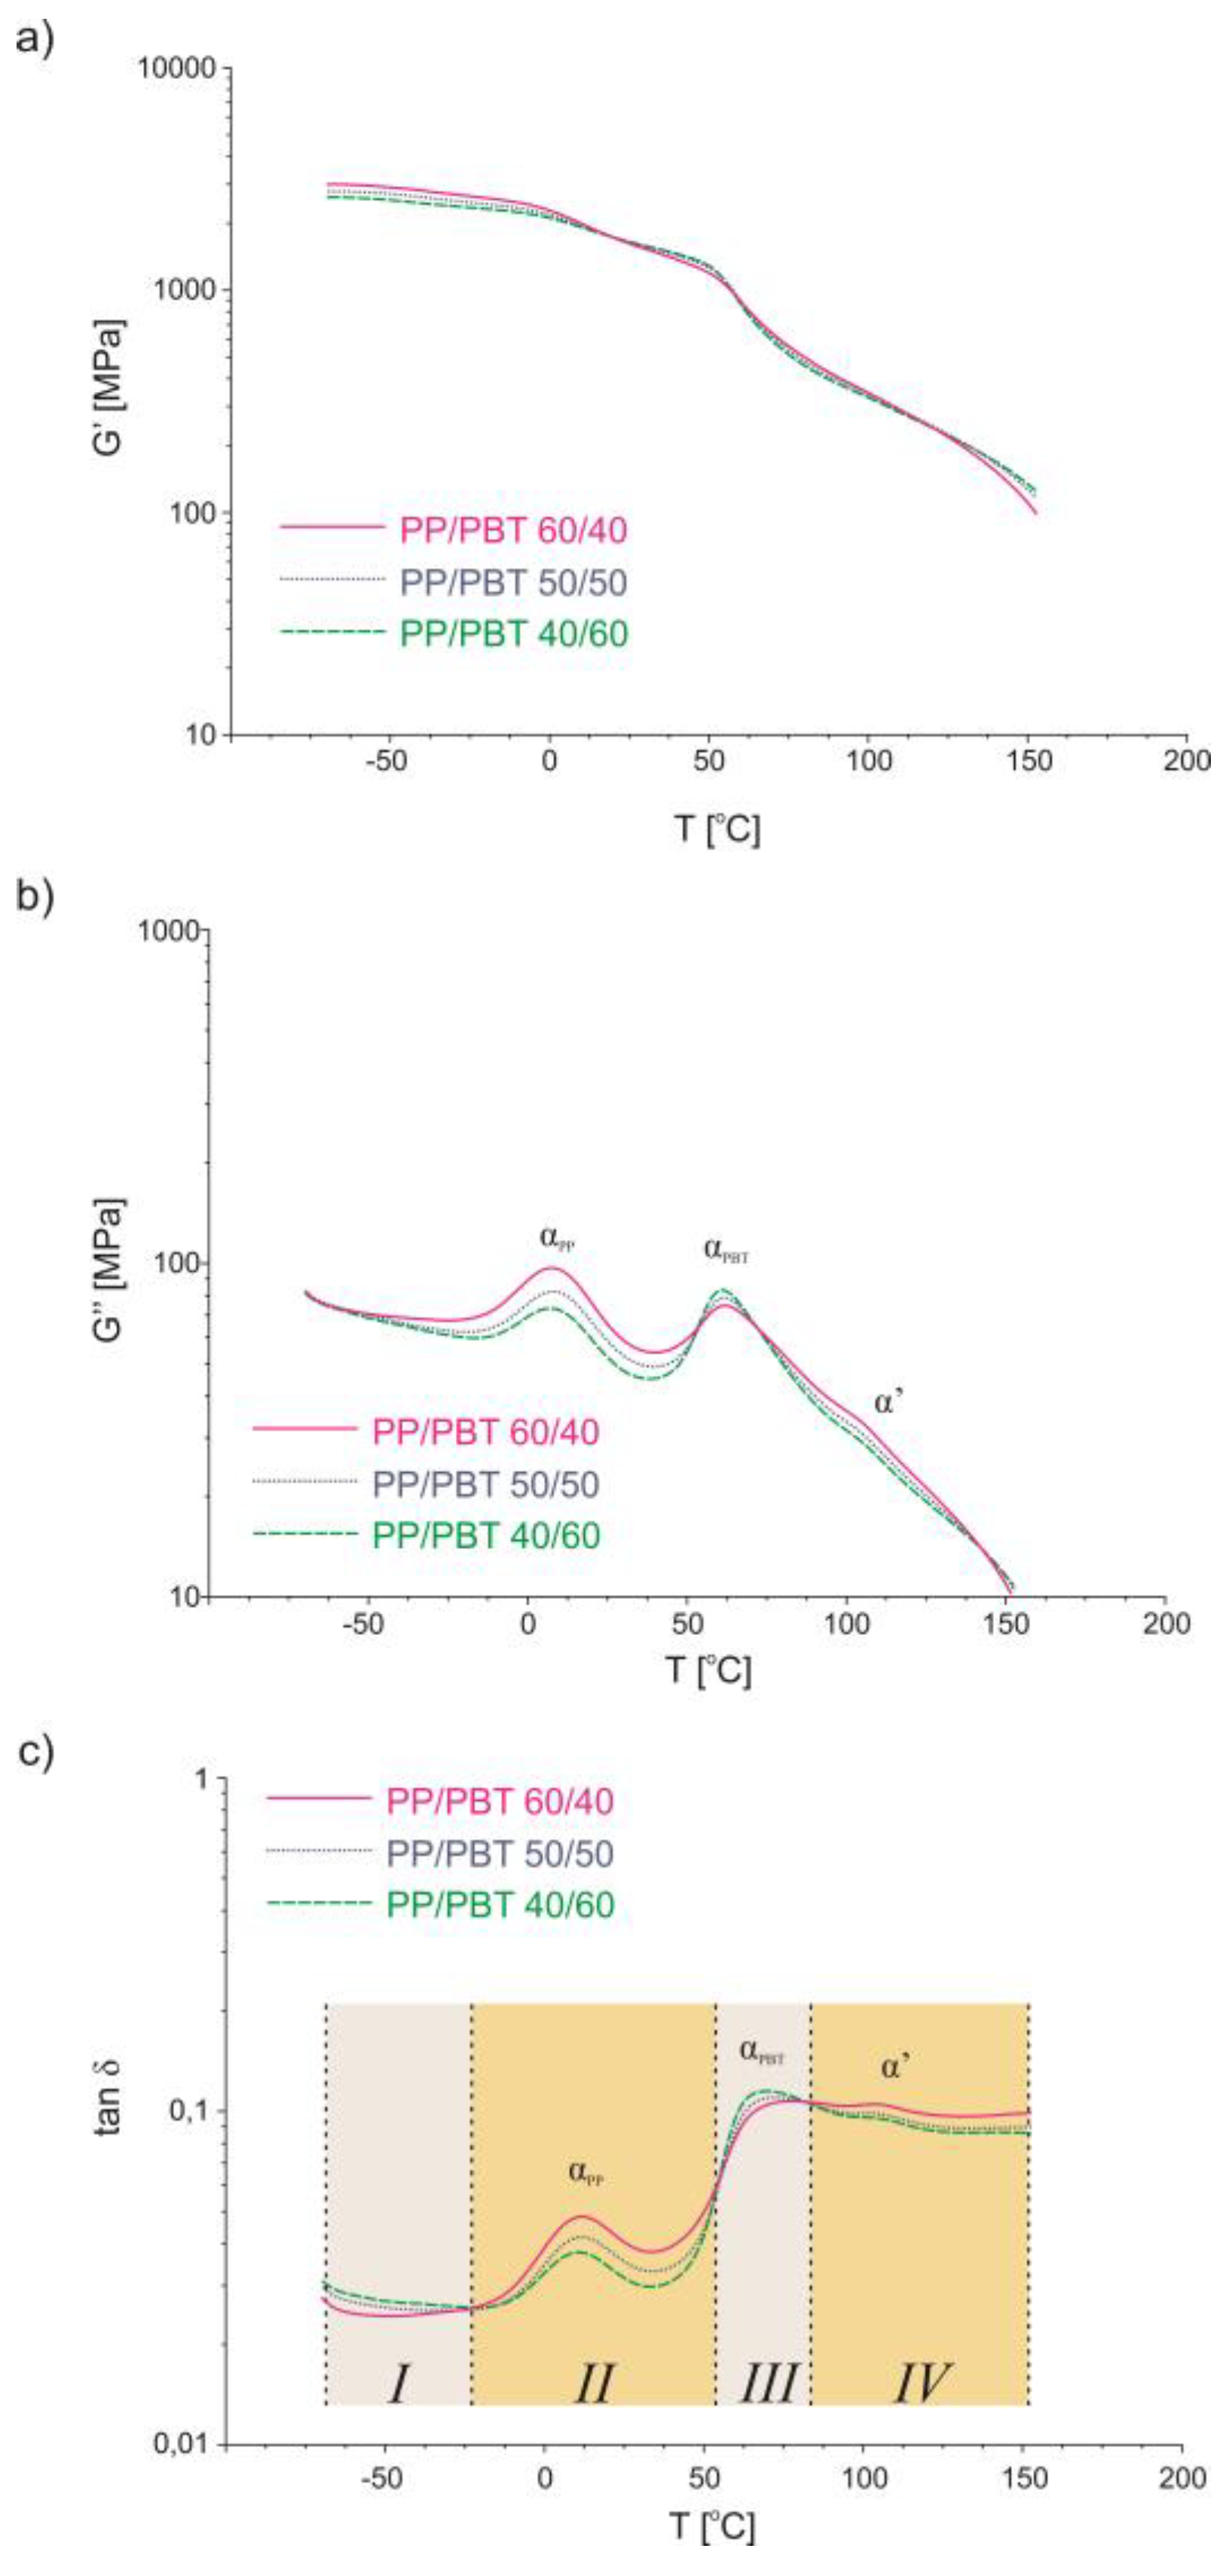
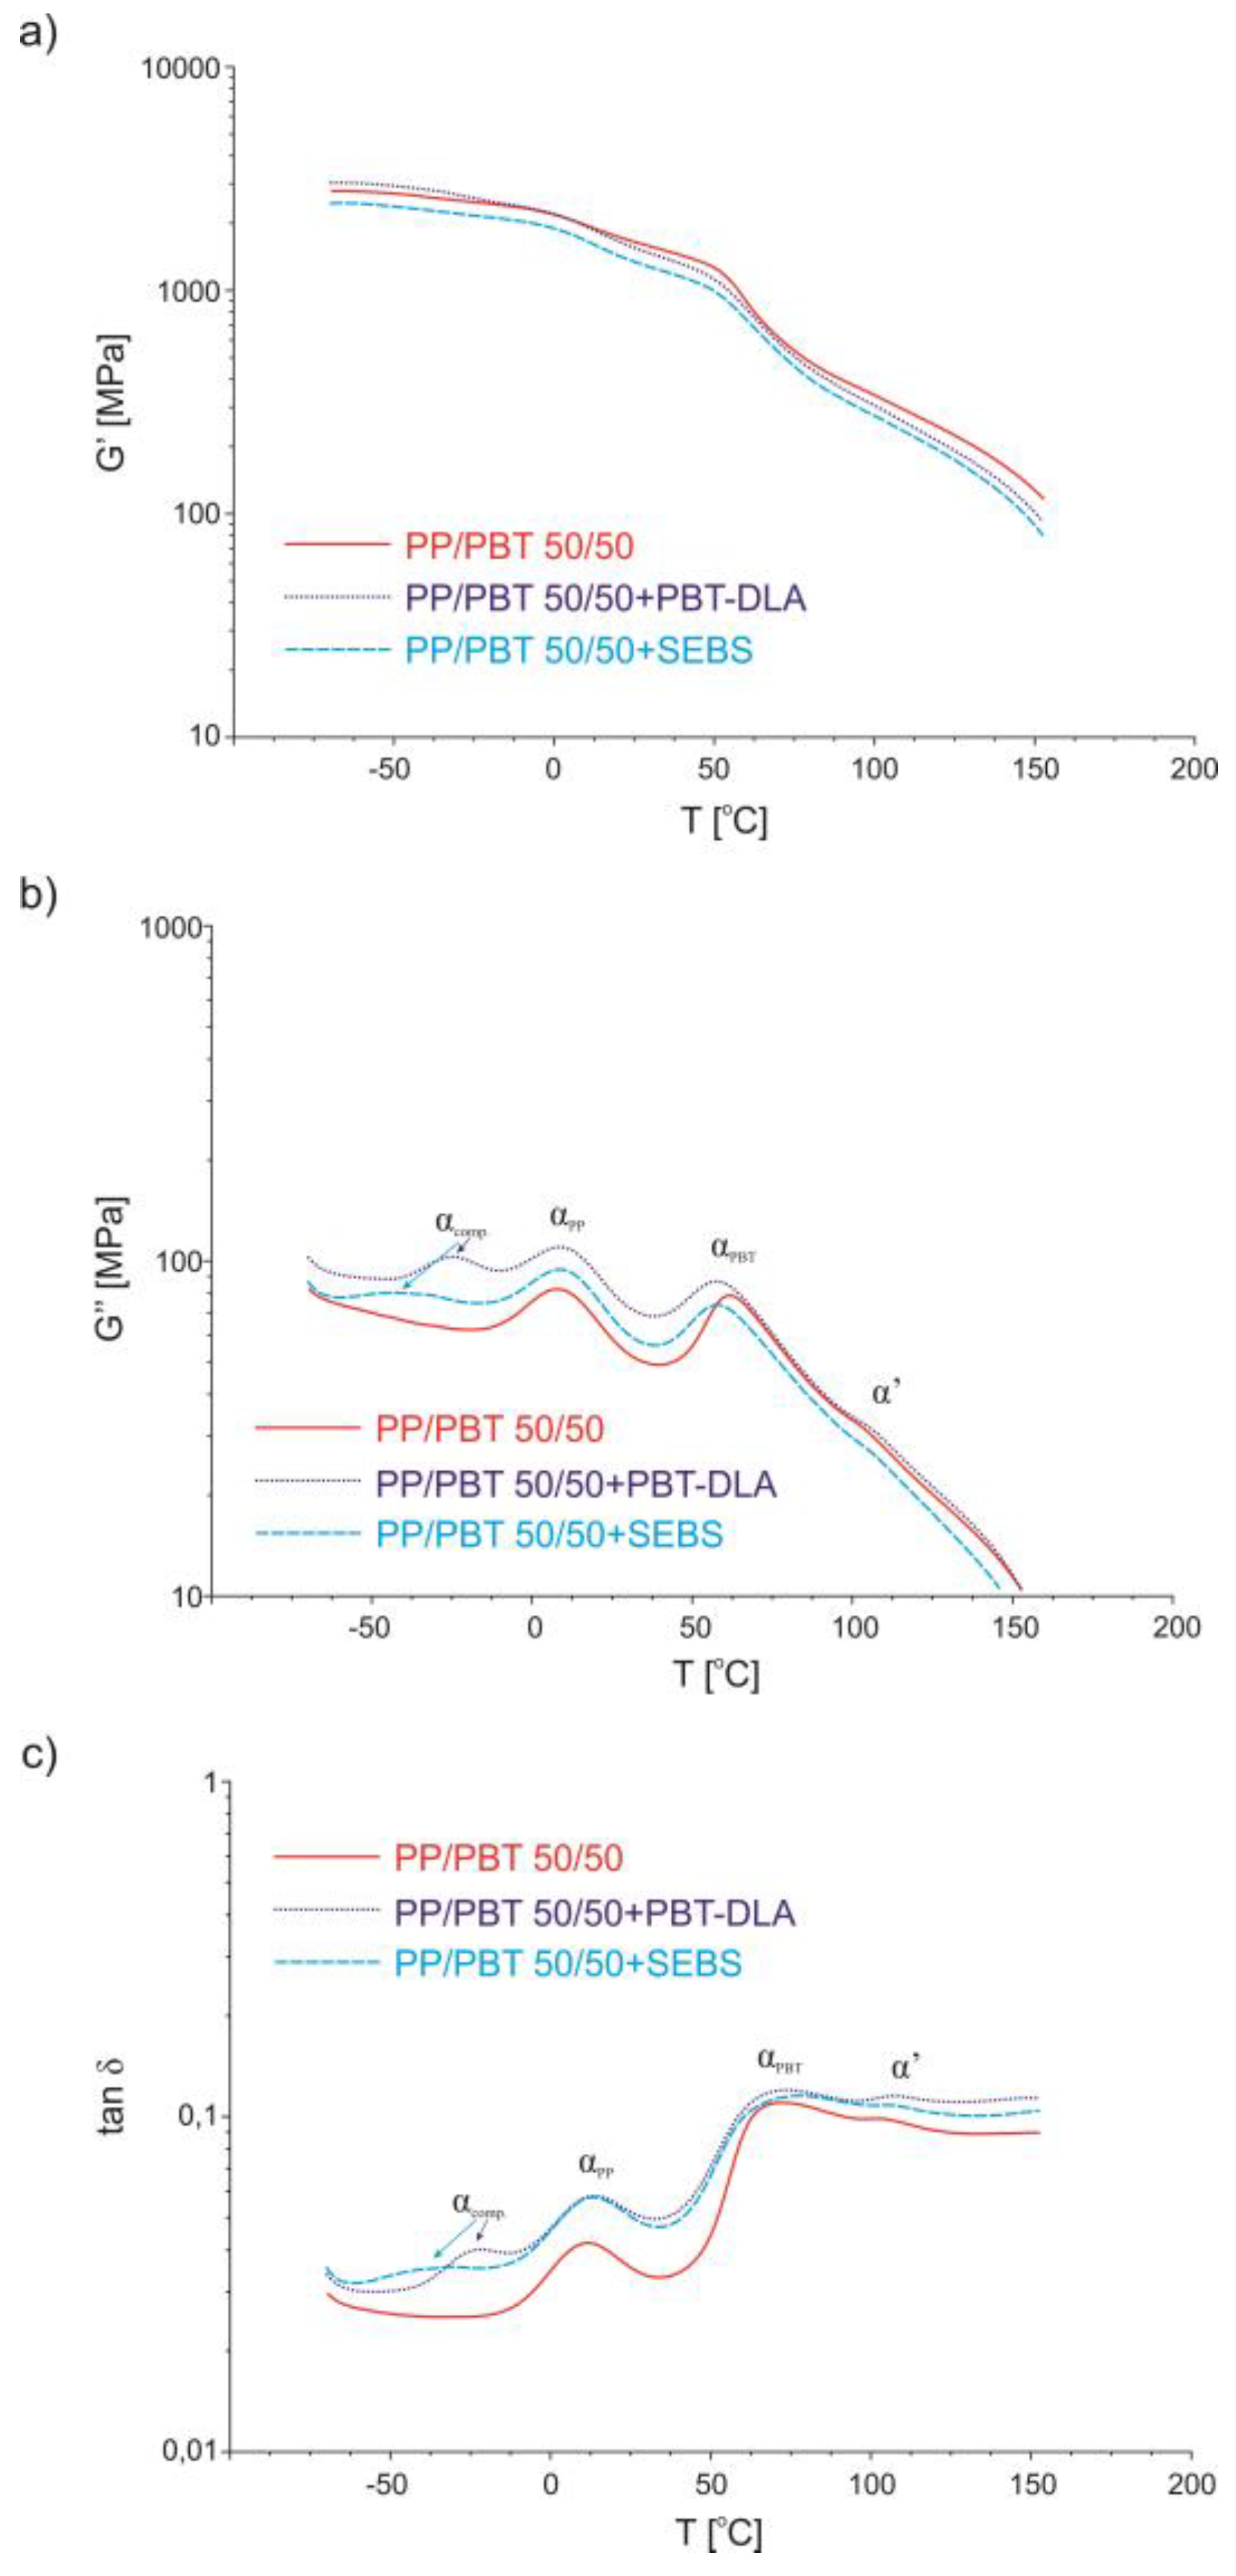
3.4. Dynamic Thermomechanical Analysis
3.5. Mechanical Properties
3.6. Morphology
4. Conclusions
Author Contributions
Funding
Acknowledgments
Conflicts of Interest
References
- Paul, D.R.; Barlow, J.W. Polymer Blends. J. Macromol. Sci. Part C Polym. Rev. 1980, 18, 109–168. [Google Scholar] [CrossRef]
- Kammer, H.W. Phase Behavior of Polymer Blends. J. Macromol. Sci. Part A Chem. 1990, 27, 1713–1732. [Google Scholar] [CrossRef]
- Feldman, D. Polyblend Compatibilization. J. Macromol. Sci. Part A 2005, 42, 587–605. [Google Scholar] [CrossRef]
- Robeson, L. Historical Perspective of Advances in the Science and Technology of Polymer Blends. Polymers 2014, 6, 1251–1265. [Google Scholar] [CrossRef]
- Maris, J.; Bourdon, S.; Brossard, J.-M.; Cauret, L.; Fontaine, L.; Montembault, V. Mechanical recycling: Compatibilization of mixed thermoplastic wastes. Polym. Degrad. Stab. 2018, 147, 245–266. [Google Scholar] [CrossRef]
- Zhu, Y.; Liang, C.; Bo, Y.; Xu, S. Compatibilization of polypropylene/recycled polyethylene terephthalate blends with maleic anhydride grafted polypropylene in the presence of diallyl phthalate. J. Polym. Res. 2015, 22, 35. [Google Scholar] [CrossRef]
- Van Kets, K.; Delva, L.; Ragaert, K. Structural stabilizing effect of SEBSgMAH on a PP-PET blend for multiple mechanical recycling. Polym. Degrad. Stab. 2019, 166, 60–72. [Google Scholar] [CrossRef]
- Noorunnisa Khanam, P.; AlMaadeed, M.A. Improvement of ternary recycled polymer blend reinforced with date palm fibre. Mater. Des. 2014, 60, 532–539. [Google Scholar] [CrossRef]
- Baccouch, Z.; Mbarek, S.; Jaziri, M. Experimental investigation of the effects of a compatibilizing agent on the properties of a recycled poly(ethylene terephthalate)/polypropylene blend. Polym. Bull. 2017, 74, 839–856. [Google Scholar] [CrossRef]
- Barhoumi, N.; Jaziri, M.; Massardier, V.; Cassagnau, P. Valorization of poly(butylene terephthalate) wastes by blending with virgin polypropylene: Effect of the composition and the compatibilization. Polym. Eng. Sci. 2008, 48, 1592–1599. [Google Scholar] [CrossRef]
- Hung, C.J.; Chuang, H.Y.; Chang, F.C. Novel reactive compatibilization strategy on immiscible polypropylene and polystyrene blend. J. Appl. Polym. Sci. 2008, 107, 831–839. [Google Scholar] [CrossRef]
- Bussink, J.; van de Grampel, H.T. Polymer Blends. In Ullmann’s Encyclopedia of Industrial Chemistry; Wiley: Weinheim, Germany, 2000; Volume 29, pp. 1–91. [Google Scholar] [CrossRef]
- Joshi, J.; Lehman, R.; Nosker, T. Selected physical characteristics of polystyrene/high density polyethylene composites prepared from virgin and recycled materials. J. Appl. Polym. Sci. 2006, 99, 2044–2051. [Google Scholar] [CrossRef]
- Halimatudahliana, A.; Ismail, H.; Nasir, M. Morphological studies of uncompatibilized and compatibilized polystyrene/polypropylene blend. Polym. Test. 2002, 21, 263–267. [Google Scholar] [CrossRef]
- Ismail, H.H.; Nasir, M. The effect of various compatibilizers on mechanical properties of polystyrene/polypropylene blend. Polym. Test. 2002, 21, 163–170. [Google Scholar] [CrossRef]
- Barentsen, W.M.; Heikens, D. Mechanical properties of polystyrene/low density polyethylene blends. Polymer 1973, 14, 579–583. [Google Scholar] [CrossRef]
- Del Giudice, L.; Cohen, R.E.; Attalla, G.; Bertinotti, F. Compatibilizing effect of a diblock copolymer of isotactic polystyrene and isotactic polypropylene in blends of the corresponding homopolymers. J. Appl. Polym. Sci. 1985, 30, 4305–4318. [Google Scholar] [CrossRef]
- Angola, J.C.; Fujita, Y.; Sakai, T.; Inoue, T. Compatibilizer-aided toughening in polymer blends consisting of brittle polymer particles dispersed in a ductile polymer matrix. J. Polym. Sci. Part B Polym. Phys. 1988, 26, 807–816. [Google Scholar] [CrossRef]
- Plochocki, A.P.; Dagli, S.S.; Andrews, R.D. The interface in binary mixtures of polymers containing a corresponding block copolymer: Effects of industrial mixing processes and of coalescence. Polym. Eng. Sci. 1990, 30, 741–752. [Google Scholar] [CrossRef]
- D’Orazio, L.; Guarino, R.; Mancarella, C.; Martuscelli, E.; Cecchin, G. Isotactic polypropylene/polystyrene blends: Effects of the addition of a graft copolymer of propylene with styrene. J. Appl. Polym. Sci. 1997, 65, 1539–1553. [Google Scholar] [CrossRef]
- Utracki, L.A. Polymer Blends Handbook; Kluwer Academic Publishers: Dordrecht, Germany, 2003. [Google Scholar]
- Baker, W.E.; Saleem, M. Polystyrene-polyethylene melt blends obtained through reactive mixing process. Polym. Eng. Sci. 1987, 27, 1634–1641. [Google Scholar] [CrossRef]
- Wang, D.; Xie, X.M. Novel strategy for ternary polymer blend compatibilization. Polymer 2006, 47, 7859–7863. [Google Scholar] [CrossRef]
- Xanthos, M.; Young, M.W.; Biesenberger, J.A. Polypropylene/polyethylene terephthalate blends compatibilized through functionalization. Polym. Eng. Sci. 1990, 30, 355–365. [Google Scholar] [CrossRef]
- Van Bruggen, E.P.A.; Koster, R.P.; Picken, S.J.; Ragaert, K. Influence of Processing Parameters and Composition on the Effective Compatibilization of Polypropylene–Poly(ethylene terephthalate) Blends. Int. Polym. Process. 2016, 31, 179–187. [Google Scholar] [CrossRef]
- Pracella, M.; Chionna, D.; Pawlak, A.; Galeski, A. Reactive mixing of PET and PET/PP blends with glycidyl methacrylate- modified styrene-b-(ethylene-co-olefin) block copolymers. J. Appl. Polym. Sci. 2005, 98, 2201–2211. [Google Scholar] [CrossRef]
- Debbah, I.; Krache, R.; Belkouissem, K.; Benachour, D.; Cagiao, M.E. Effect of a thermoplastic elastomer compatibilizer (sebs-g-mah) on the properties of PP/PET blends. Rev. Roum. Chim. 2018, 63, 11–20. [Google Scholar]
- Papadopoulou, C.P.; Kalfoglou, N.K. Comparison of compatibilizer effectiveness for PET/PP blends: Their mechanical, thermal and morphology characterization. Polymer 2000, 41, 2543–2555. [Google Scholar] [CrossRef]
- Eastwood, E.A.; Dadmun, M.D. Multiblock Copolymers in the Compatibilization of Polystyrene and Poly(methyl methacrylate) Blends: Role of Polymer Architecture. Macromolecules 2002, 35, 5069–5077. [Google Scholar] [CrossRef]
- Dadmun, M. Effect of copolymer architecture on the interfacial structure and miscibility of a ternary polymer blend containing a copolymer and two homopolymers. Macromolecules 1996, 29, 3868–3874. [Google Scholar] [CrossRef]
- Dadmun, M.D. Importance of a broad composition distribution in polymeric interfacial modifiers. Macromolecules 2000, 33, 9122–9125. [Google Scholar] [CrossRef]
- Dadmun, M.D. Quantifying and controlling the composition and “randomness” distributions of random copolymers. Macromol. Theory Simul. 2001, 10, 795–801. [Google Scholar] [CrossRef]
- Creton, C.; Kramer, E.J.; Hui, C.Y.; Brown, H.R. Failure Mechanisms of Polymer Interfaces Reinforced with Block Copolymers. Macromolecules 1992, 25, 3075–3088. [Google Scholar] [CrossRef]
- Dai, C.A.; Jandt, K.D.; Iyengar, D.R.; Slack, N.L.; Dai, K.H.; Davidson, W.B.; Kramer, E.J.; Hui, C.Y. Strengthening polymer interfaces With triblock copolymers. Macromolecules 1997, 30, 549–560. [Google Scholar] [CrossRef]
- Bernard, B.; Brown, H.R.; Hawker, C.J.; Kellock, A.J.; Russell, T.P. Adhesion of polymer interfaces reinforced with random and diblock copolymers as a function of geometry. Macromolecules 1999, 32, 6254–6260. [Google Scholar] [CrossRef]
- Cho, K.; Ahn, T.O.; Ryu, H.S.; Seo, K.H. Mechanical effects according to the type of poly(styrene-co-methyl methacrylate) copolymers at polystyrene/poly(methyl methacrylate) interfaces. Polymer 1996, 37, 4849–4852. [Google Scholar] [CrossRef]
- Horák, Z.; Fořt, V.; Hlavatá, D.; Lednický, F.; Večerka, F. Compatibilization of high-impact polystyrene/polypropylene blends. Polymer 1996, 37, 65–73. [Google Scholar] [CrossRef]
- Hlavatá, D.; Horák, Z.; Lednický, F.; Hromádková, J.; Pleska, A.; Zanevskii, Y.V. Compatibilization efficiency of styrene-butadiene multiblock copolymers in PS/PP blends. J. Polym. Sci. Part B Polym. Phys. 2001, 39, 931–942. [Google Scholar] [CrossRef]
- Winey, K.I.; Berba, M.L.; Galvin, M.E. Ternary phase diagrams of Poly(styrene-co-methyl methacrylate), Poly(methyl methacrylate), and Polystyrene: Monomer sequence distribution effect and encapsulation. Macromolecules 1996, 29, 2868–2877. [Google Scholar] [CrossRef]
- Ignaczak, W.; Wiśniewska, K.; Janik, J.; Fray, M. El Mechanical and thermal properties of PP/PBT blends compatibilized with triblock thermoplastic elastomer. Pol. J. Chem. Technol. 2015, 17, 78–83. [Google Scholar] [CrossRef]
- Meier, M.A.R.; Metzger, J.O.; Schubert, U.S. Plant oil renewable resources as green alternatives in polymer science. Chem. Soc. Rev. 2007, 36, 1788. [Google Scholar] [CrossRef]
- Nakajima, H.; Dijkstra, P.; Loos, K. The Recent Developments in Biobased Polymers toward General and Engineering Applications: Polymers that are Upgraded from Biodegradable Polymers, Analogous to Petroleum-Derived Polymers, and Newly Developed. Polymers 2017, 9, 523. [Google Scholar] [CrossRef]
- Harmsen, P.F.H.; Hackmann, M.M.; Bos, H.L. Green building blocks for bio-based plastics. Biofuels Bioprod. Biorefining 2014, 8, 306–324. [Google Scholar] [CrossRef]
- El Fray, M.; Słonecki, J. Multiblock terephthalate copolymer as impact modifier for poly(propylene)/poly(butylene terephthalate) blends. Die Angew. Makromol. Chem. 1999, 266, 30–36. [Google Scholar] [CrossRef]
- Groenewoud, W.M. Characterisation of Polymers by Thermal Analysis, 1st ed.; Elsevier Science: Amsterdam, The Netherlands, 2001. [Google Scholar]
- Rybko, M.; Fray, M.E. Study of structure and fatigue strength of thermoplastic elastomers modified with nanoparticles and radiation-crosslinked. Polimery/Polymers 2014, 59. [Google Scholar] [CrossRef]
- Mark, J.E.; Erman, B.; Roland, C.M. The Science and Technology of Rubber, 4th ed.; Mark, J.E., Erman, B., Roland, C.M., Eds.; Academic Press: Waltham, MA, USA, 2013. [Google Scholar]
- Liu, R.; Farinha, J.P.S.; Winnik, M.A. Preparation and Spectroscopic Properties of Phenanthrene-Labeled SEBS Triblock Copolymers. Macromolecules 1999, 32, 3957–3963. [Google Scholar] [CrossRef]
- Han, X.; Xu, J.; Liu, H.; Hu, Y. A new Approach to Thick Films of Block Copolymer with Ordered Surface Structures. Macromol. Rapid Commun. 2005, 26, 1810–1813. [Google Scholar] [CrossRef]
- Zakharova, E.; Lavilla, C.; Alla, A.; Martínez De Ilarduya, A.; Muñoz-Guerra, S. Modification of properties of poly(butylene succinate) by copolymerization with tartaric acid-based monomers. Eur. Polym. J. 2014, 61, 263–273. [Google Scholar] [CrossRef]
- Yamadera, R.; Murano, M. The determination of randomness in copolyesters by high resolution nuclear magnetic resonance. J. Polym. Sci. Part A-1 Polym. Chem. 1967, 5, 2259–2268. [Google Scholar] [CrossRef]
- Schilling, M.F. The Longest Run of Heads. Coll. Math. J. 2010, 21, 196–207. [Google Scholar] [CrossRef]
- Beyler, C.L.; Hirschler, M.M. Thermal Decomposition of Polymers. In SPE Handbook of Fire Protection Engineering; National Fire Protection Association: Quincy, MA, USA, 2002; pp. 110–131. ISBN 087765-451-4. [Google Scholar]
- Niemczyk, A.; Dziubek, K.; Sacher-Majewska, B.; Czaja, K.; Czech-Polak, J.; Oliwa, R.; Lenża, J.; Szołyga, M. Thermal Stability and Flame Retardancy of Polypropylene Composites Containing Siloxane-Silsesquioxane Resins. Polymers 2018, 10, 1019. [Google Scholar] [CrossRef]
- Kuźnia, M.; Magdziarz, A. Research on thermal decomposition of waste PE/PP. Chem. Process Eng. 2013, 34, 165–174. [Google Scholar] [CrossRef]
- Rajakumar, P.R.; Nanthini, R. Mechanical, Thermal and Morphological Behaviours of Polybutylene Terephthalate/Polycarbonate blend nanocomposites. Int. Lett. Chem. Phys. Astron. 2013, 4, 15–36. [Google Scholar] [CrossRef]
- Piesowicz, E.; Irska, I.; Bryll, K.; Gawdzinska, K.; Bratychak, M. Poly(butylene terephthalate/carbon nanotubes nanocomposites. Part II. Structure and properties. Polimery 2016, 61, 24–30. [Google Scholar] [CrossRef]
- Das, V.; Kumar, V.; Singh, A.; Gautam, S.S.; Pandey, A.K. Compatibilization Efficacy of LLDPE-g-MA on Mechanical, Thermal, Morphological and Water Absorption Properties of Nylon-6/LLDPE Blends. Polym. Plast. Technol. Eng. 2012, 51, 446–454. [Google Scholar] [CrossRef]
- Avramova, N. Amorphous poly(ethylene terephthalate)/poly(butylene terephthalate) blends: Miscibility and properties. Polymer 1995, 36, 801–808. [Google Scholar] [CrossRef]
- Chiou, Y.P.; Chiou, K.C.; Chang, F.C. In situ compatibilized polypropylene/liquid crystalline polymer blends. Polymer 1996, 37, 4099–4106. [Google Scholar] [CrossRef]
- Shieh, Y.-T.; Liao, T.-N.; Chang, F.-C. Reactive compatibilization of PP/PBT blends by a mixture of PP-g-MA and epoxy resin. J. Appl. Polym. Sci. 2001, 79, 2272–2285. [Google Scholar] [CrossRef]
- Ignaczak, W.; Sui, X.; Kellersztein, I.; Daniel, H.; El, M. The effect of fibre sizing and compatibilizer of polypropylene/poly (butylene terephthalate) blends on the mechanical and interphase properties of basalt fibre reinforced composites. Polym. Int. 2018, 67, 414–421. [Google Scholar] [CrossRef]
- Tsai, C.-H.; Chang, F.-C. Polymer blends of PBT and PP compatibilized by ethylene-co-glycidyl methacrylate copolymers. J. Appl. Polym. Sci. 1996, 61, 321–332. [Google Scholar] [CrossRef]
- Dai, C.-A.; Dair, B.J.; Dai, K.H.; Ober, C.K.; Kramer, E.J.; Hui, C.-Y.; Jelinski, L.W. Reinforcement of Polymer Interfaces with Random Copolymers. Phys. Rev. Lett. 1994, 73, 2472–2475. [Google Scholar] [CrossRef]
- Kulasekere, R.; Kaiser, H.; Ankner, J.F.; Russell, T.P.; Brown, H.R.; Hawker, C.J.; Mayes, A.M. Homopolymer interfaces reinforced with random copolymers. Macromolecules 1996, 29, 5493–5496. [Google Scholar] [CrossRef]





| Copolymer | Mn [kDa] | Density [g/cm3] | Tensile Strength [MPa] | MFI 230 °C, 5 kg [g/10 min] |
|---|---|---|---|---|
| SEBS | 75–85 | 0.9 | 23–35 | 14–40 |
| Copolymer | Composition: wt% [mol %] | DPh | Molecular Weight | Dispersity Index | ||||
|---|---|---|---|---|---|---|---|---|
| Theoretical | Calculated | Theoretical | Calculated | [η] (dL·g−1) | Mn (g·mol−1) | Mw (g·mol−1) | D | |
| PBT–DLA | 30/70 [55.3/44.7] | 28.5/71.4 [52.9/47.1] | 1.21 | 1.11 | 0.907 | 41,000 | 115,000 | 2.8 |
| SEBS | 30/70 [48/52] | - | - | - | - | 79,100/84,400 | 87,700/97,700 | 1.1/1.2 |
| Segment Length, x | # of Hard Segments at Least LENGTH x | # of Hard Segments Exactly Length x | # of Soft Segments at Least Length x | # of Soft Segments Exactly Length x |
|---|---|---|---|---|
| 1 | 24.9 | 11.7 | 24.9 | 13.2 |
| 2 | 13.2 | 6.2 | 11.7 | 6.2 |
| 3 | 7.0 | 3.3 | 5.5 | 2.9 |
| 4 | 3.7 | 1.8 | 2.6 | 1.4 |
| 5 | 1.9 | 0.9 | 1.2 | 0.6 |
| 6 | 1.0 | 0.5 | 0.6 | 0.3 |
| ≥7 | 0.5 | 0.5 | 0.3 | 0.3 |
| Polymer Blend | T0 [°C] | T5% [°C] | T10% [°C] |
|---|---|---|---|
| 50/50 | 215.5 | 261.9 | 287.5 |
| 50/50 + PBT–DLA | 218.0 | 274.5 | 296.5 |
| 50/50 + SEBS | 224.2 | 294.9 | 317.5 |
| Polymer Blend | Tc1 [°C] | Tc2 [°C] | Tm1 [°C] | Tm2 [°C] | Tg1 [°C] | Tg2 [°C] |
|---|---|---|---|---|---|---|
| 50/50 | 122.9 | 193.3 | 160.6 | 223.3 | −6.3 | 44.0 |
| 50/50 + PBT–DLA | 124.7 | 190.4 | 160.5 | 223.3 | −6.4 | 43.6 |
| 50/50 + SEBS | 124.5 | 192.8 | 160.6 | 223.3 | −6.4 | 43.4 |
| Polymer Blend | Young’s Modulus [MPa] | Tensile Strength [MPa] | Elongation at Break [%] | Impact Strength [kJ·m−2] |
|---|---|---|---|---|
| 50/50 | 2130±250 | 35.2 ± 0.7 | 2.9 ± 0.2 | 4.1 ± 0.7 |
| 50/50 + PBT–DLA | 1620±180 | 37.6 ± 0.5 | 18.2 ± 5.1 | 5.6 ± 0.3 |
| 50/50 + SEBS | 1480±30 | 38.6 ± 0.3 | 21.2 ± 3.0 | 5.2 ± 0.4 |
© 2019 by the authors. Licensee MDPI, Basel, Switzerland. This article is an open access article distributed under the terms and conditions of the Creative Commons Attribution (CC BY) license (http://creativecommons.org/licenses/by/4.0/).
Share and Cite
Ignaczak, W.; Sobolewski, P.; El Fray, M. Bio-Based PBT–DLA Copolyester as an Alternative Compatibilizer of PP/PBT Blends. Polymers 2019, 11, 1421. https://doi.org/10.3390/polym11091421
Ignaczak W, Sobolewski P, El Fray M. Bio-Based PBT–DLA Copolyester as an Alternative Compatibilizer of PP/PBT Blends. Polymers. 2019; 11(9):1421. https://doi.org/10.3390/polym11091421
Chicago/Turabian StyleIgnaczak, Wojciech, Peter Sobolewski, and Miroslawa El Fray. 2019. "Bio-Based PBT–DLA Copolyester as an Alternative Compatibilizer of PP/PBT Blends" Polymers 11, no. 9: 1421. https://doi.org/10.3390/polym11091421
APA StyleIgnaczak, W., Sobolewski, P., & El Fray, M. (2019). Bio-Based PBT–DLA Copolyester as an Alternative Compatibilizer of PP/PBT Blends. Polymers, 11(9), 1421. https://doi.org/10.3390/polym11091421


