Study on the Anticondensation Characteristics of Liquid Silicone Rubber Temperature-Control Coatings


Abstract
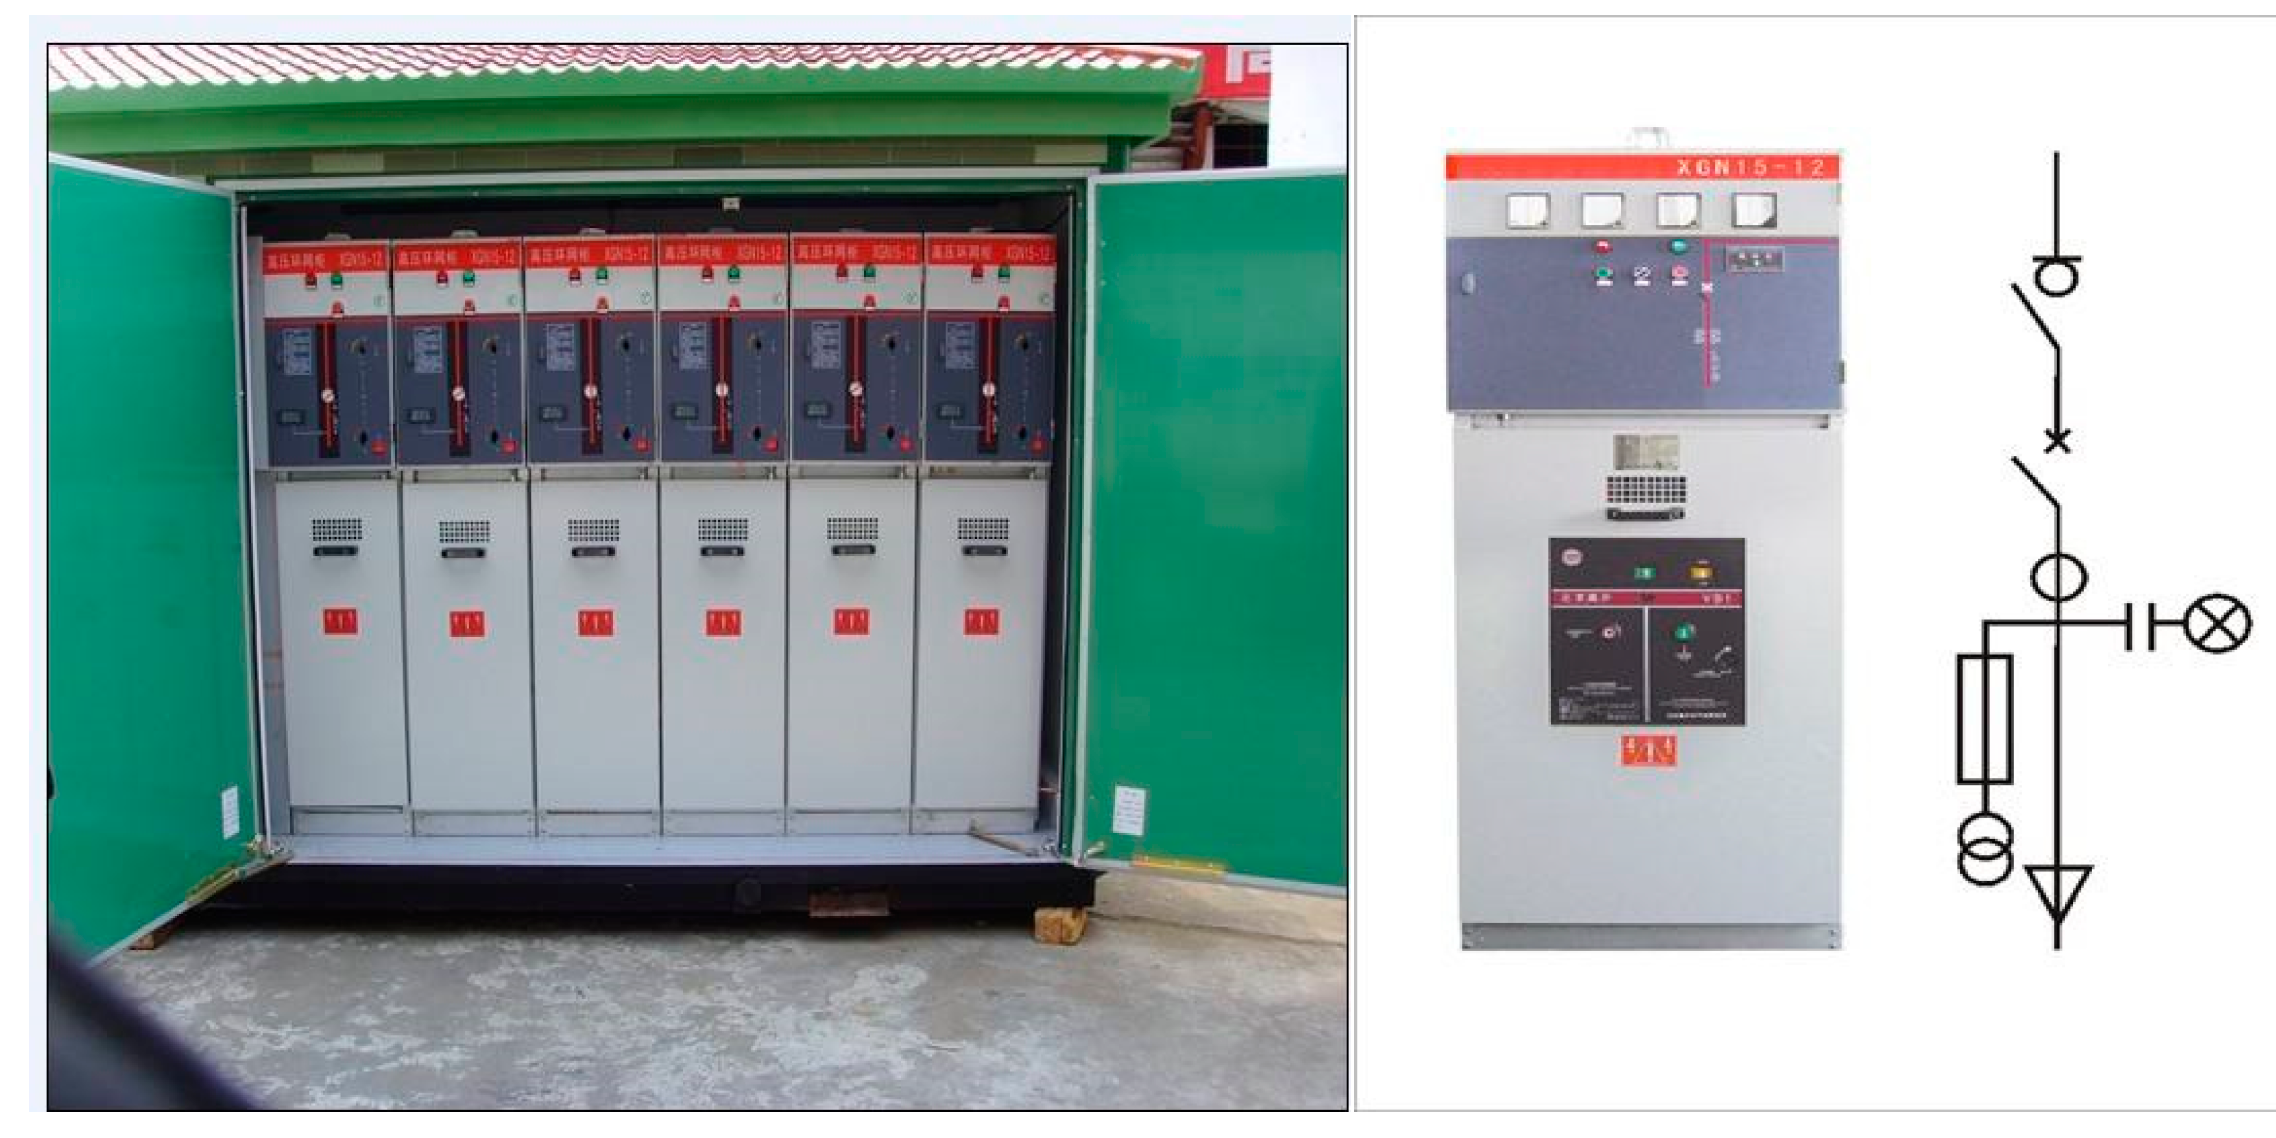
:1. Introduction
2. Materials and Methods
2.1. Material Processing and Sample Preparation
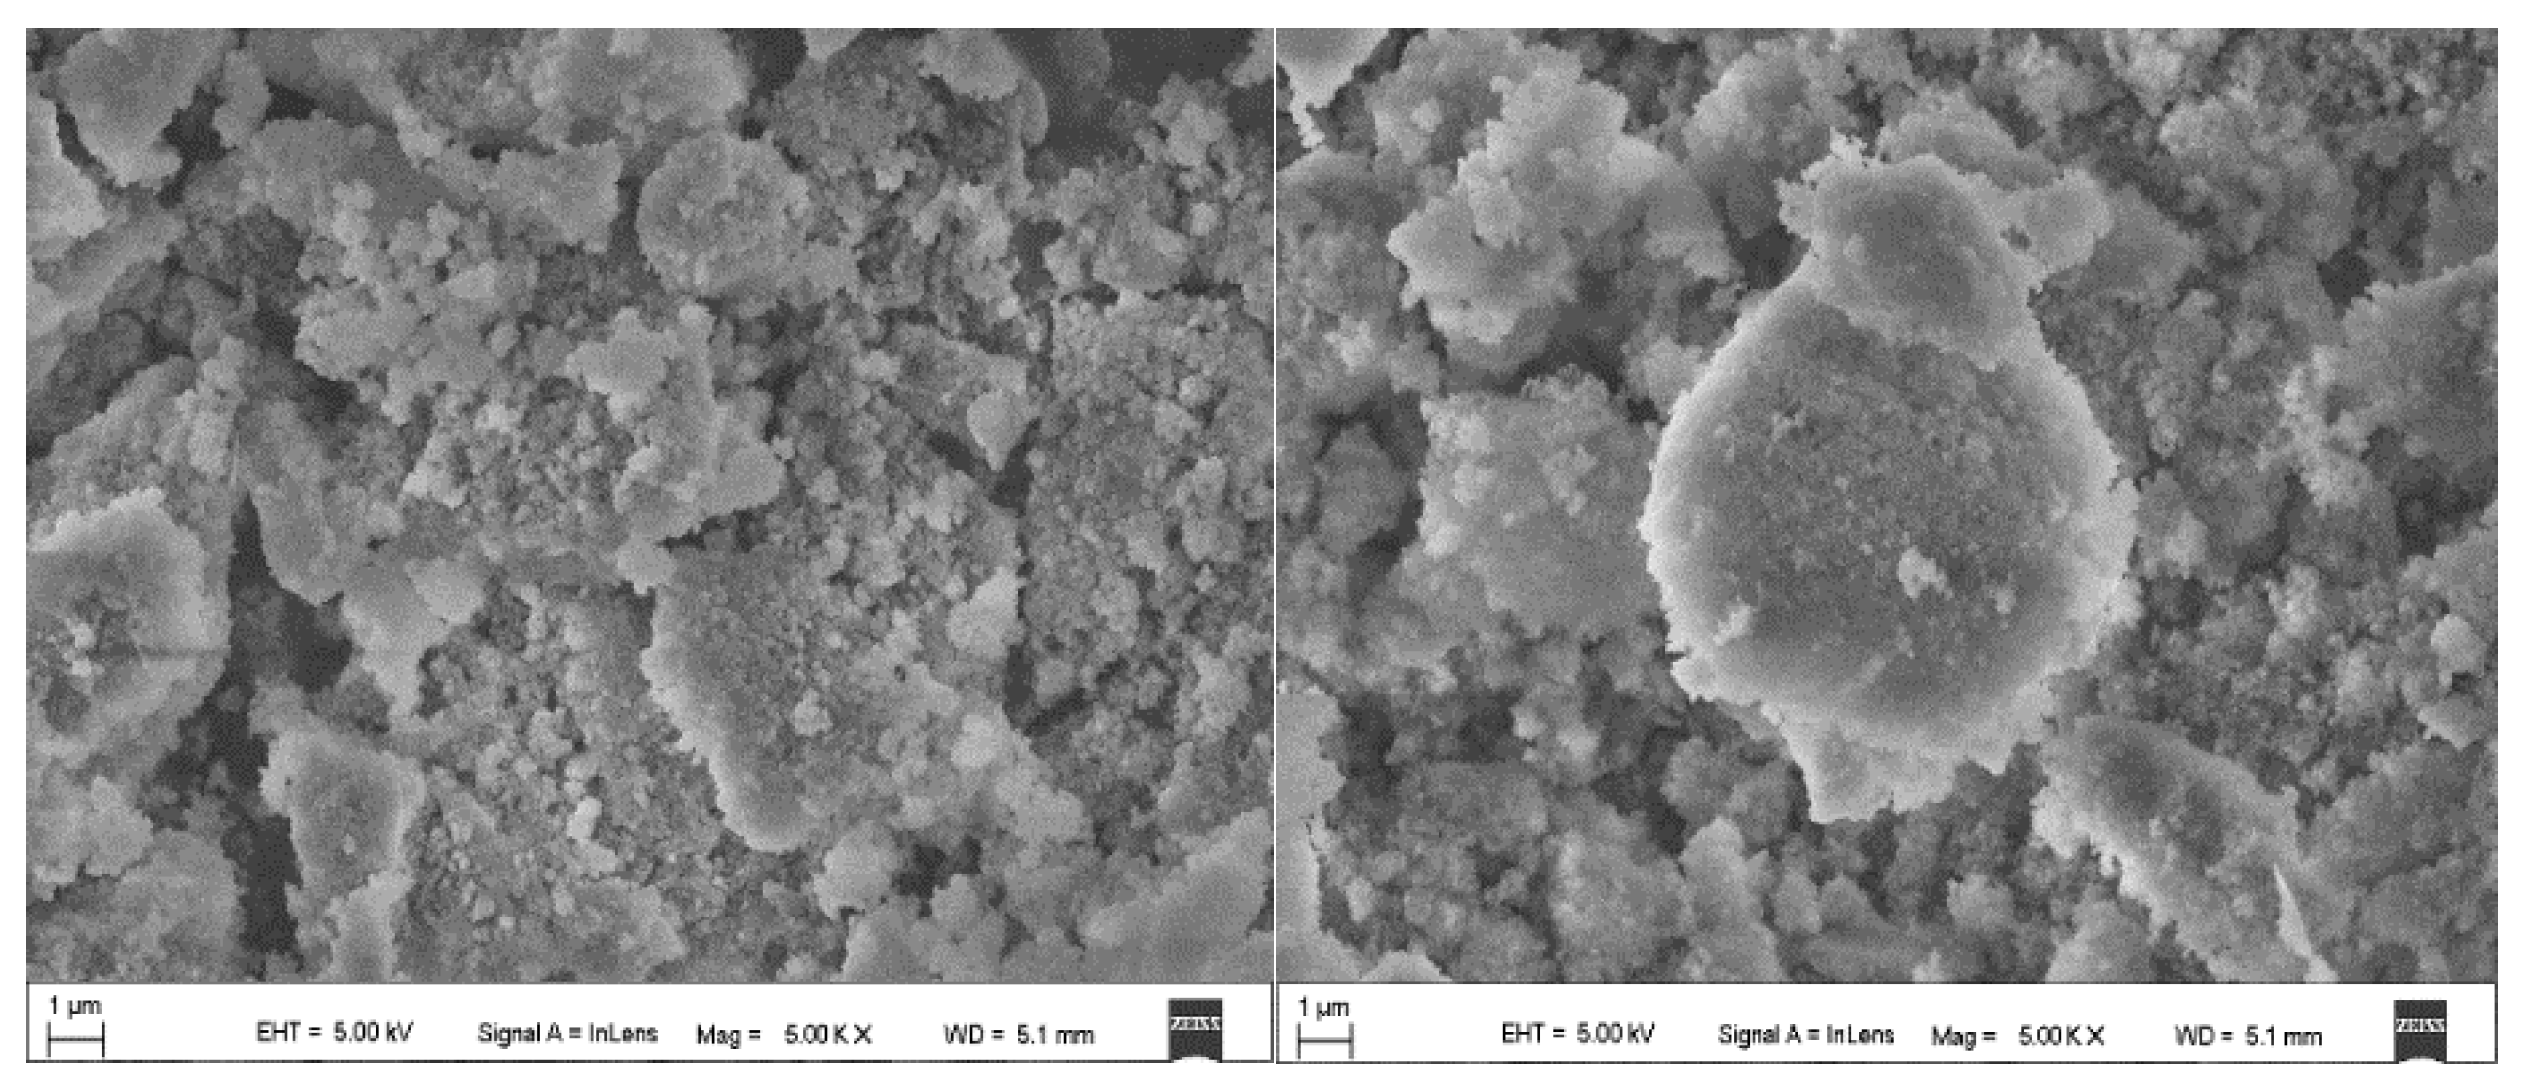
2.2. Characterization
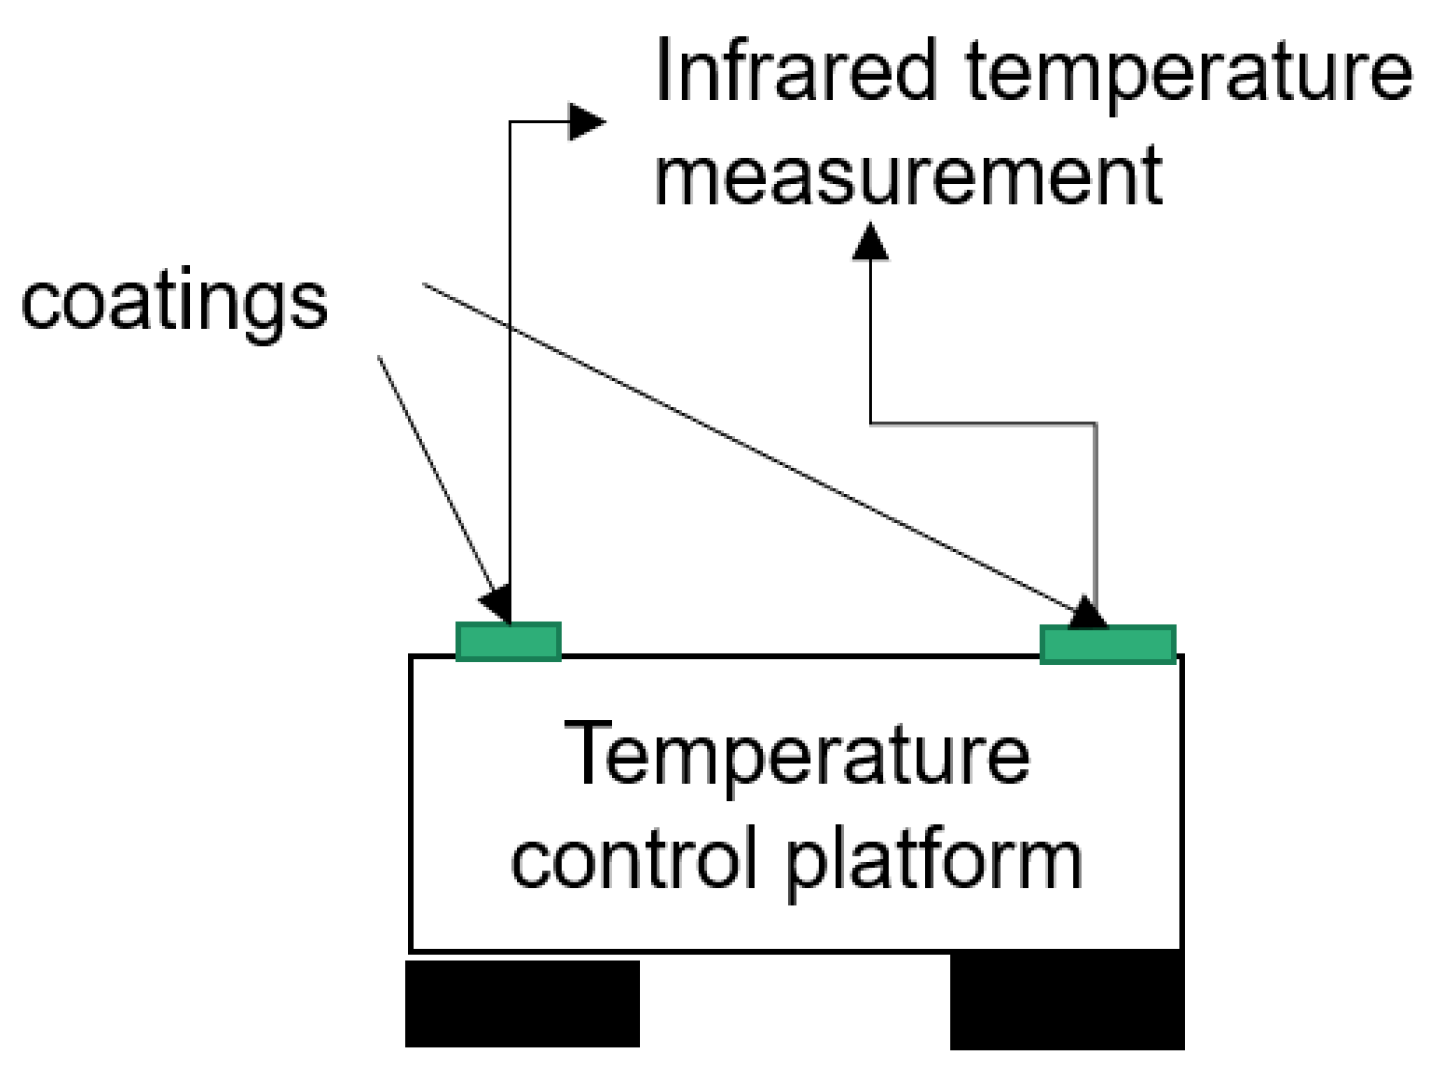
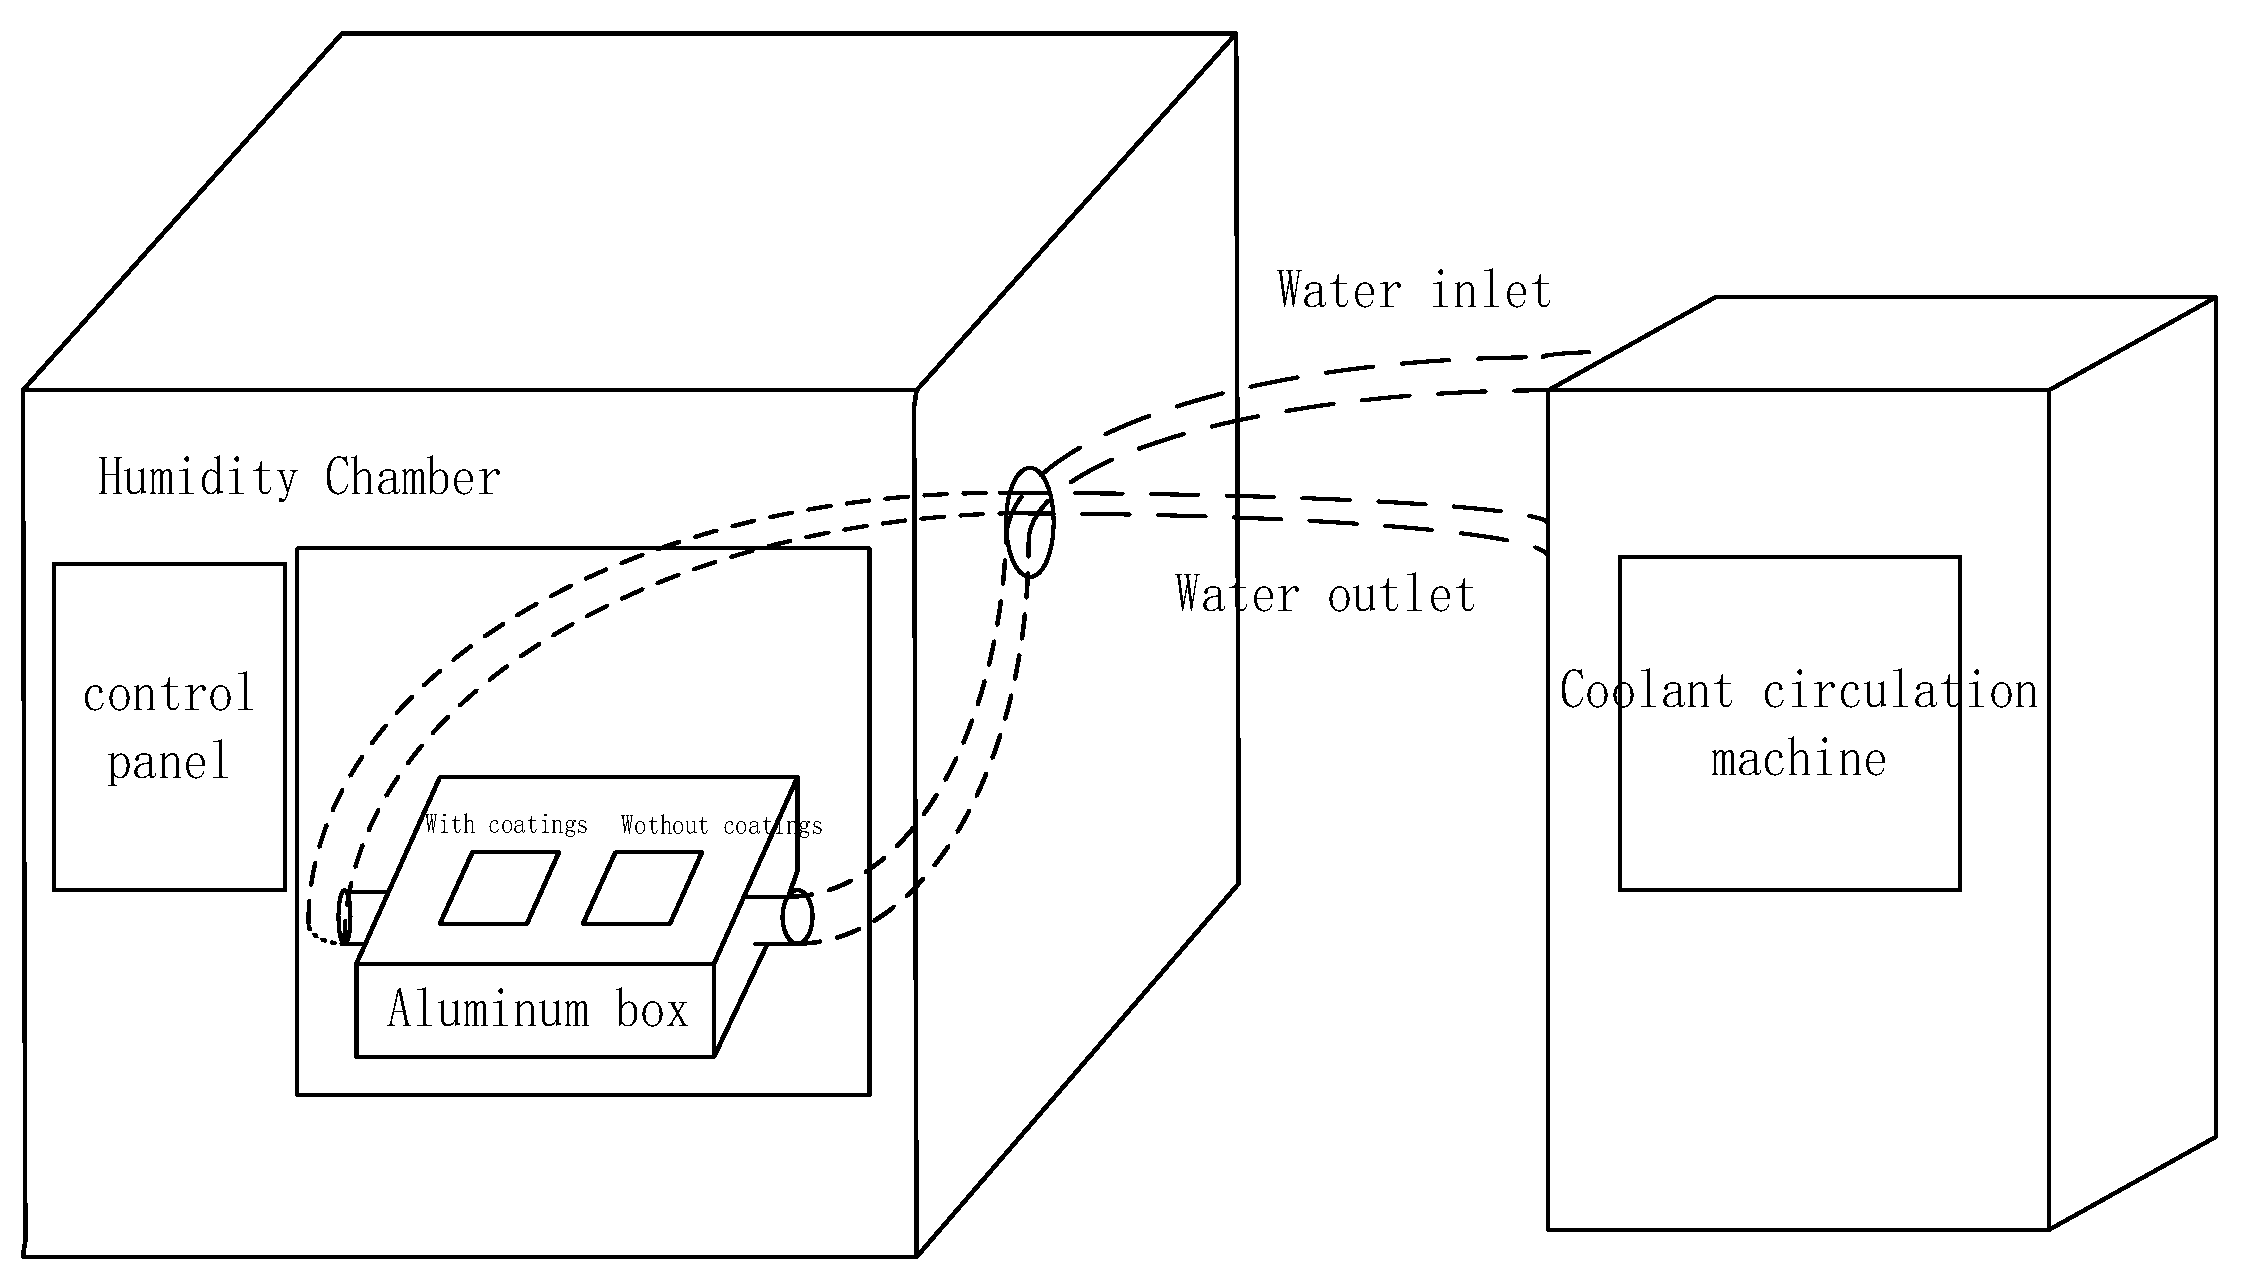
2.3. Test System and Experimental Details
3. Results
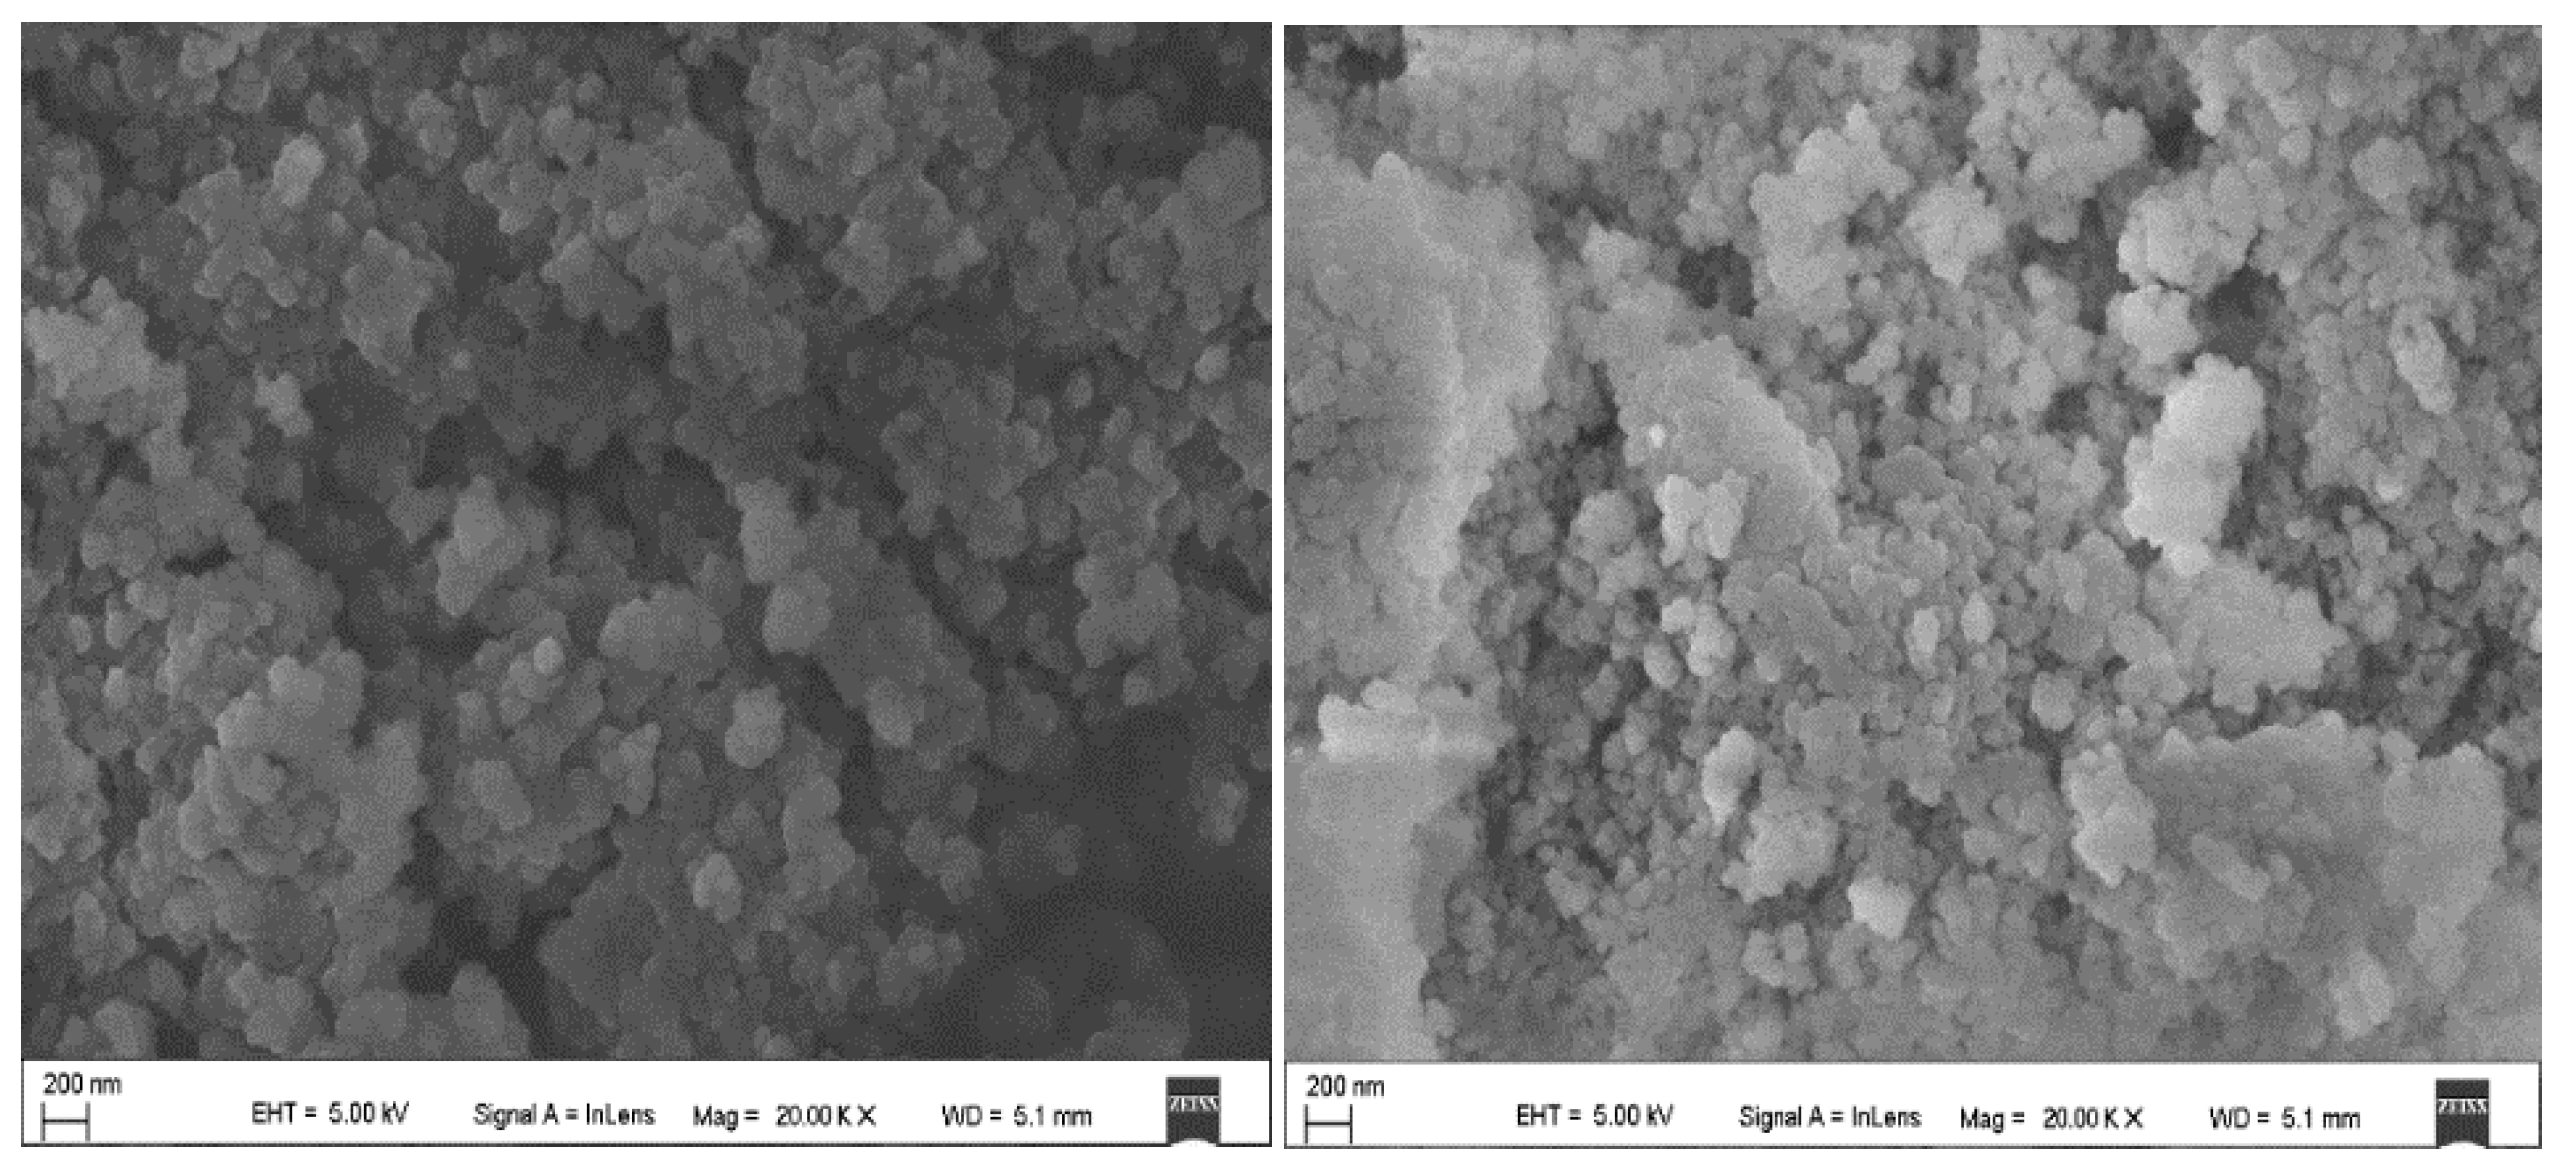
3.1. Characterization (SEM) Results
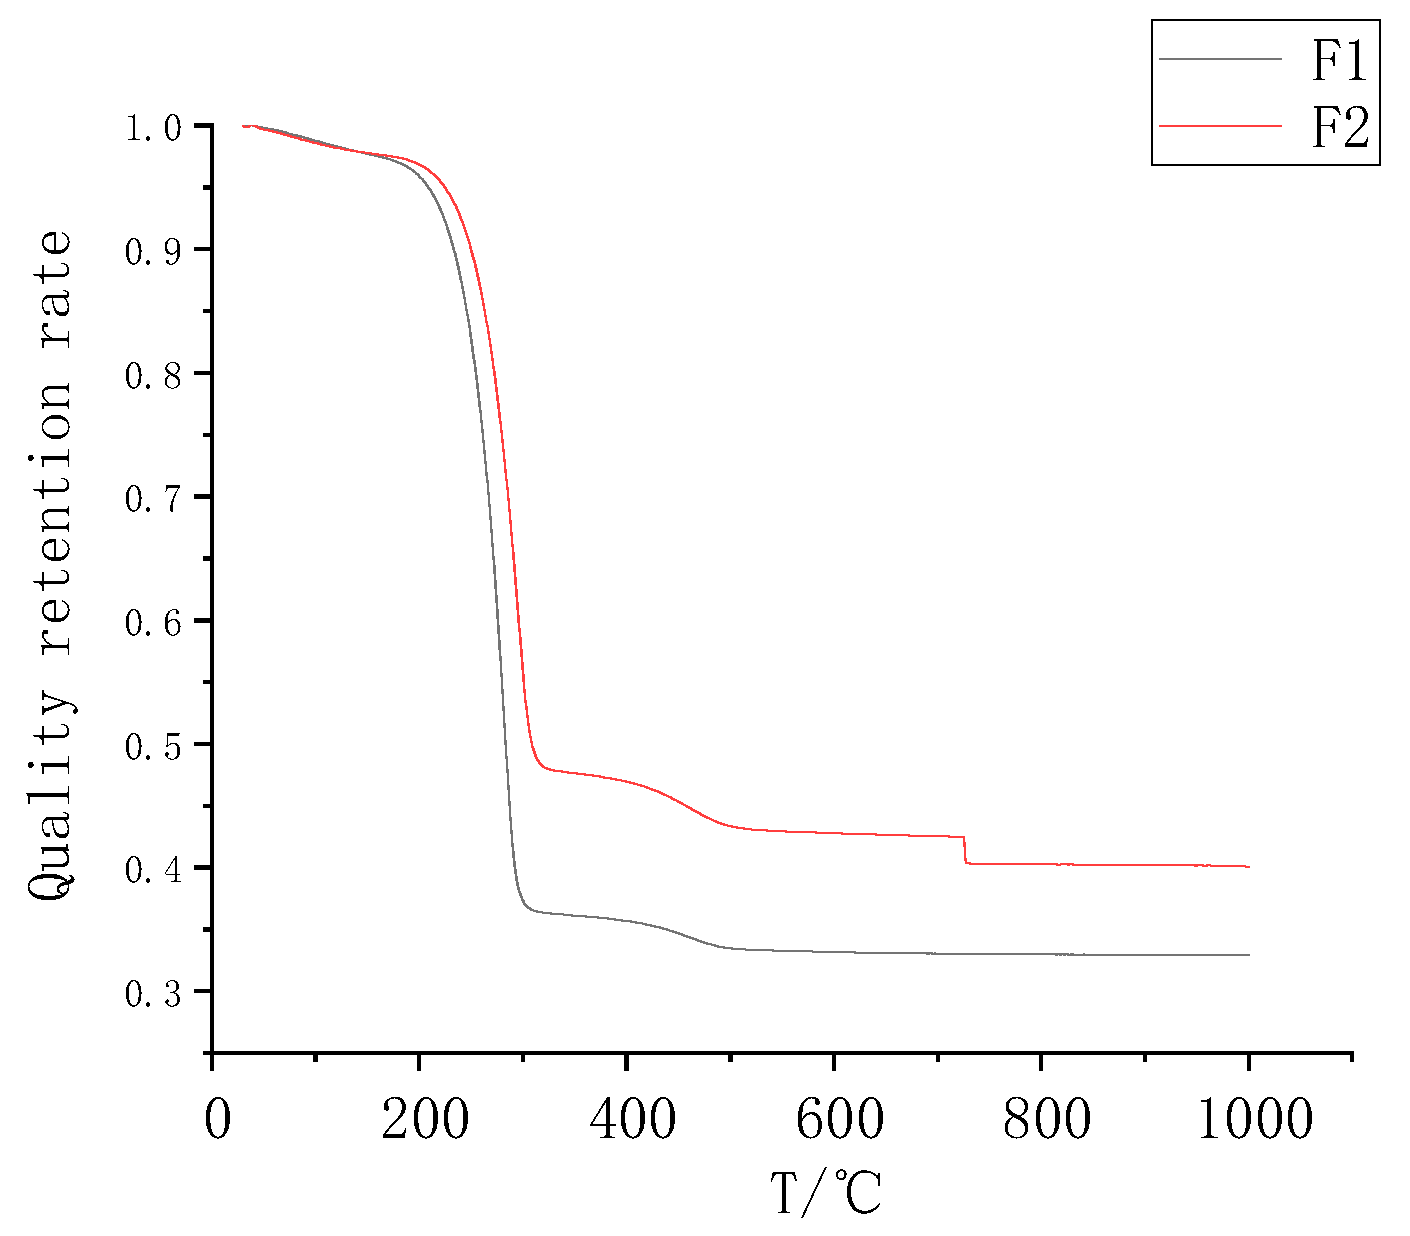
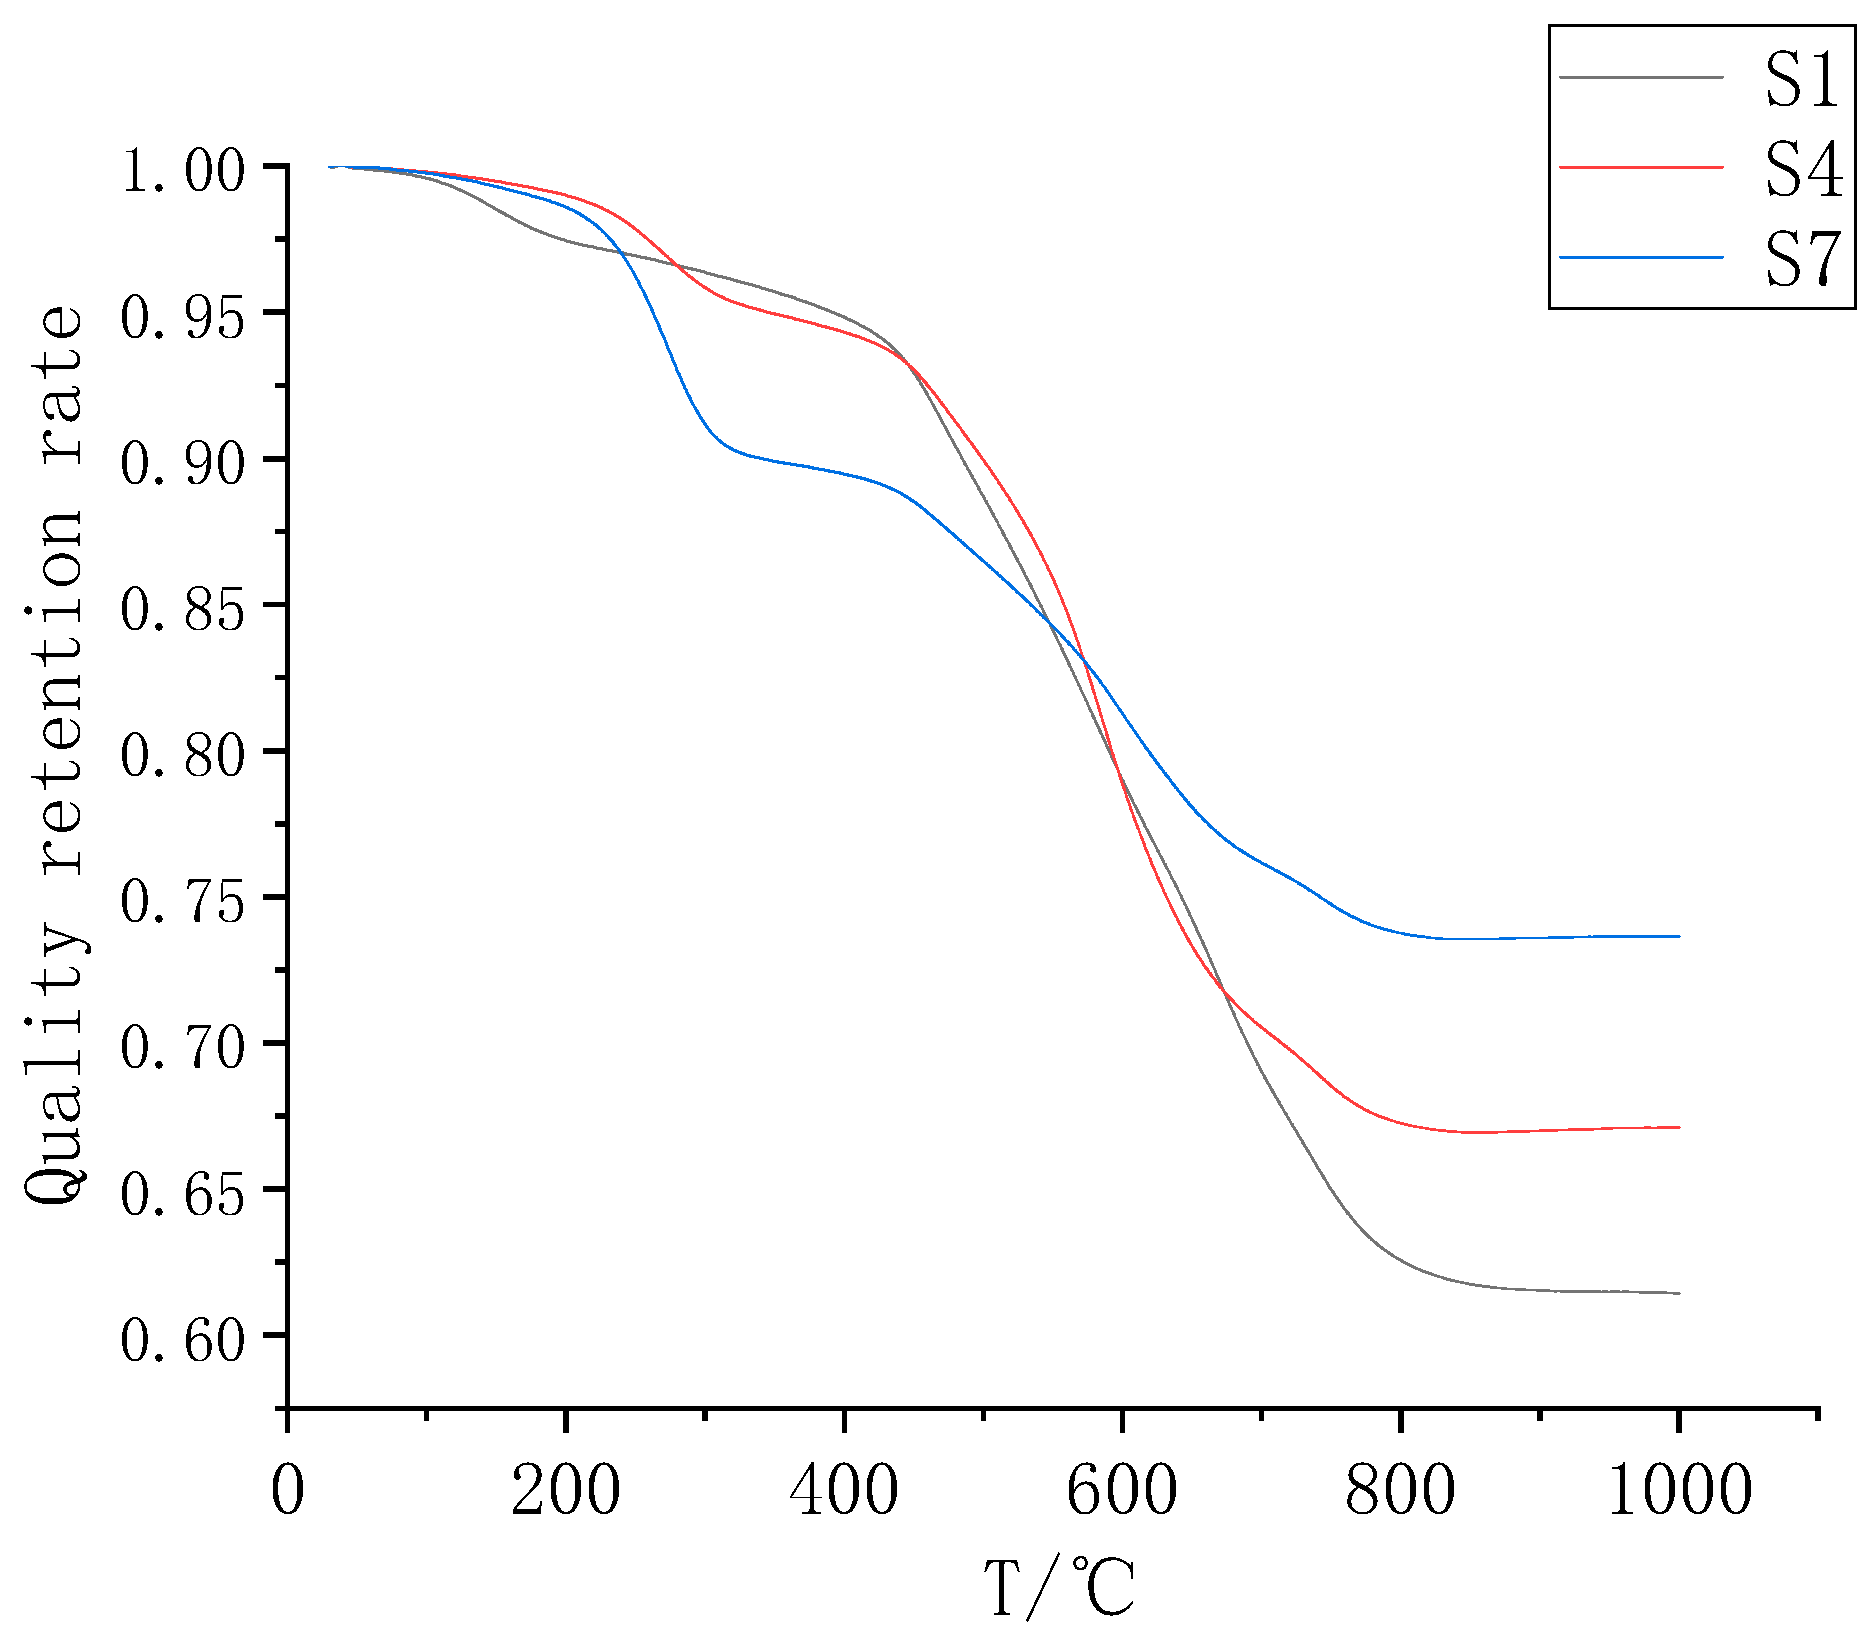
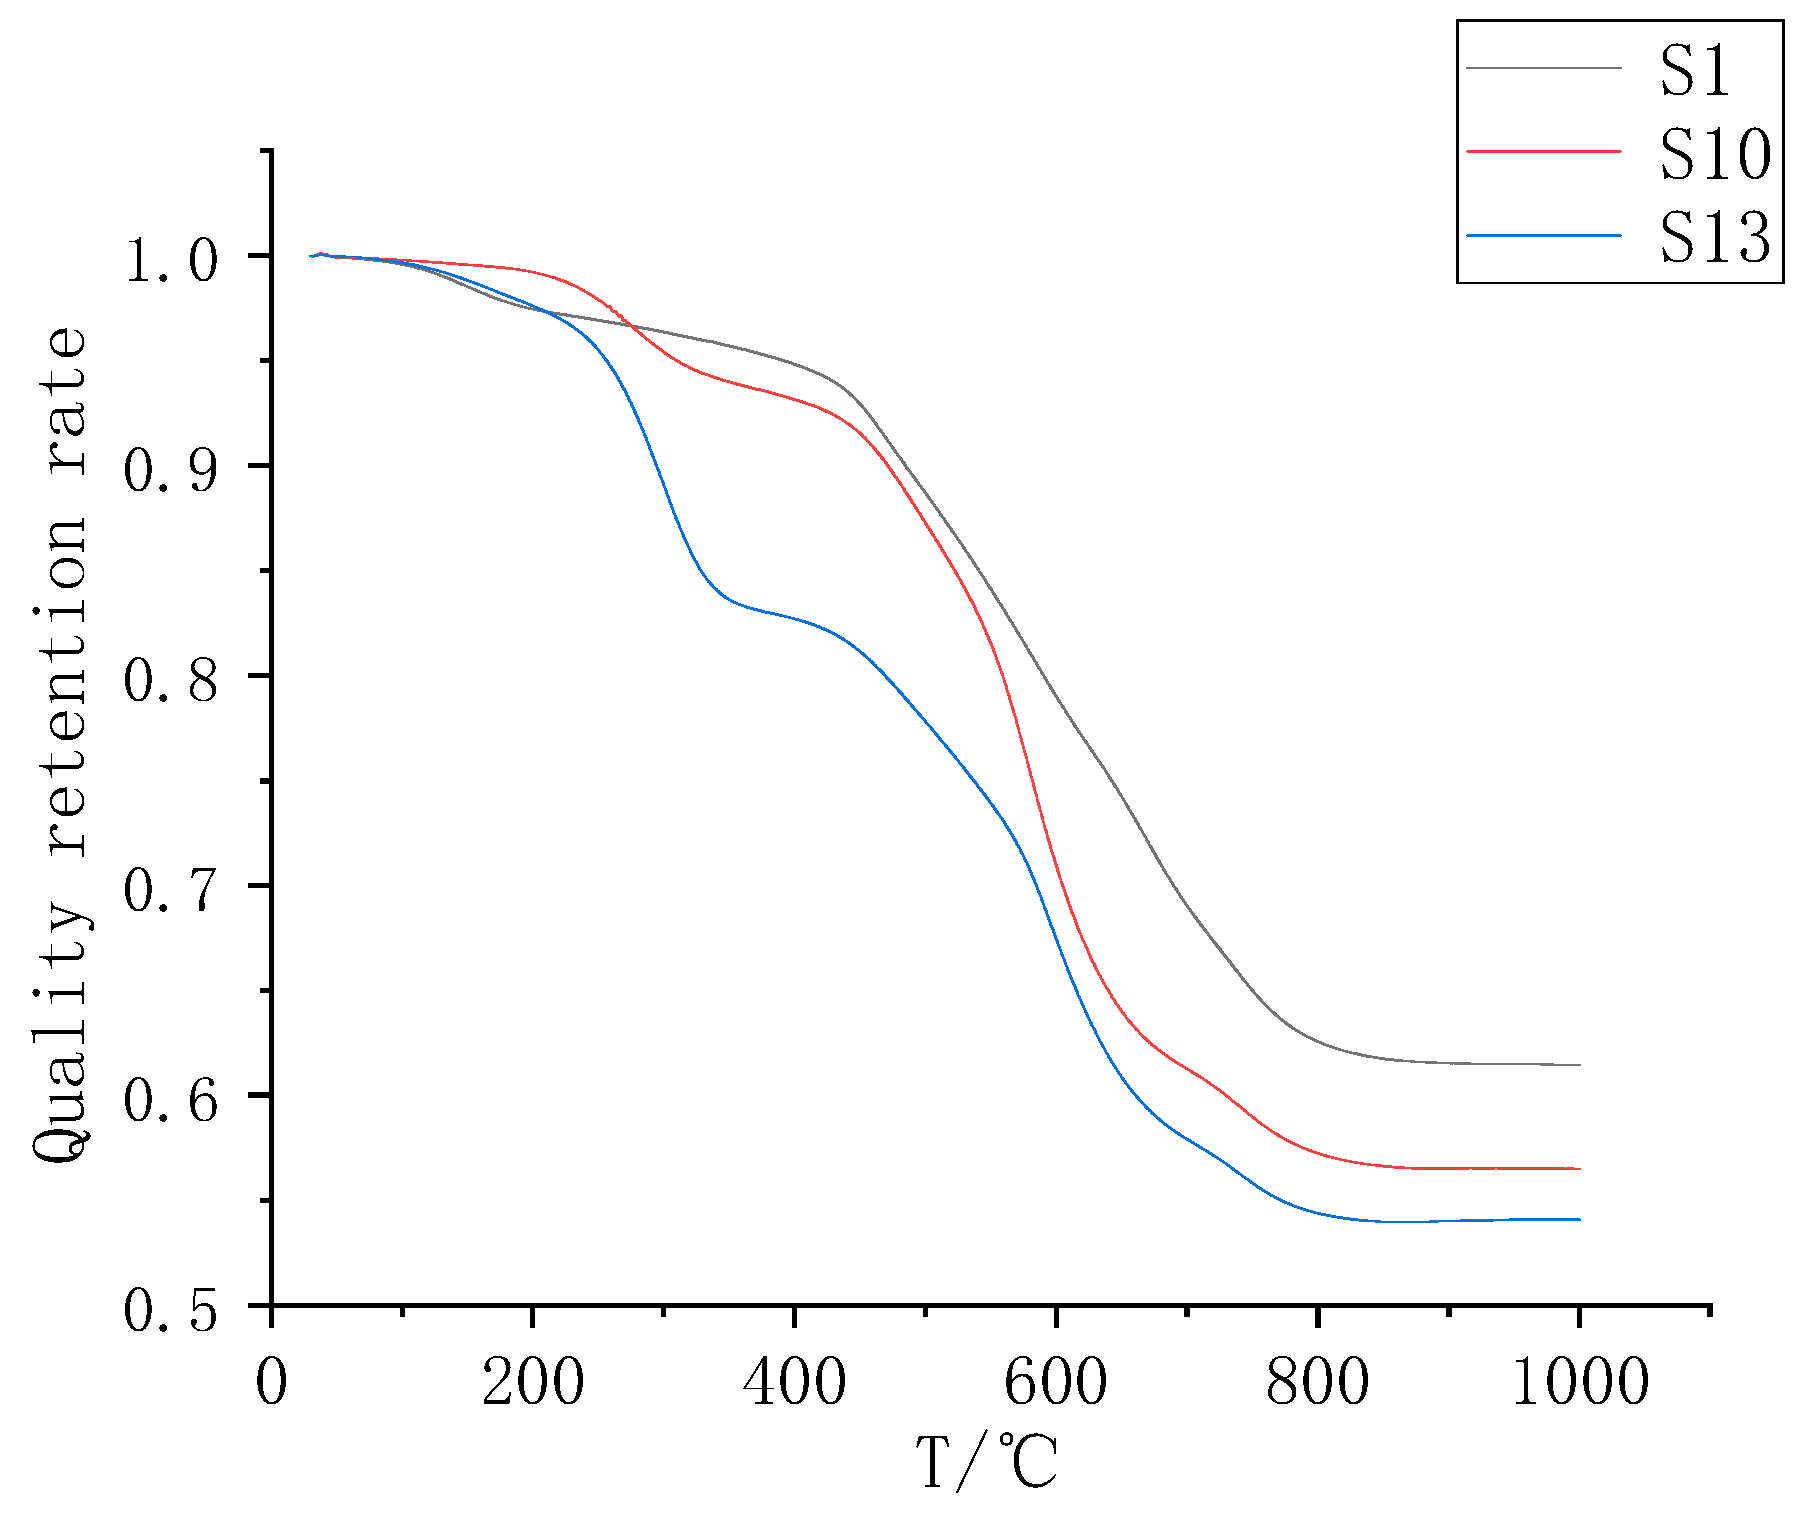
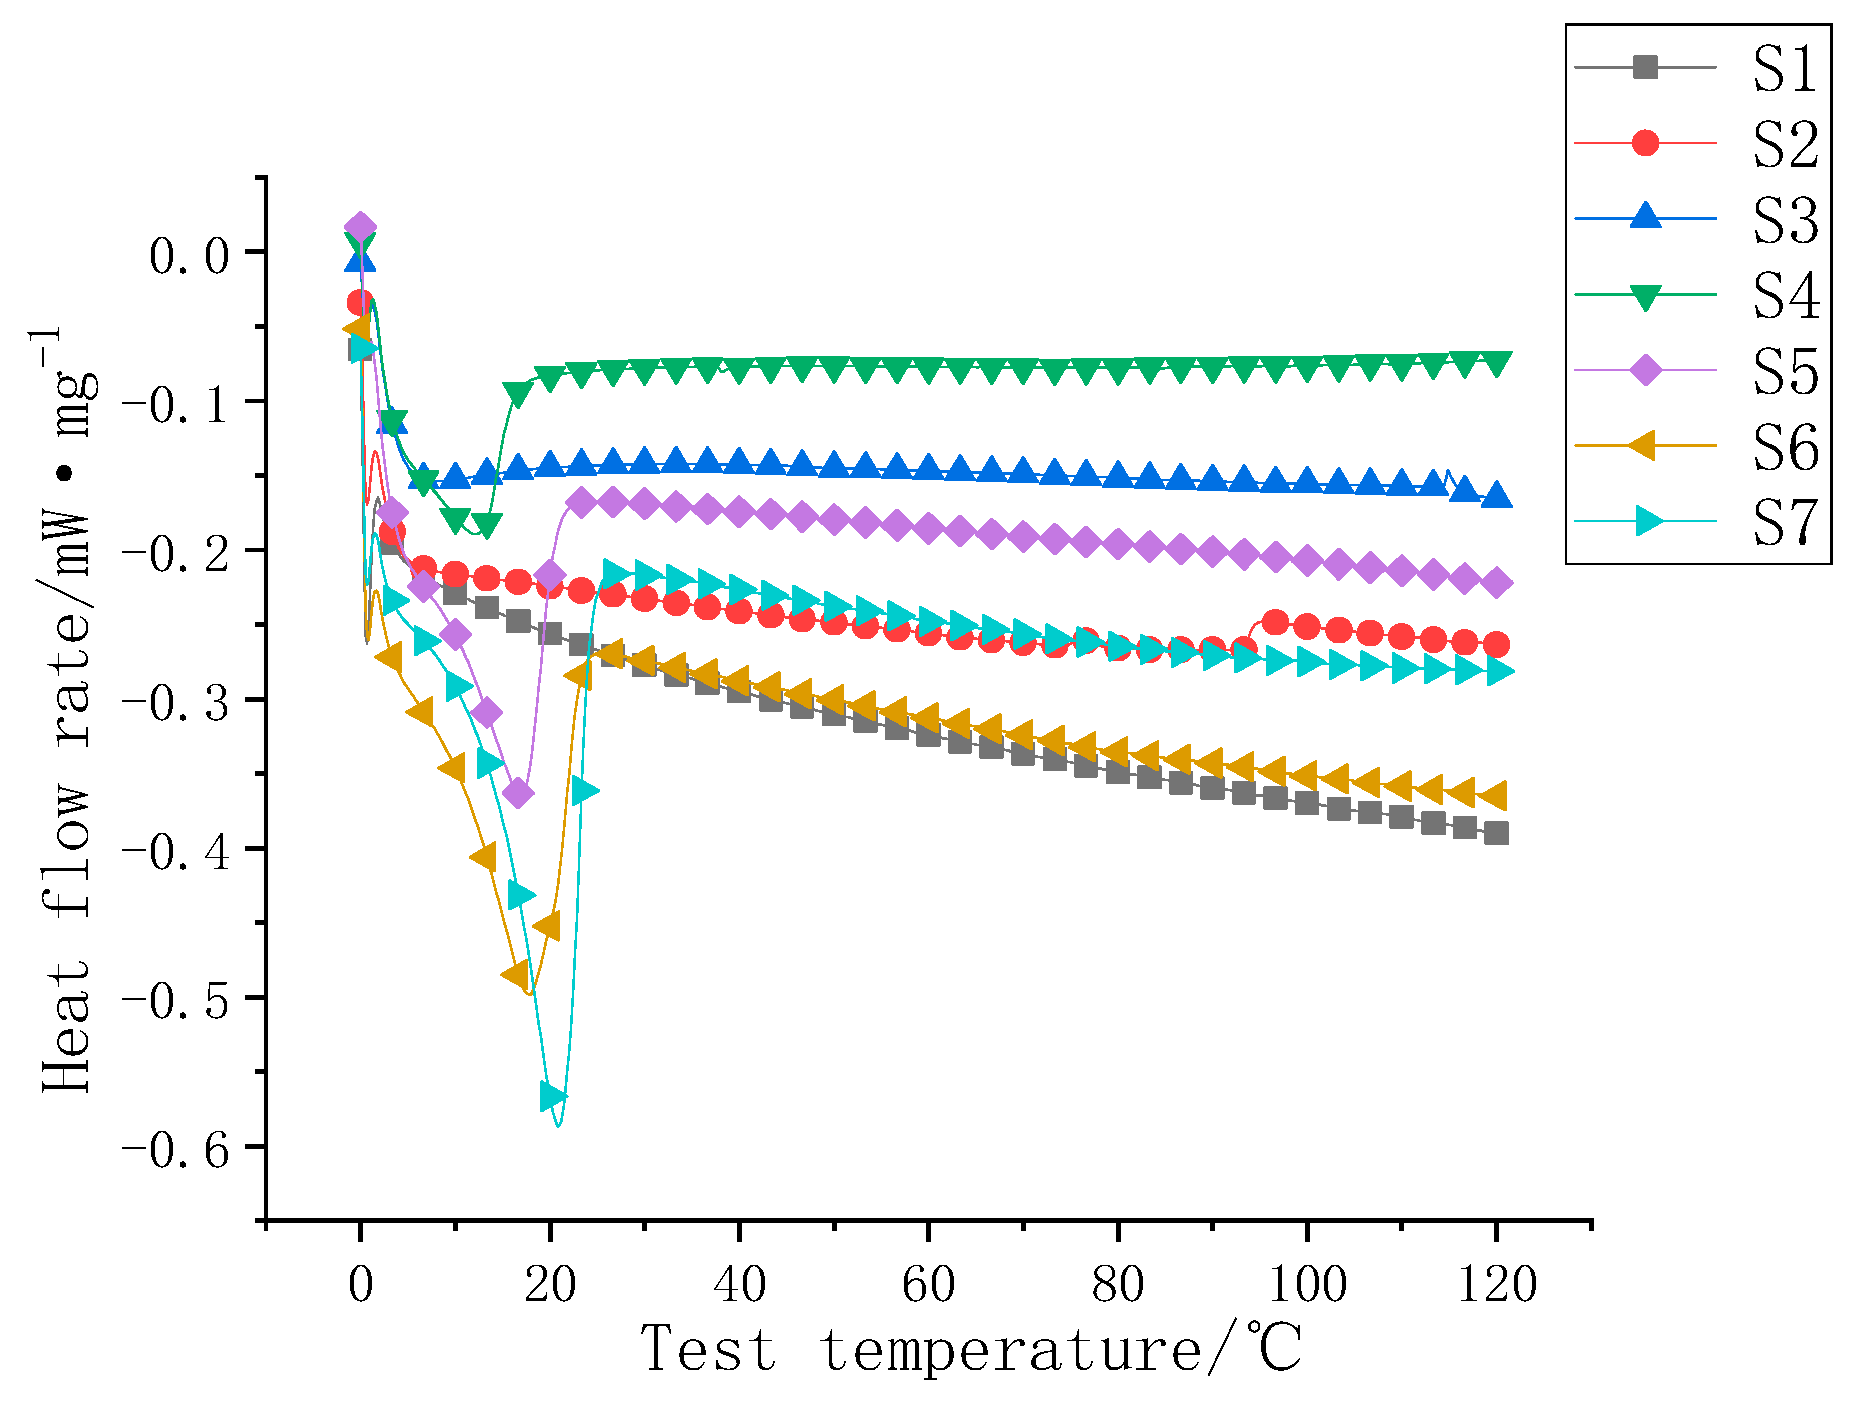
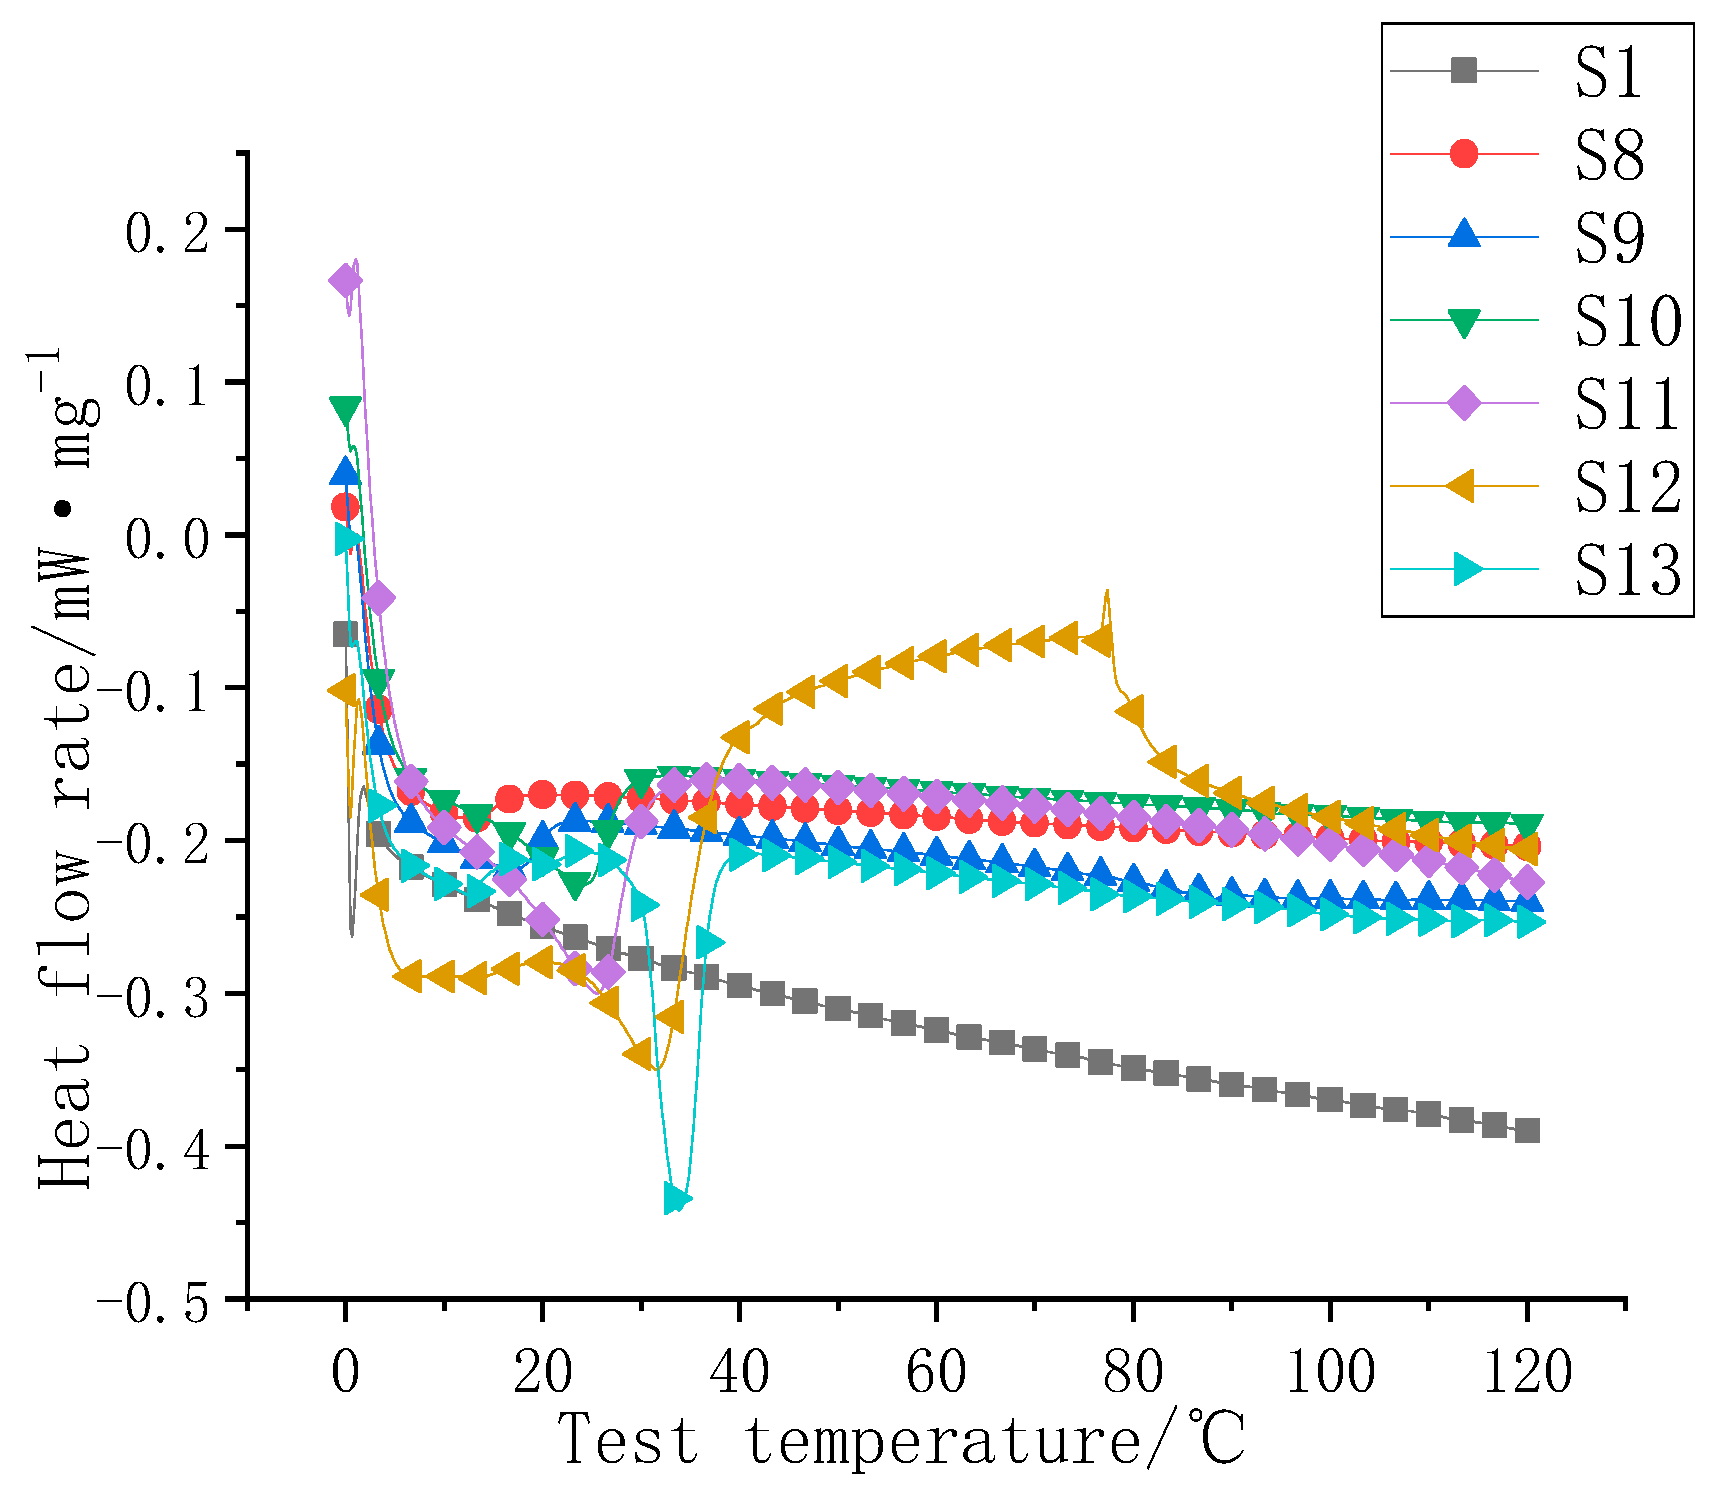
3.2. Analysis of the Thermal Weight Loss Characteristics of the Composite Coatings
3.3. Study on the Thermal Storage Properties of Composite Coatings
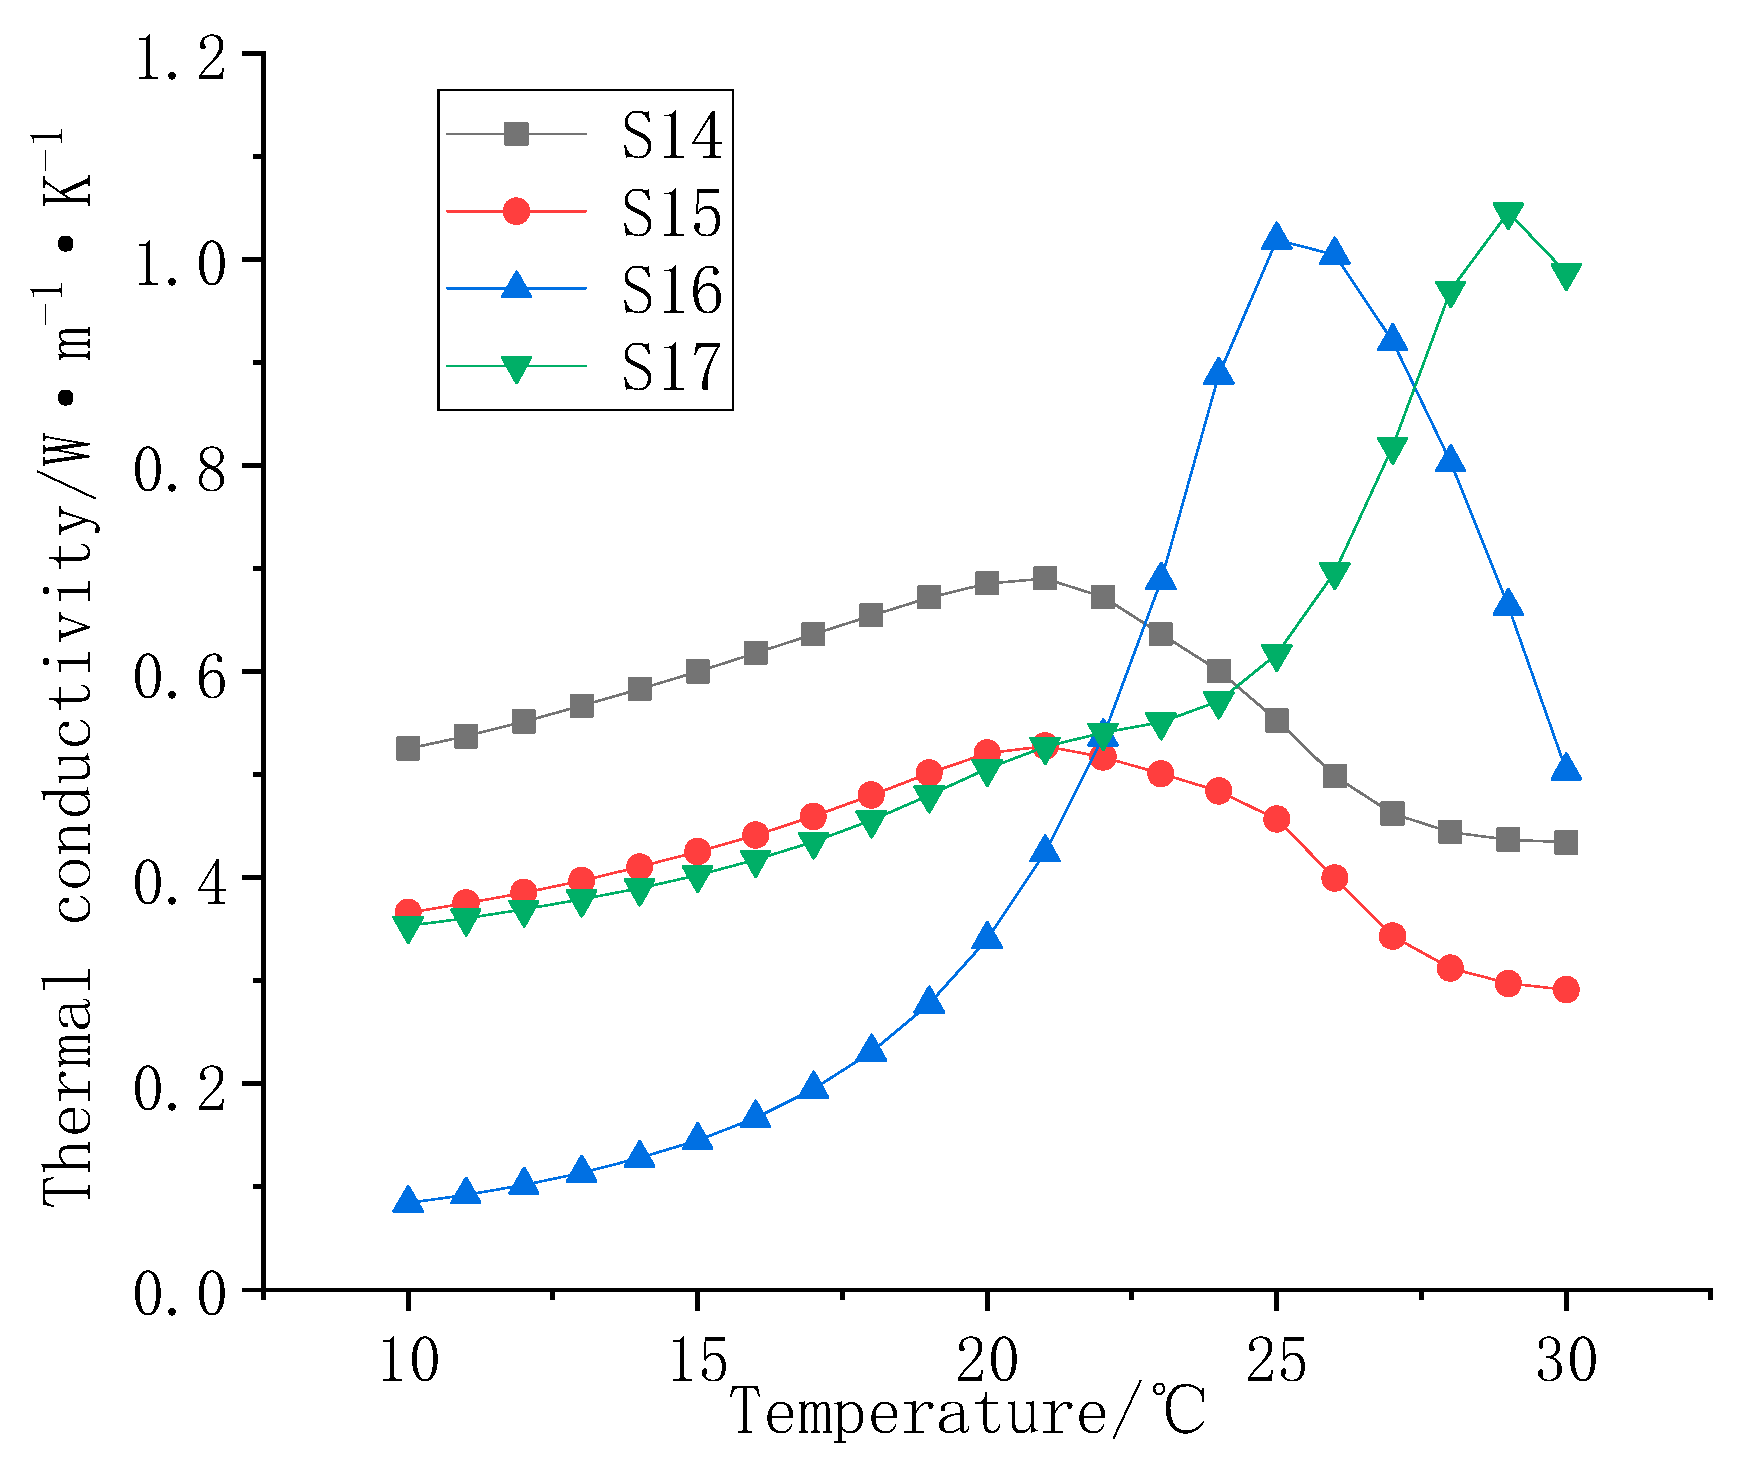
3.4. Testing Composite Coating Thermal Conductivity
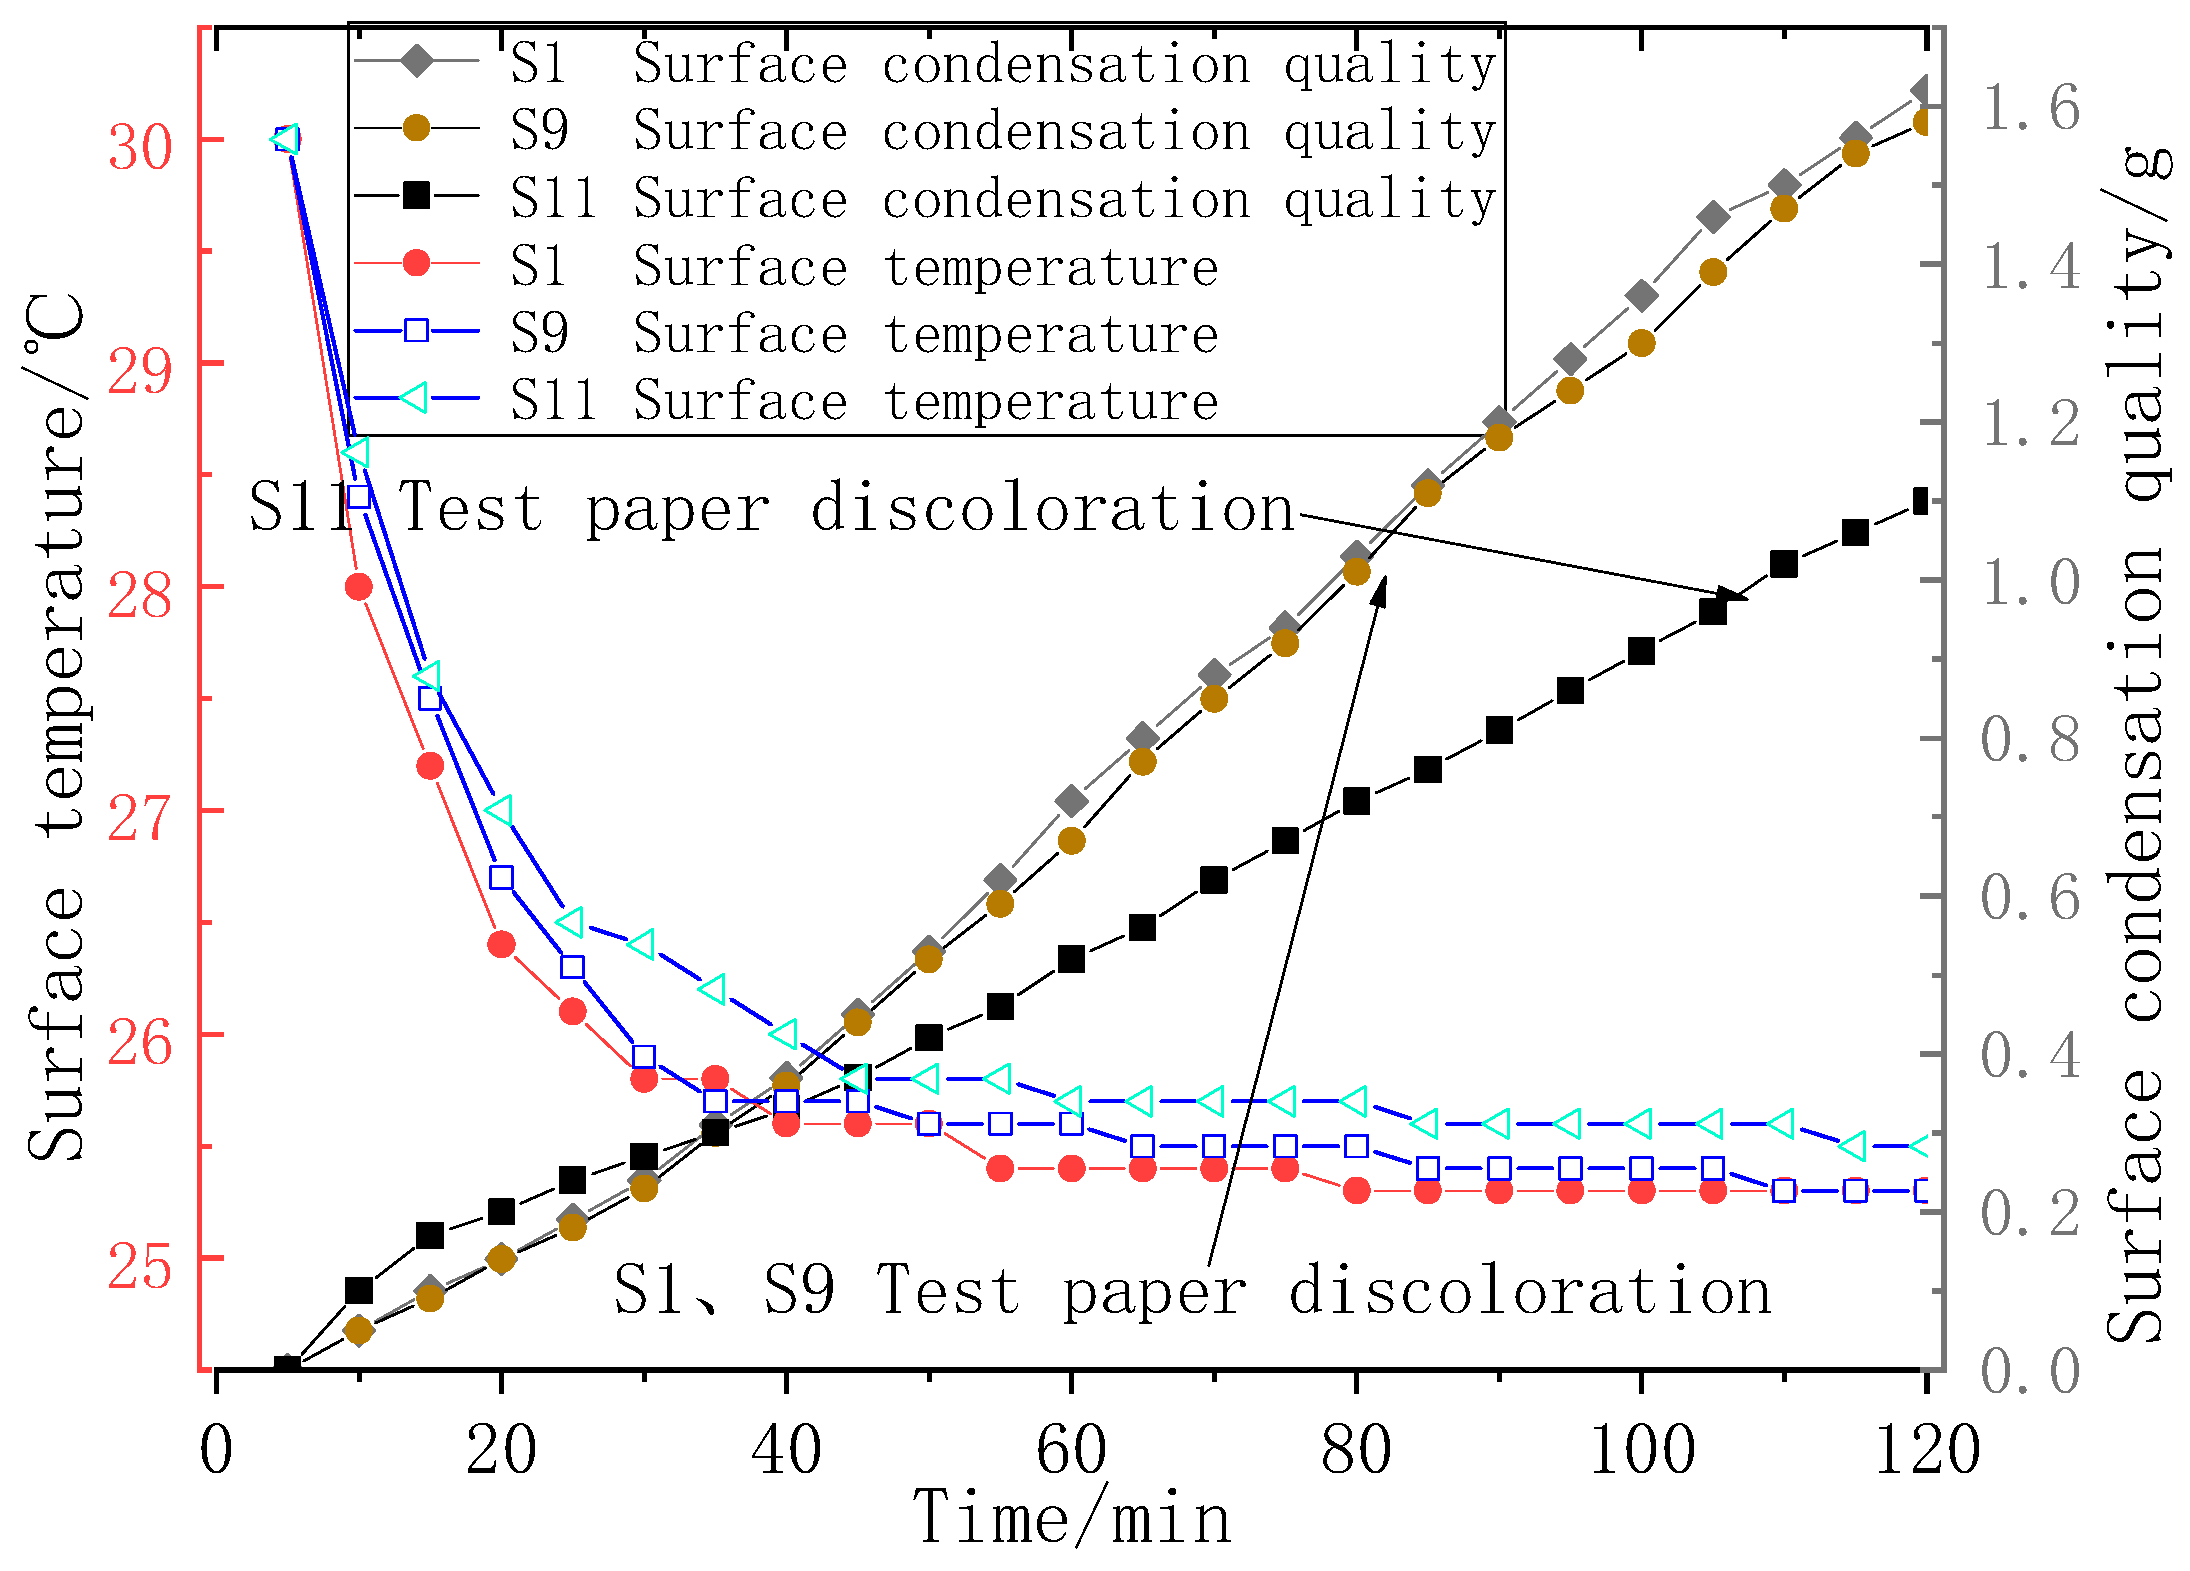
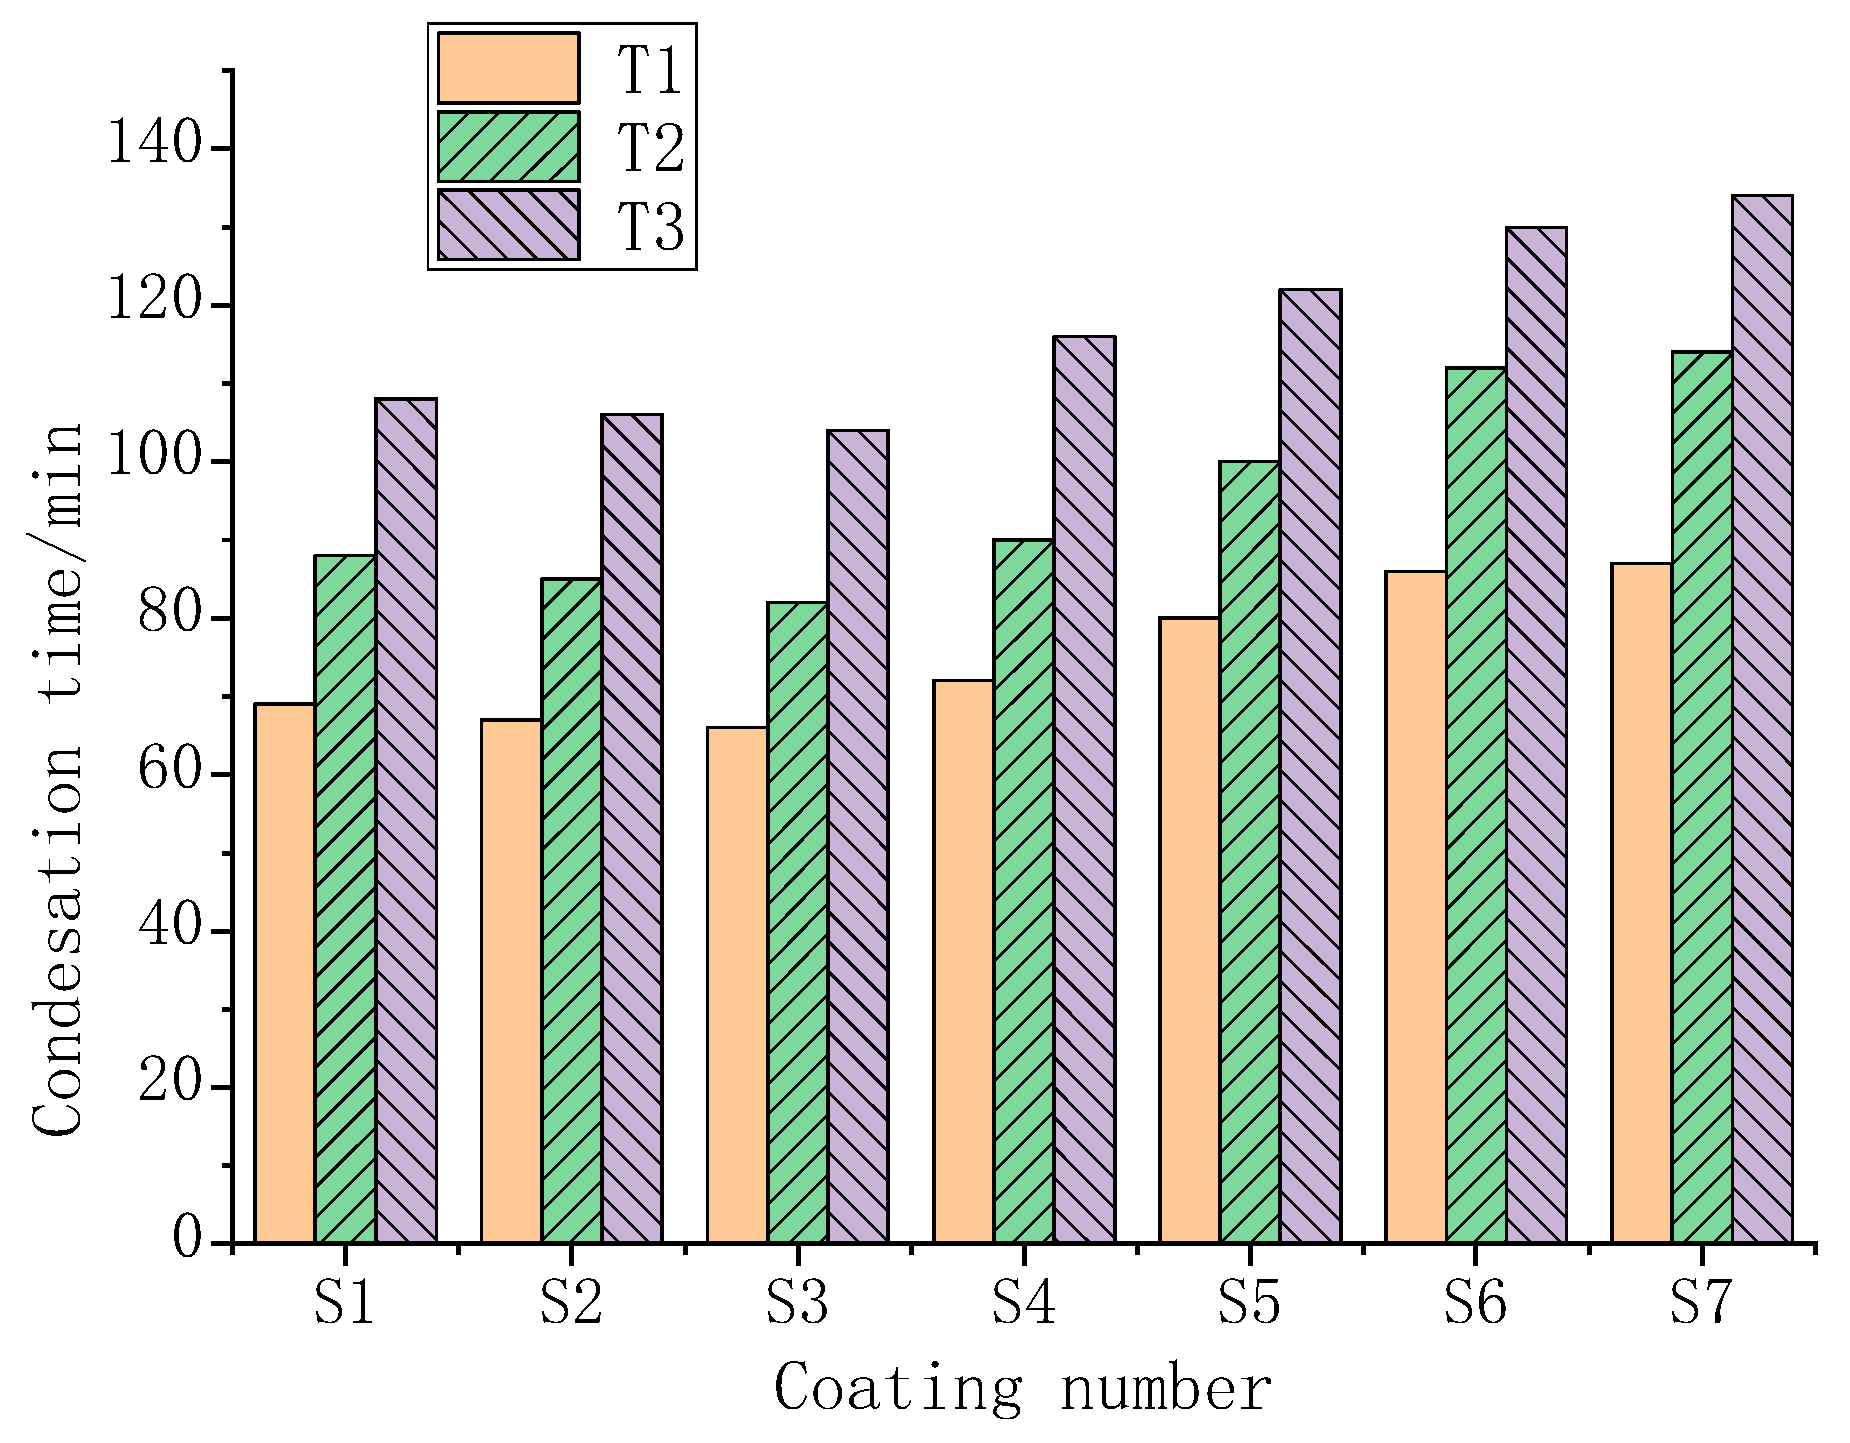
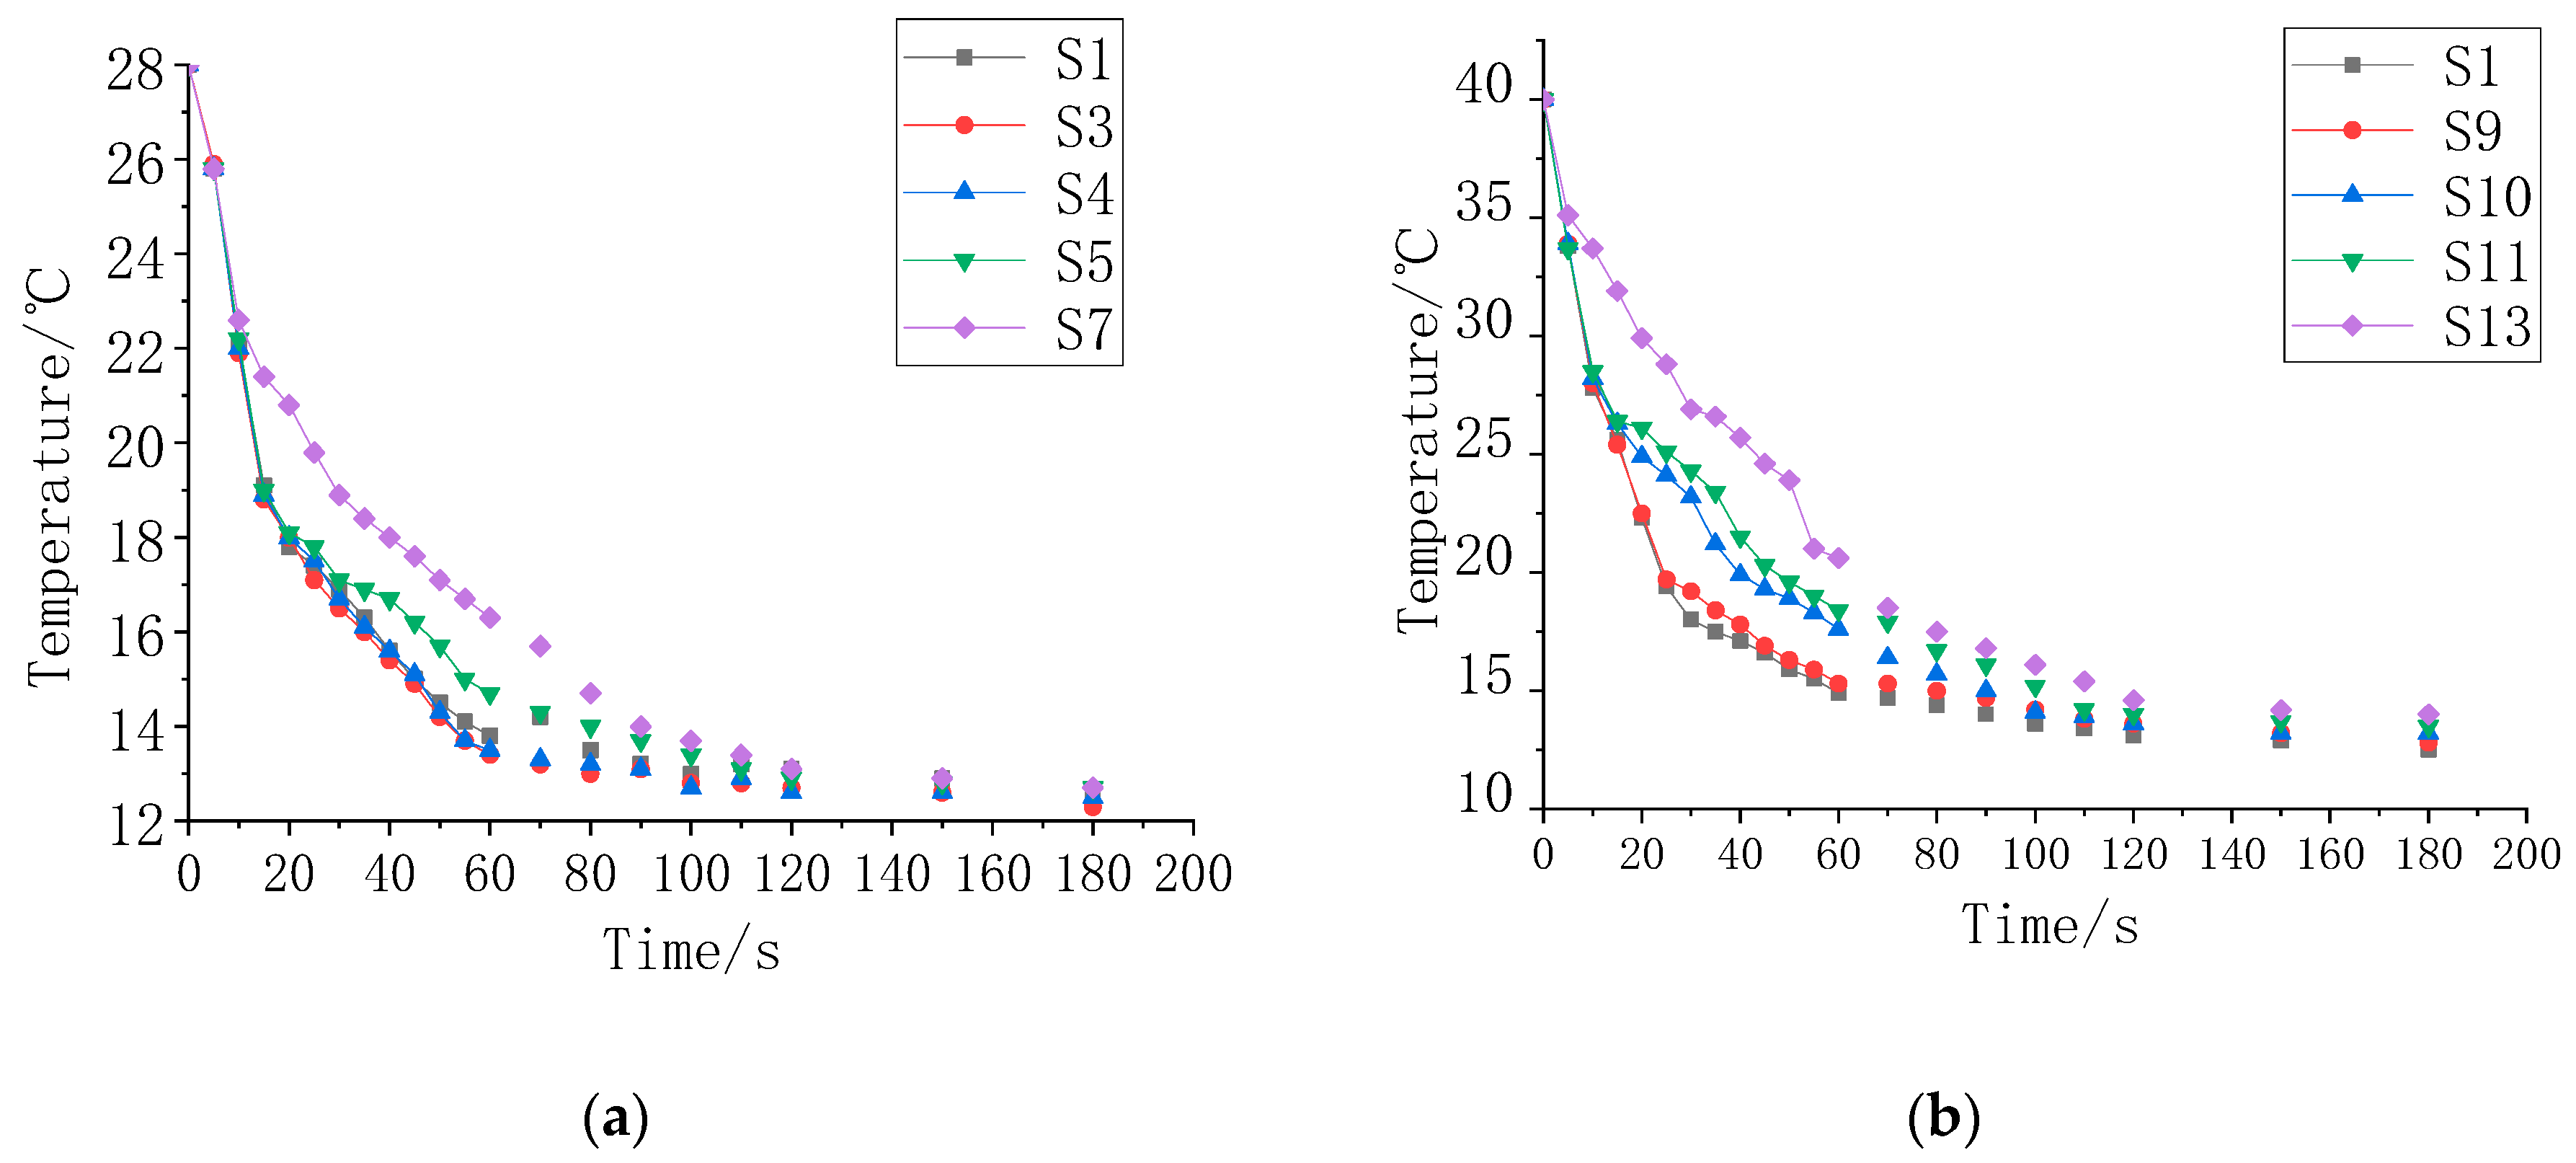
3.5. Study on the Temperature Control Performance of Composite Coatings
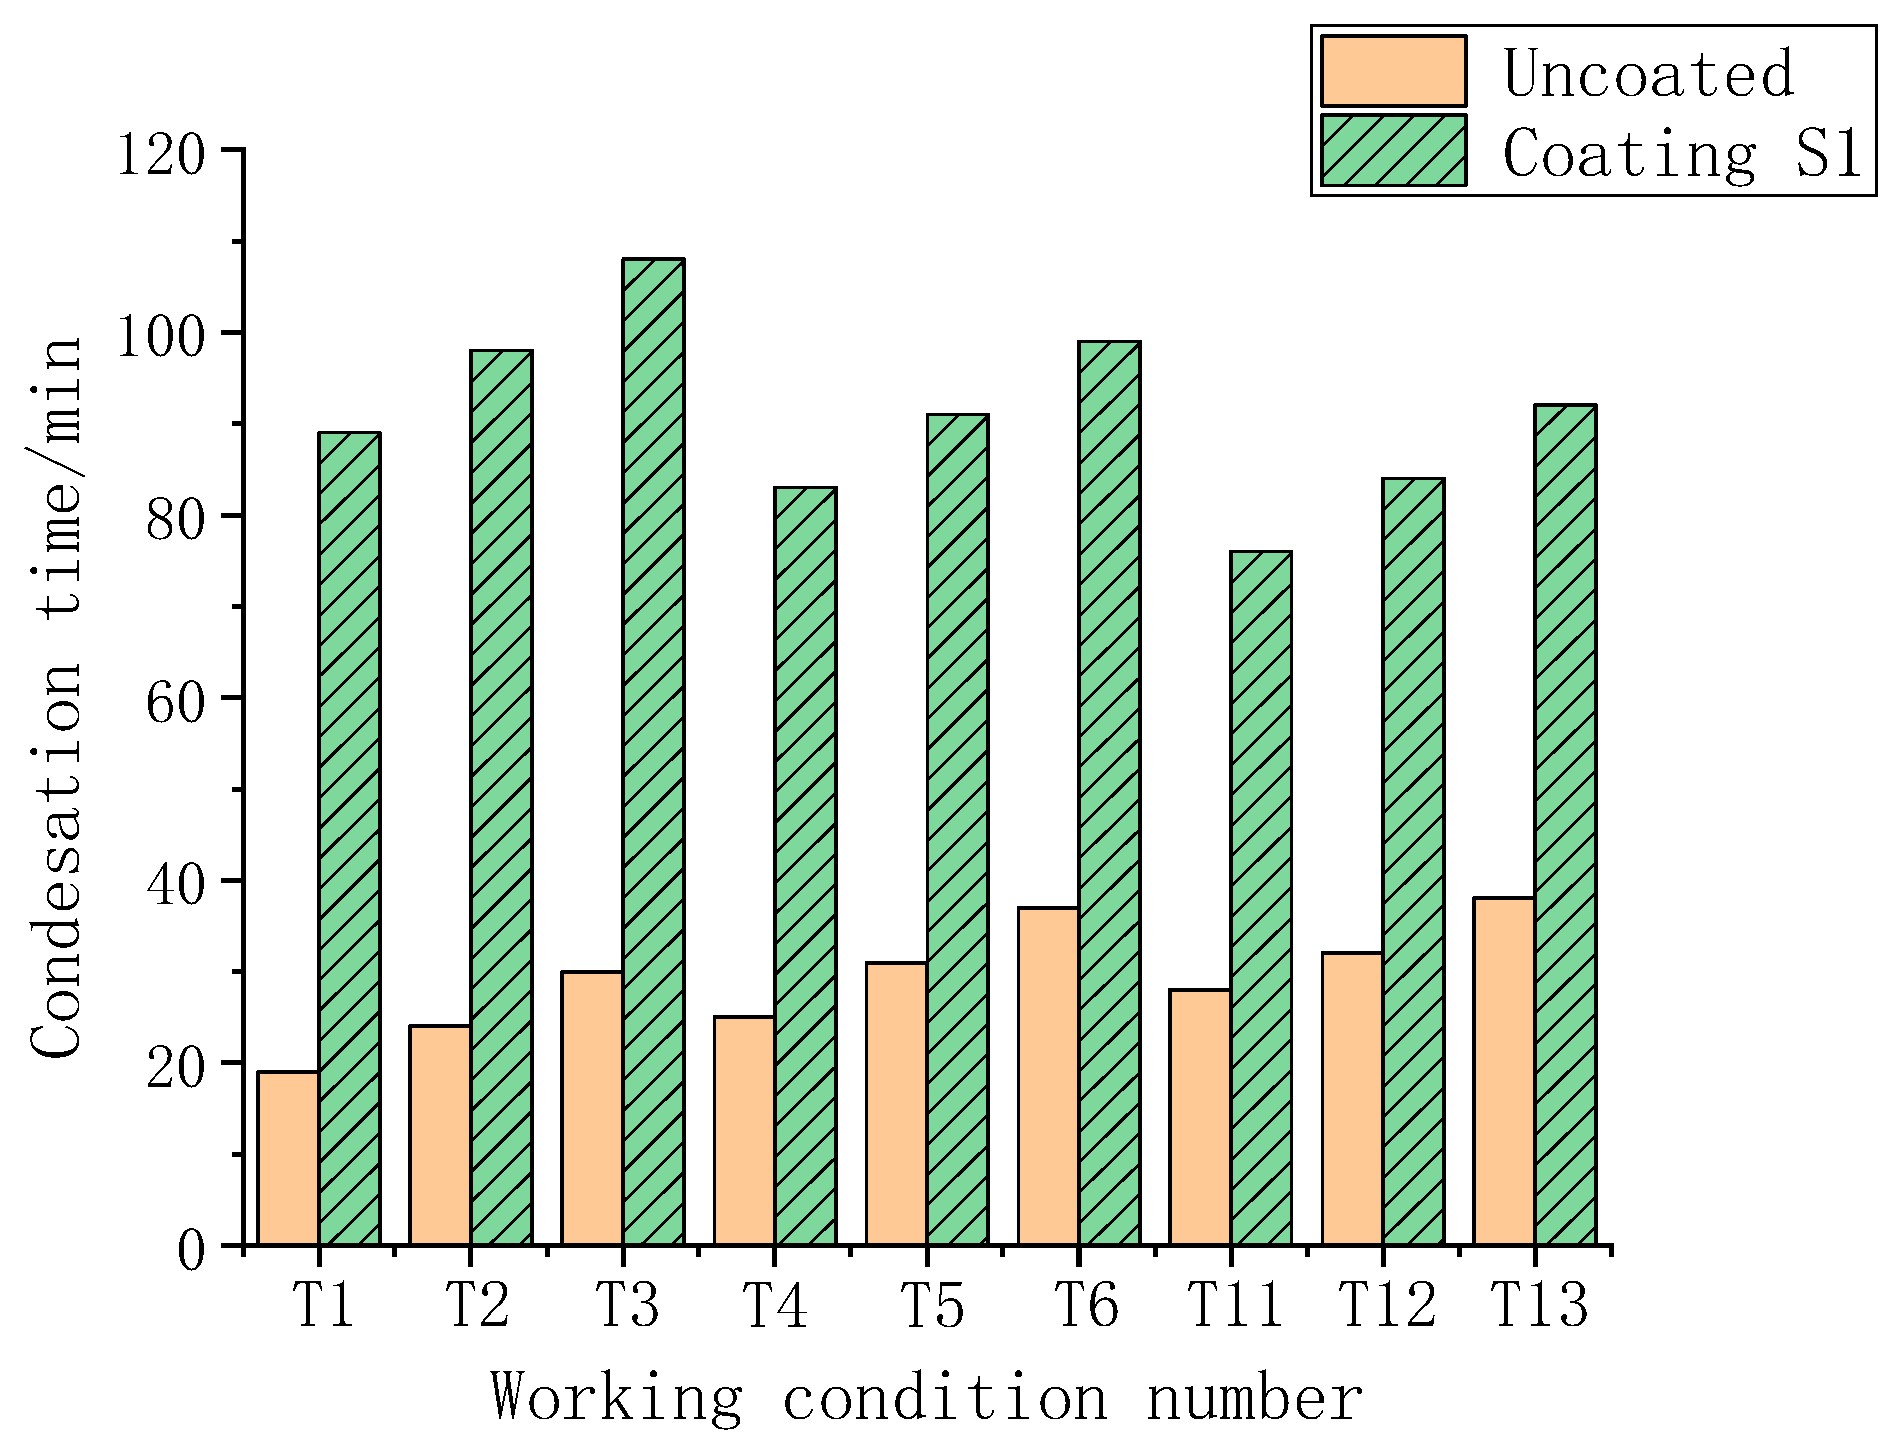
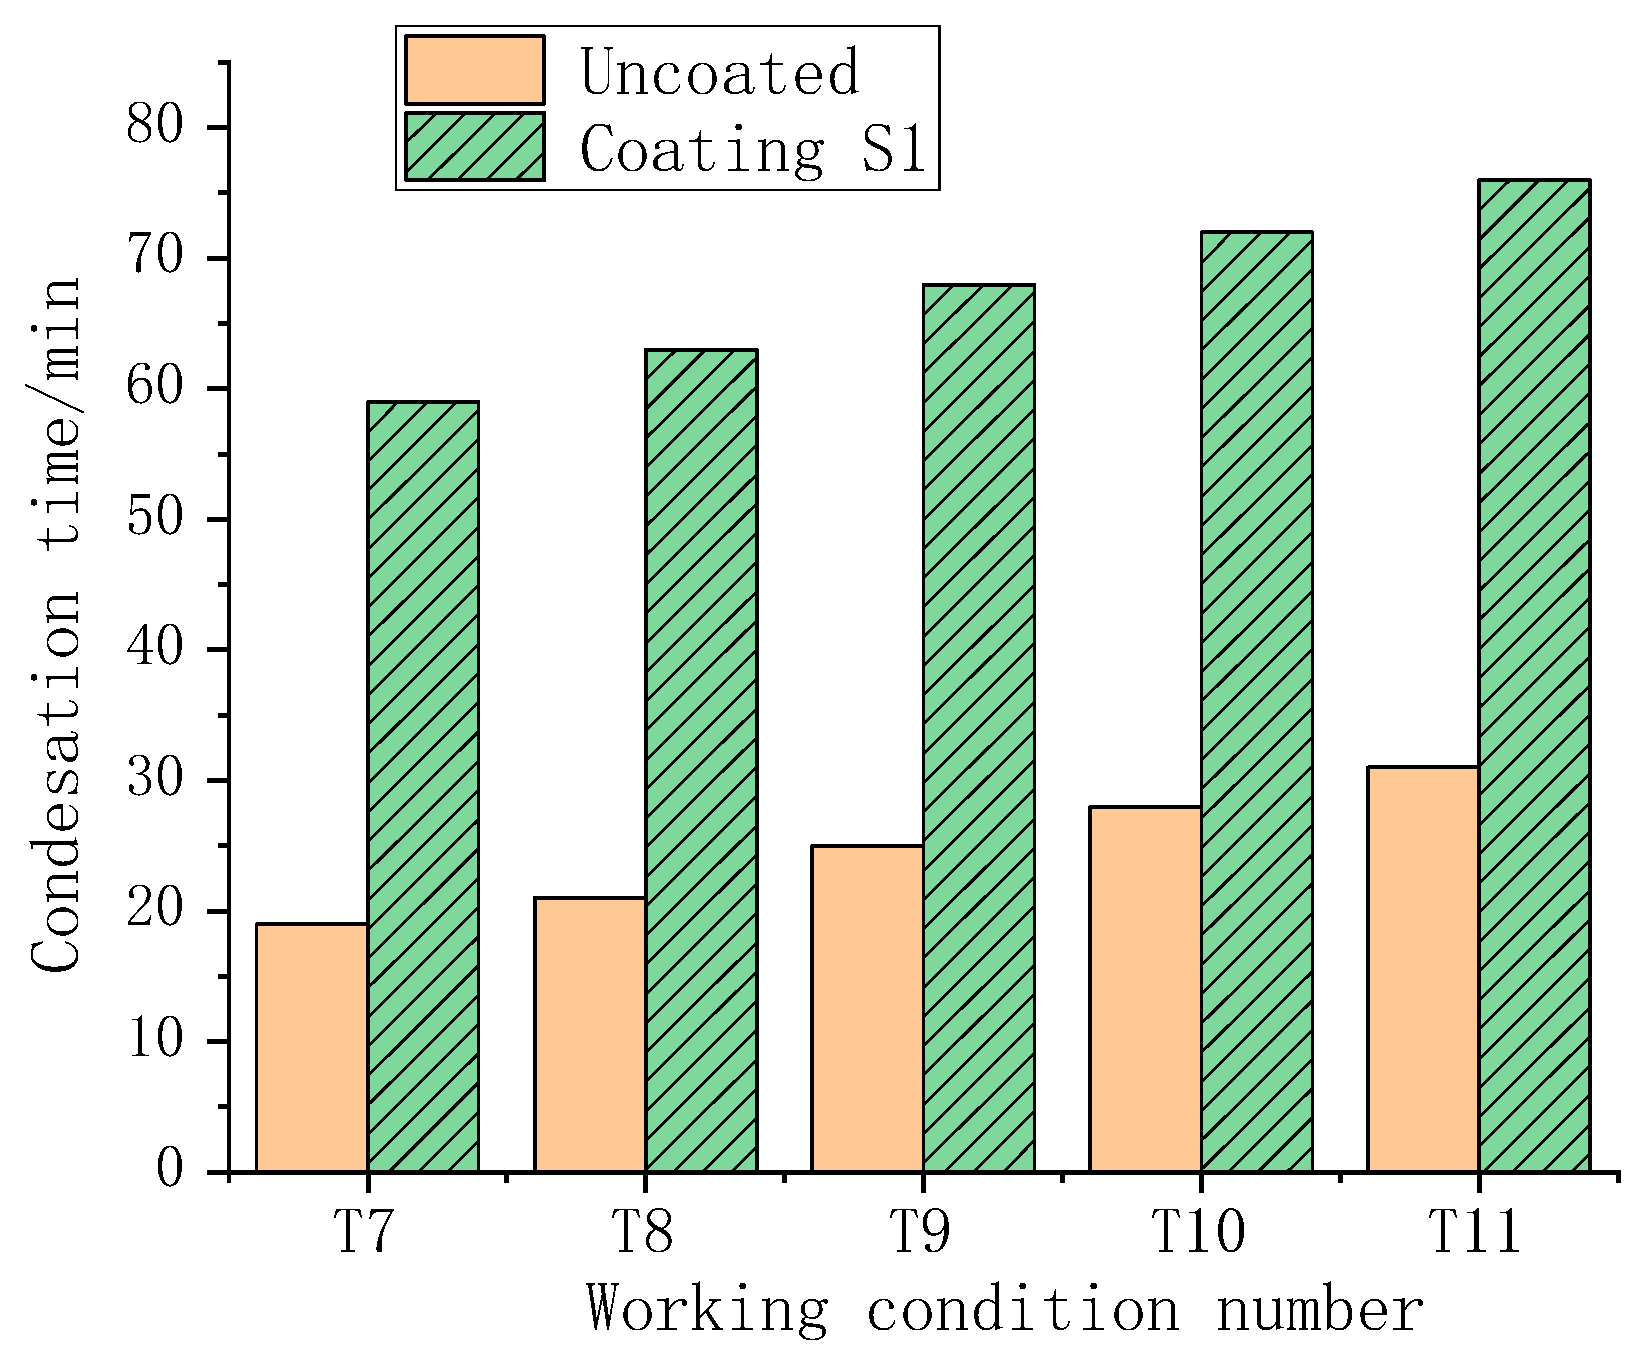
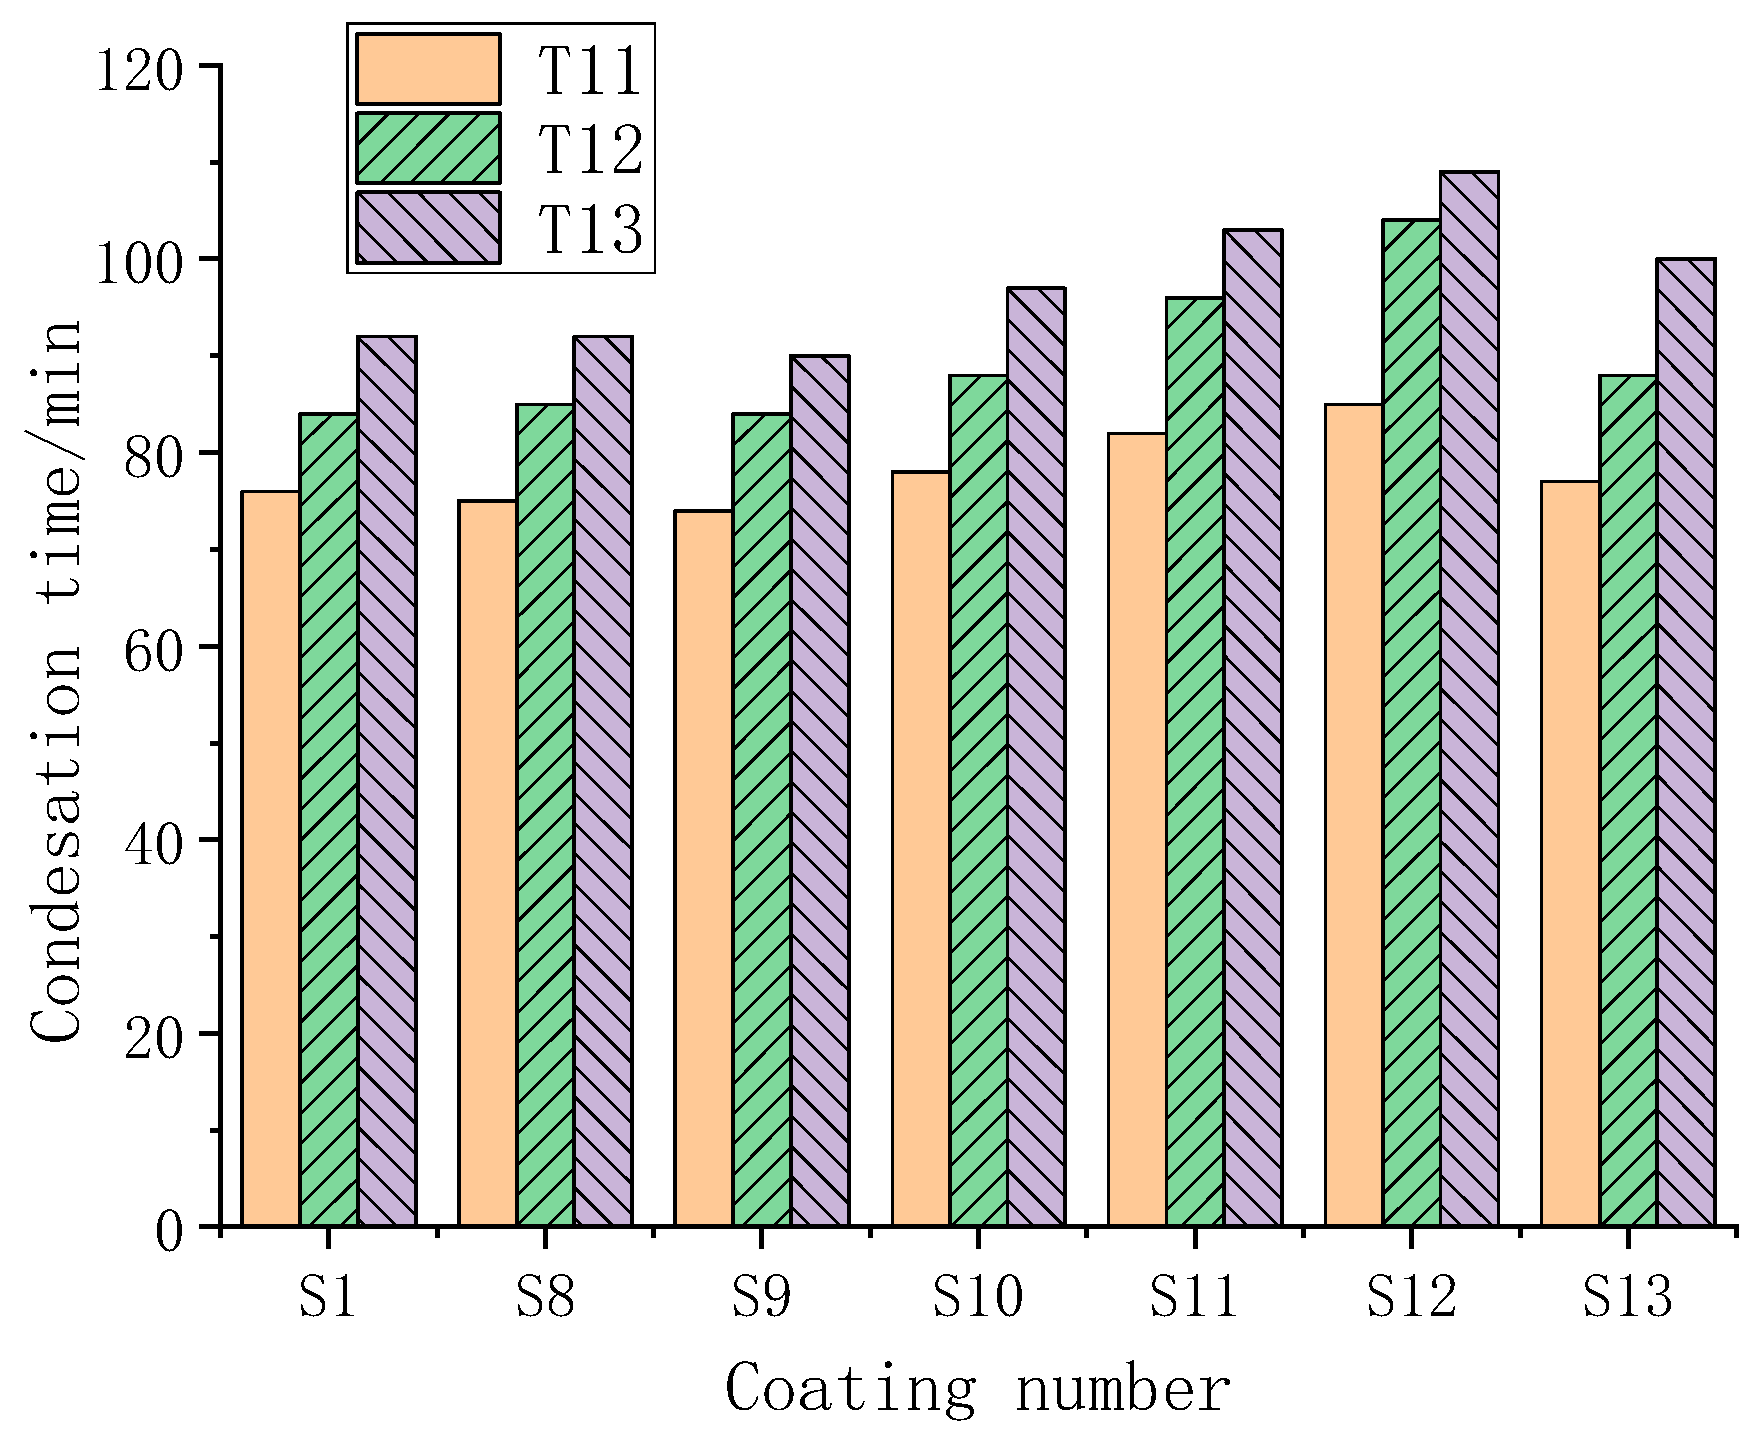
3.6. The Results of the Condensation Simulation Experiment
4. Discussion
5. Conclusions
Author Contributions
Funding
Conflicts of Interest
References
- Shi, Q.; Li, W.; Ai, B. Experimental Investigation on Breaking Characteristic of Load Switch in Medium High Voltage Ring Network Cabinet. Appl. Mech. Mater. 2014, 3546, 858–862. [Google Scholar] [CrossRef]
- Tencer, M.; Moss, J.S. Humidity management of outdoor electronic equipment: Methods, pitfalls, and recommendations. IEEE Trans. Compon. Pack. Technol. 2002, 25, 66–72. [Google Scholar] [CrossRef]
- Ouqing, L. Outdoor communications cabinets condensation prevention research. Electron. Mech. Eng. 2011, 27, 1–4. [Google Scholar]
- Wu, X.P.; Johnson, P.; Akbarzadeh, A. Application of heat pipe heat exchangers to humidity control in air-conditioning systems. Appl. Therm. Eng. 1997, 17, 561–568. [Google Scholar]
- Jurchuk, R.; Holmes, B. Microprocessor-based electric heat tracing controllers to improve reliability, reduce maintenance costs, and help avoid peak demands. In Proceedings of the Industry Applications Society 38th Annual Petroleum and Chemical Industry Conference, Toronto, ON, Canada, 9–11 September 1991. [Google Scholar]
- Hamdan, M.A. Layered wall design to prevent moisture condensation on its inside surface. Energy Convers. Manag. 2002, 43, 1821–1828. [Google Scholar] [CrossRef]
- Iwahara, H.; Matsumoto, H.; Takeuchi, K. Electrochemical dehumidification using proton conducting ceramics. Solid State Ionics 2000, 136, 133–138. [Google Scholar] [CrossRef]
- La, D.; Dai, Y.J.; Li, Y.; Wang, R.Z.; Ge, T.S. Technical development of rotary desiccant dehumidification and air conditioning: A review. Renew. Sustain. Energy Rev. 2010, 14, 130–147. [Google Scholar] [CrossRef]
- Toyoda, E.; Matsumoto, M.; Handa, T.; Miyata, Y.; Miyajima, Y.; Ichino, T. Insulation failure in telecommunication cables resulting from water condensation in aerial terminal closures and its prevention using a humidity-controlling polymer. IEEE Trans. Dielectr. Electr. Insul. 2005, 12, 175–182. [Google Scholar] [CrossRef]
- Yang, F.; Pan, Y.Z. Key Technologies Investigation of Damp-proofing and Anti-dewing for 12 kV High-voltage Switchgear. High Voltage Appar. 2018, 54, 40–47. [Google Scholar]
- Zalba, B.; Marın, J.M.; Cabeza, L.F.; Mehling, H. Review on thermal energy storage with phase change: Materials, heat transfer analysis and applications. Appl. Therm. Eng. 2003, 23, 251–283. [Google Scholar] [CrossRef]
- Dincer, I. Thermal energy storage systems as a key technology in energy conservation. Int. J. Energy Res. 2002, 26, 567–588. [Google Scholar] [CrossRef]
- Abhat, A. Low temperature latent heat thermal energy storage: Heat storage materials. Sol. Energy 1983, 13, 313–332. [Google Scholar] [CrossRef]
- Pongsopha, P.; Sukontasukkul, P.; Phoo-ngernkham, T.; Imjai, T.; Jamsawang, P.; Chindaprasirt, P. Use of burnt clay aggregate as phase change material carrier to improve thermal properties of concrete panel. Case Stud. Constr. Mater. 2019, 11, e00242. [Google Scholar] [CrossRef]
- Rabie, R.; Emam, M.; Ookawara, S.; Ahmed, M. Thermal management of concentrator photovoltaic systems using new configurations of phase change material heat sinks. Sol. Energy 2019, 183, 632–652. [Google Scholar] [CrossRef]


| Serial Number | Filler and Mass Fraction | Serial Number | Filler and Mass Fraction |
|---|---|---|---|
| S1 | / | S10 | 10% F2 |
| S2 | 2.5% F1 | S11 | 20% F2 |
| S3 | 5% F1 | S12 | 30% F2 |
| S4 | 10% F1 | S13 | 40% F2 |
| S5 | 20% F1 | S14 | 2.5% F1, 2.5% F2 |
| S6 | 30% F1 | S15 | 5% F1,5% F2 |
| S7 | 40% F1 | S16 | 10% F1, 10% F2 |
| S8 | 2.5% F2 | S17 | 20% F1, 20% F2 |
| S9 | 5% F2 | / | / |
| Working Condition Number | Cabinet Temperature/°C | Relative humidity/RH% | Dew Temperature/°C | Surface Temperature/°C |
|---|---|---|---|---|
| T1 | 20 | 90 | 18.3 | 14.3 |
| T2 | 20 | 80 | 16.4 | 12.4 |
| T3 | 20 | 70 | 14.4 | 10.4 |
| T4 | 25 | 90 | 23.2 | 19.2 |
| T5 | 25 | 80 | 21.3 | 17.3 |
| T6 | 25 | 70 | 19.1 | 15.1 |
| T7 | 25 | 90 | 28.2 | 20.2 |
| T8 | 25 | 90 | 28.2 | 21.2 |
| T9 | 30 | 90 | 28.2 | 22.2 |
| T10 | 30 | 90 | 28.2 | 23.2 |
| T11 | 30 | 90 | 28.2 | 24.2 |
| T12 | 30 | 80 | 26.2 | 22.2 |
| T13 | 30 | 70 | 23.9 | 19.9 |
| T14 | 35 | 90 | 33.1 | 29.1 |
| T15 | 35 | 80 | 31.0 | 27.0 |
| T16 | 35 | 70 | 28.7 | 24.7 |
| Serial Number | Heat Flow Rate Map Inflection Point (°C) | Phase Change Heat Storage (J/g) |
|---|---|---|
| S1 | / | / |
| S2 | / | / |
| S3 | 7.1 | 1.5 |
| S4 | 12.4 | 3.4 |
| S5 | 17.0 | 8.0 |
| S6 | 17.9 | 11.9 |
| S7 | 20.8 | 15.8 |
| Serial Number | Heat Flow Rate Map Inflection Point (°C) | Phase Change Heat Storage (J/g) |
|---|---|---|
| S1 | / | / |
| S8 | 14.1 | 1.3 |
| S9 | 19.2 | 2.7 |
| S10 | 25.1 | 6.1 |
| S11 | 26.2 | 9.2 |
| S12 | 30.1 | 11.6 |
| S13 | 32.3 | 16.2 |
© 2019 by the authors. Licensee MDPI, Basel, Switzerland. This article is an open access article distributed under the terms and conditions of the Creative Commons Attribution (CC BY) license (http://creativecommons.org/licenses/by/4.0/).
Share and Cite
Guo, J.; Wang, X.; Wang, J.; Chen, C.; Liu, Y.; Fan, W.; Jia, Z. Study on the Anticondensation Characteristics of Liquid Silicone Rubber Temperature-Control Coatings. Polymers 2019, 11, 1282. https://doi.org/10.3390/polym11081282
Guo J, Wang X, Wang J, Chen C, Liu Y, Fan W, Jia Z. Study on the Anticondensation Characteristics of Liquid Silicone Rubber Temperature-Control Coatings. Polymers. 2019; 11(8):1282. https://doi.org/10.3390/polym11081282
Chicago/Turabian StyleGuo, Juyi, Xilin Wang, Jun Wang, Chuan Chen, Yu Liu, Weinan Fan, and Zhidong Jia. 2019. "Study on the Anticondensation Characteristics of Liquid Silicone Rubber Temperature-Control Coatings" Polymers 11, no. 8: 1282. https://doi.org/10.3390/polym11081282
APA StyleGuo, J., Wang, X., Wang, J., Chen, C., Liu, Y., Fan, W., & Jia, Z. (2019). Study on the Anticondensation Characteristics of Liquid Silicone Rubber Temperature-Control Coatings. Polymers, 11(8), 1282. https://doi.org/10.3390/polym11081282