Article

Self-Regeneration Performance and Characterization of Silver-Containing Activated Carbon Fibers Coated by Titanium Dioxide

College of Materials Science and Art Design, Inner Mongolia Agricultural University, Hohhot 010018, China
*
Authors to whom correspondence should be addressed.
Polymers 2019, 11(6), 983; https://doi.org/10.3390/polym11060983
Submission received: 2 April 2019 / Revised: 22 May 2019 / Accepted: 23 May 2019 / Published: 4 June 2019

Abstract

:
In this study, wood-based activated carbon fibers (WACF) were modified by Ag nanoparticles (AgNPs) and TiO2 films. The coating of TiO2 films decreased the AgNPs agglomeration and exfoliation on WACF. As the soaking concentration of AgNO3 solution (Sconc) increased, AgNPs size and content increased, while the pore volume (especially micropore volume) of fibers reduced. However, at higher Sconc in the range of 0.2 to0.4 mol/L, only slight variations in AgNPs content and pore structure were observable for WACF/TiO2/Ag (Ag-containing WACF coated by TiO2 film). WACF/TiO2/Ag-0.1 (0.1 was the soaking concentration of AgNO3 solution, mol/L) represented the best self-regeneration performance under the visible light irradiation. The self-regeneration performance of WACF/TiO2/Ag was determined by the synergistic effects of two factors: adsorption and photodegradation. The abundant pores of WACF/TiO2/Ag-0.1 increased the methylene blue (MB) concentration of TiO2 surrounding and facilitated the MB photodegradation. Meanwhile, their suitable Ag content enhanced MB photodegradation. Furthermore, the principal pathway of a chemical reaction between Ag+ and WACF was interpreted based on the data of surface elemental constituents and surface functional groups.

Graphical Abstract

1. Introduction

In spite of the wide use of activated carbon fibers (ACF) as the adsorption material, ACF adsorption is a costly process, and this fact has encouraged an increasing studies concern into the manufacture of low-cost alternatives to ACF as well as the regeneration process [1]. A byproduct of wood processing is sawdust, which is readily available biomass for value-added utilization. Our previous studies successfully converted sawdust into low-cost ACF in more step processes including liquefaction, melt-spinning, curing, and activation [2].
Regeneration of ACF by means of photocatalytic degradation represents great superiority because of its features of low cost and less secondary pollution in comparison with other regeneration processes such as thermal and chemical treatments, microbiological regeneration, electrochemical methods, and supercritical extraction [3]. Moreover, the photocatalytic regeneration can achieve the ACF self-regeneration by simultaneously conducting the photocatalytic degradation and adsorption [4].
Titanium dioxide (TiO2), a highly effective photocatalyst, is usually immobilized on ACF for its regeneration [4]. However, the photocatalytic degradation of TiO2 is partly limited because of its two inherent properties: (1) with a large bandgap (3.2 eV), TiO2 only absorbs UV photons, which represent only about 5% of the energy in the solar spectrum; (2) TiO2 has a low photocatalytic activity because of the fast recombination of charge carriers [5]. In order to extend the photoresponse region and prevent (e/h+) pair recombination, noble metals are incorporated into TiO2, including Ag, Au, and Pt [6]. Compared with Au and Pt, Ag has a broader application field because of its antibacterial activity and low cost. However, in most studies, the noble metal nanoparticles are generally deposited on the surface of TiO2, which causes the poor stability of metals during the long-term operation.
To overcome these drawbacks, Liu et al. prepared the TiO2-encapsulated Ag nanoparticles (AgNPs) supported on porous SiO2 bead nanospheres, which enhanced the bonding between TiO2 and AgNPs [5]. Moreover, it has been reported that TiO2 with larger surface area and smaller particle size has a stronger bonding force with ACF [7,8]. In our previous work, the weight of TiO2 coating on ACF varied, and the effect of TiO2 content on the bonding between TiO2 film and wood-based ACF (WACF) had been illustrated [9].
The aim of this research was to prepare WACF with self-regeneration performance under visible-light irradiation. The AgNPs bonding force to TiO2 and WACF were enhanced by coating TiO2 film and controlling the AgNPs size. The influence of Ag loading contents on the structure of TiO2/Ag-co-loaded WACF (WACF/TiO2/Ag) was investigated, and their self-regeneration performance was evaluated by measuring their photocatalytic degradation behavior of methylene blue (MB) under visible-light irradiation.

2. Materials and Methods

2.1. Synthesis of Ag-Containing WACF Coated by TiO2 Film

To prepare the precursor fibers according to reference, 40–60 mesh wood powder from Chinese fir (Cunninghamia lanceolata (Lamb.) Hook.) was used [2]. The resultant precursors were heated to 800 °C with a heating rate of 5 °C/min under the nitrogen protection and activated by introducing a steam flow (1.0 mL/min) for 1 h. The obtained samples were labeled as WACF.
Furthermore, 0.5 g WACF was immersed in 60 mL AgNO3 (Sinopharm Chemical Reagent Co., Ltd., Beijing, China) solution over a concentration range of 0.05–0.4 mol/L at 25 °C for 24 h and then dried at 80 °C for 2 h to prepare Ag-containing WACF.
Twenty milliliters of tetrabutyl titanate (Lynn Technology Development Co., Ltd, Shanghai, China) and 4 mL diethanolamine (Fuchen Chemical Reagent Factory, Tianjin, China) were dissolved in 24 mL ethanol (Yongsheng Chemical Reagent Factory, Tianjin, China) with stirring for 0.5 h to get solution A. Subsequently, solution B containing 12 mL ethanol, 0.4 mL acetic acid (Fuchen Chemical Reagent Factory, Tianjin, China), and 2.8 mL deionized water was slowly added into solution A with magnetic stirring at 25 °C. After the mixture was hydrolyzed for 2 h with magnetic stirring, the transparent TiO2 sol was obtained.
Six grams of transparent TiO2 sol and Ag-containing WACF were mixed by vibration for 2 h at 25 °C. Thereafter, Ag-containing WACF coated by TiO2 sol was dried at 100 °C for 5 h, and then calcined at 500 °C for 1 h under nitrogen protection. The samples prepared by different AgNO3 solution concentrations were expressed as WACF/TiO2/Ag-C, where C was the soaking concentration of AgNO3 solution (Sconc).

2.2. Characterization

The surface morphology of samples was observed by a field emission scanning electron microscope (FESEM, SU8010, Hitachi, Tokyo, Japan). Their elemental constituents in the selected area were detected by scanning electron microscopy coupled with energy dispersive X-ray analyzer (EDXA, 550i, IXRF, Austin, TX, USA).
The crystallite structure was analyzed by X-ray diffractometer (XRD, XRD-6000, Shimadzu, Kyoto, Japan) equipped with CuKα radiation (λ = 0.154 nm). The scanning rate was 2°/min with scanning steps of 0.02° from 10° to 80° (2θ). The average crystal size (D) of Ag was calculated by the Scherrer’s formula from its (111) reflection.
The surface elemental composition and functional groups were studied by an X-ray photoelectron spectrometer (XPS, ESCALAB 250Xi, Thermo Fisher Scientific, Waltham, MA, USA). A monochromatic Al Kα X-ray (1486.6 eV) source served as incident radiation operated at 420 W (14 kV; 30 mA). The survey scans were collected from the binding energy (BE) of 0 to 1350 eV. XPSPEAK software was used to conduct the spectral deconvolution. A Shirley-type background was chosen and subtracted prior to quantification. After the baseline was subtracted, the curve fitting was performed with a fitting program based on an asymmetric Gaussian–Lorentzian sum function. The peak shape was optimized until an acceptable fit was obtained.
The N2 adsorption–desorption isotherms were measured and analyzed by a surface area and pore size analyzer (Autosorb-iQ; Quantachrome Instruments Co., Boynton Beach, FL, USA). All samples were outgassed at 300 °C for 3 h before the measurement to remove any adsorbed water or other impurities. The BET-specific surface area (SBET) was estimated via the BET equation. The total pore volume (Vtotal) was based on the assumption that N2 filled the sample pores at a relative pressure (p/p0) of 0.995. The micropore area and volume (Smicro, Vmicro) were calculated by the t-plot method. The mesopore area and volume (Smeso, Vmeso) were estimated via the BJH method. The pore size distribution was determined by QSDFT.

2.3. Self-Regeneration Measurements

The self-regeneration property of samples was evaluated by adsorbing and degrading MB (CAS 7220-79-3, Jinke Fine Chemicals Co., Ltd., Tianjin, China). For this, 0.1 g samples were dispersed in 100 mL MB solution with a concentration of 200 mg/L and shaken at 25 °C. A 60-W filament lamp was used as a light source to trigger the photocatalytic reaction. After irradiation for an appropriate interval, the reaction solution was filtrated, and the concentration of MB was measured by a UV–vis spectrophotometer (TU-1950, Purkinje General Instrument Co., Ltd., Beijing, China). The change of relative absorbance was used to record the change of MB concentration in solution, that was Ct/C0 = At/A0 (Ct, At refer to the concentration and absorbance of MB in solution at t time; C0, A0 refer to the concentration and absorbance of MB in solution at the initial time, respectively).

3. Results and Discussion

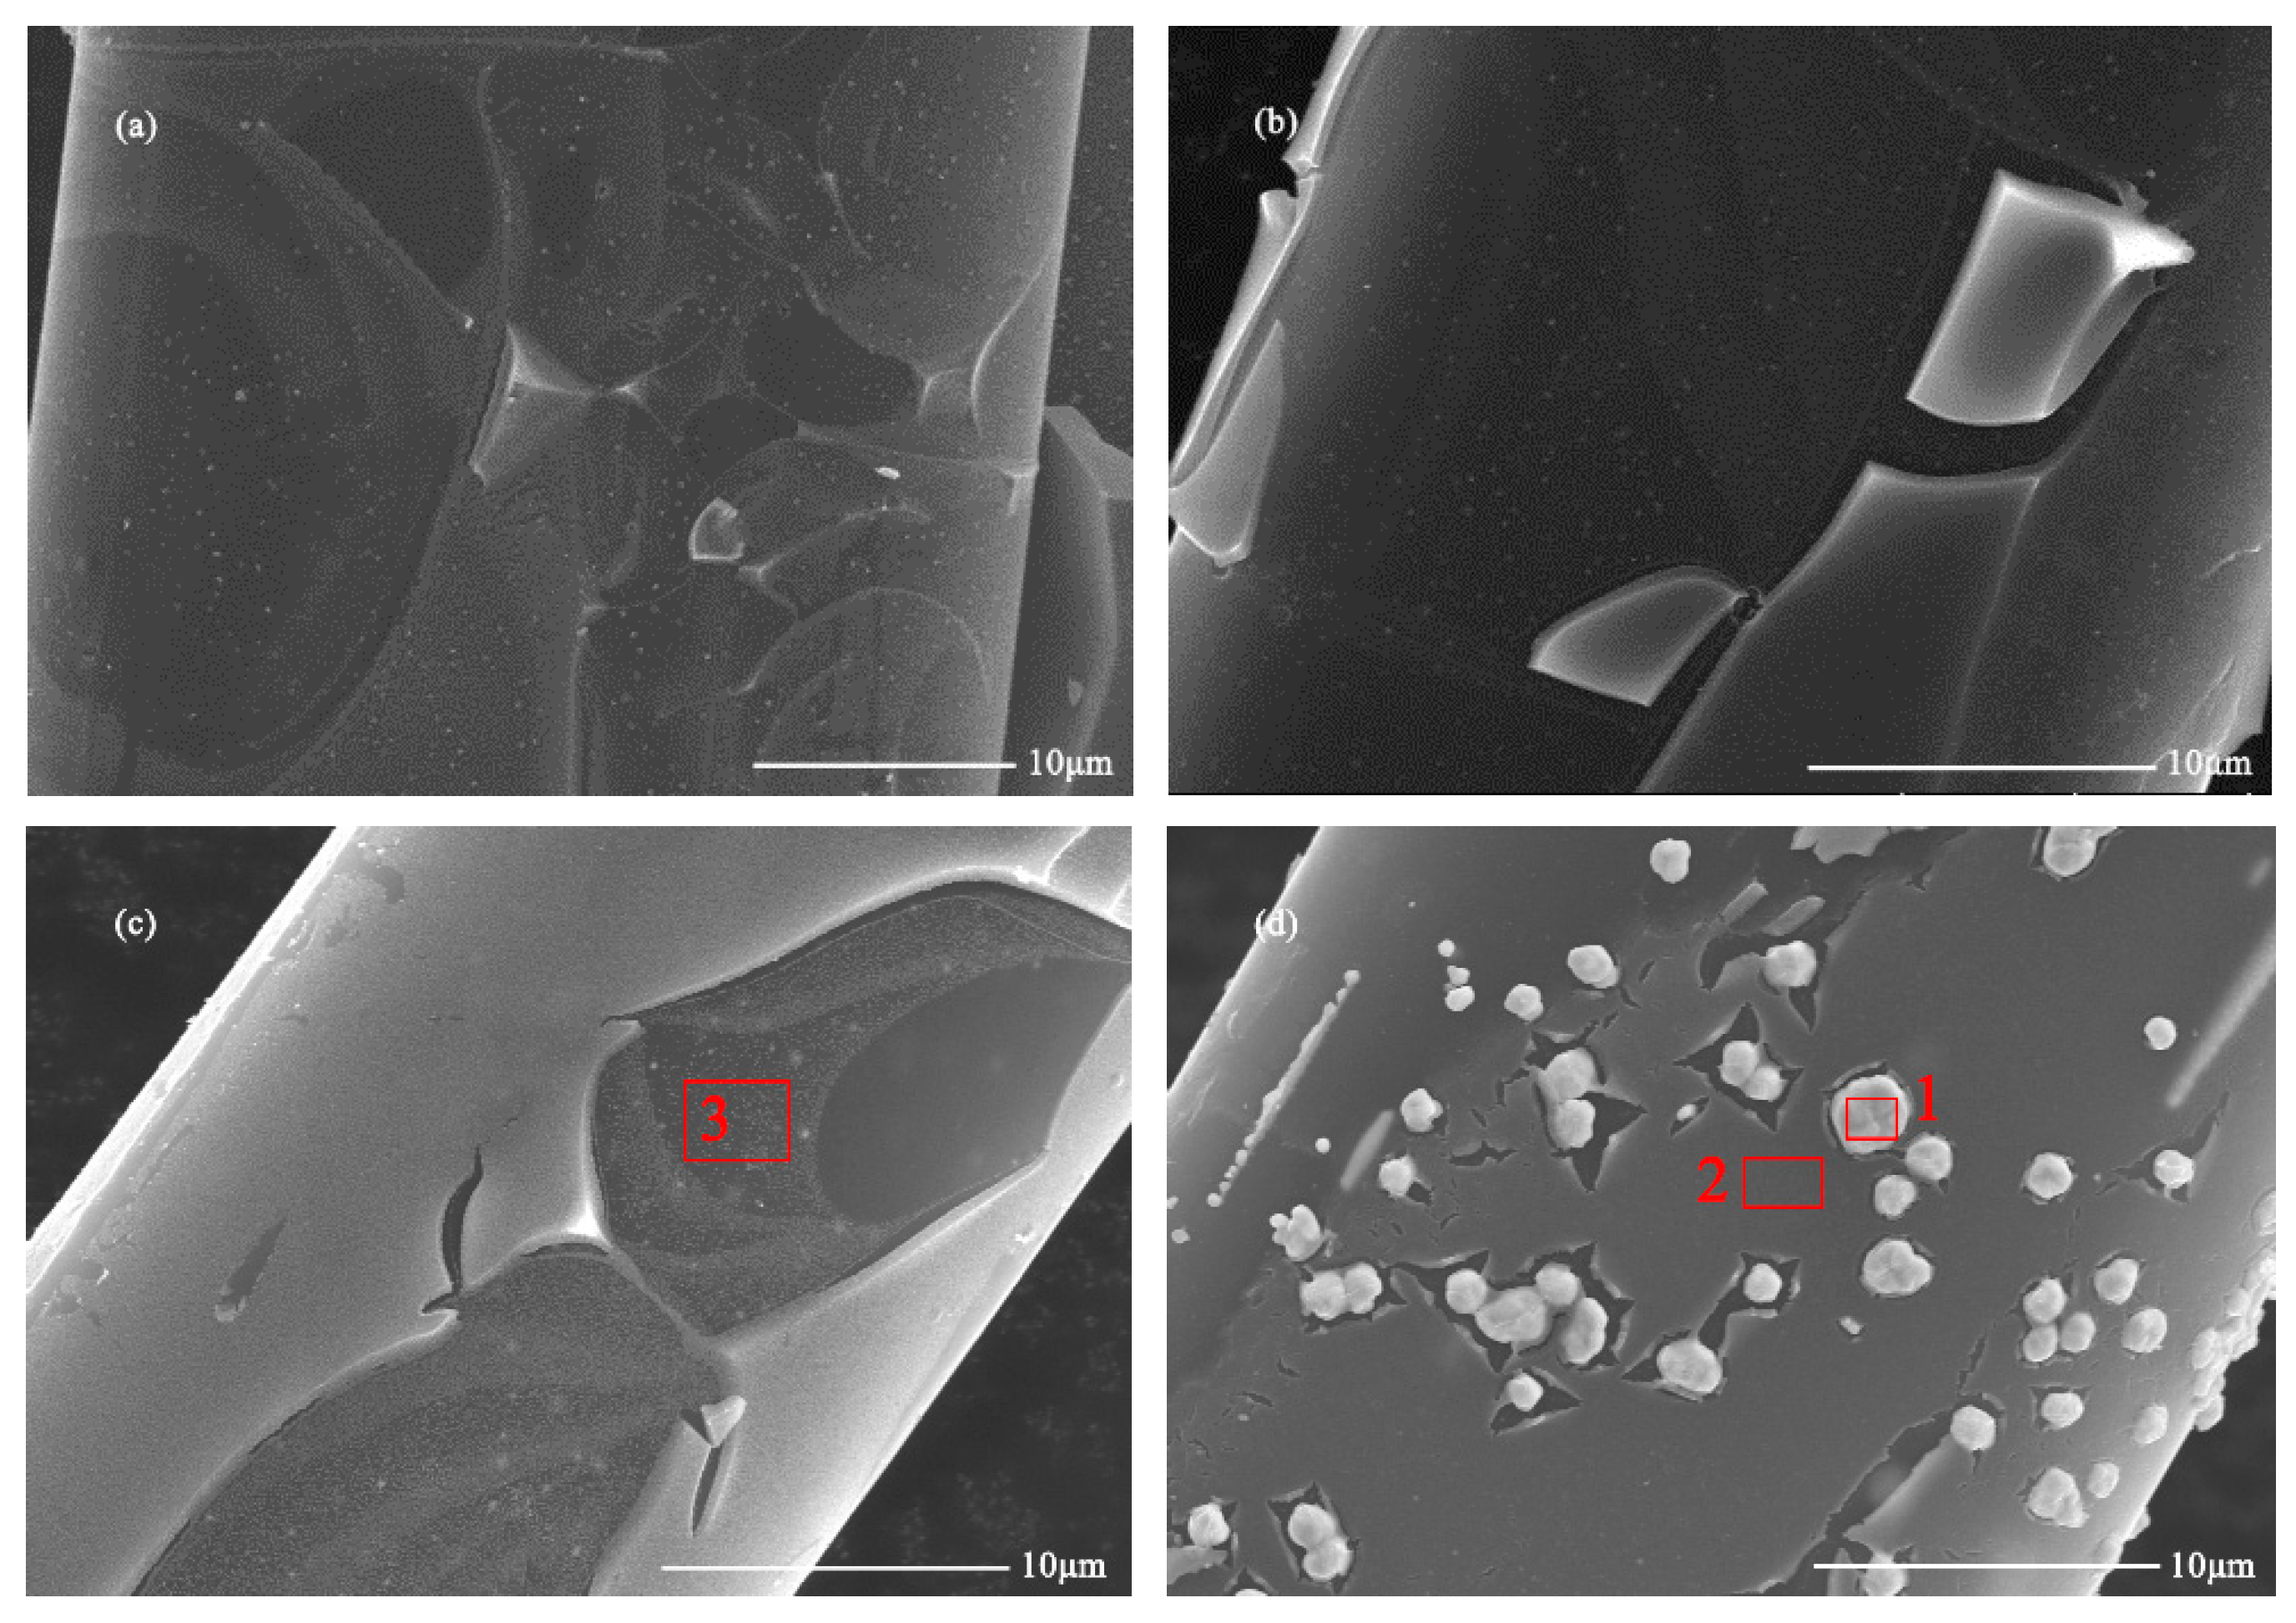
3.1. Surface Morphology

The FESEM images in Figure 1 show the surface morphology of WACF/TiO2/Ag. Numerous nanoparticles were observed on the surface of WACF, and the results of EDXA (see Table 1) proved that they were Ag nanoparticles (AgNPs). These AgNPs on the surface of WACF were coated by TiO2 films, and their diameters dramatically increased from about 0.2 μm to 1 μm with increasing Sconc. When Sconc reached 0.4 mol/L, AgNPs could not be fully covered by TiO2 films. Moreover, the thickness of TiO2 films on the fibers was not uniform. This might be attributed to the inconsistent contraction of WACF and TiO2 films during calcination. The contraction ratio of WACF was less than that of TiO2 films under the heat treatment [6]. Thus, TiO2 films easily split into numerous flakes during the calcination treatment [10]. Likewise, a part of TiO2 films with a higher thickness could fall off from fibers. Table 1 shows that element Ti was detected in areas covered by thick and thin TiO2 films, which demonstrates that TiO2 films coated all the fibers. However, the content of element Ti in the areas with thin TiO2 films (such as area-3) was significantly lower than that in the areas with thick TiO2 films (such as area-2). Element N was mainly originated from the impregnation of the AgNO3 solution. Thus, element N was only detectable on area 1 (on the surface of AgNPs).

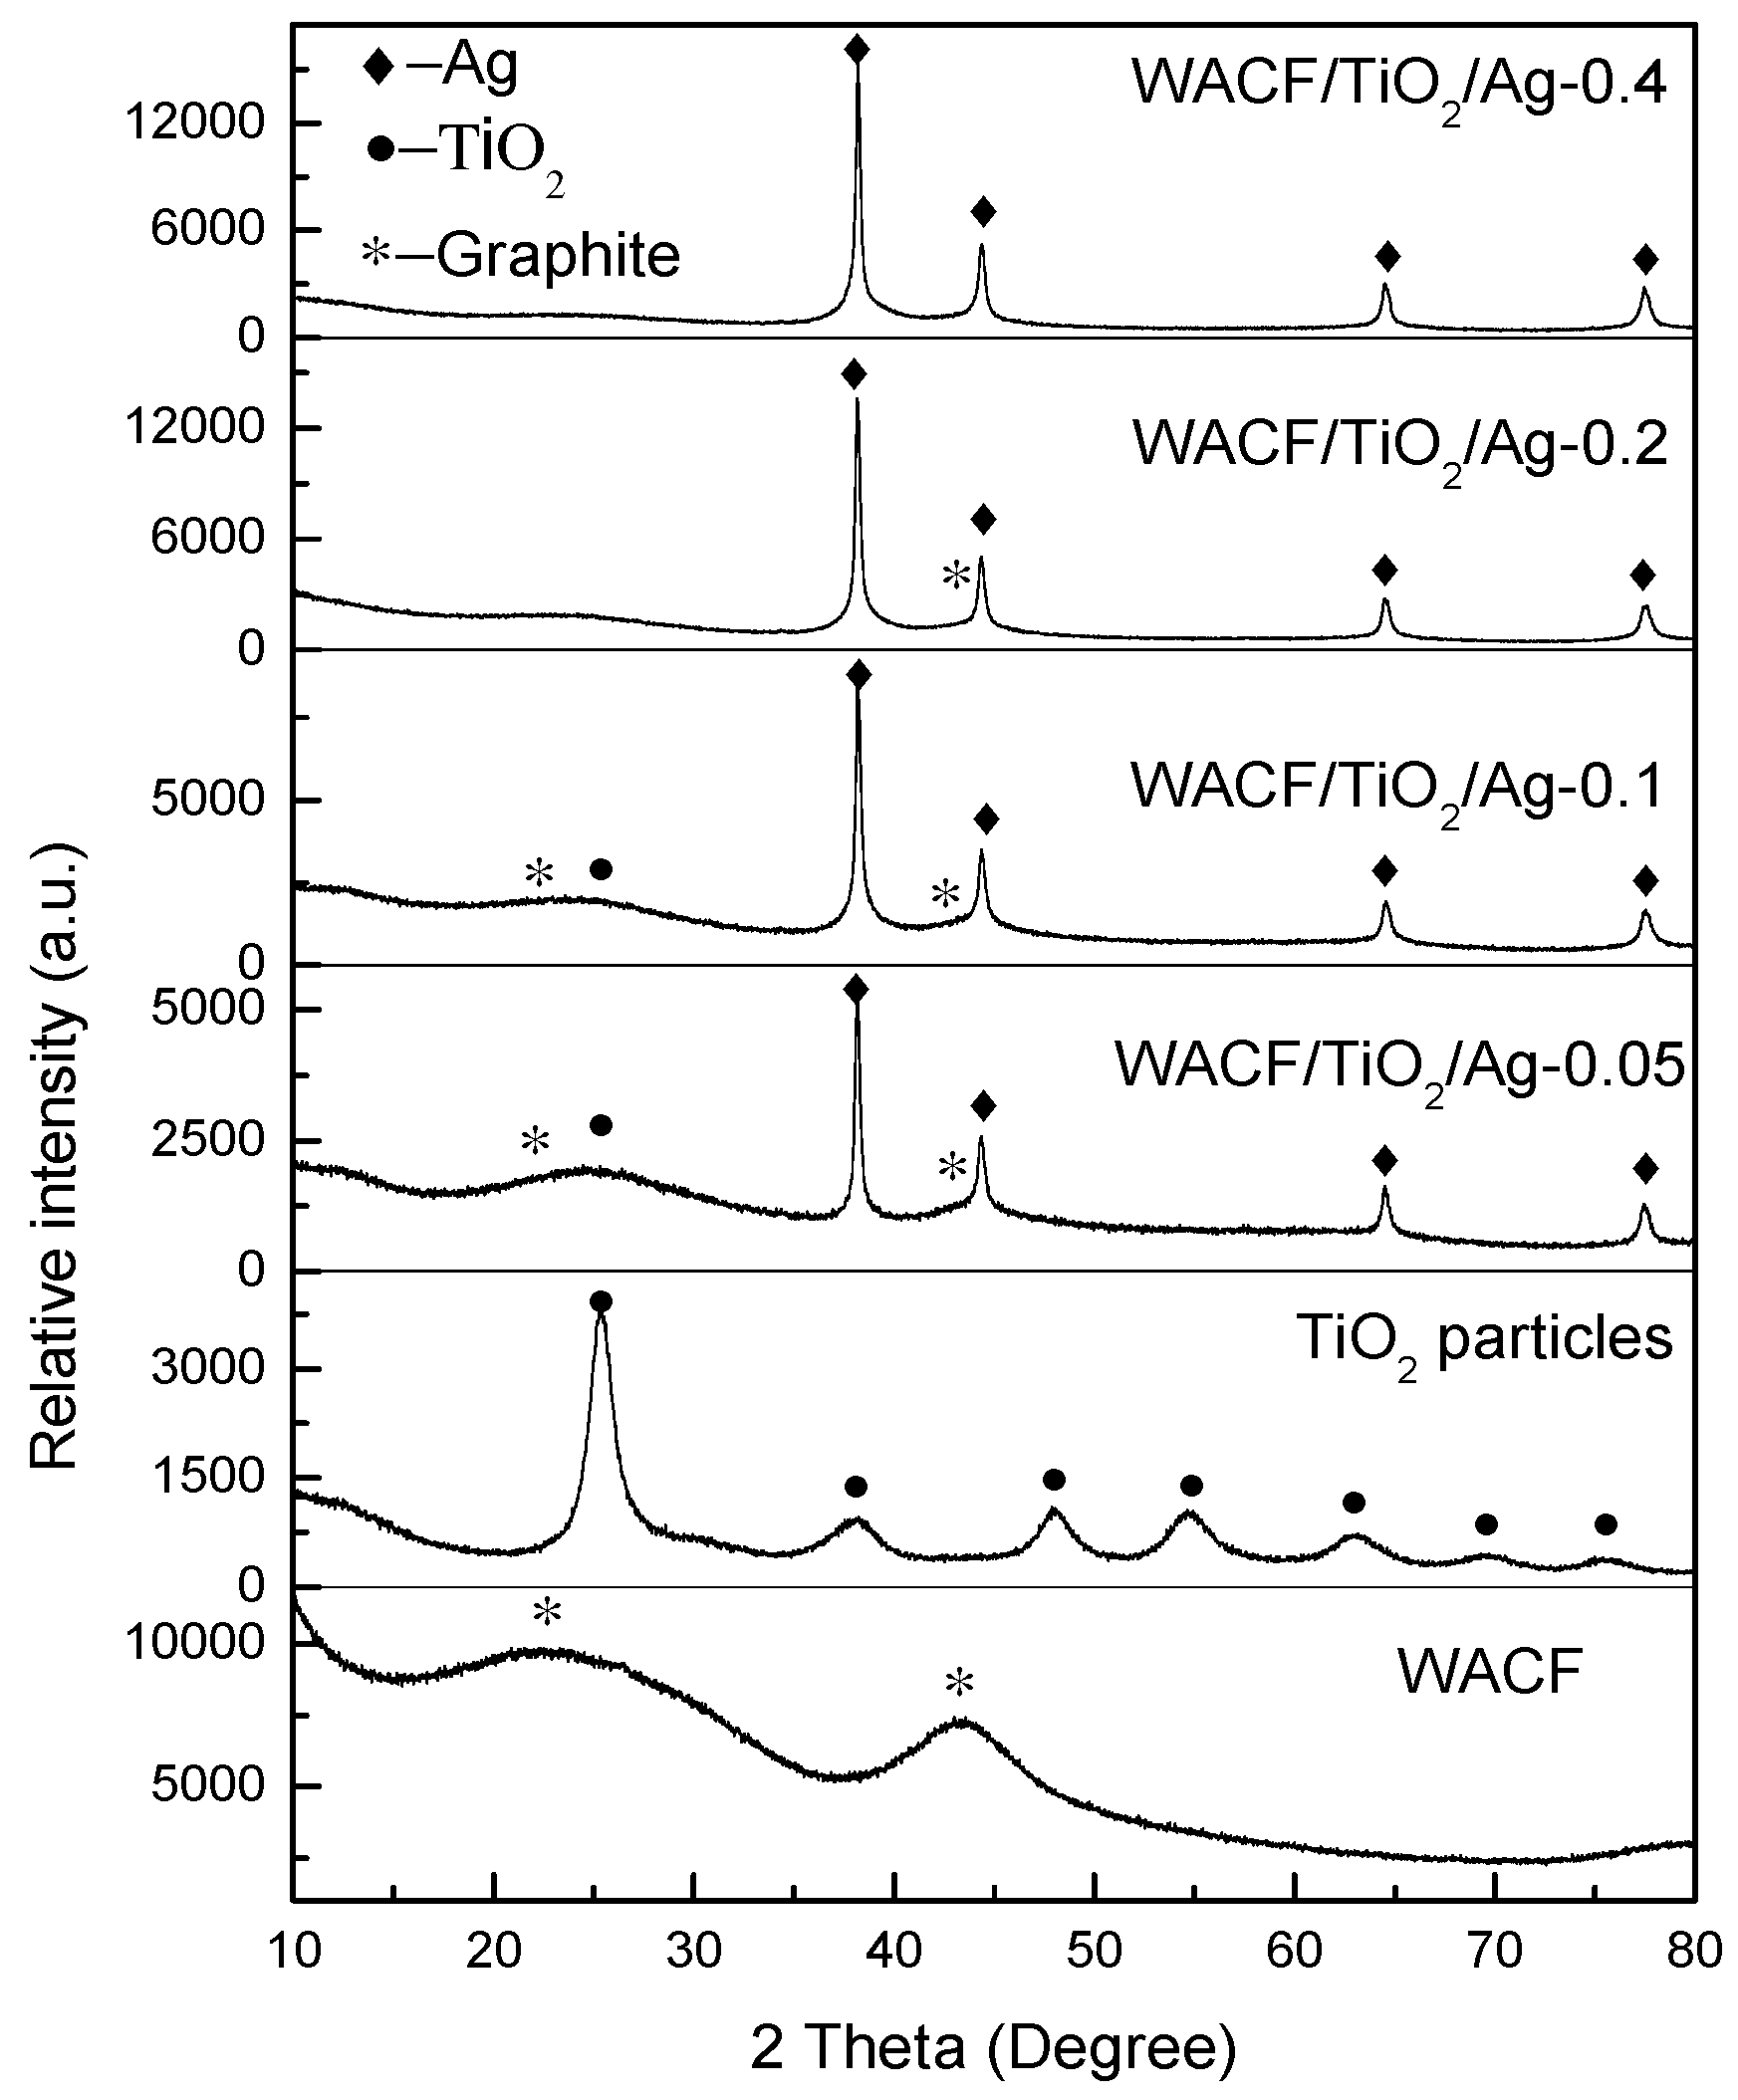
3.2. Crystallite Structure

XRD patterns of WACF/TiO2/Ag are shown in Figure 2. The four diffraction peaks of WACF/TiO2/Ag at 38.1°, 44.3°, 64.4°, and 77.4° are indexed to Ag, corresponding to (111), (200), (220), and (311) reflections, respectively [11]. This result indicates that most of Ag+ absorbed to WACF was reduced to well-crystallized metal Ag. The diffraction peak located at 25.3° is indexed to the (101) crystal plane of anatase TiO2 [12]. Furthermore, two broad diffraction peaks exist near 23° and 44°, which are assigned to the disordered graphitic 002 plane and 10 plane (overlapped 100 and 101), respectively [13]. However, the diffraction peaks of anatase TiO2 and disordered graphite became quite inconspicuous as Sconc increased. This is because of the presence of amounts of metal Ag. The Ag diffraction intensity of samples prepared from higher Sconc was so strong that the TiO2 and graphite diffraction peaks were difficult to find. Moreover, the low relative content of pure TiO2 led to the weak TiO2 diffraction peaks. TiO2 was prepared by the sol–gel method, and a large amount of element C existed in the gel. After the heat treatment carried out under nitrogen protection, the content of these element C in the TiO2 film was still large. The average crystal size (D) of Ag calculated by the Scherrer’s formula from (111) reflection is shown in Table 2. With increasing Sconc, the average crystal size of Ag was slightly enlarged.

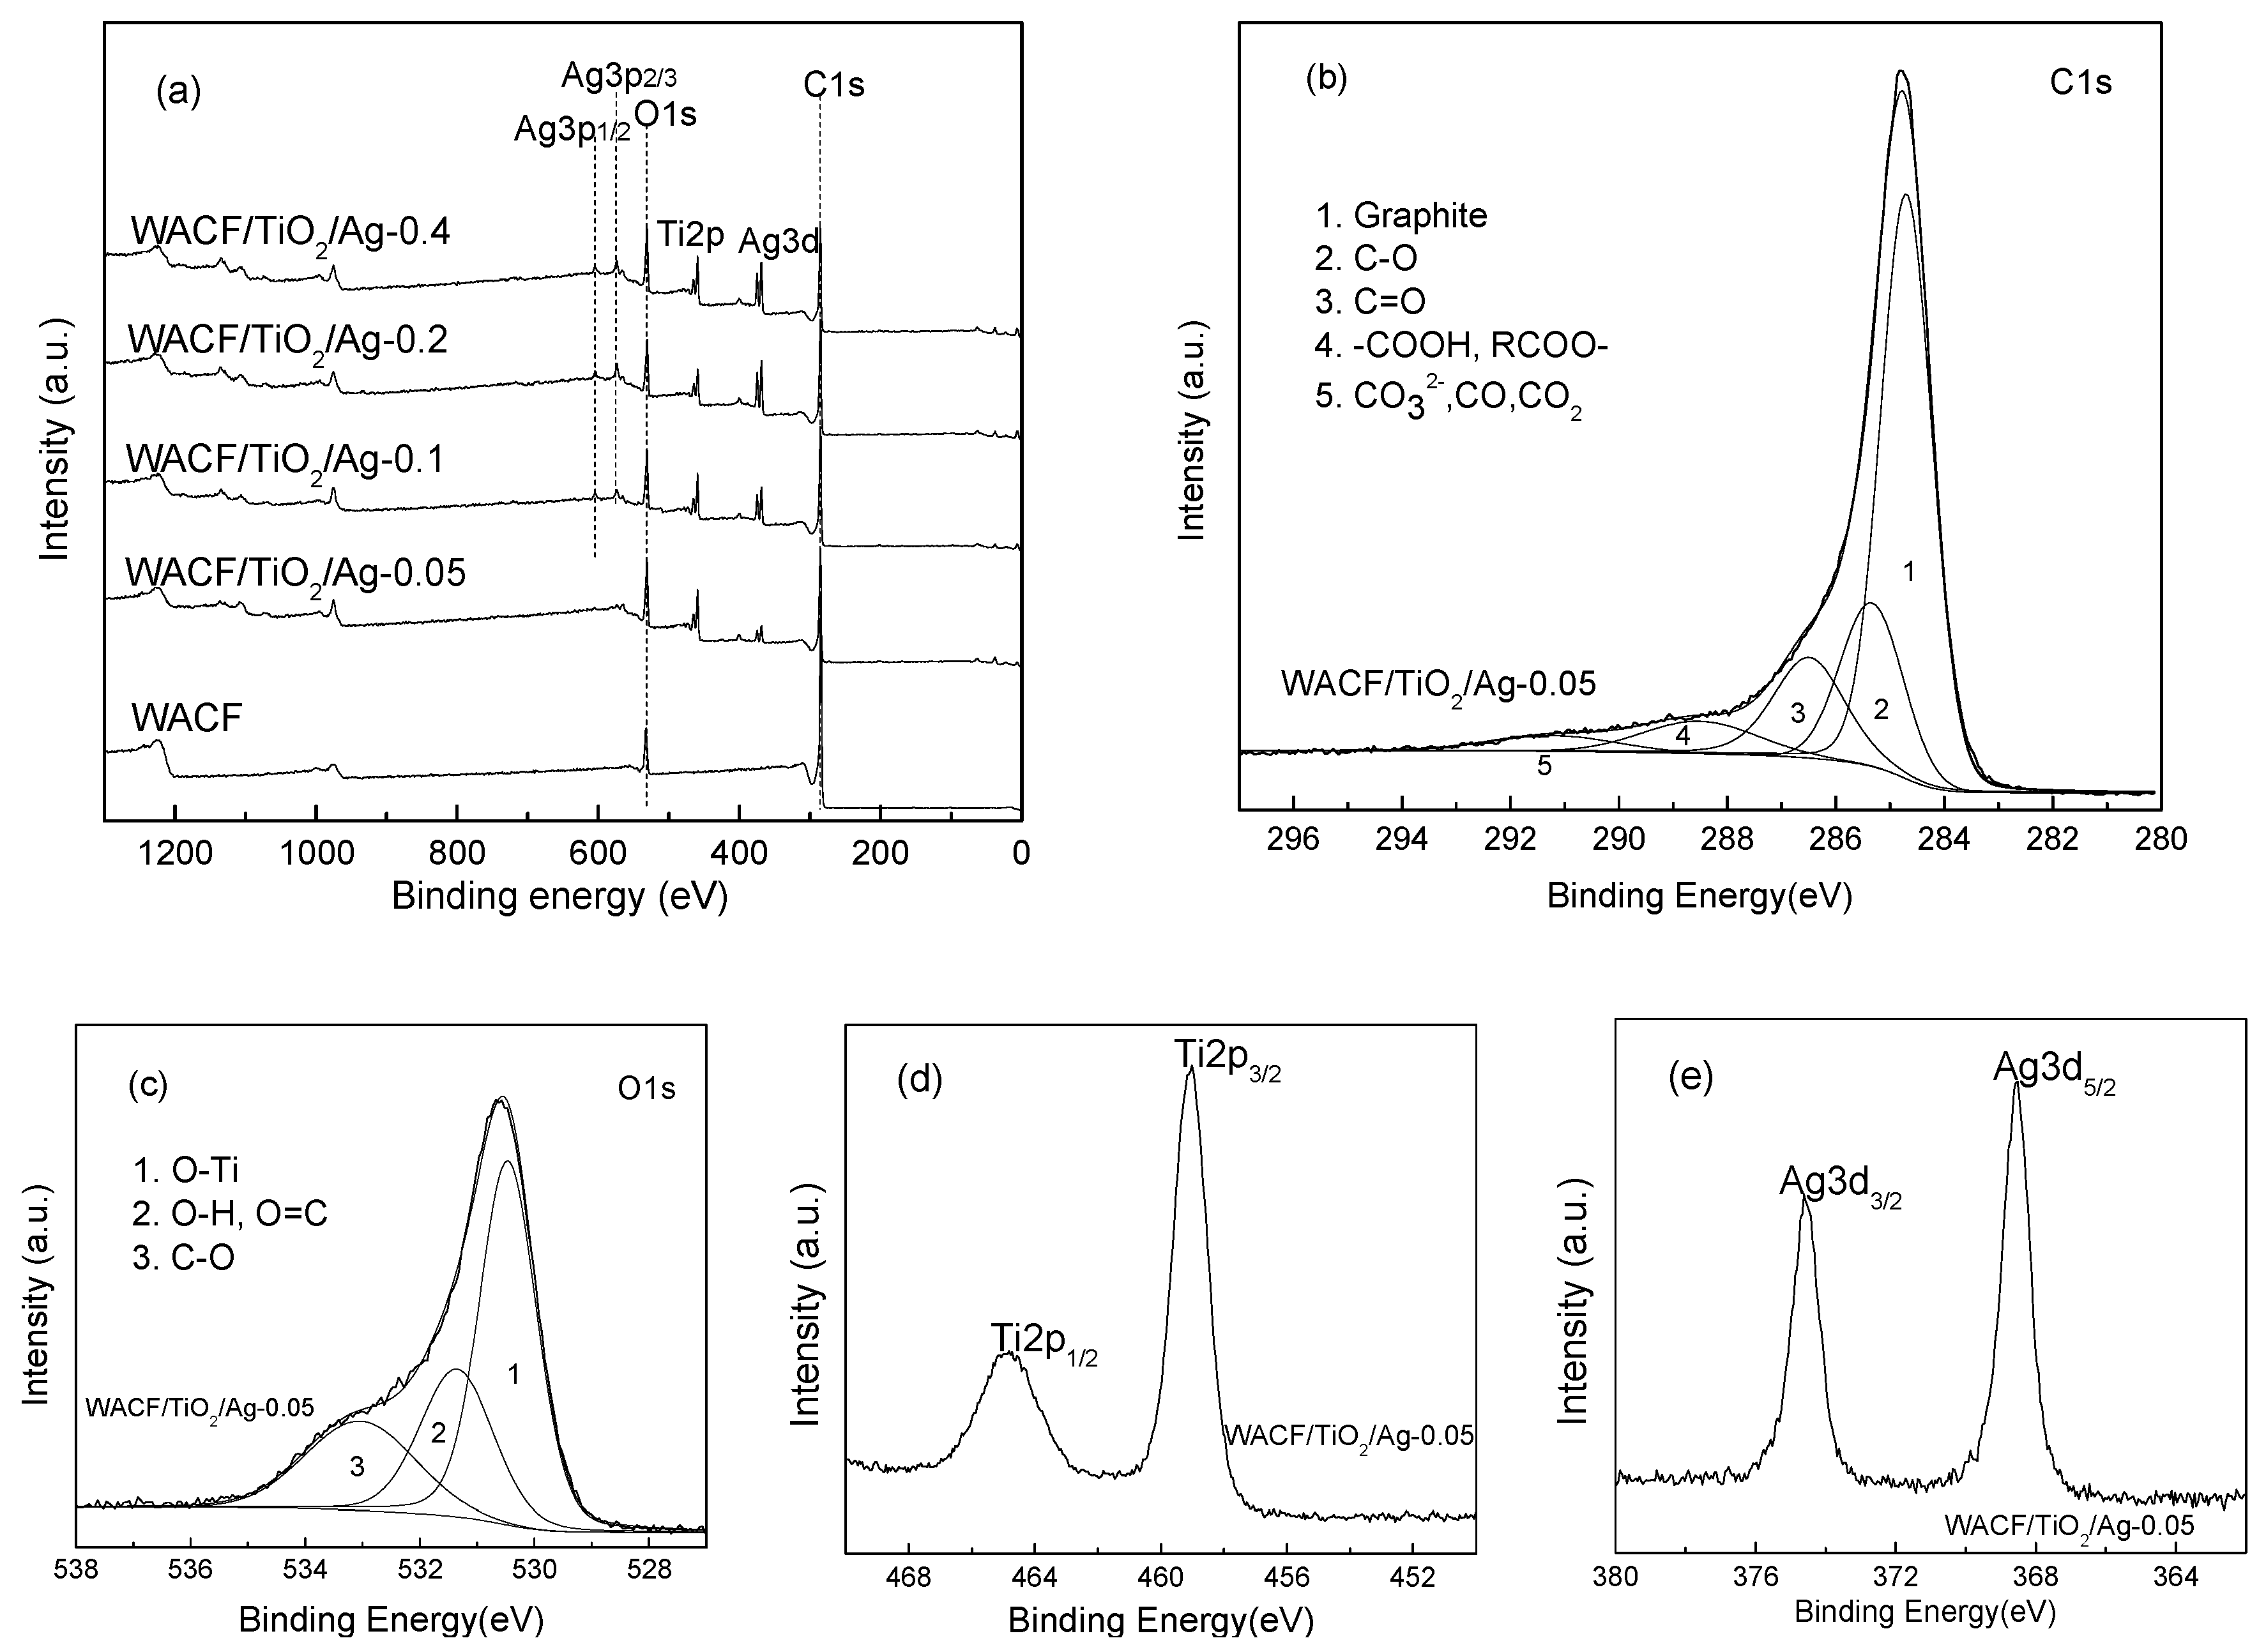
3.3. Surface Chemical Structure
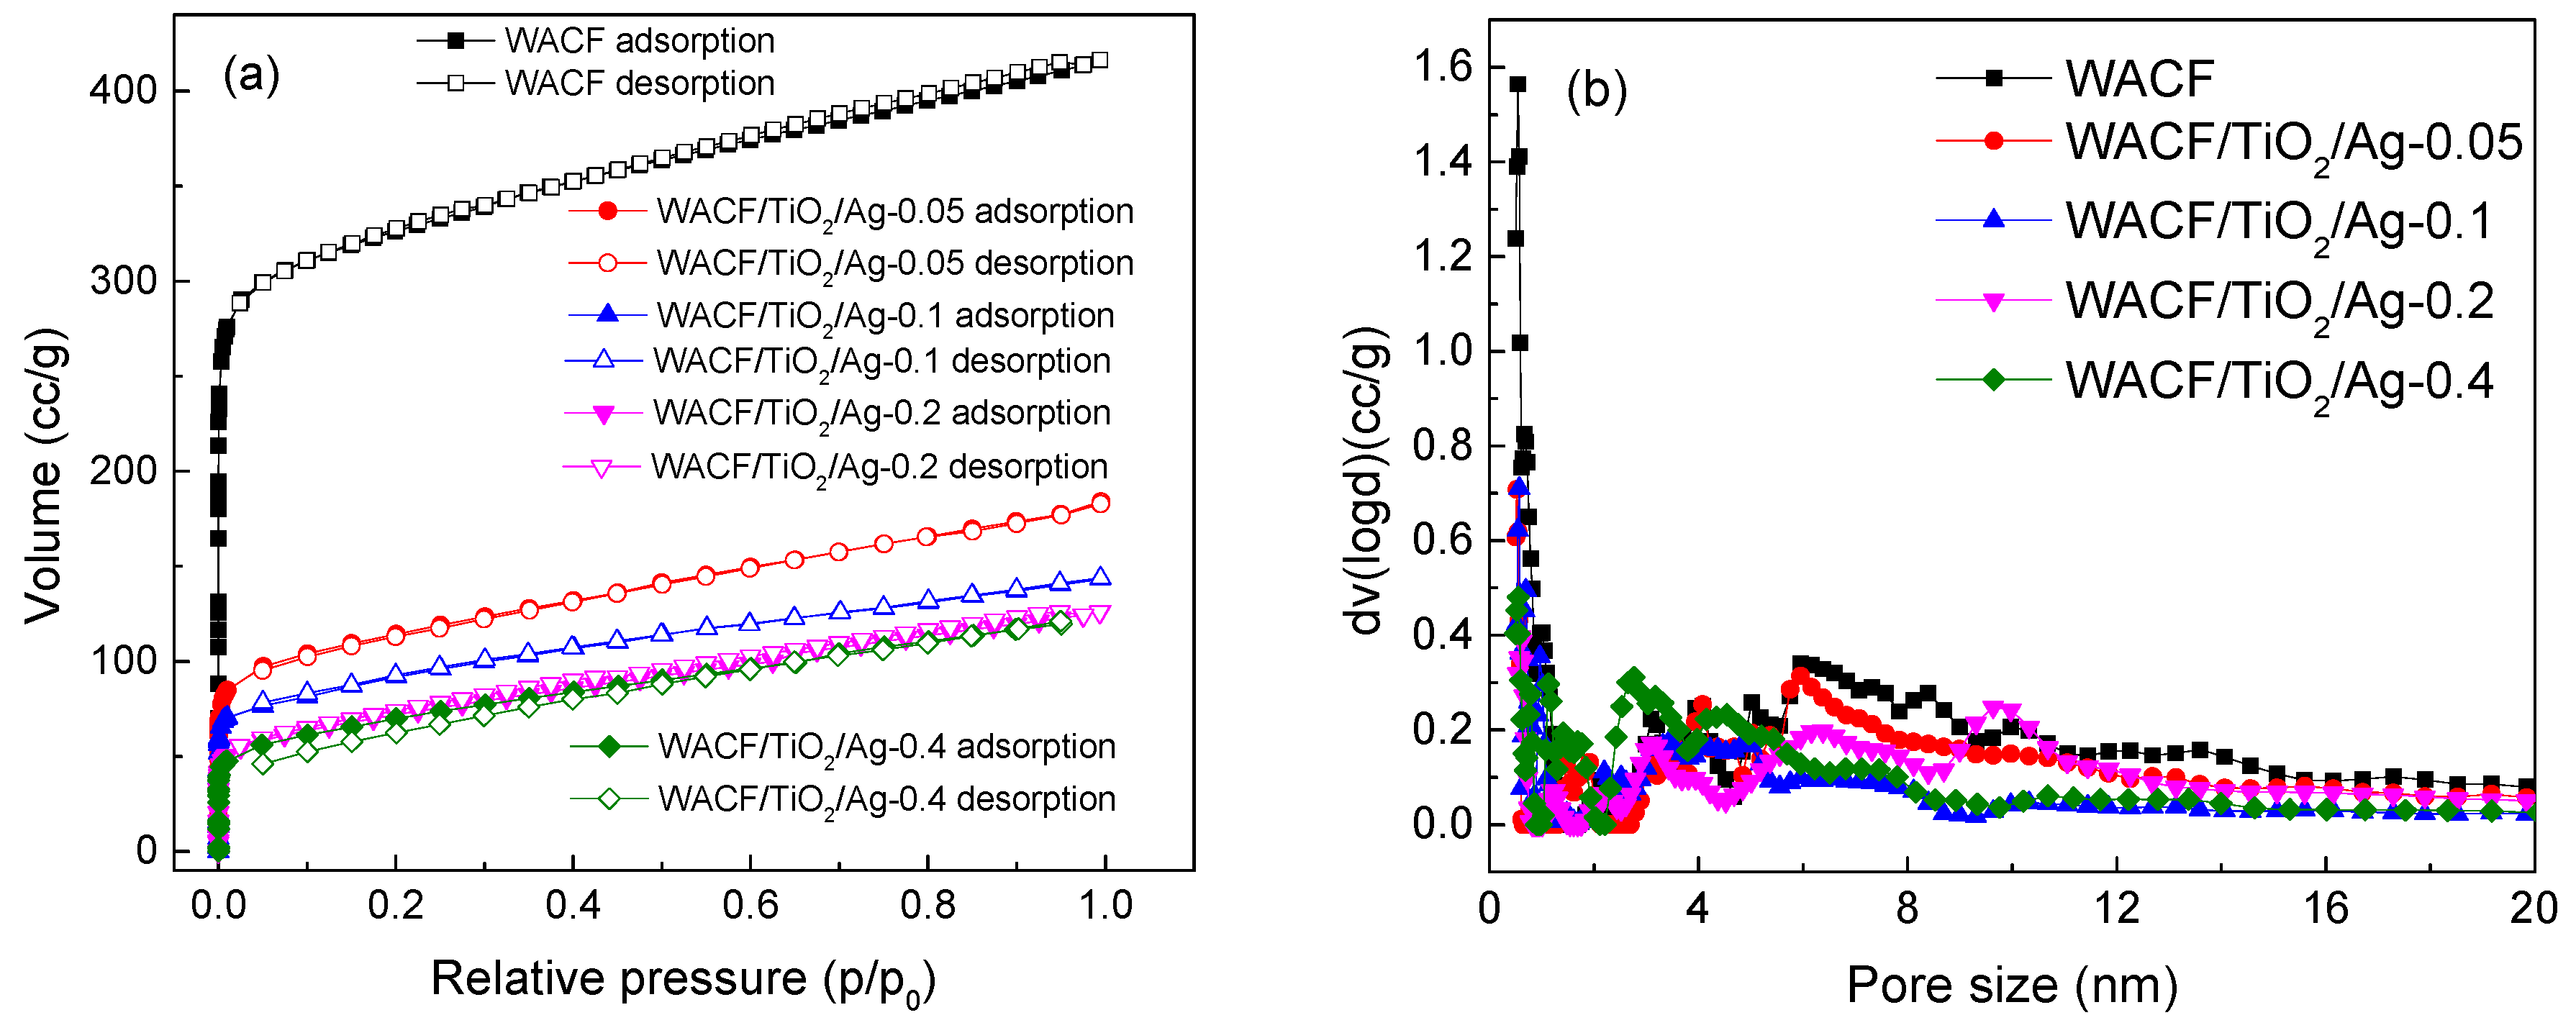
The elemental composition of WACF/TiO2/Ag was analyzed by XPS, and Table 3 shows that the WACF/TiO2/Ag all contain C, O, Ti, Ag, and N elements. Element C was the most abundant constituent of all the samples. Compared with WACF, less C and more O were found in WACF/TiO2/Ag. This is because the TiO2 film contained large amounts of O. Certainly, the addition of new elements (such as Ti and Ag) also caused a decrease in C content. Moreover, the Ag content increased with increasing Sconc, indicating that more Ag was fixed on fibers at higher Sconc.
To obtain information about the surface functional groups of fibers and confirm the valence states of various atoms, measurements of XPS spectra (see Figure 3a) of the C1s, O1s, Ti2p, and Ag3d regions were analyzed. The XPS spectra of these regions were similar, so only WACF/TiO2/Ag-0.05 is shown in Figure 3b–e as an example. As in Figure 3b, the C1s spectra exhibit an asymmetric tailing and can be deconvoluted into five peaks. These are (see Table 2): graphitic carbon (C–C, BE = 284.7 eV); carbon species in phenolic, alcohol, and/or ether groups (C–O, BE = 285.4 eV); carbon in carbonyl groups and/or quinine groups (C=O, BE = 286.5 eV); carbon in carboxyl and/or ester groups (–COOH, RCOO–, BE = 288.7 eV); and carbon in carbonate groups (BE = 291.2 eV) [2]. The graphitic carbon was the predominant component for all the samples. After loading AgNPs and TiO2 films, the content of graphitic carbon decreased, while the contents of C–O and C=O largely increased. This is because a part of graphitic carbon was oxidized during the process of loading AgNPs and TiO2 films. When the fibers were immersed in AgNO3 solution, with the transition from Ag+ to Ag0, the water attacked intermediate radical cation formed at locations to produce C–O where ortho or para dihydroxy groups were present [14]. As the reaction continued, C–O on catechol and hydroquinone were oxidized to generate C=O (see Figure 4). With increasing Sconc, more Ag+ was reduced into Ag0, thus more graphitic carbon was oxidized into C–O. Additionally, the hydroxyl groups on the surface of TiO2, originating from the reaction between adsorbed H2O and TiO2, such as H2O + Ti–O–Ti→2Ti–OH [15], could trap the photogenerated holes (h+) to produce hydroxyl radicals with very strong oxidizing properties. Some graphitic carbon was involved in this oxidization reaction, also leading to the increment of C–O content.
As shown in Figure 3c and Table 3, the spectra of O1s region of WACF/TiO2/Ag were deconvoluted into three peaks: O–Ti bond in the TiO2 lattice (BE = 529.8–530.1 eV); O–H and O=C groups (BE = 530.9–531.5 eV); and O–C groups (BE = 532.2–532.9 eV) [16]. Another three kinds of oxygen functional groups were found on WACF with the peak at 530.9 eV corresponding to the O=C group, the peak at 532.2–532.9 eV corresponding to the O–C group, and the peak at 535.6 eV corresponding to adsorbed O2 or H2O. The disappearance of adsorbed O2 or H2O peak on the surface of WACF/TiO2/Ag was ascribed to the reaction between adsorbed H2O and TiO2 and the blocking of pores. The O–Ti became the main component after loading AgNPs and TiO2 films, while the content of O–C decreased from 71.22% to (21.57–26.09)%. Our previous research reported that the pure TiO2 film only contained small content of O–C (8.4%) [9]. Judging from these results and EDXA analysis, it can be inferred that TiO2 film in some areas of fibers was thin (<XPS detecting depth, 3 nm). Moreover, the content of O–C increased with increasing Sconc, which was in good agreement with the previous result about C1s spectra.
Figure 3d shows the XPS spectrum of Ti2p doublet peaks, the binding energies of Ti2p1/2 and Ti2p3/2 are located at approximately 464.7 eV and 459.0 eV, respectively. The split between the Ti2p1/2 and Ti2p3/2 core levels was 5.7 eV, indicating a normal state of Ti4+ in the anatase TiO2 [17]. This result otherwise proves that Ag atoms did not replace Ti4+ to form lattice defects. It is because Ag atom size (1.26 Å) was larger than Ti atom size (0.67 Å), and it was difficult to fit into the TiO2 lattice [18].
In Figure 3e, the two peaks observed at 373.9 eV and 368.1 eV are according with Ag3d3/2 and Ag 3d5/2, indicating that the AgNPs loaded on the fibers mainly existed in the form of zero-valence [19].

3.4. Pore Structure

Pore structure characterization is important to understand the adsorption property of WACF/TiO2/Ag. Figure 5a shows the N2 adsorption–desorption isotherms of WACF and WACF/TiO2/Ag. The N2 adsorption increased sharply at a low relative pressure (p/p0 < 0.1) and then gradually rose with increasing relative pressure at p/p0 > 0.1. The results express the coexistence of micropores and mesopores in the samples [20]. Compared with WACF, the N2 adsorption of WACF/TiO2/Ag drastically reduced. The detailed pore structure parameters are presented in Table 4. Ag and TiO2 loading blocked numerous pores of WACF, leading to a decrease in specific surface area (S) and pore volume (V). As Sconc increased from 0.05 mol/L to 0.2 mol/L, S and V reduced sharply. However, only a slight decrease in S and V was observable when Sconc continued to rise. This is because the AgNP size became larger at higher Sconc, which led to a decrease in adhesion force between AgNPs and fibers. Therefore, some larger AgNPs fell off from the fibers, and the Ag content showed a slight rise in the course of Sconc increment from 0.2 to 0.4 mol/L. This interpretation was also verified by FESEM images and elemental composition analysis. The comparison of micropores and mesopores shows that the decrease ratio of micropores was obviously higher than that of mesopores with increasing Sconc. This result indicates that AgNPs was preferred to fill the micropores. The quoted researches demonstrate that the adsorbability of micropores to AgNPs was larger than that of mesopores [19]. Therefore, the AgNPs in mesopores could escape from the pores to the surface of the fiber and combine with other AgNPs on the surface to form large AgNPs.
The pore size distribution of WACF/TiO2/Ag is shown in Figure 5b. The loading of AgNPs and TiO2 film led to a decrease in micropore and mesopore volume. The decrease in micropore volume mainly occurred in the range of 0.5–1 nm. As Sconc increased, the size of blocked mesopores was increased owing to the increasing AgNPs.

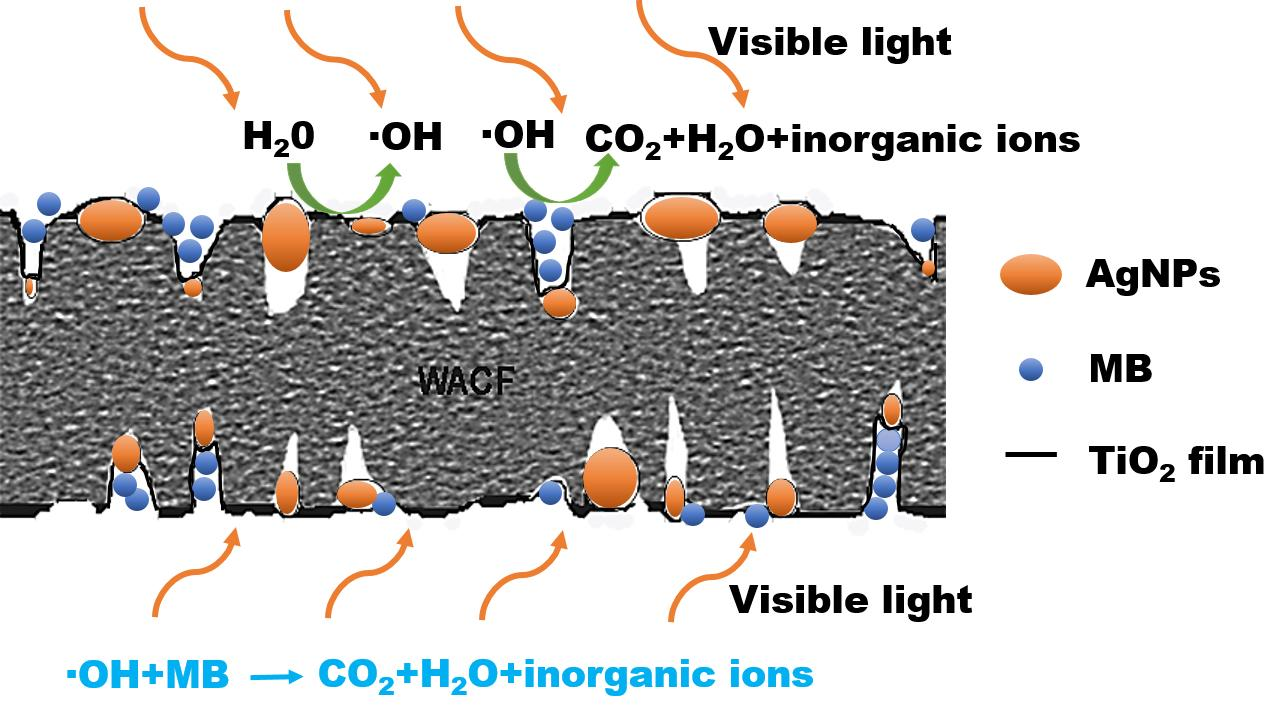
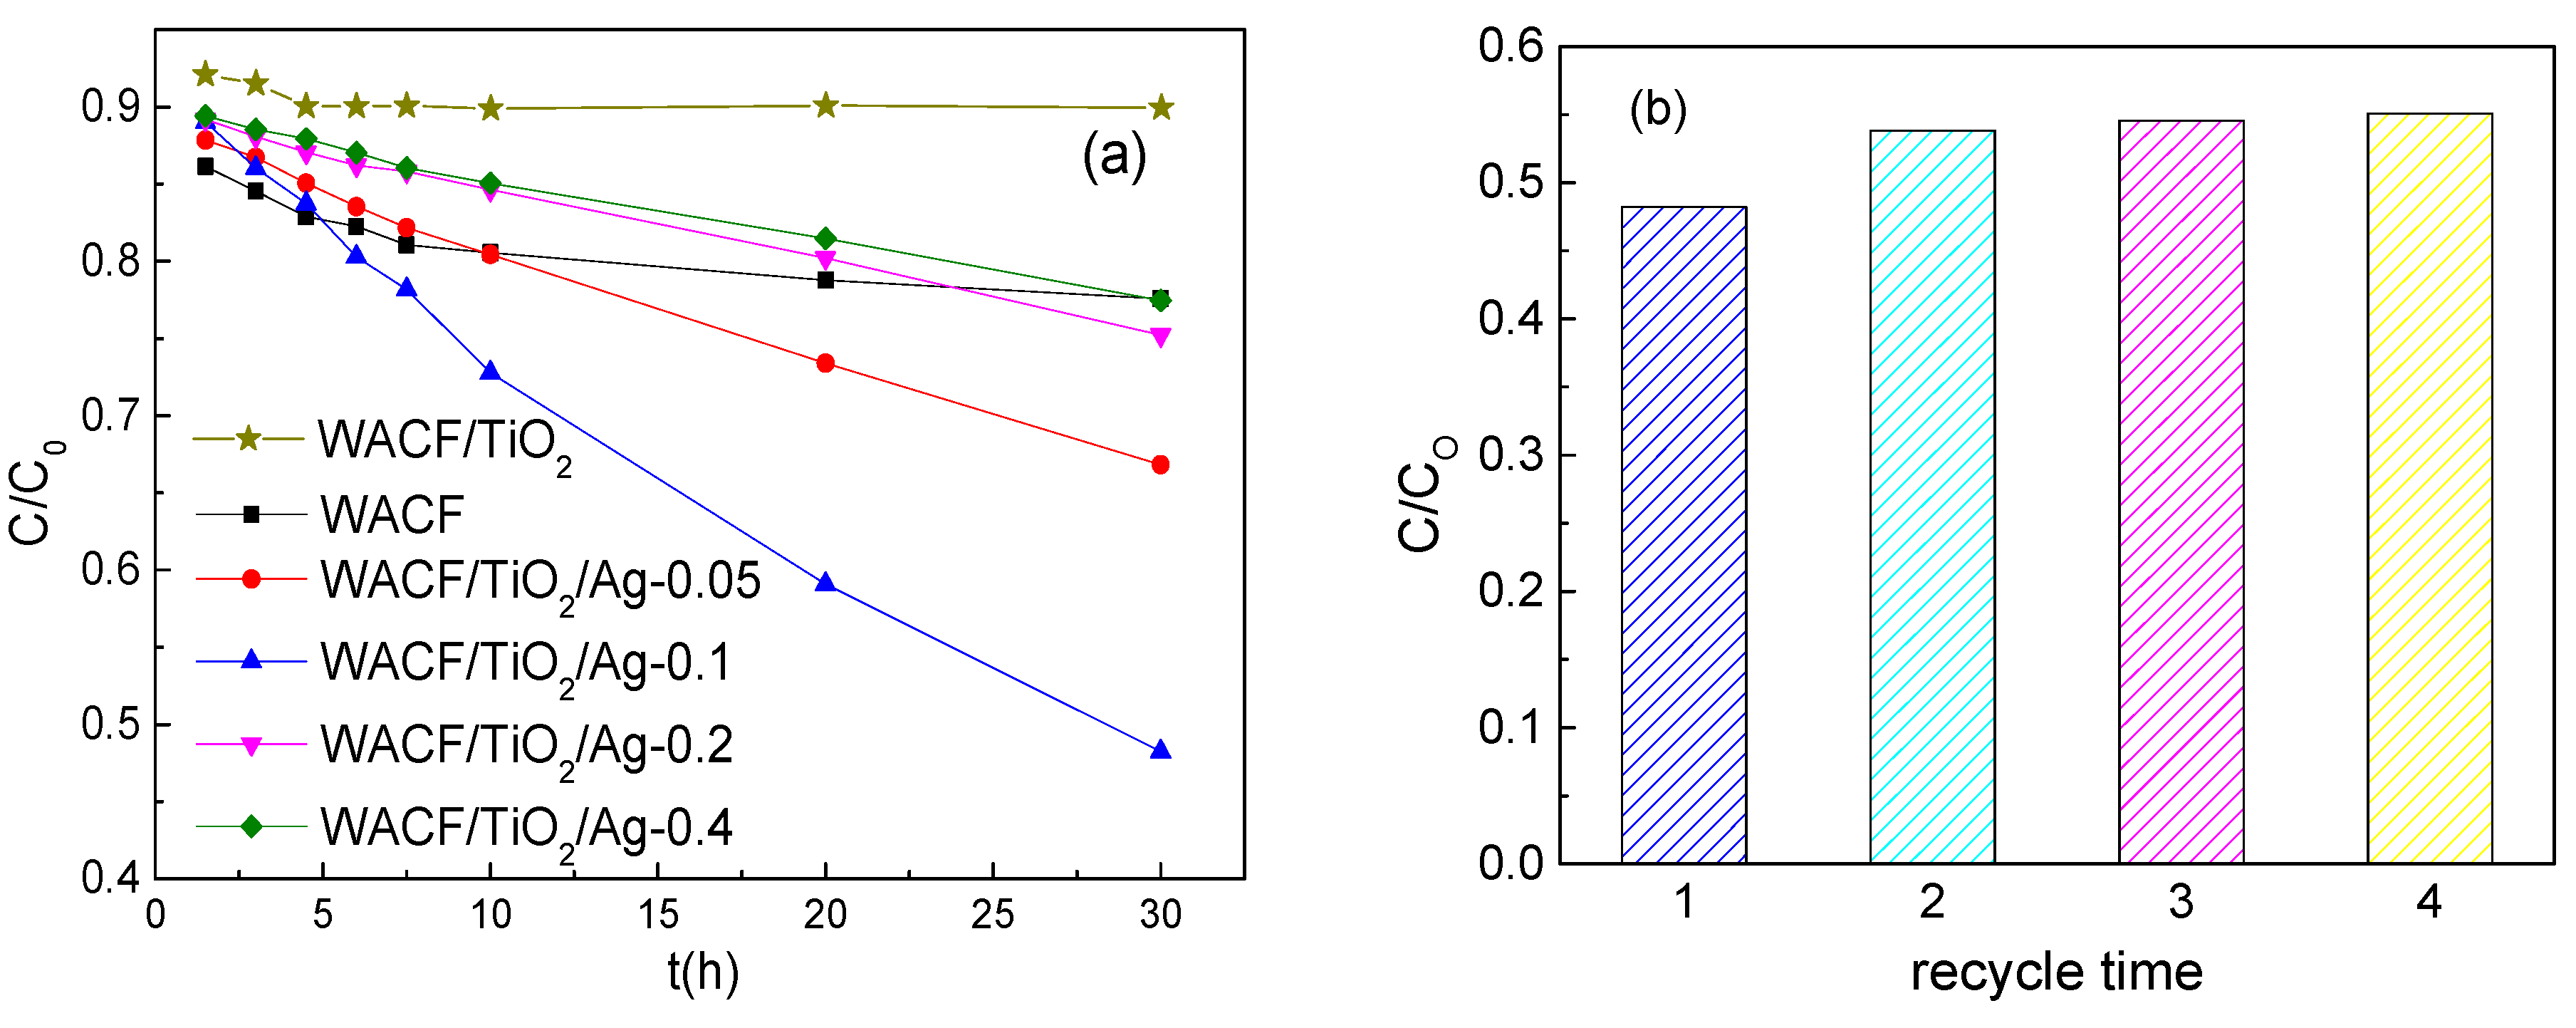
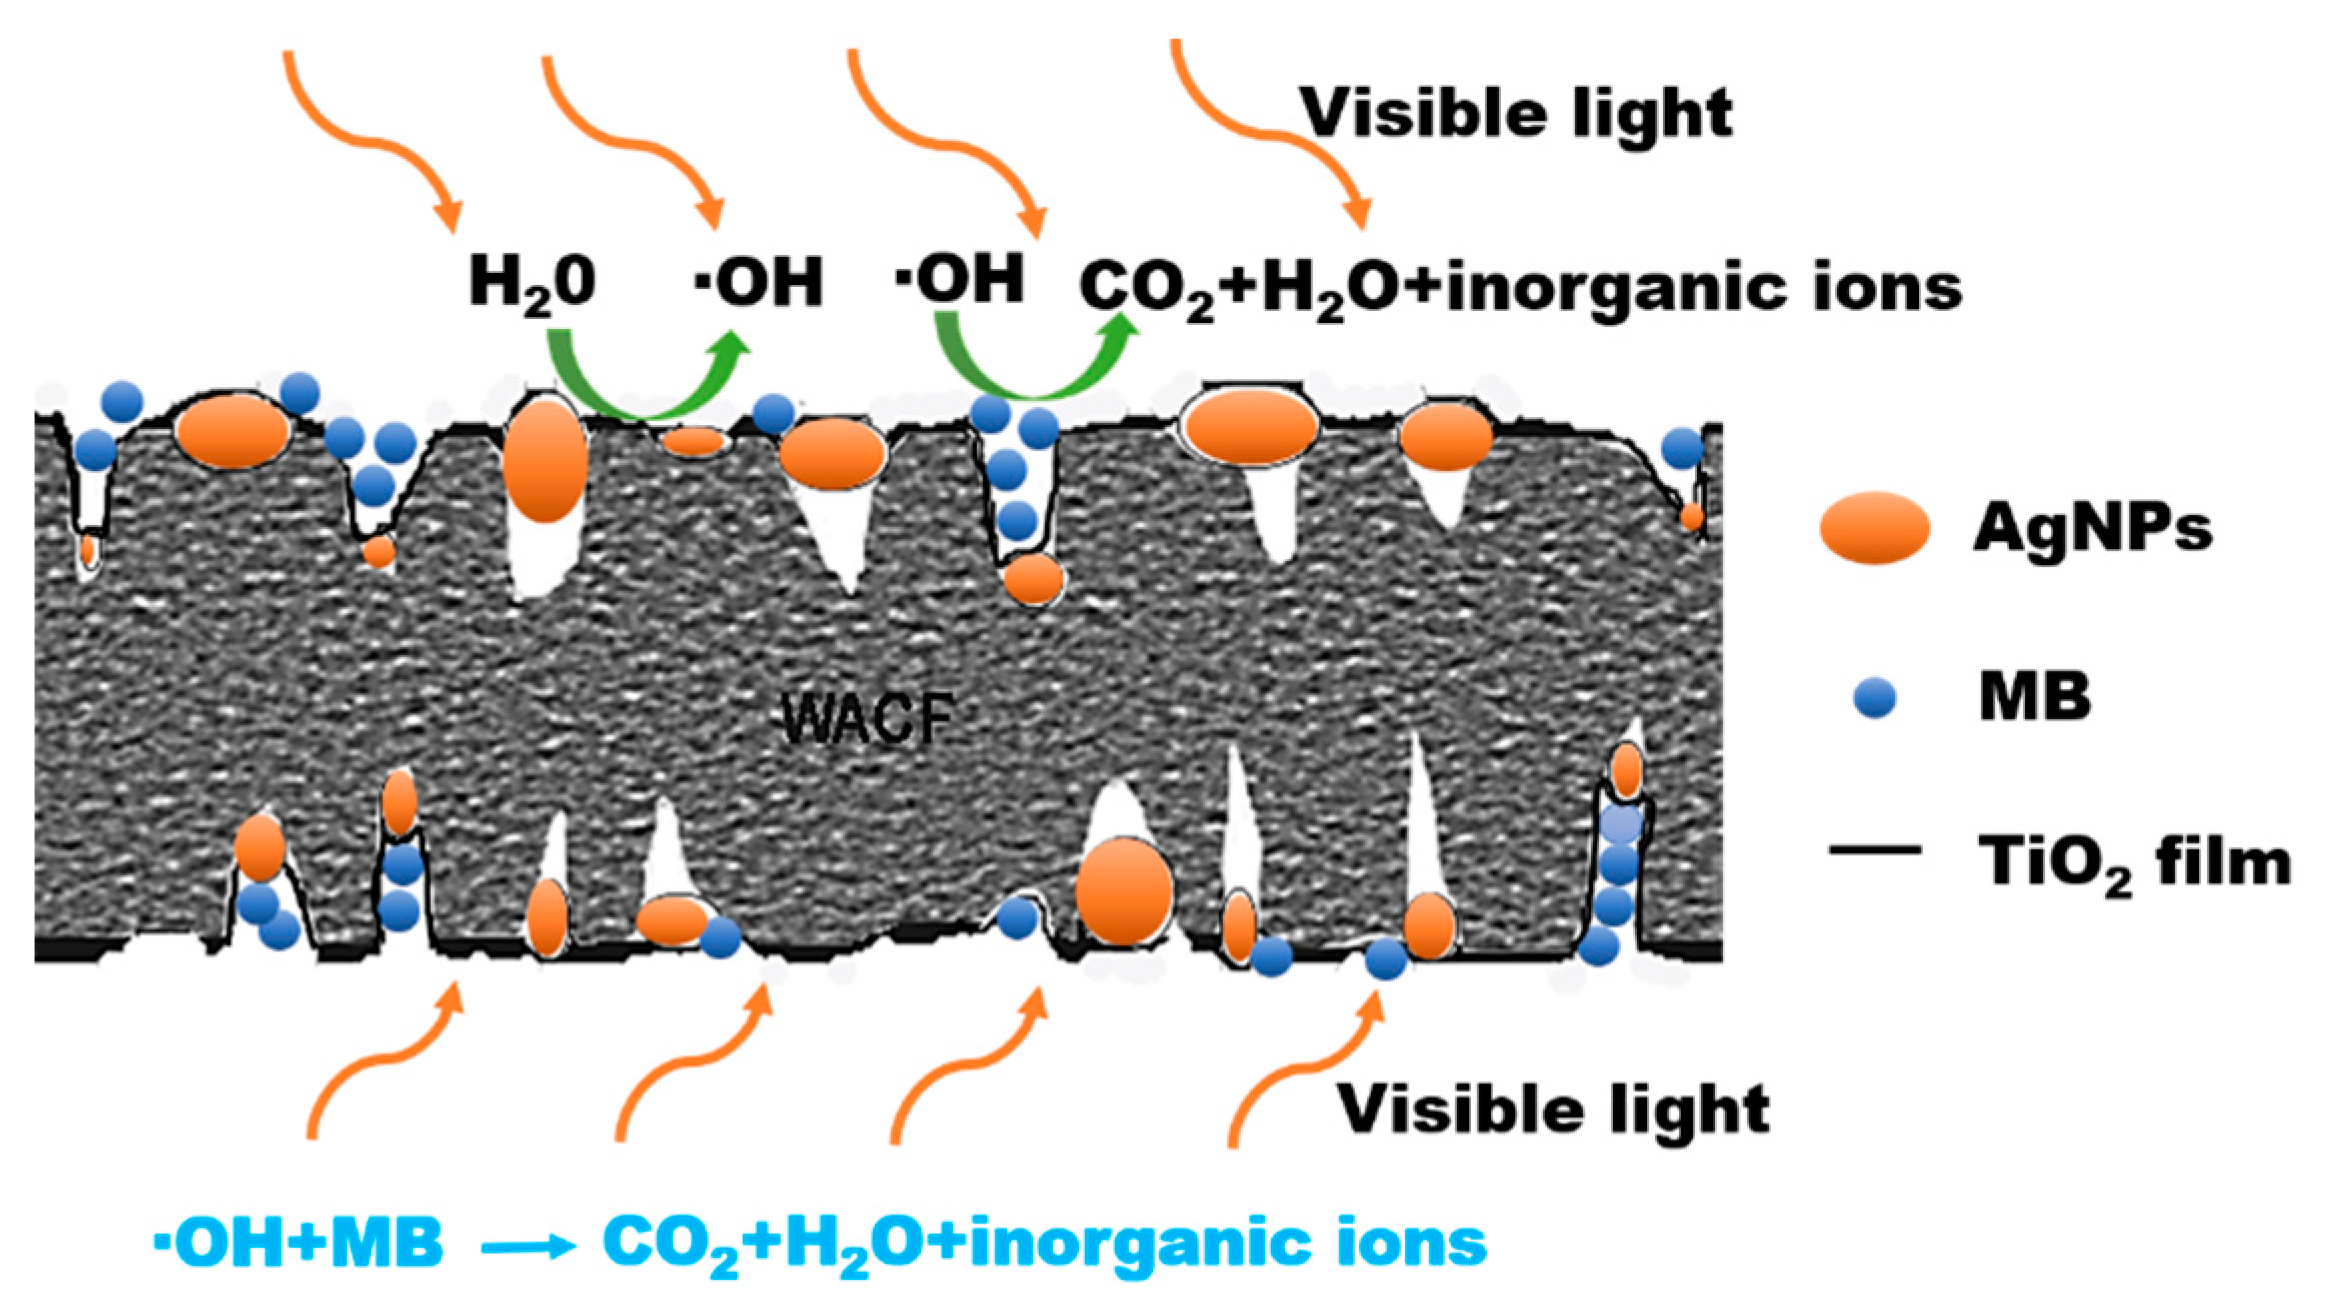
3.5. Self-Regeneration Performance

Figure 6a illustrates the MB removal effects of WACF, WACF/TiO2, and WACF/TiO2/Ag under the visible light irradiation. In the initial stage of contact (0–5 h), about 20% MB was removed by WACF due to their abundant pores. As time prolonged, the pores of WACF were blocked by MB, and their adsorption capacity nearly reached saturation. In comparison, WACF/TiO2/Ag kept the removal effect on MB during the whole process of the experiment, which demonstrates that WACF/Ag/TiO2 had the self-regeneration performance under the visible light irradiation. As Ag content increased, the self-regeneration performance of WACF/TiO2/Ag increased initially and then decreased. The samples prepared by 0.1 mol/L AgNO3 solution represented the best self-regeneration performance. The self-regeneration performance of WACF/TiO2/Ag was determined by the synergistic effects of two factors: adsorption and photodegradation [21]. The developed pore structure of WACF/TiO2/Ag could increase the MB concentration of TiO2 surrounding and facilitate MB photodegradation. Meanwhile, the MB photodegradation would release the blocked pores and then realize the WACF self-regeneration. The probable self-regeneration mechanism of WACF/TiO2/Ag is described in Figure 7. It is well known that pure TiO2 can be photoexcited only under the UV irradiation. The AgNPs loading enlarged the photoresponse region and enhanced the photocatalytic activity of TiO2. AgNPs exhibited a surface plasmonic resonance effect, which produced a strong and broad absorption in the visible light region. In addition, more photogenerated electrons were generated after AgNPs loading, and the recombination of the photogenerated electrons and holes was inhibited, both of which enhanced the photocatalytic activity of TiO2 [22]. The AgNPs content influenced the photocatalytic activity of TiO2. When the AgNPs content was insufficient, there were not enough reaction sites for enhancing the photocatalytic activity of TiO2. However, the excess AgNPs might act as a recombination center and decrease the efficiency of charge separation. The results of pore structure, surface morphology, and surface chemical composition analysis indicated that WACF/TiO2/Ag-0.1 had developed pore structure and suitable AgNPs content compared with other samples. Thus, WACF/TiO2/Ag-0.1 showed the best self-regeneration performance. It is remarkable that only about 10% MB was removed by WACF/TiO2, even lower than that removed by WACF. This is because WACF/TiO2 had fewer pores compared with WACF [9], and little photocatalytic degradation occurred for WACF/TiO2 with visible light irradiation.
In order to determine the self-regeneration durability of samples, WACF/TiO2/Ag-0.1 was used repeatedly for MB removal. Figure 6b shows only a slight decrease in MB removal (<10%) after the fourth trial. It means that both AgNPs and TiO2 films attached to fibers firmly.

4. Conclusions

WACF with self-regeneration performance was successfully prepared by loading AgNPs and TiO2 films on their surface. AgNPs were homogeneously immobilized on WACF and coated by TiO2 films. This structure effectively avoided AgNPs agglomeration and exfoliation. With increasing Sconc, AgNPs size and content increased, while the pore volume of fibers reduced. However, when Sconc rose from 0.2 mol/L to 0.4 mol/L, only slight variations in AgNPs content and pore structure were observable. The samples prepared by 0.1 mol/L AgNO3 solution showed the best self-regeneration performance. The abundant pores of WACF/TiO2/Ag-0.1 increased the MB concentration of TiO2 surrounding and facilitated MB photodegradation. Meanwhile, their suitable Ag content enhanced the MB photodegradation. Moreover, the results of cyclic trials demonstrated that WACF/TiO2/Ag-0.1 had excellent self-regeneration durability.

Author Contributions

Investigation and writing, W.L.; review and editing; H.W.; funding acquisition, M.Z. and Z.G.

Funding

This research received no external funding.

Acknowledgments

This research is supported by University of Young Scientific and Technological Backbone (2017XQG-1), Natural Science Foundation of Inner Mongolia Autonomous Region (2016BS0306), and National Natural Science Foundation of China (31860185 and 51602162).

Conflicts of Interest

The authors declare no conflict of interest.

References

  1. Ledesma, B.; Román, S.; Sabio, E.; Álvarez-Murillo, A. Improvement of spent activated carbon regeneration by wet oxidation processe. J. Supercrit. Fluid. 2015, 104, 94–103. [Google Scholar] [CrossRef]
  2. Liu, W.; Zhao, G. Effect of temperature and time on microstructure and surface functional groups of activated carbon fibers prepared from liquefied wood. BioResources 2012, 7, 5552–5567. [Google Scholar] [CrossRef]
  3. Zanella, O.; Tessaro, I.C.; Féris, L.A. Desorption- and Decomposition-Based Techniques for the Regeneration of Activated Carbon. Chem. Eng. Technol. 2014, 37, 1447–1459. [Google Scholar] [CrossRef]
  4. Yap, P.; Lim, T. Solar regeneration of powdered activated carbon impregnated with visible-light responsive photocatalyst: Factors affecting performances and predictive model. Water Res. 2012, 46, 3054–3064. [Google Scholar] [CrossRef] [PubMed]
  5. Liu, H.; Deng, L.; Sun, C.; Li, J.; Zhu, Z. Titanium dioxide encapsulation of supported Ag nanoparticles on the porous silica bead for increased photocatalytic activity. Appl. Surf. Sci. 2015, 326, 82–90. [Google Scholar] [CrossRef]
  6. Ma, X.; Chen, Y. Preparation and Characterization of Mn/N Co-Doped TiO2 Loaded on Wood-Based Activated Carbon Fiber and Its Visible Light Photodegradation. Polymers 2015, 7, 1660–1673. [Google Scholar] [CrossRef] [Green Version]
  7. Weng, Y.; Wang, Y.; Asbury, J.; Ghosh, H.; Lian, T. Back Electron Transfer from TiO2 Nanoparticles to FeIII(CN)63-: Origin of Non-Single-Exponential and Particle Size Independent Dynamics. J. Phys. Chem. B 2000, 104, 92–104. [Google Scholar] [CrossRef]
  8. Liu, C.; Li, Y.; Xu, P.; Li, M.; Zeng, M. Controlled synthesis of ordered mesoporous TiO2-supported on activated carbon and pore-pore synergistic photocatalytic performance. Mater. Chem. Phys 2015, 149–150, 69–76. [Google Scholar] [CrossRef]
  9. Liu, W.; Zhao, G. Effect of TiO2 content on the microstructure and antibacterial activity of TiO2-loaded activated carbon fibers derived from liquefied wood. Surf. Interface Anal. 2015, 47, 931–937. [Google Scholar] [CrossRef]
  10. Shi, J. Preparation of Fe(III) and Ho(III) co-doped TiO2 films loaded on activated carbon fibers and their photocatalytic activities. Chem. Eng. J. 2009, 151, 241–246. [Google Scholar] [CrossRef]
  11. Ao, Y.; Xu, J.; Gao, Y.; Wang, P.; Wang, C.; Hou, J.; Qian, J. Preparation of Ag nanoparticles loaded TiO2 nanoplate arrays on activated carbon fibers with enhanced photocatalytic activity. Catal. Commun. 2014, 53, 21–24. [Google Scholar] [CrossRef]
  12. Li, M.; Lu, B.; Ke, Q.; Guo, Y.; Guo, Y. Synergetic effect between adsorption and photodegradation on nanostructured TiO2/activated carbon fiber felt porous composites for toluene removal. J. Hazard. Mater. 2017, 333, 88–98. [Google Scholar] [CrossRef] [PubMed]
  13. Liu, W.; Wang, X.; Zhang, M. Preparation of highly mesoporous wood-derived activated carbon fiber and the mechanism of its porosity development. Holzforschung 2017, 71, 363–371. [Google Scholar] [CrossRef]
  14. Yue, Z.; Jiang, W.; Wang, L.; Toghiani, H.; Gardner, S.; Pittman, C.U., Jr. Adsorption of precious metal ions onto electrochemically oxidized carbon fibers. Carbon 1999, 37, 1607–1618. [Google Scholar] [CrossRef]
  15. Su, C.; Hong, B.; Tseng, C. Sol-gel preparation and photocatalysis of titanium dioxide. Catal. Today 2004, 96, 119–126. [Google Scholar] [CrossRef]
  16. Shi, J.; Cui, H.; Chen, J.; Fu, M.; Xu, B.; Luo, H.; Ye, Z. TiO2/activated carbon fibers photocatalyst: Effects of coating procedures on the microstructure, adhesion property, and photocatalytic ability. J. Colloid Interf. Sci. 2012, 388, 201–208. [Google Scholar] [CrossRef] [PubMed]
  17. Bhosale, R.R.; Pujari, S.R.; Lande, M.K.; Arbad, B.R.; Pawar, S.B.; Gambhire, A.B. Photocatalytic activity and characterization of sol-gel-derived Ni-doped TiO2-coated active carbon composites. Appl. Surf. Sci. 2012, 261, 835–841. [Google Scholar] [CrossRef]
  18. Jose, M.; Kumari, M.; Karunakaran, R.; Shukla, S. Hydrothermal synthesis of highly crystalline nanotubes/nanoplates of pure and silver-doped anatase-titania using acid-catalyst-modified sol-gel precursors. J. Sol-Gel Sci. Technol. 2015, 73, 38–47. [Google Scholar] [CrossRef]
  19. Liu, W.; Ma, E.; Zhao, G. Characterization of Silver Particles in Silver-Containing Activated Carbon Fibers Prepared from Liquefied Wood. J. Wood Chem. Technol. 2015, 35, 291–301. [Google Scholar] [CrossRef]
  20. Liu, W.; Shi, M.; Ma, E.; Zhao, G. Microstructure and properties of liquefied wood-based activated carbon fibers prepared from precursors and carbon fibers. Wood Fiber Sci. 2014, 46, 39–47. [Google Scholar]
  21. Matos, J.; Hofman, M.; Pietrzak, R. Synergy effect in the photocatalytic degradation of methylene blue on a suspended mixture of TiO2 and N-containing carbons. Carbon 2013, 54, 460–471. [Google Scholar] [CrossRef]
  22. Jiang, Z.; Wei, W.; Mao, D.; Chen, C.; Shi, Y.; Lv, X. Silver-loaded nitrogen-doped yolk–shell mesoporous TiO2 hollow microspheres with enhanced visible light photocatalytic activity. Nanoscale 2014, 7, 784–797. [Google Scholar] [CrossRef] [PubMed]
Figure 1. Field emission scanning electron microscope (FESEM) images of WACF/TiO2/Ag (Ag-containing wood-based activated carbon fibers coated by TiO2 film): (a) WACF/TiO2/Ag-0.05; (b) WACF/TiO2/Ag-0.1; (c) WACF/TiO2/Ag-0.2; (d) WACF/TiO2/Ag-0.4.
Polymers 11 00983 g001
Figure 2. XRD patterns of WACF/TiO2/Ag and WACF.
Polymers 11 00983 g002
Figure 3. (a) X-ray photoelectron spectrometer (XPS) spectra of WACF/TiO2/Ag and WACF; (be) high resolution XPS spectra of the C1s, O1s, Ti2p, and Ag3d regions taken on WACF/TiO2/Ag-0.05.
Polymers 11 00983 g003
Figure 4. The principal pathway of chemical reaction between Ag+ and WACF.
Polymers 11 00983 g004
Figure 5. (a) N2 adsorption–desorption isotherms of WACF/TiO2/Ag and WACF; (b) Pore size distribution of WACF/TiO2/Ag and WACF.
Polymers 11 00983 g005
Figure 6. (a) Methylene blue (MB) removal effects of WACF/TiO2/Ag, WACF/TiO2, and WACF; (b) MB removal effects of WACF/TiO2/Ag-0.1 undergoing cyclic trials.
Polymers 11 00983 g006
Figure 7. Schematic illustrations of self-regeneration mechanism of WACF/TiO2/Ag.
Polymers 11 00983 g007
Table 1. The content of elemental constituents (at %) in the selected areas (see Figure 1) detected by energy dispersive X-ray analyzer (EDXA).
Selected AreaCOTiAgN
126.1710.392.9256.154.36
273.9221.353.910.820.00
391.165.771.081.990.00
Table 2. The average crystal size of Ag in WACF/TiO2/Ag.
Sample2θ (°)β (°)D (nm)
WACF/TiO2/Ag-0.0538.180.3523.81
WACF/TiO2/Ag-0.138.200.3523.82
WACF/TiO2/Ag-0.238.160.3226.04
WACF/TiO2/Ag-0.438.200.3027.78
Table 3. Surface elemental composition (at %) and results in the fitting of C1s and O1s regions.
SampleContent of the Element (at %)C1s (%)O1s (%)
C1sO1sTi2pAg3dN1sGraphiteC–OC=O–COOH, RCOO–CO32-, CO, CO2O–TiO–H, O=CO–CO2, H2O
WACF90.798.89000.3264.1114.899.885.915.21020.0571.228.72
WACF/TiO2/Ag-0.0570.9618.616.380.703.3656.8318.4914.556.643.4953.3425.0921.570
WACF/TiO2/Ag-0.173.2116.235.911.613.0456.3119.2112.886.724.8752.6125.2622.130
WACF/TiO2/Ag-0.273.1116.015.202.263.4251.8224.0214.045.584.5251.9724.6923.330
WACF/TiO2/Ag-0.469.4618.186.522.303.5449.9224.6814.135.375.8946.3627.5526.090
Table 4. Specific surface area (m2/g) and pore volume (cm3/g) of WACF and WACF/TiO2/Ag.
SampleTotal PoresMicroporesMesopores
SBETVtotalSmicroVmicroSmesoVmeso
WACF12500.6449680.3841860.207
WACF/TiO2/Ag-0.054110.2852130.0911430.162
WACF/TiO2/Ag-0.13420.2022050.087980.091
WACF/TiO2/Ag-0.22540.1951050.0481110.122
WACF/TiO2/Ag-0.42450.185960.0441040.119

