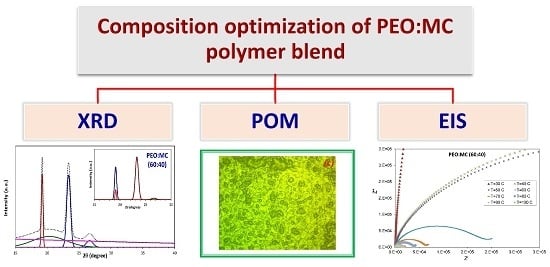
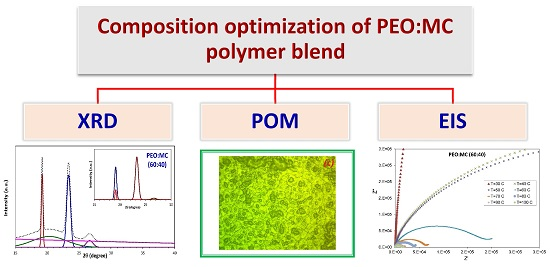
Preparation and Composition Optimization of PEO:MC Polymer Blend Films to Enhance Electrical Conductivity


Abstract
1. Introduction
2. Experimental Details
2.1. Sample Preparation
2.2. Sample Characterization
3. Results and Discussion
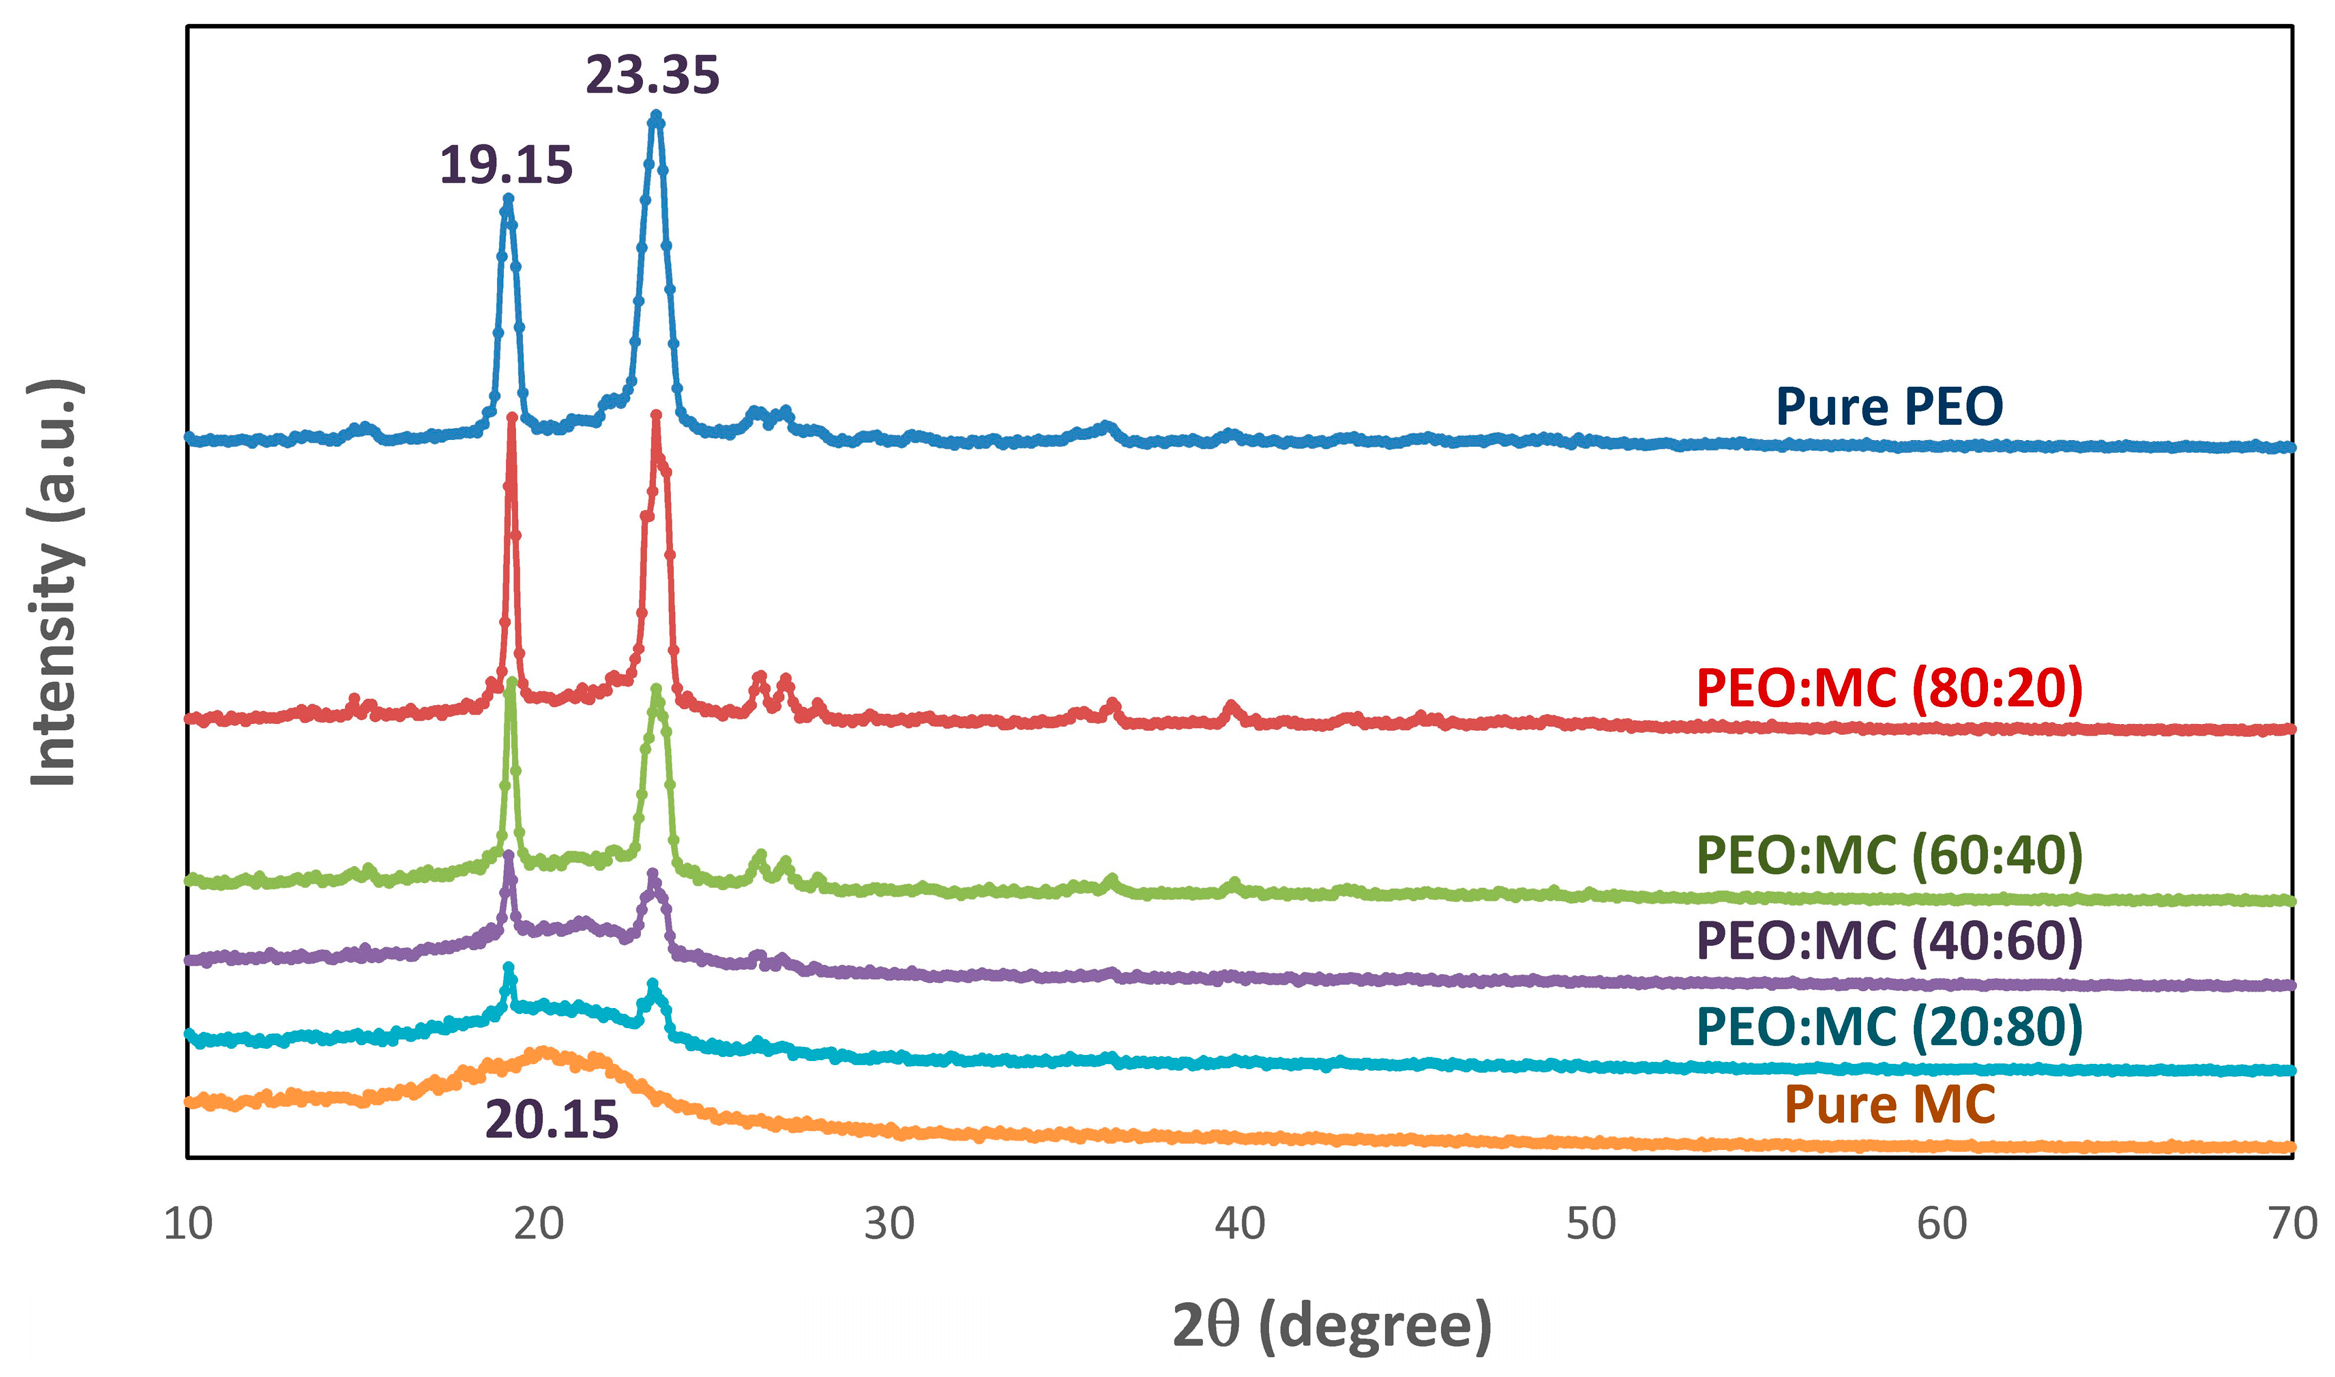
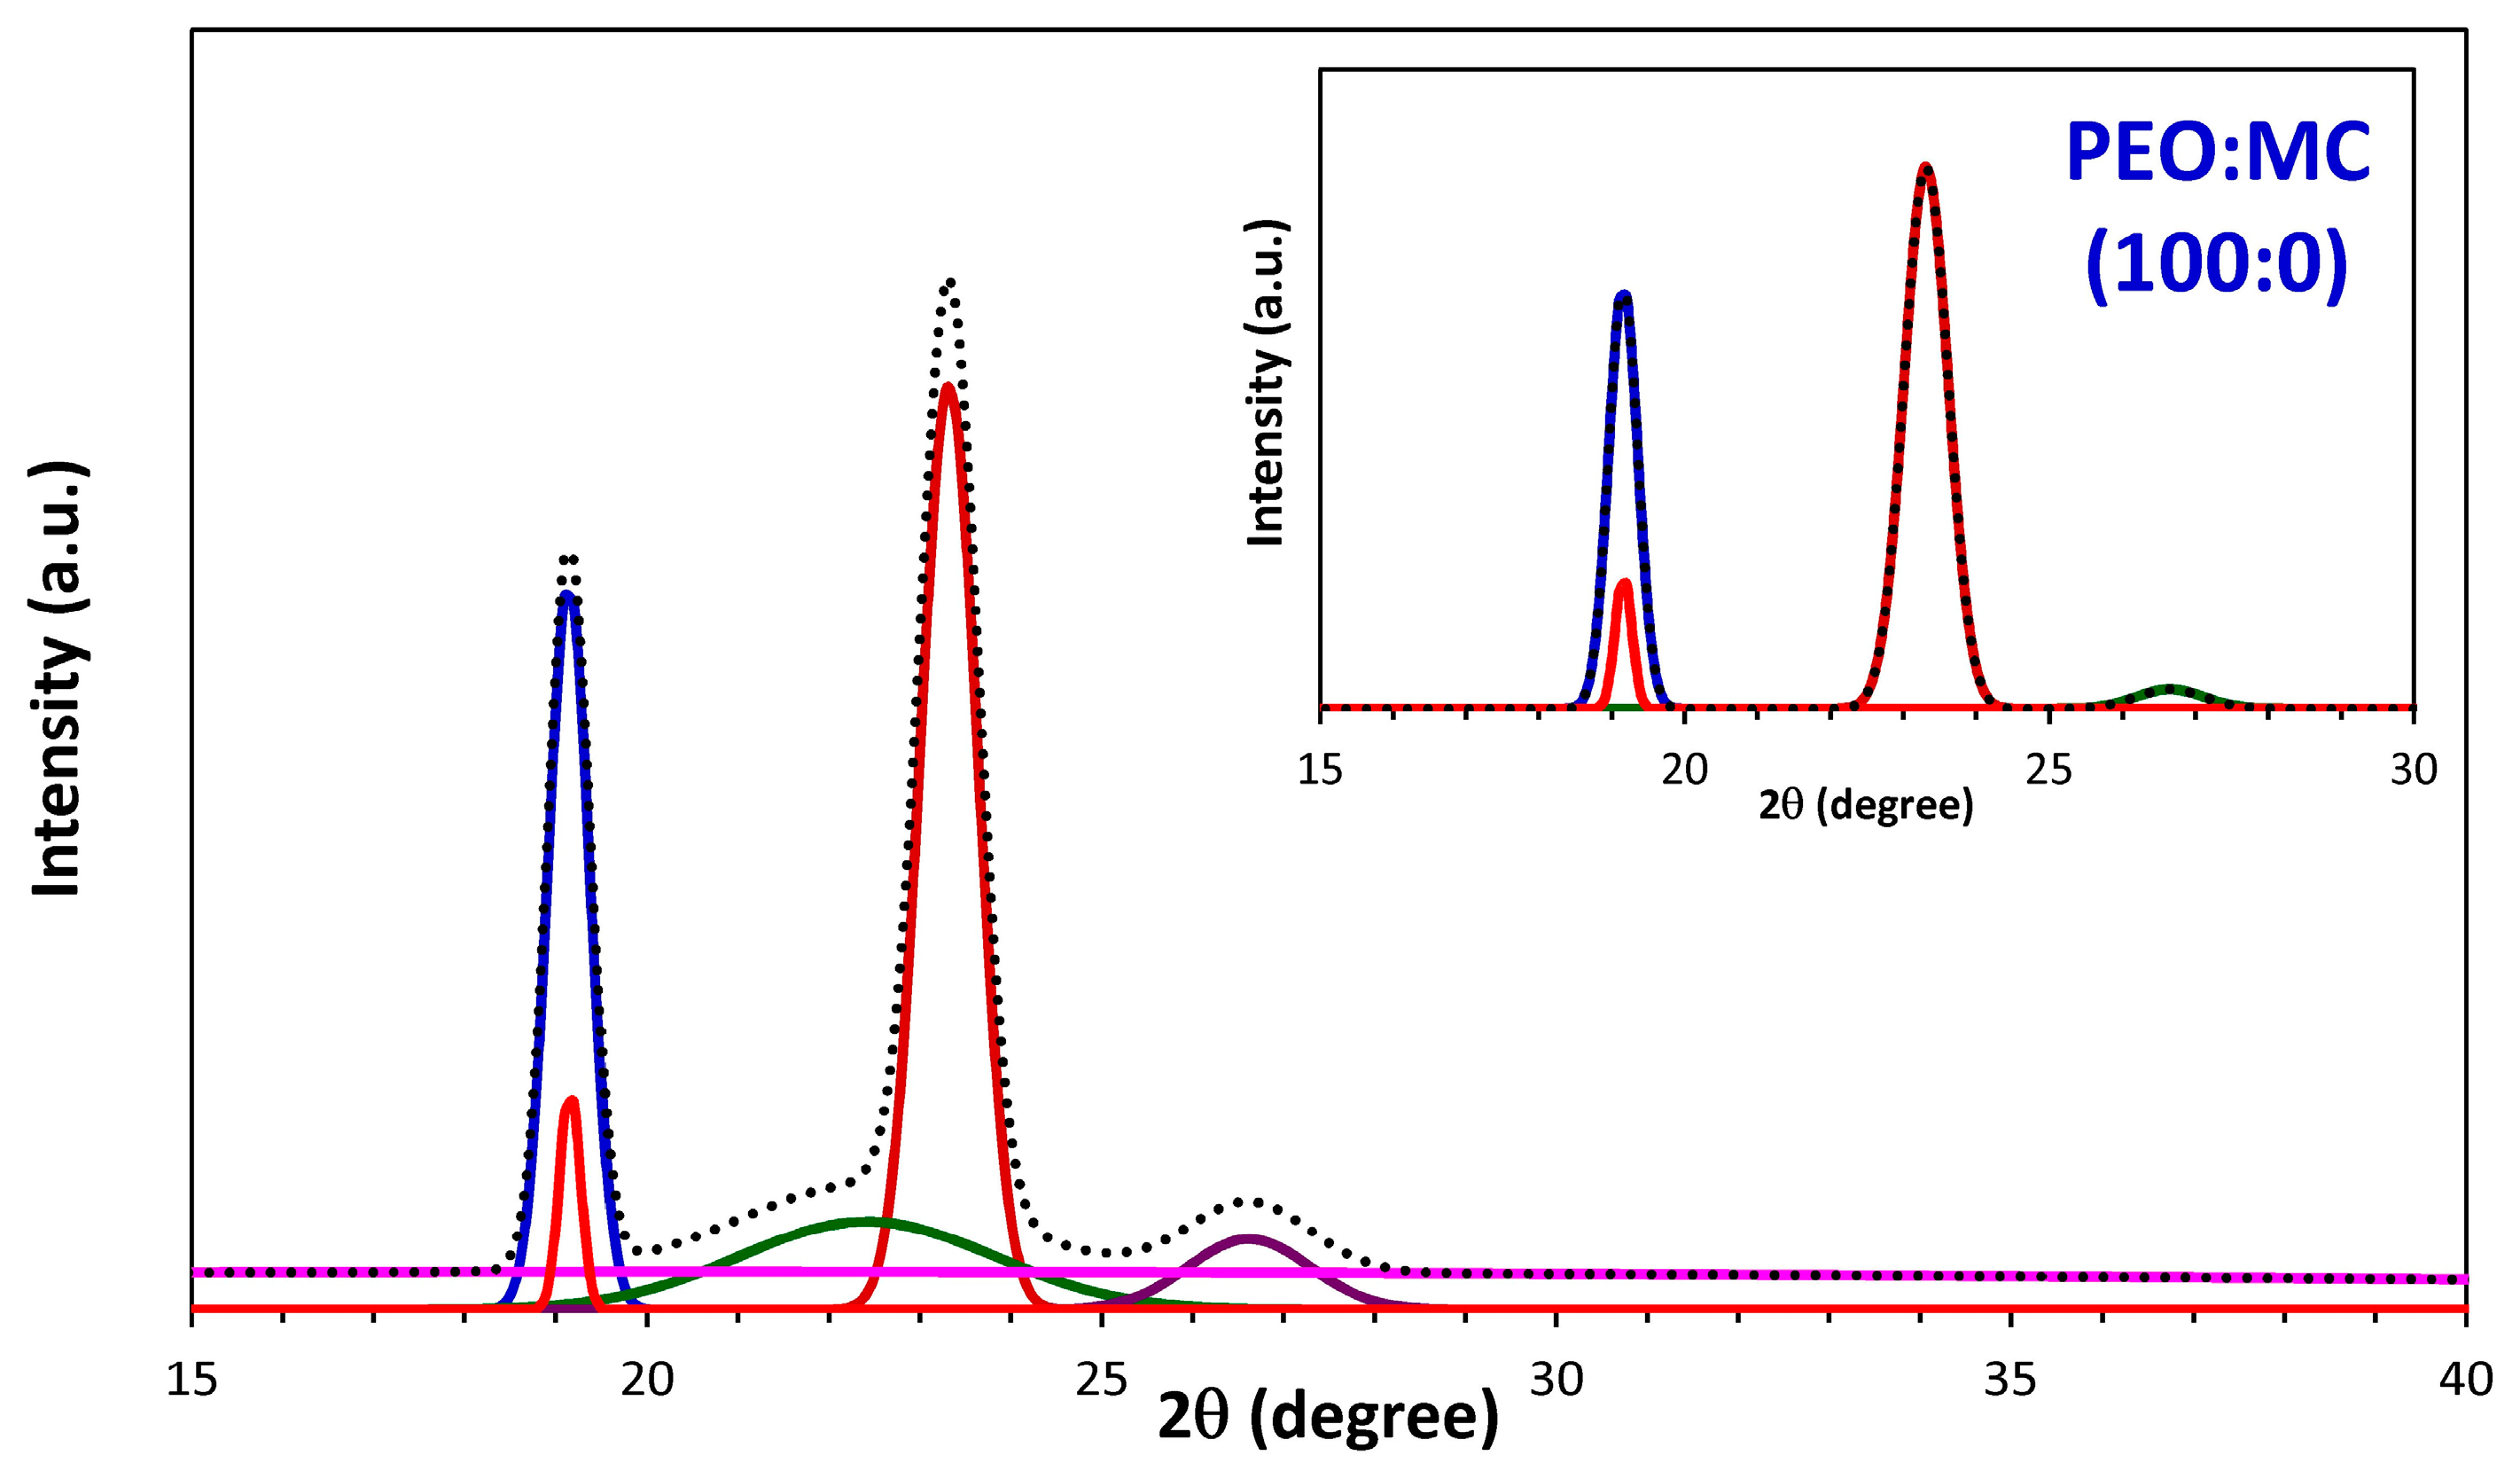
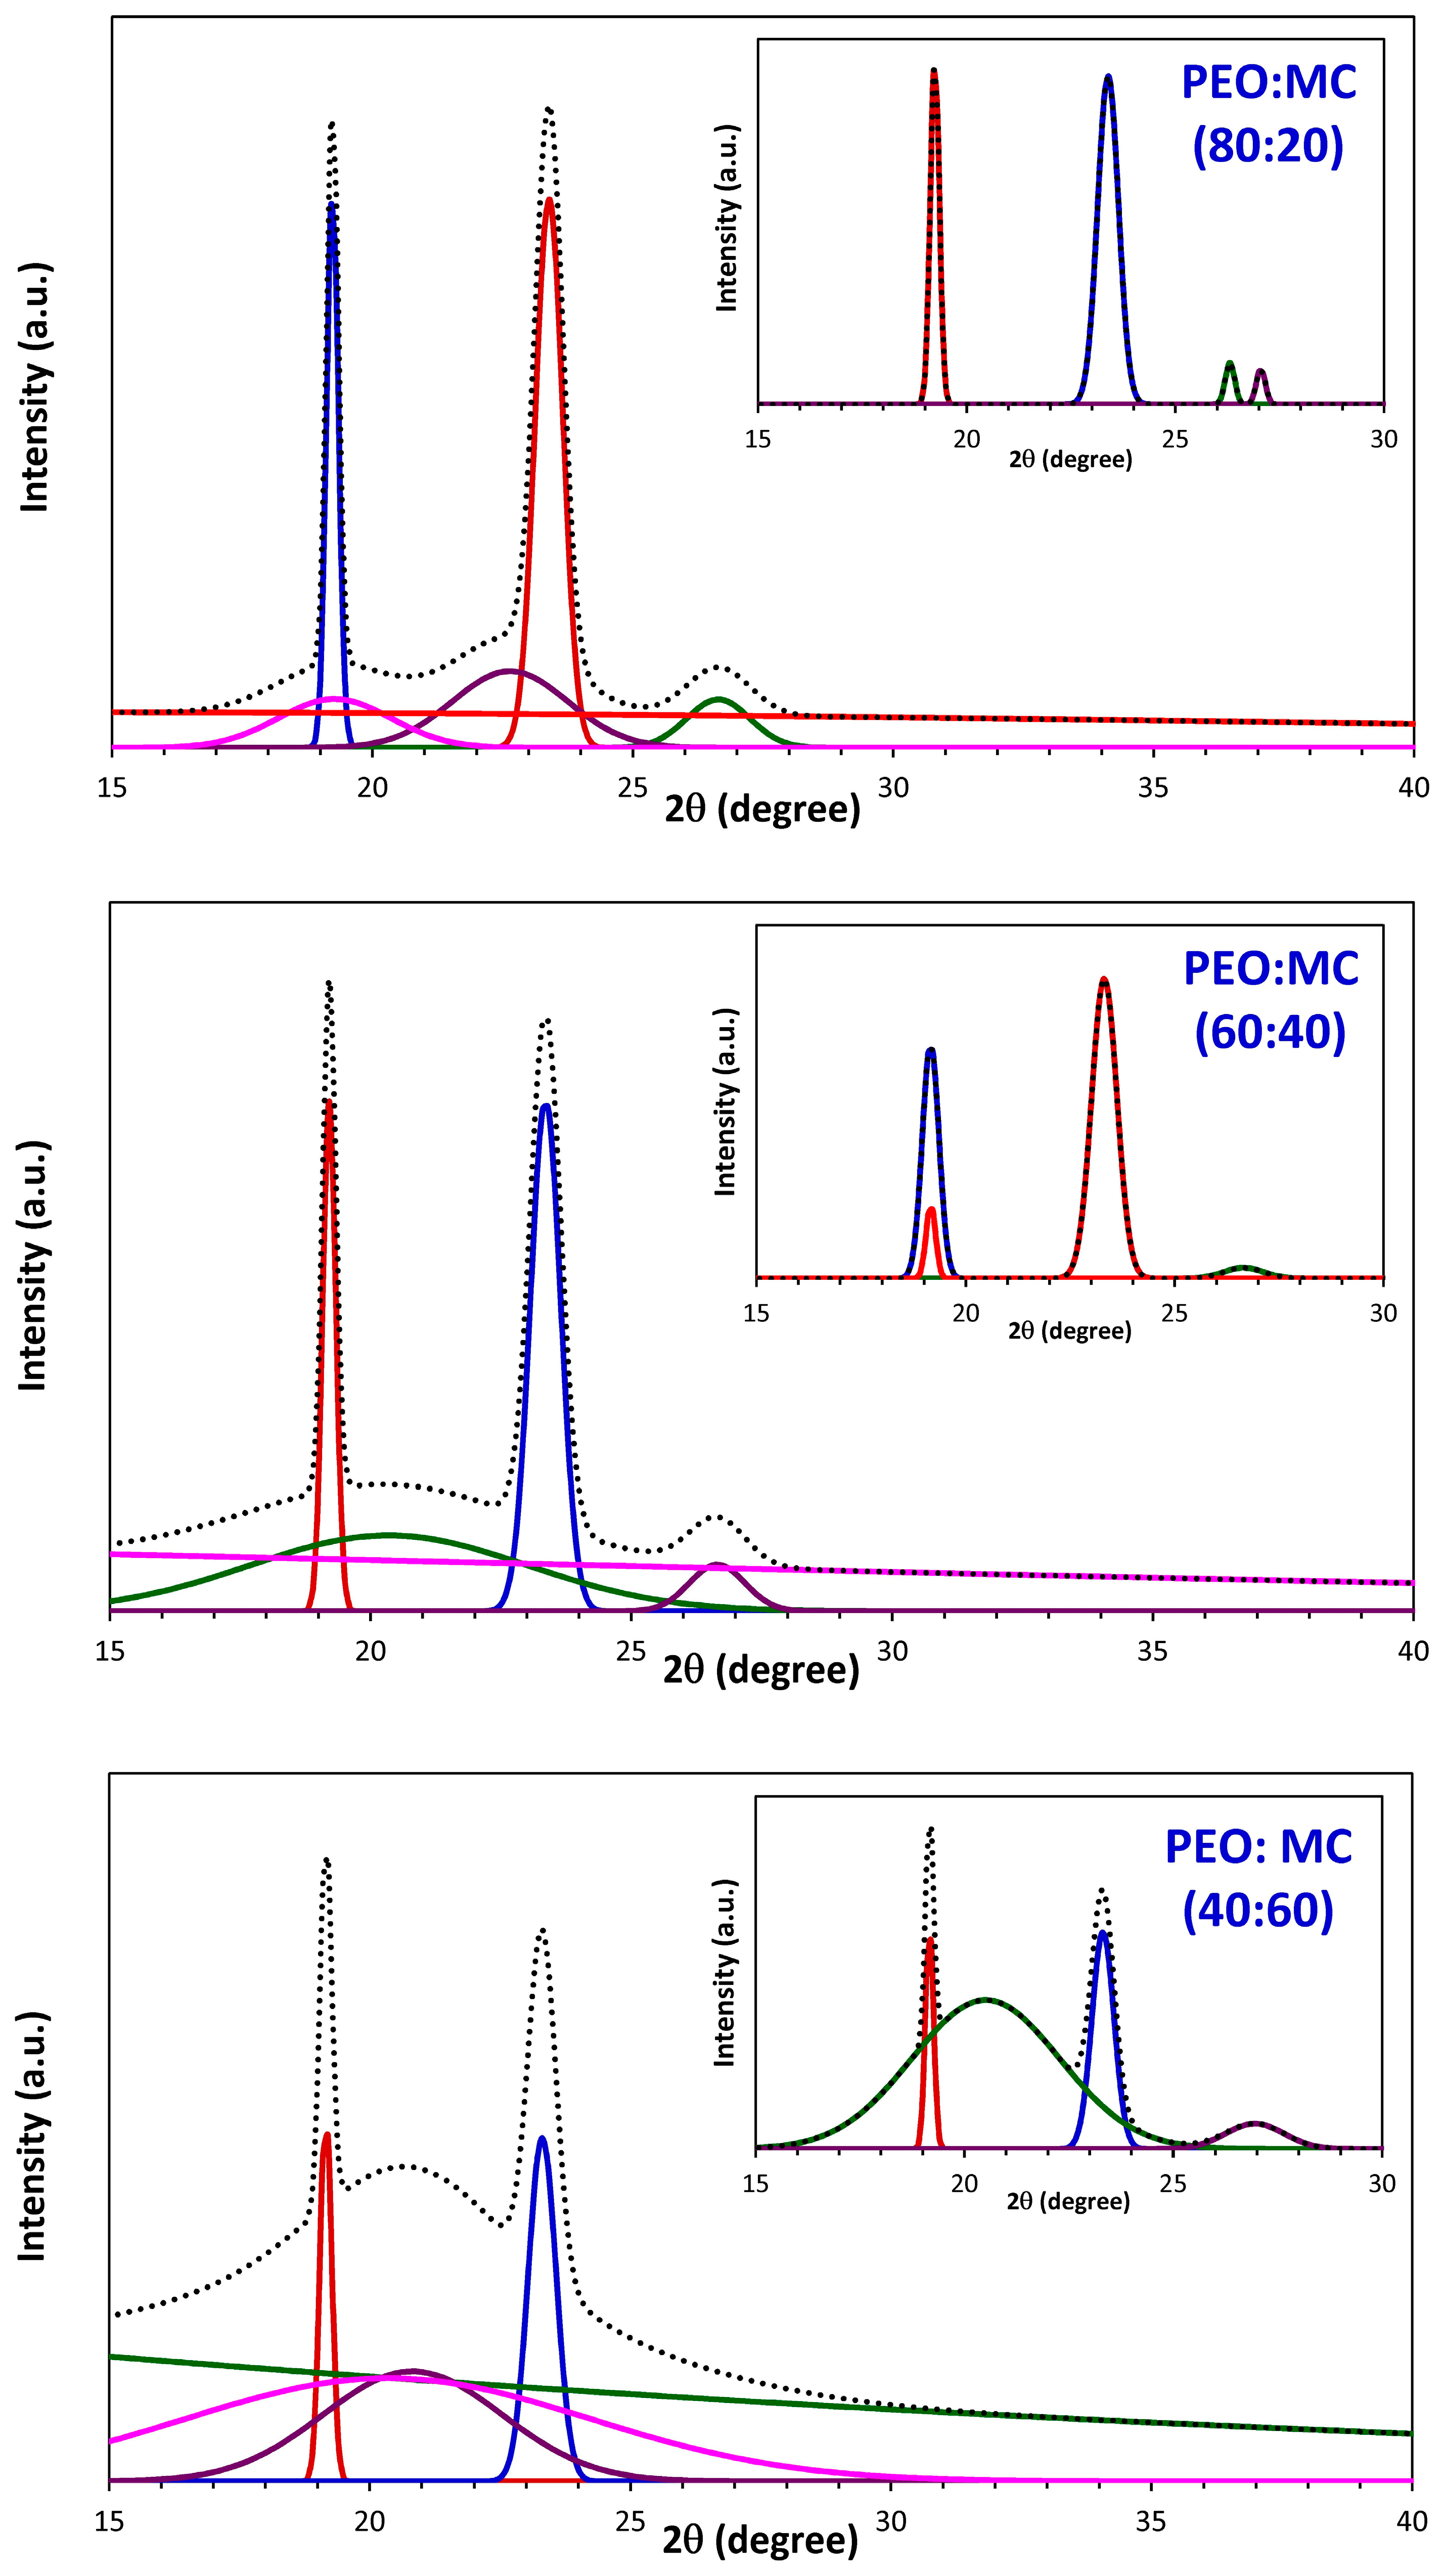
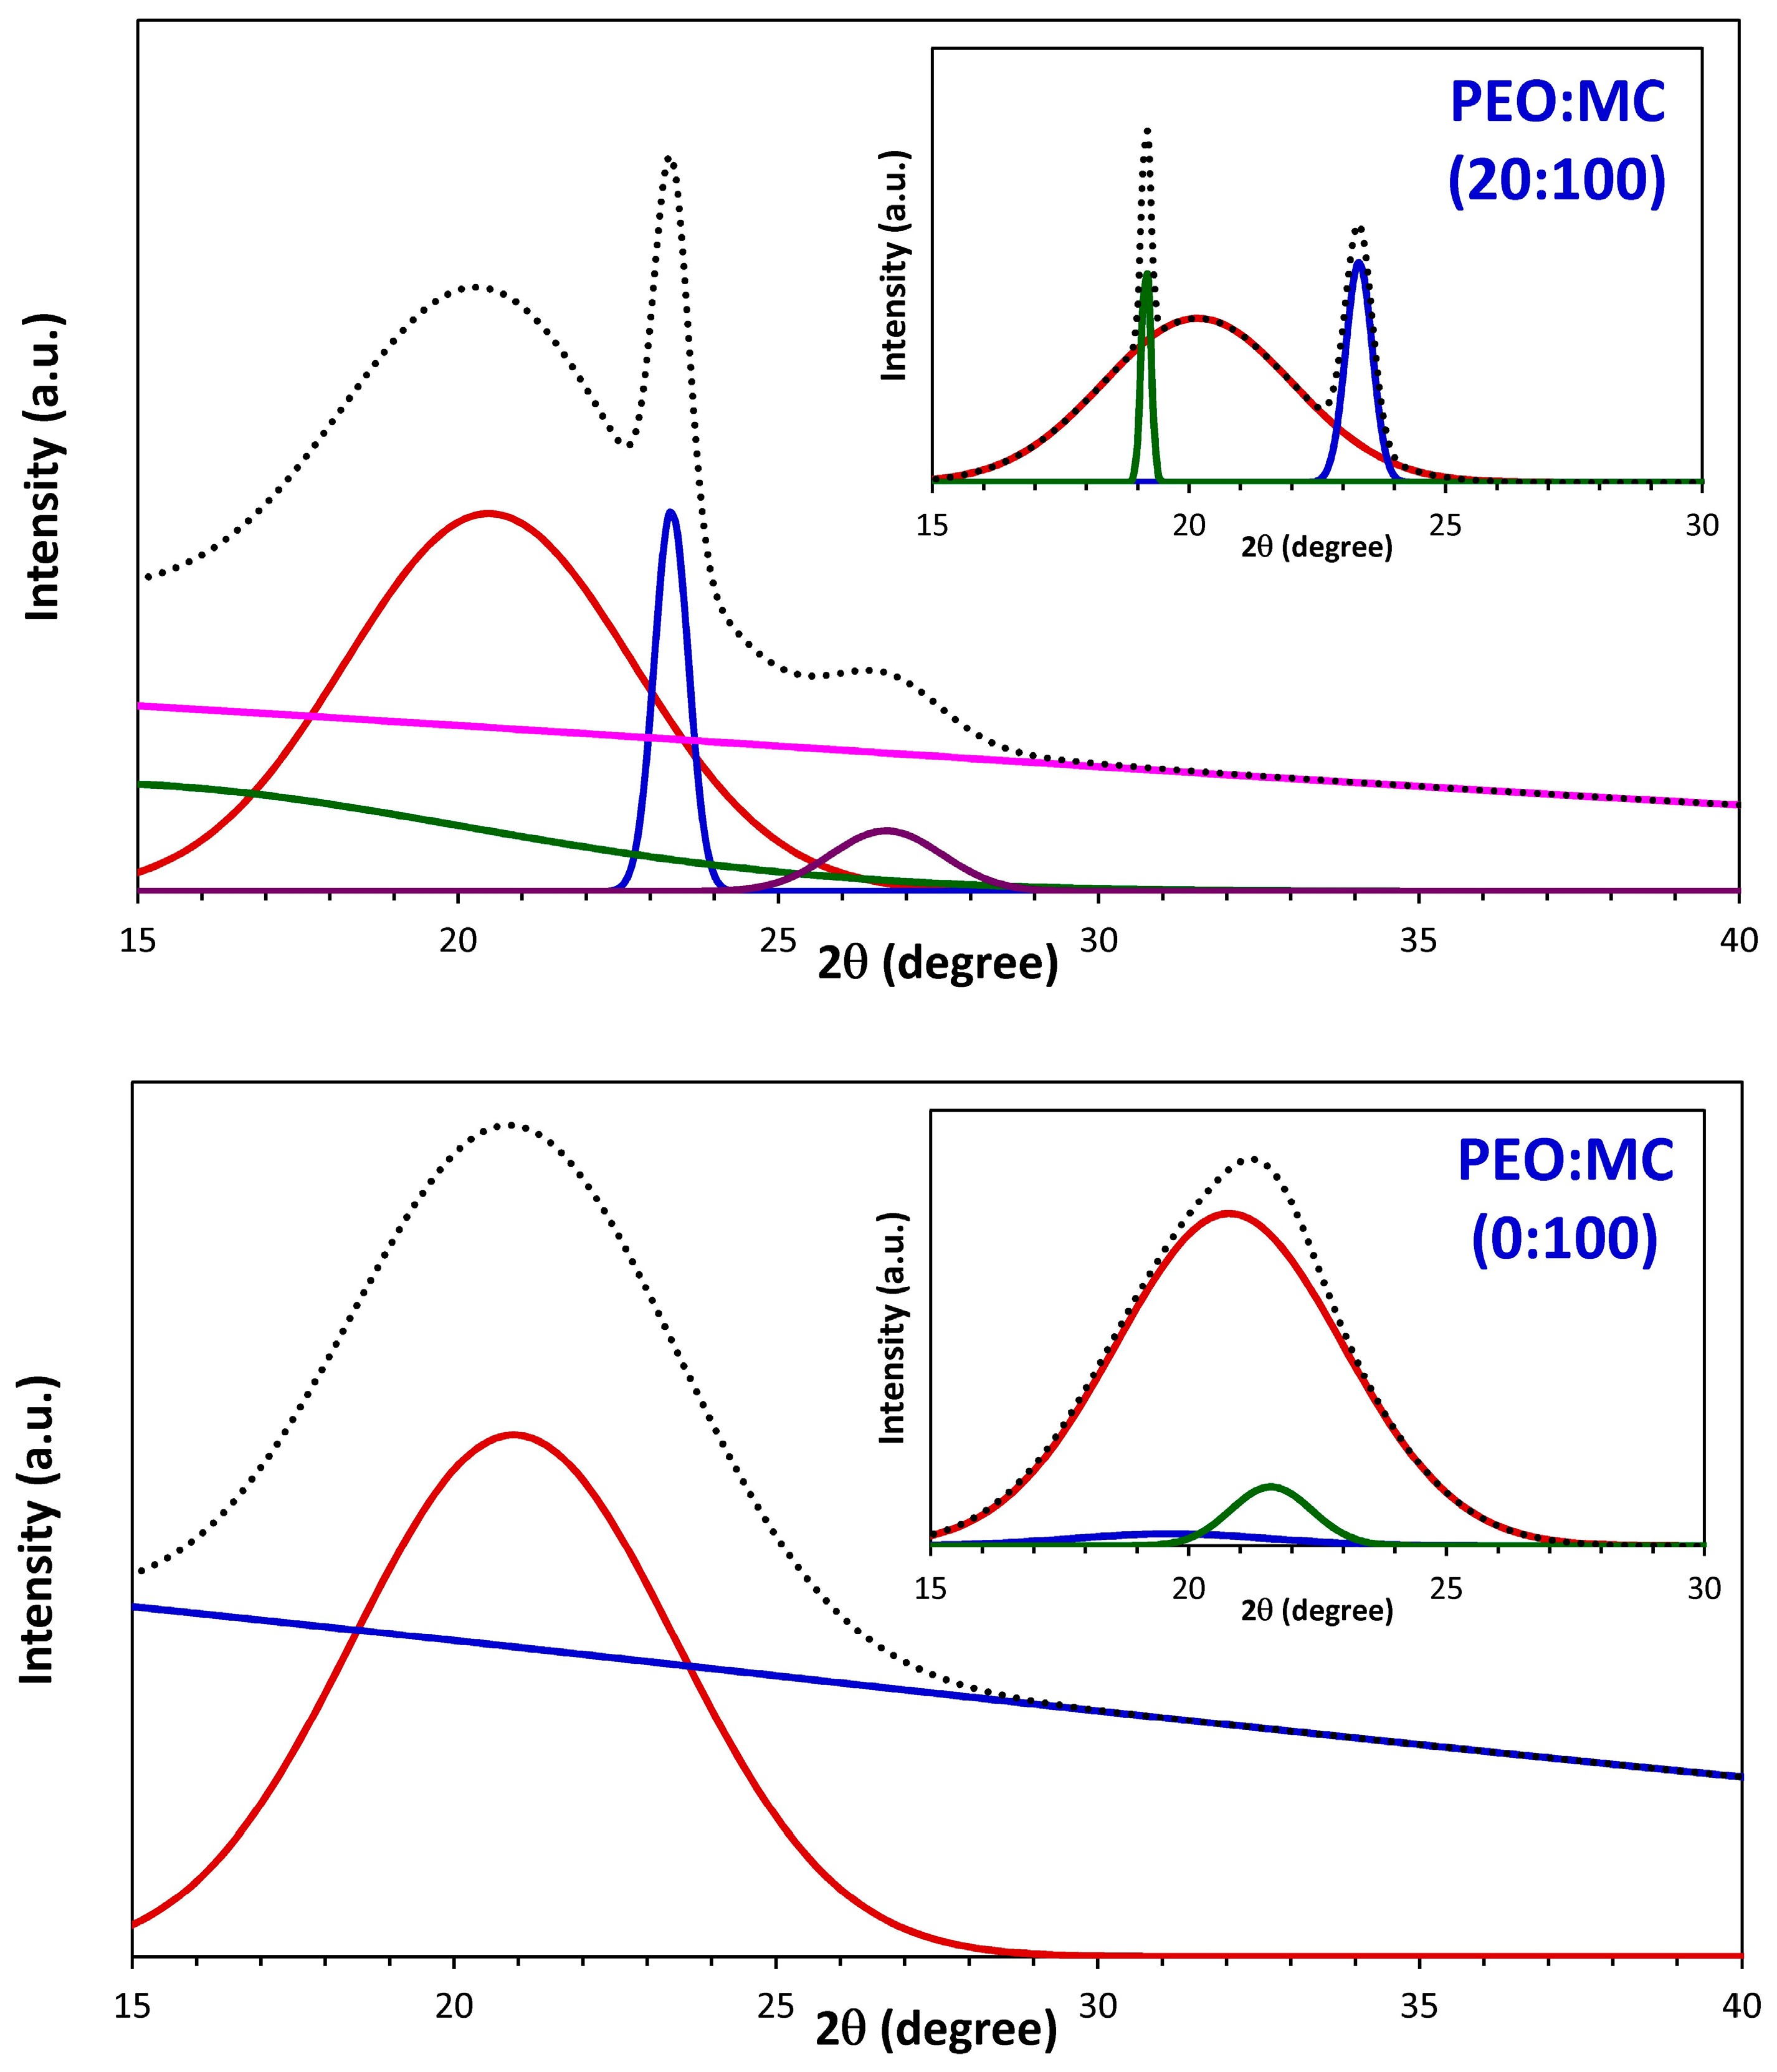
3.1. XRD Analysis
3.2. Surface Morphology Analysis
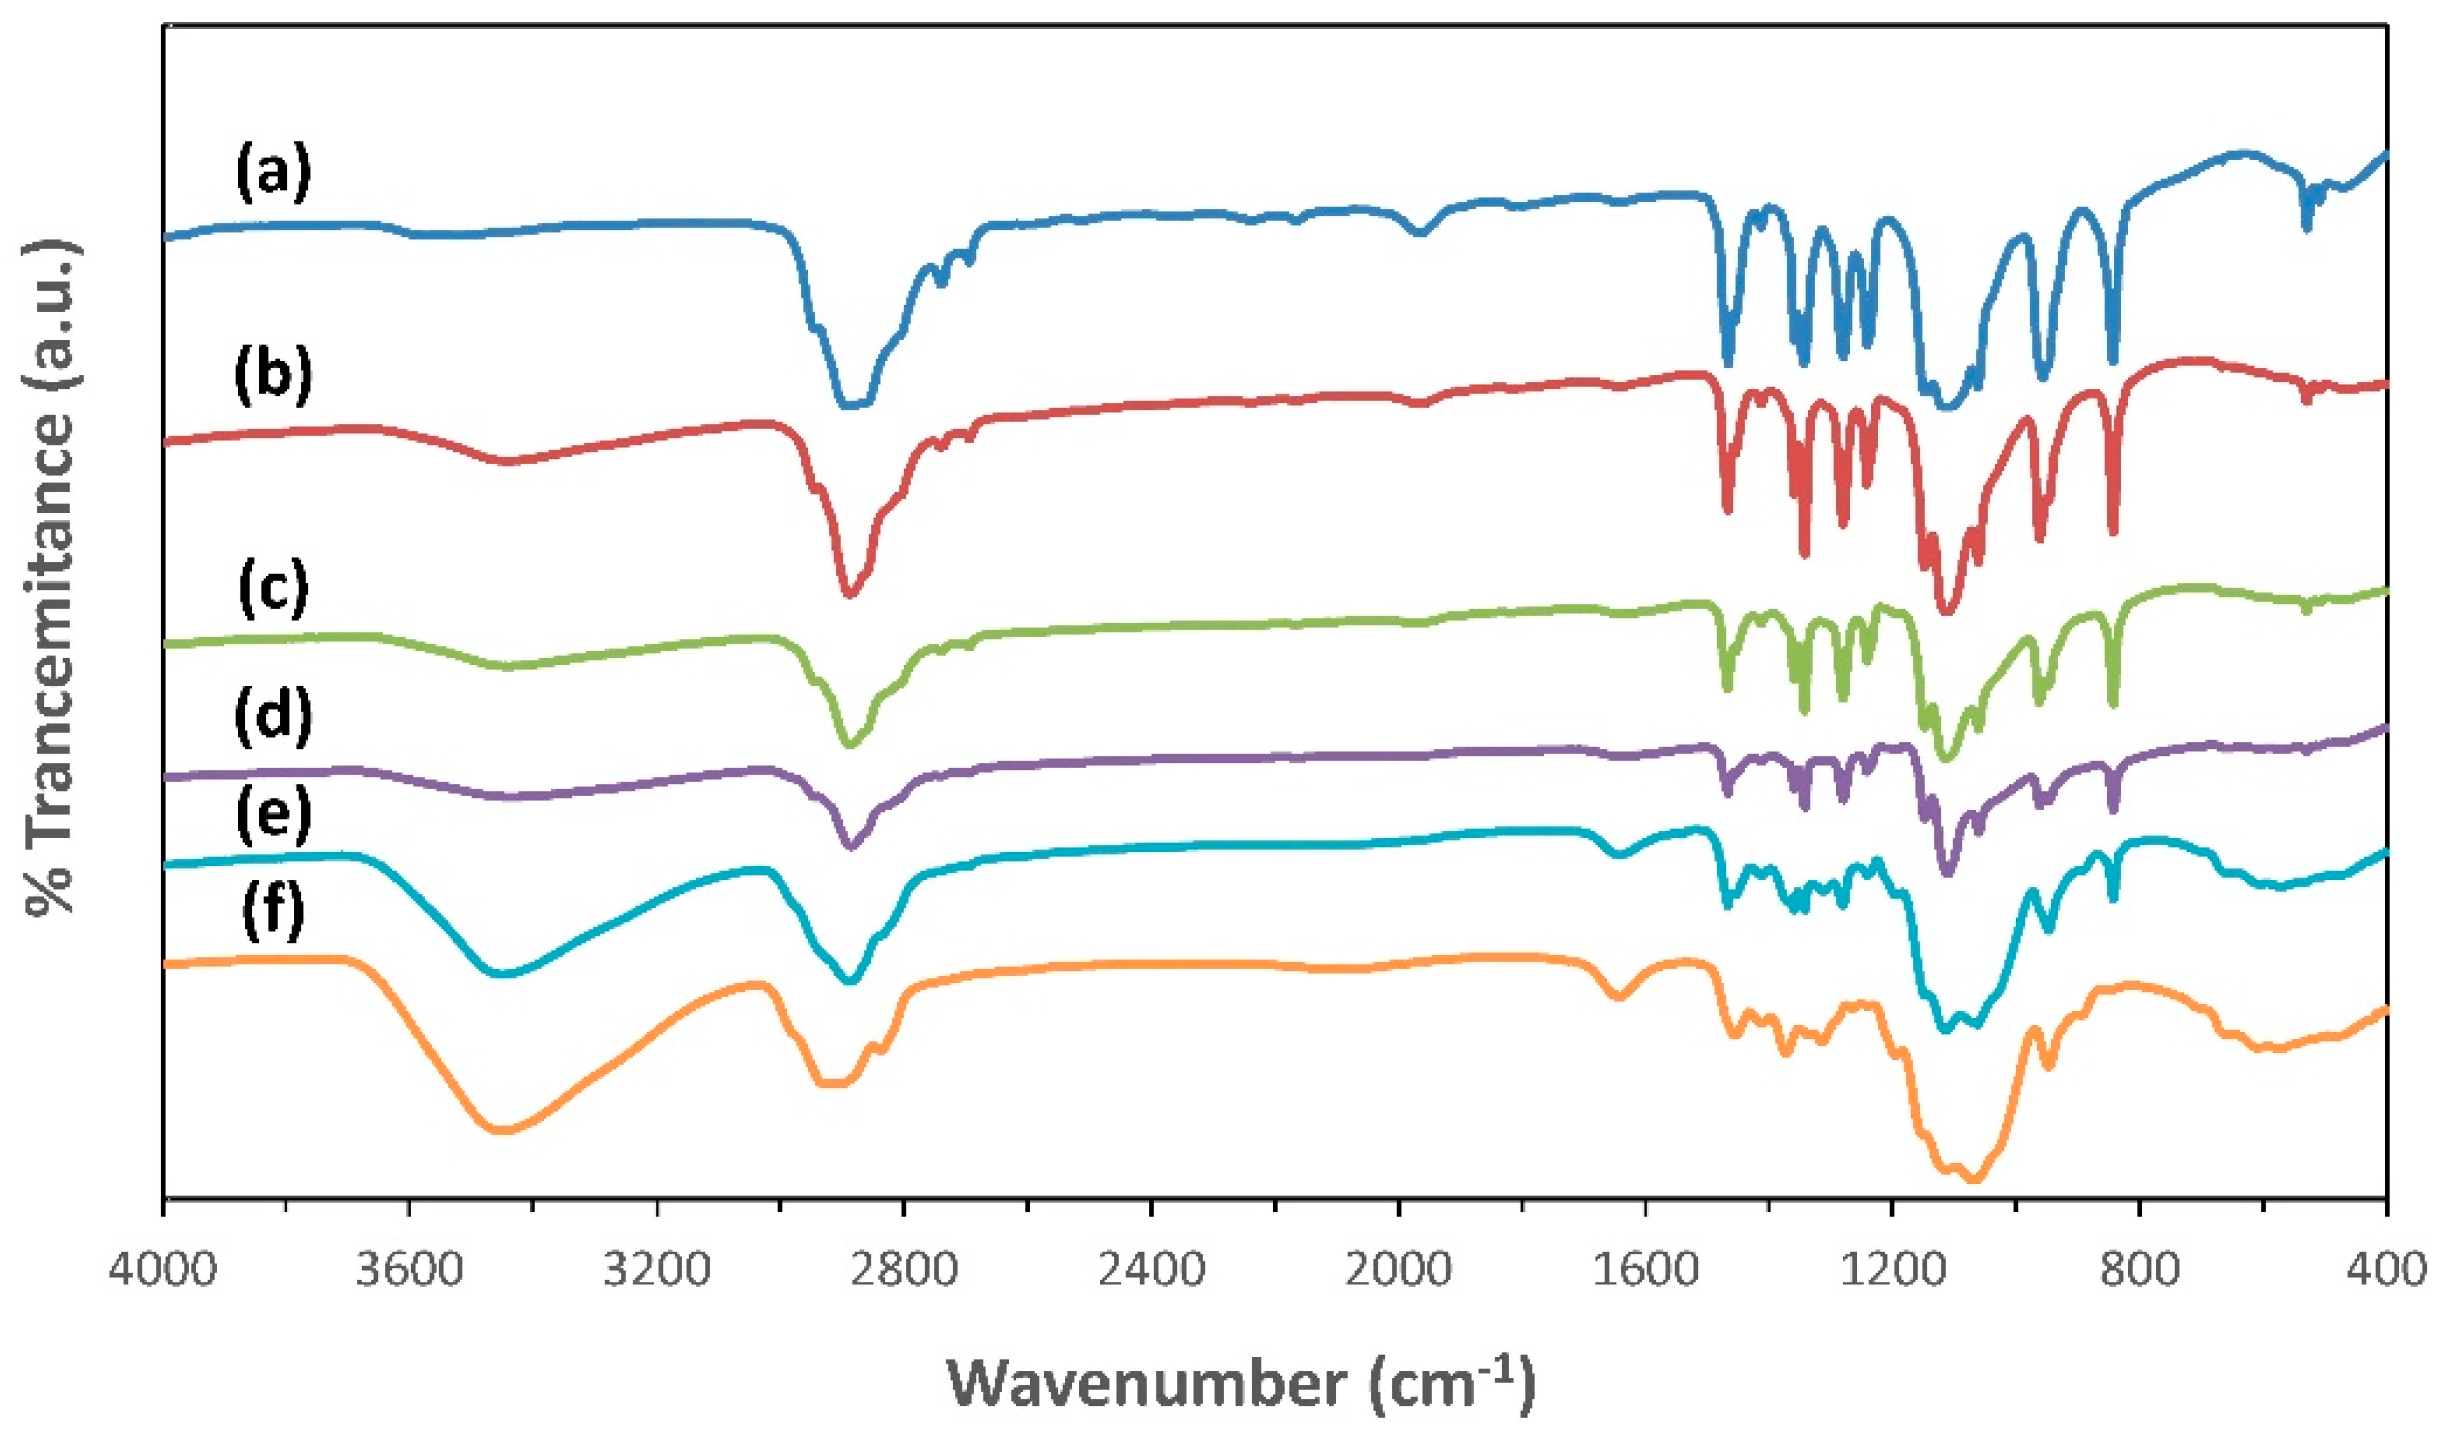
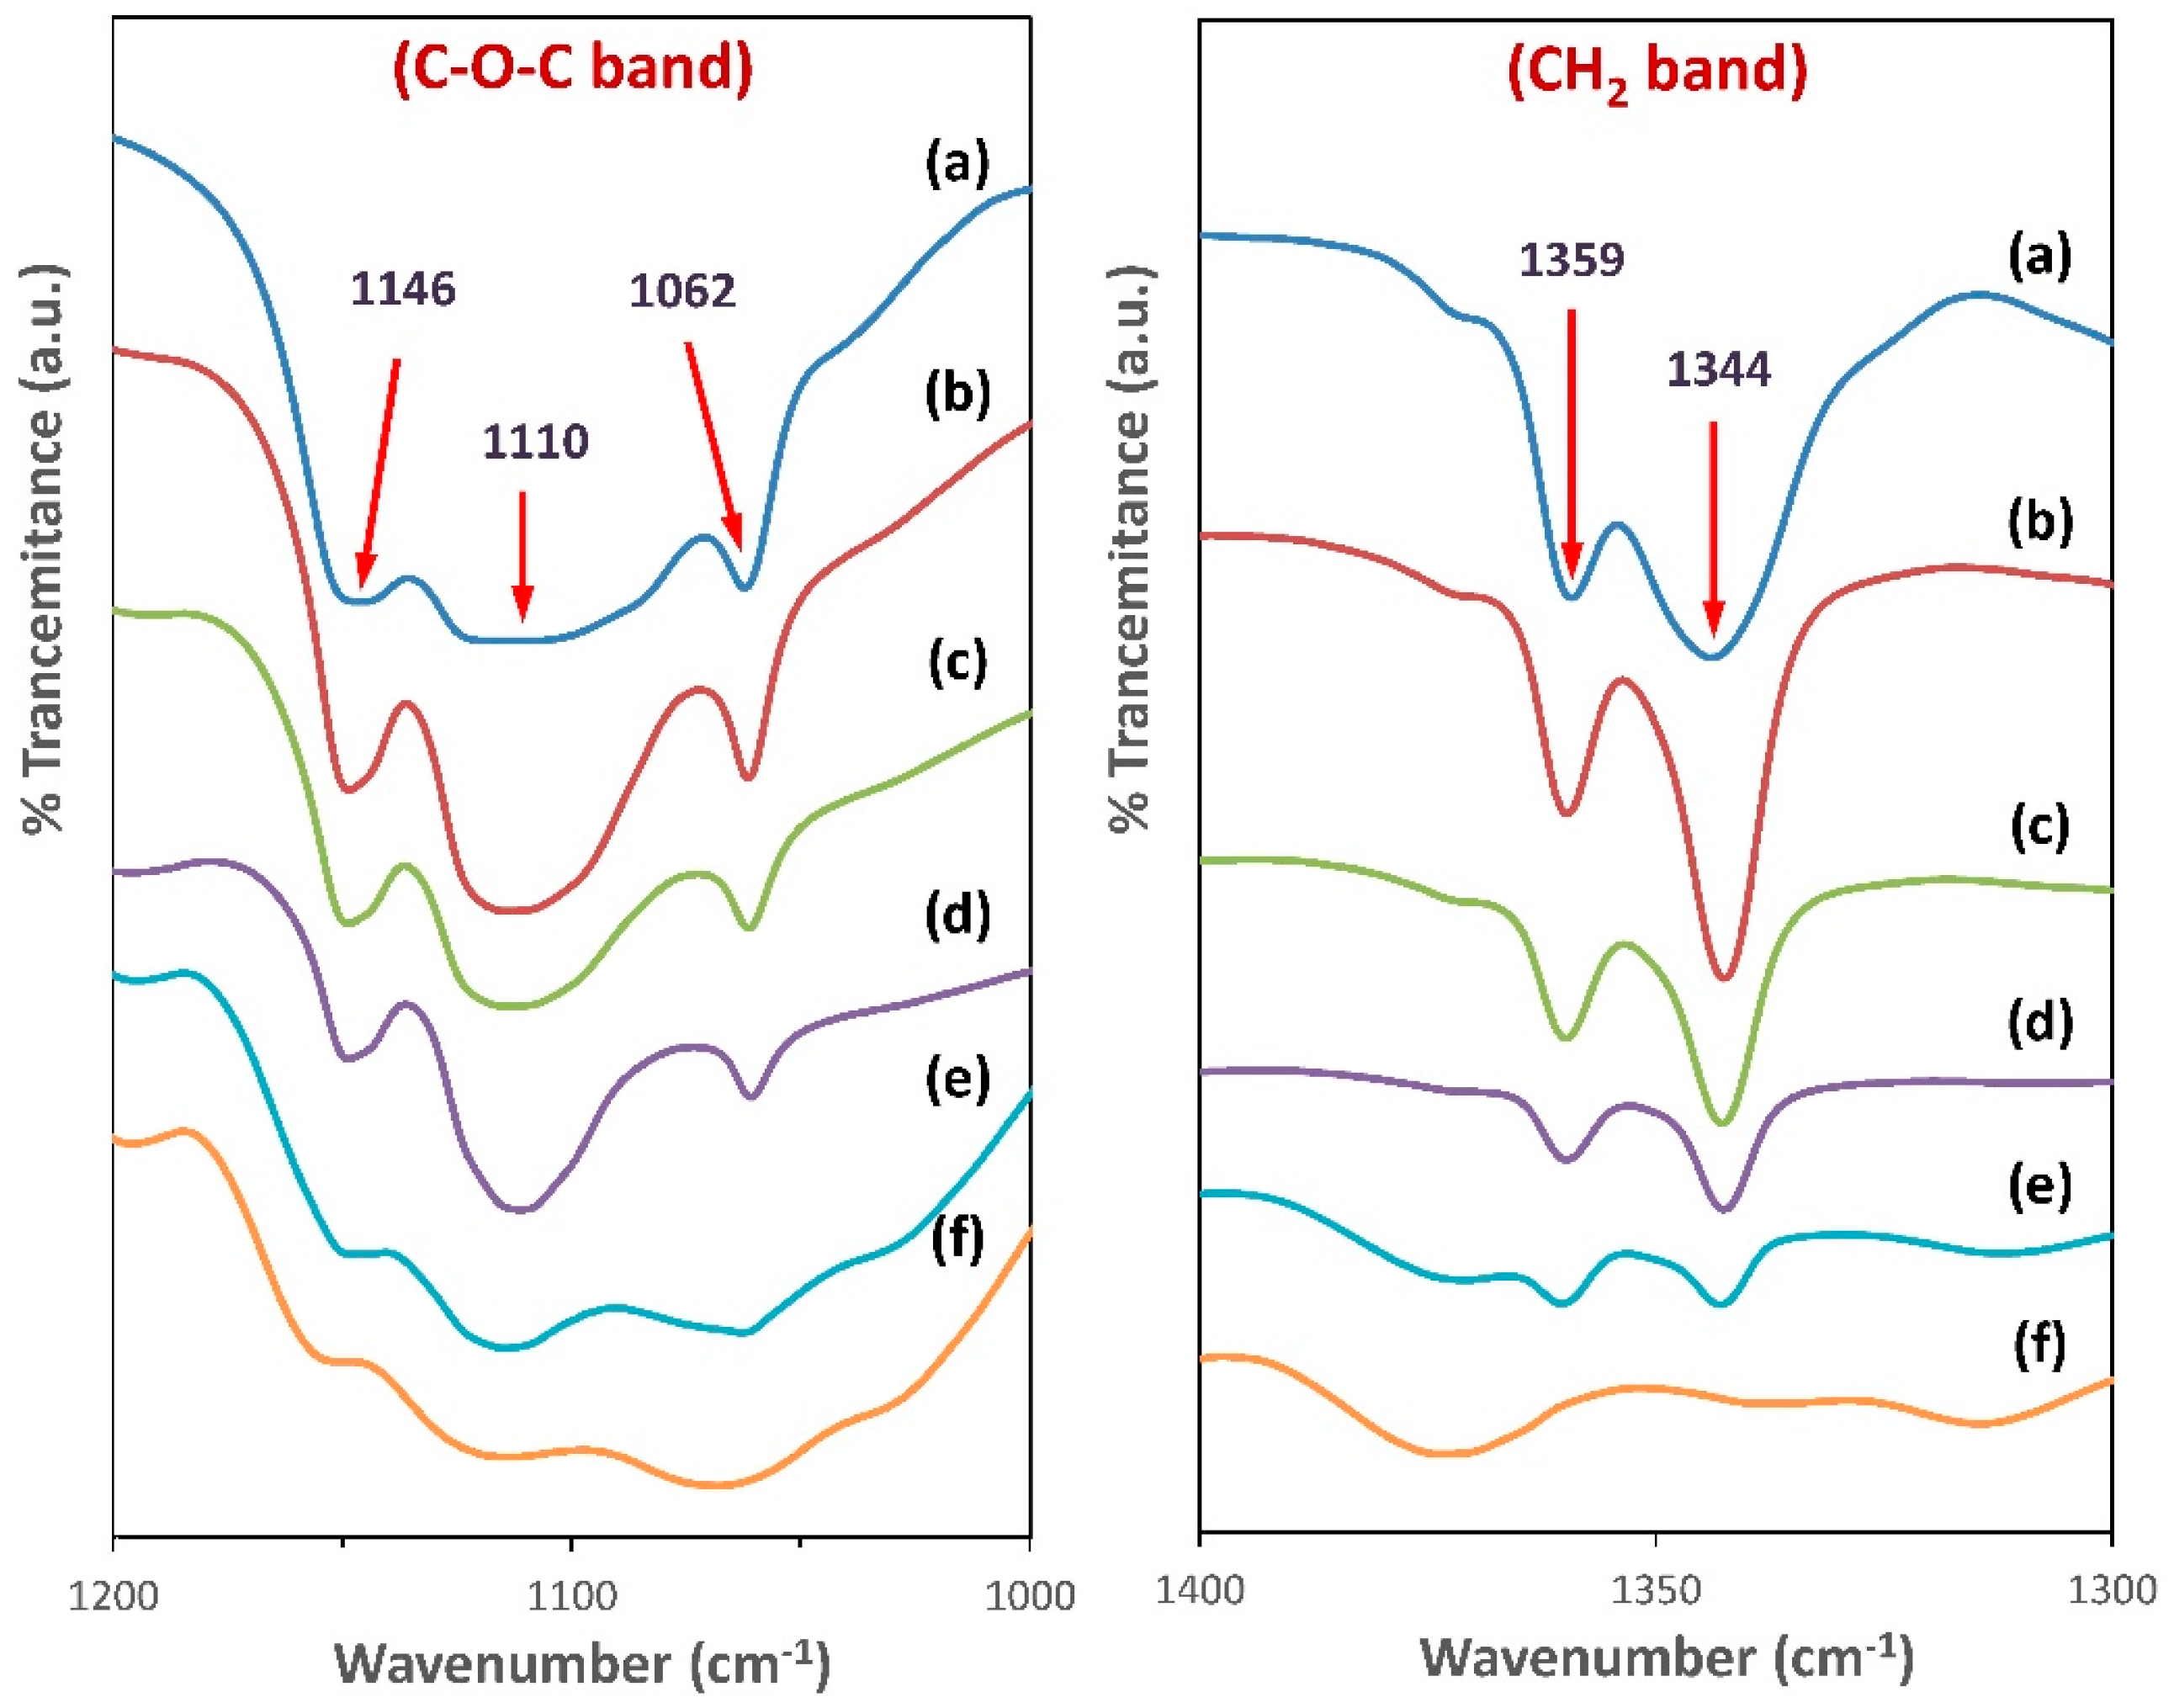
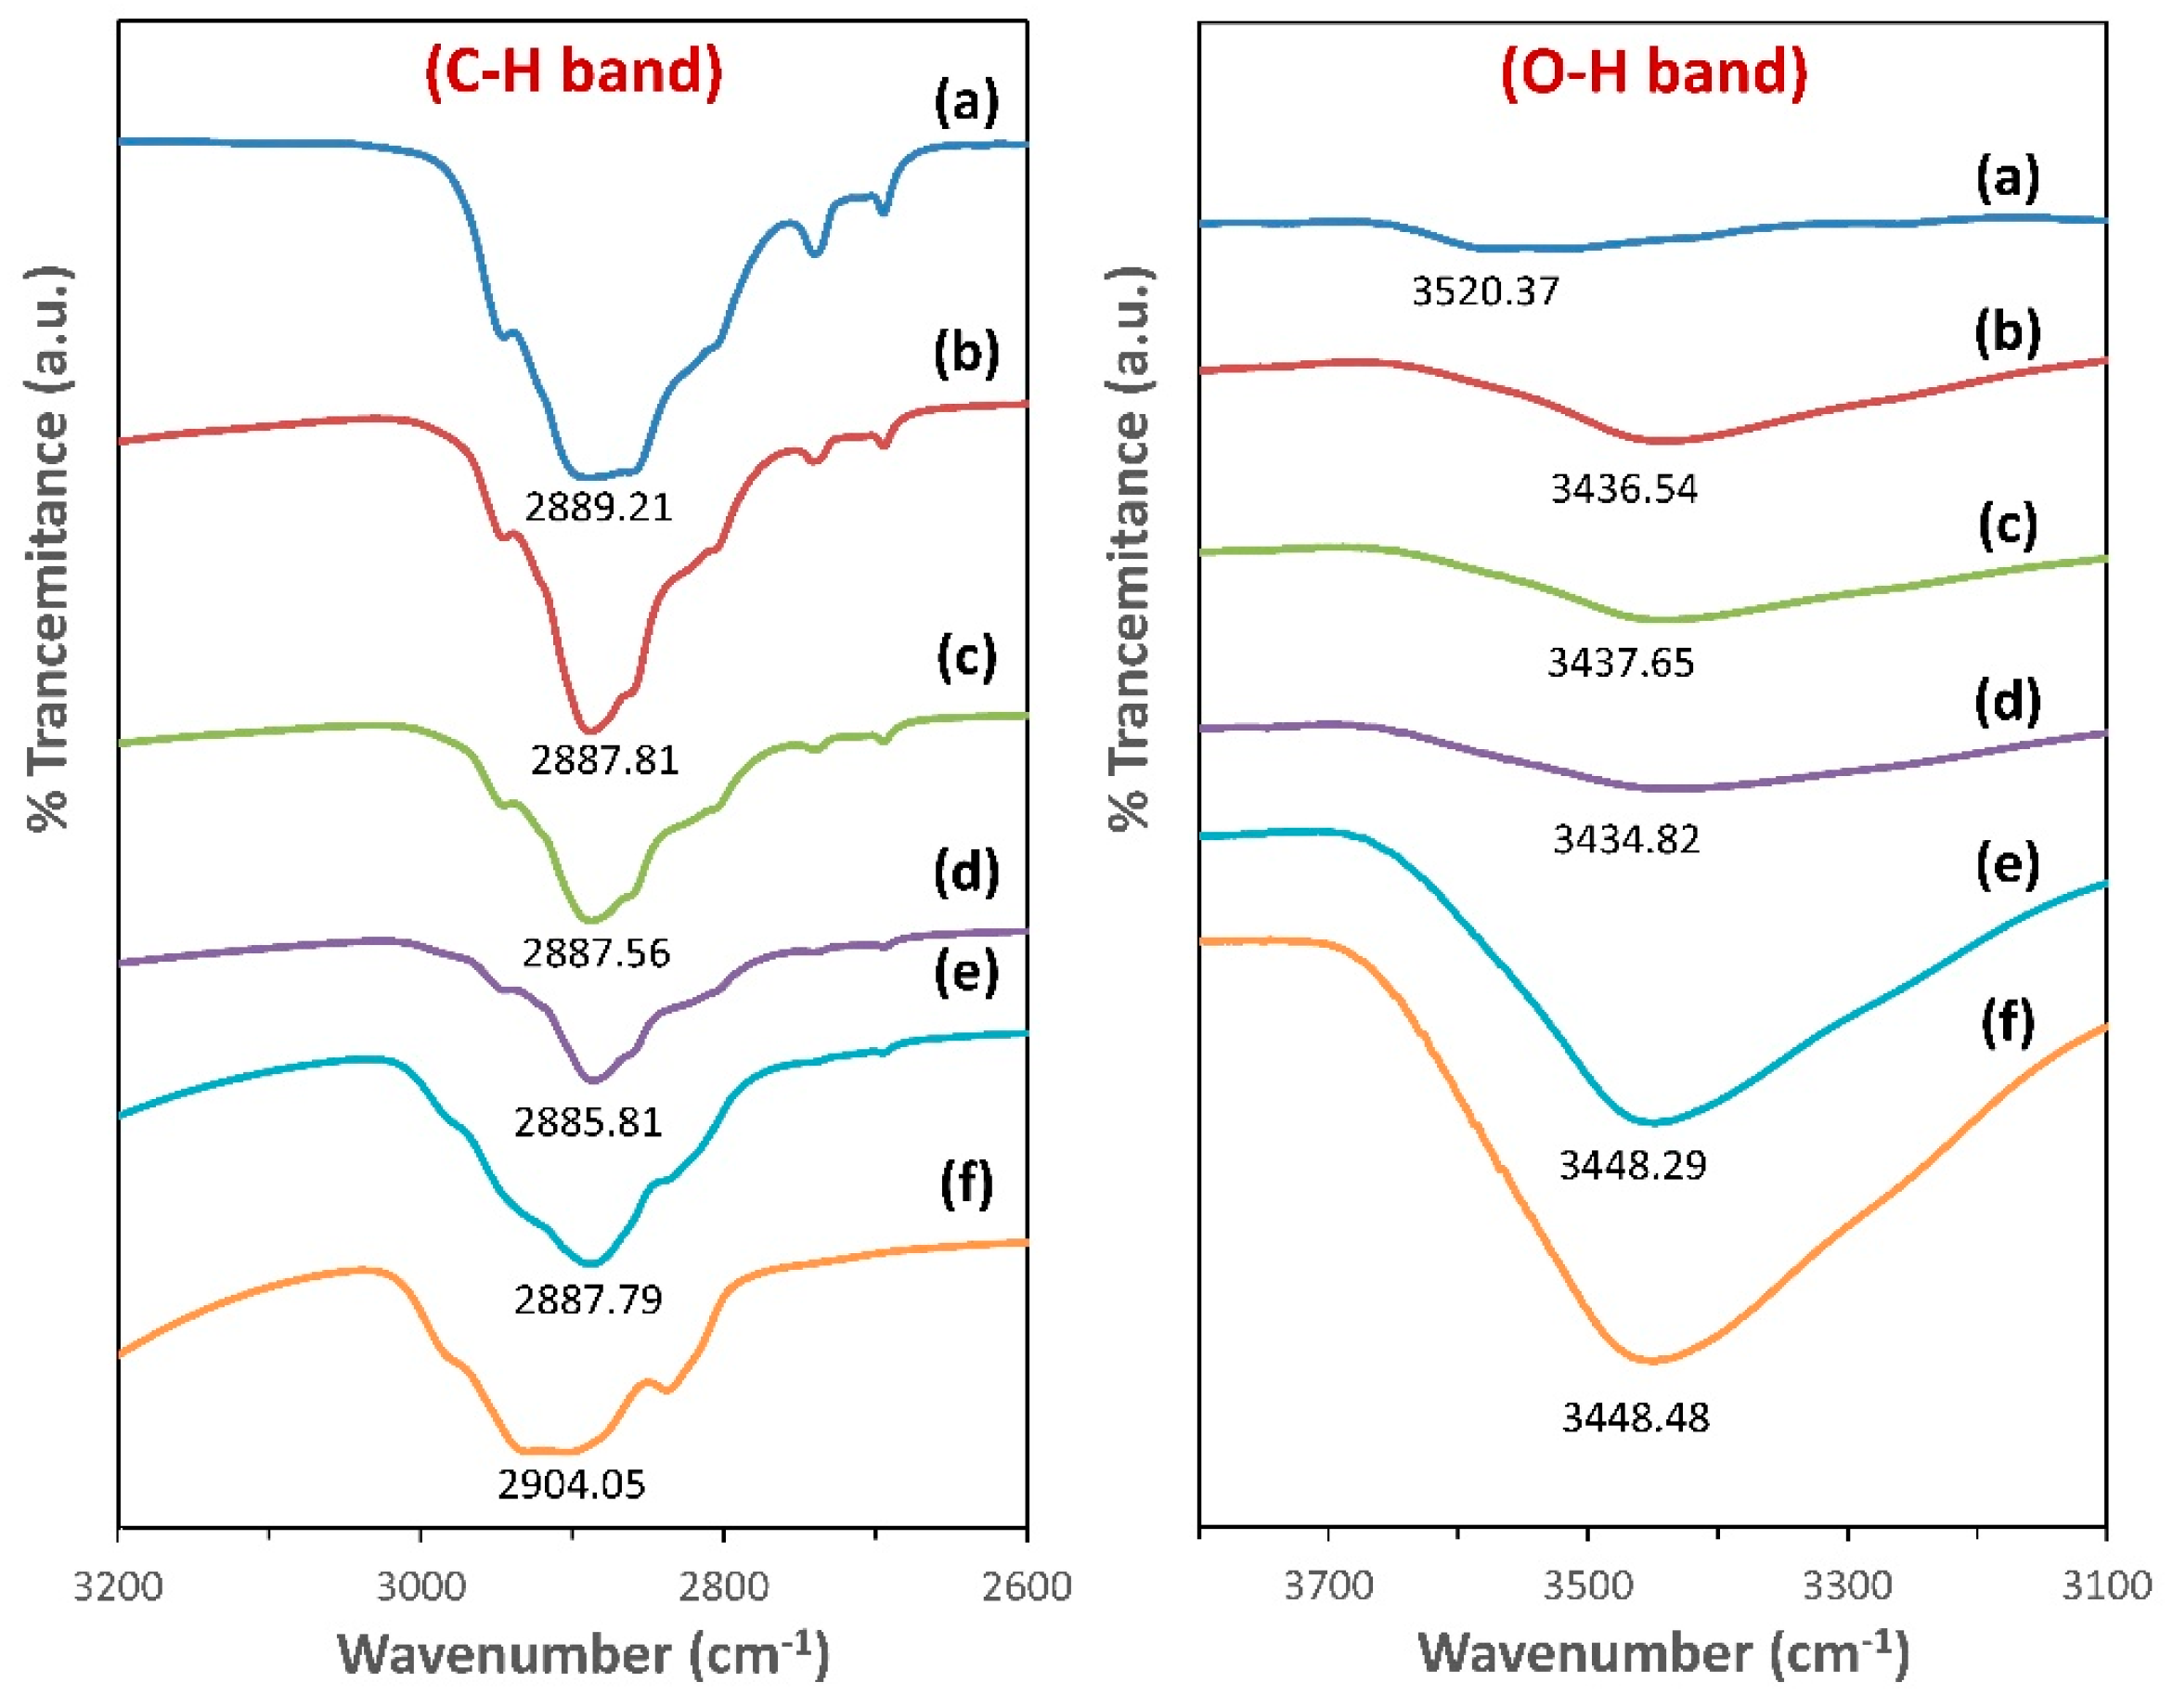
3.3. FTIR Spectroscopy Analysis
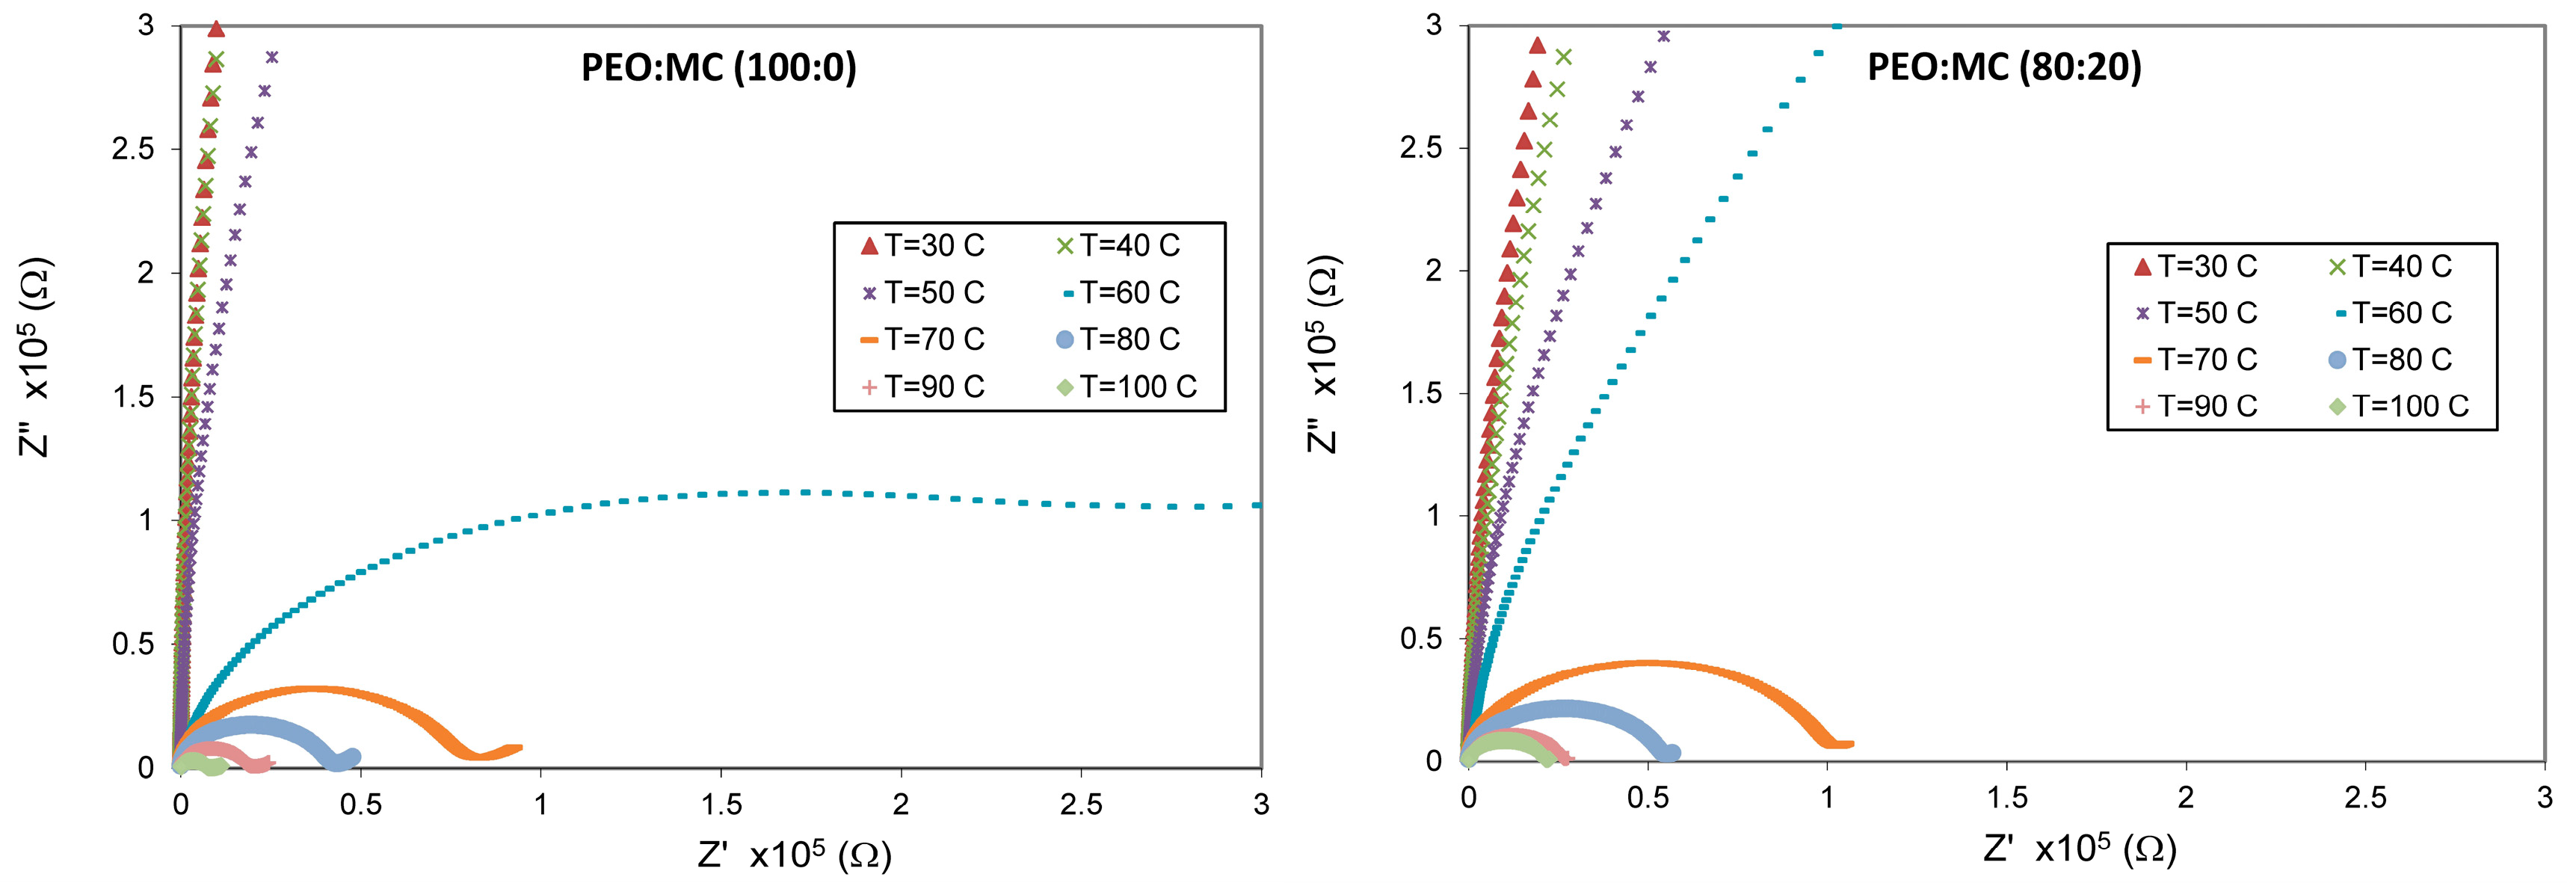
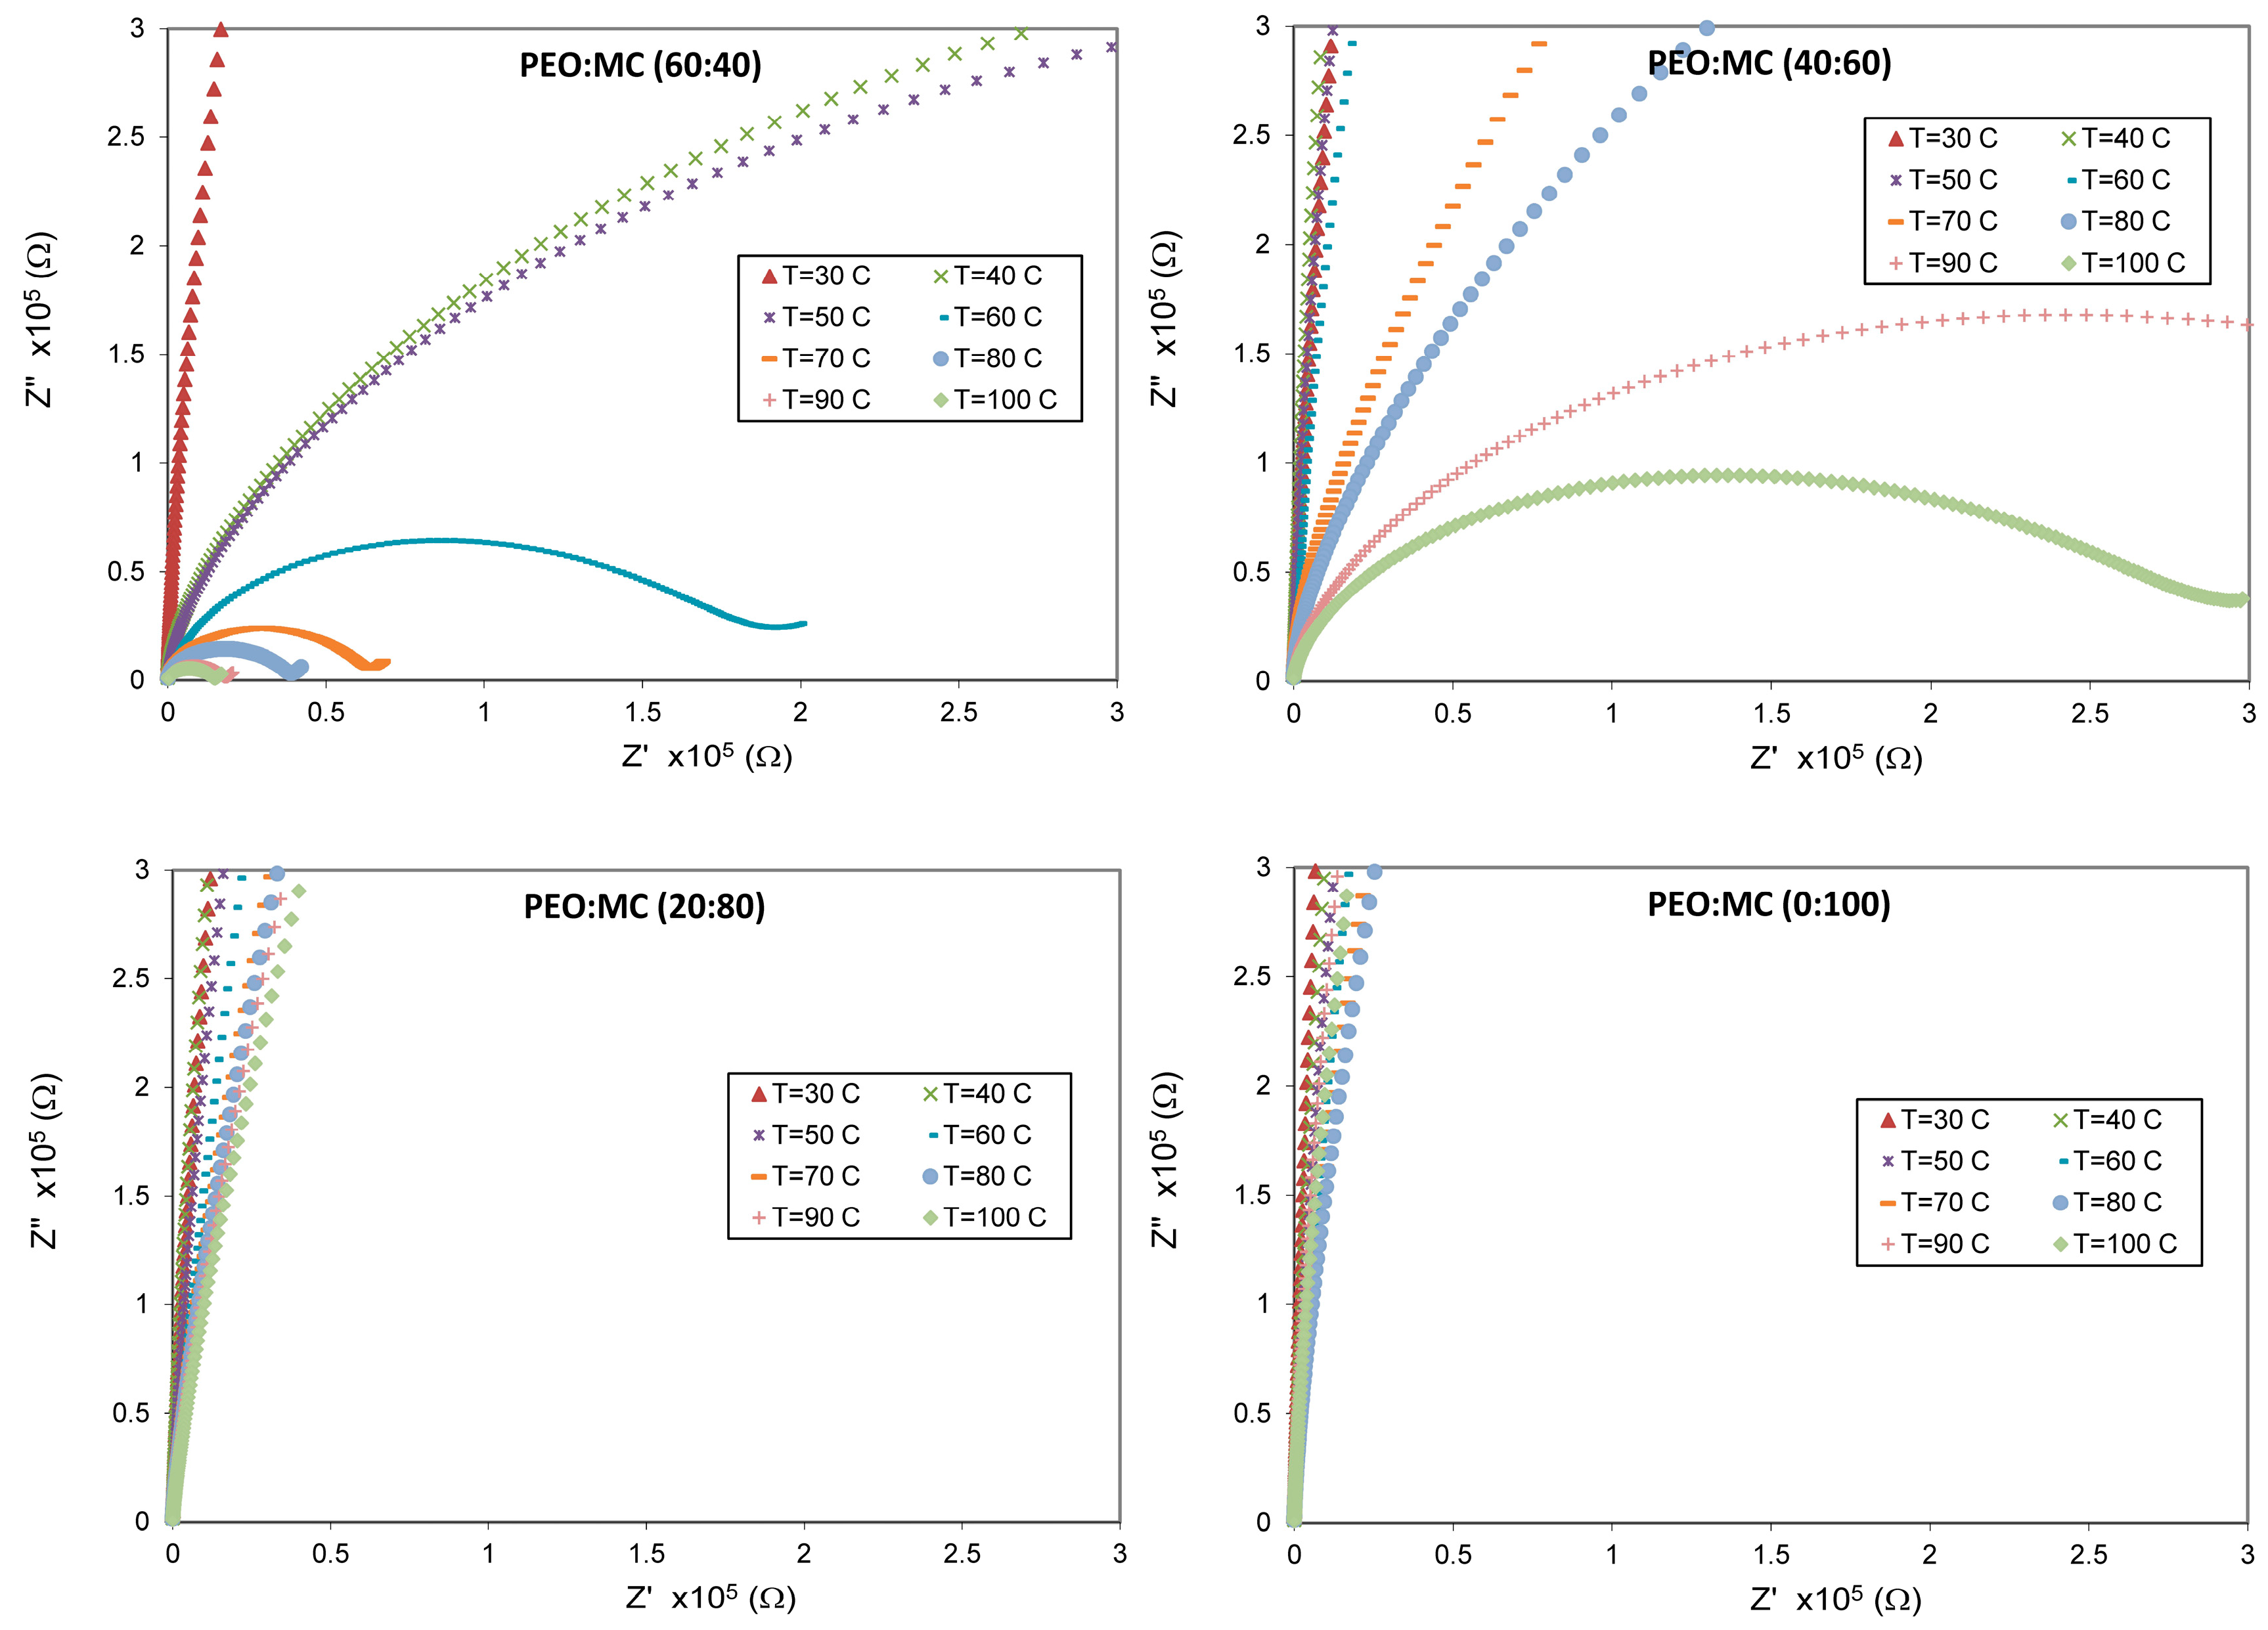
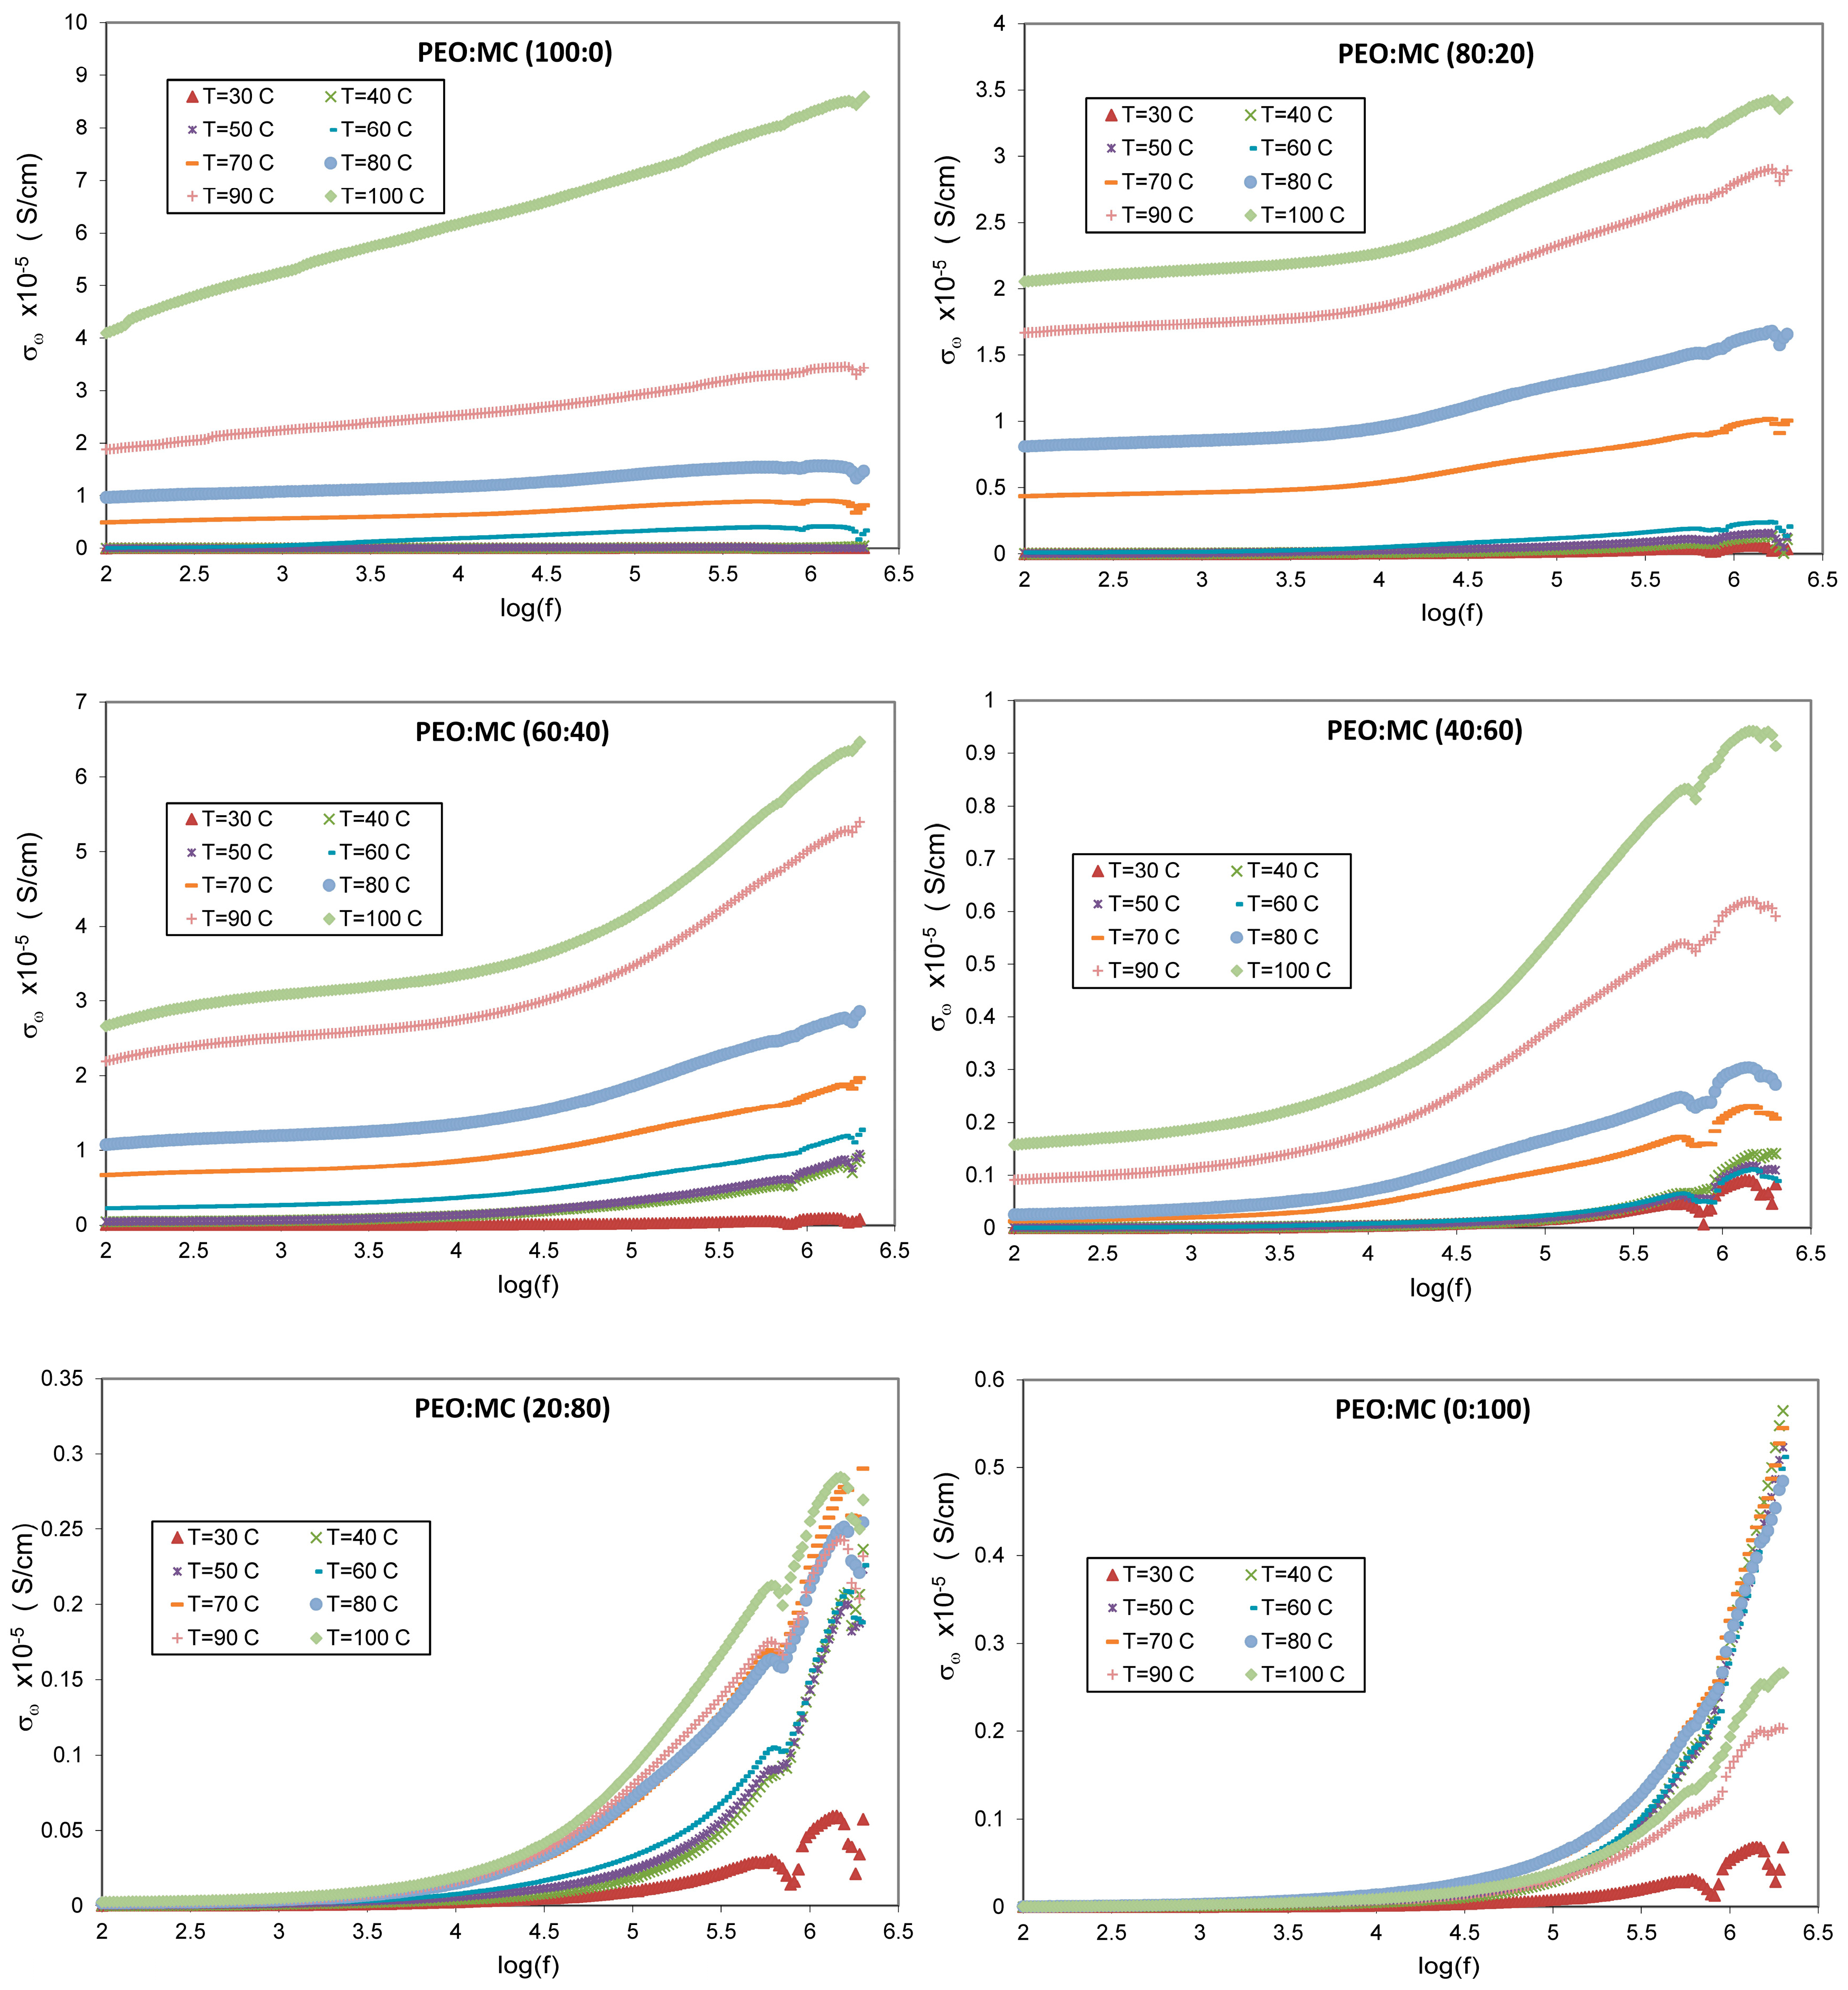
3.4. Impedance Analysis
3.5. Dielectric Studies
4. Conclusions
Author Contributions
Funding
Conflicts of Interest
References
- Ahmad Khiar, A.S.; Puteh, R.; Arof, A.K. Characterizations of chitosan-ammonium triflate (NH4CF3SO3) complexes by FTIR and impedance spectroscopy. Phys. Stat. Sol. (a) 2006, 203, 534–543. [Google Scholar] [CrossRef]
- Di Marco, G.; Lanza, M.; Pennisi, A.; Simone, F. Solid state electrochromic device: Behaviour of different salts on its performance. Solid State Ion. 2009, 127, 23–29. [Google Scholar] [CrossRef]
- Aziz, S.B.; Abdullah, O.G.; Rasheed, M.A. A novel polymer composite with a small optical band gap: New approaches for photonics and optoelectronics. J. Appl. Polym. Sci. 2017, 134, 44847. [Google Scholar] [CrossRef]
- Suhail, M.H.; Ramadan, A.A.; Aziz, S.B.; Abdullah, O.G. Chemical surface treatment with toluene to enhances sensitivity of NO2 gas sensor based on CuPcTs/Alq3 thin films. J. Sci. Adv. Mater. Devices 2017, 2, 301–308. [Google Scholar] [CrossRef]
- Abdulameer, A.F.; Suhail, M.H.; Abdullah, O.G.; Al-Essa, I.M. Fabrication and characterization of NiPcTs organic semiconductors based surface type capacitive-resistive humidity sensors. J. Mater. Sci. Mater. Electron. 2017, 28, 13472–13477. [Google Scholar] [CrossRef]
- Gurunathan, K.; Murugan, A.V.; Marimuthu, R.; Mulik, U.P.; Amalnerkar, D.P. Electrochemically synthesised conducting polymeric materials for applications towards technology in electronics, optoelectronics and energy storage devices. Mater. Chem. Phys. 1999, 61, 173–191. [Google Scholar] [CrossRef]
- Abdullah, O.G.; Salman, Y.A.K.; Saleem, S.A. Electrical conductivity and dielectric characteristics of in-situ prepared PVA/HgS nanocomposite films. J. Mater. Sci. Mater. Electron. 2016, 27, 3591–3598. [Google Scholar] [CrossRef]
- Hoffmann, B.; Volkmer, E.; Kokott, A.; Weber, M.; Hamisch, S.; Schieker, M.; Mutschler, W.; Ziegler, G. A new biodegradable bone wax substitute with the potential to be used as a bone filling material. J. Mater. Chem. 2007, 17, 4028–4033. [Google Scholar] [CrossRef]
- Abdullah, O.G.; Tahir, D.A.; Kadir, K. Optical and structural investigation of synthesized PVA/PbS nanocomposites. J. Mater. Sci. Mater. Electron. 2015, 26, 6939–6944. [Google Scholar] [CrossRef]
- Achari, V.B.; Reddy, T.J.R.; Sharma, A.K.; Rao, V.V.R.N. Electrical, optical, and structural characterization of polymer blend (PVC/PMMA) electrolyte films. Ionics 2007, 13, 349–354. [Google Scholar] [CrossRef]
- Aziz, S.B.; Faraj, M.G.; Abdullah, O.G. Impedance spectroscopy as a novel approach to probe the phase transition and microstructures existing in CS:PEO based blend electrolytes. Sci. Rep. 2018, 8, 14308. [Google Scholar] [CrossRef]
- Da Silva Neiro, S.M.; Dragunski, D.C.; Rubira, A.F.; Muniz, E.C. Miscibility of PVC/PEO blends by viscosimetric, microscopic and thermal analyses. Eur. Polym. J. 2000, 36, 583–589. [Google Scholar] [CrossRef]
- Ramesh, S.; Yahaya, A.H.; Arof, A.K. Miscibility studies of PVC blends (PVC/PMMA and PVC/PEO) based polymer electrolytes. Solid State Ion. 2002, 148, 483–486. [Google Scholar] [CrossRef]
- Abdullah, O.G.; Aziz, S.B.; Rasheed, M.A. Incorporation of NH4NO3 into MC-PVA blend-based polymer to prepare proton-conducting polymer electrolyte films. Ionics 2018, 24, 777–785. [Google Scholar] [CrossRef]
- Salman, Y.A.K.; Abdullah, O.G.; Hanna, R.R.; Aziz, S.B. Conductivity and electrical properties of chitosan-methylcellulose blend biopolymer electrolyte incorporated with lithium tetrafluoroborate. Int. J. Electrochem. Sci. 2018, 13, 3185–3199. [Google Scholar] [CrossRef]
- Aziz, S.B.; Abdullah, O.G.; Hussein, S.A.; Ahmed, H.M. Effect of PVA blending on structural and ion transport properties of CS:AgNt based polymer electrolyte membrane. Polymers 2017, 9, 622. [Google Scholar] [CrossRef]
- Yin, J.; Luo, K.; Chen, X.; Khutoryanskiy, V.V. Miscibility studies of the blends of chitosan with some cellulose ethers. Carbohyd. Polym. 2006, 63, 238–244. [Google Scholar] [CrossRef]
- Pereira, A.G.B.; Paulino, A.T.; Rubira, A.F.; Muniz, E.C. Polymer-polymer miscibility in PEO/cationic starch and PEO/hydrophobic starch blends. Express Polym. Lett. 2010, 4, 488–499. [Google Scholar] [CrossRef]
- Xu, S.; Ye, L. Preparation and properties of monomer casting nylon-6/PEO blend prepared via in situ polymerization. Polym. Eng. Sci. 2015, 55, 589–597. [Google Scholar] [CrossRef]
- Abdullah, O.G.; Hanna, R.R.; Salman, Y.A.K.; Aziz, S.B. Characterization of lithium ion-conducting blend biopolymer electrolyte based on CH-MC doped with LiBF4. J. Inorg. Organomet. Polym. Mater. 2018, 28, 1432–1438. [Google Scholar] [CrossRef]
- Nik Aziz, N.A.; Idris, N.K.; Isa, M.I.N. Solid polymer electrolytes based on methylcellulose: FT-IR and ionic conductivity studies. Int. J. Polym. Anal. Char. 2010, 15, 319–327. [Google Scholar] [CrossRef]
- Park, J.S.; Ruckenstein, E. Viscoelastic properties of plasticized methylcellulose and chemically crosslinked methylcellulose. Carbohyd. Polym. 2001, 46, 373–381. [Google Scholar] [CrossRef]
- Shuhaimi, N.E.A.; Teo, L.P.; Majid, S.R.; Arof, A.K. Transport studies of NH4NO3 doped methyl cellulose electrolyte. Synthetic Met. 2010, 160, 1040–1044. [Google Scholar] [CrossRef]
- Aziz, S.B.; Al-Zangana, S.; Woo, H.J.; Kadir, M.F.Z.; Abdullah, O.G. The compatibility of chitosan with divalent salts over monovalent salts for the preparation of solid polymer electrolytes. Results Phys. 2018, 11, 826–836. [Google Scholar] [CrossRef]
- Shukur, M.F.; Ithnin, R.; Illias, H.A.; Kadir, M.F.Z. Proton conducting polymer electrolyte based on plasticized chitosan-PEO blend and application in electrochemical devices. Opt. Mater. 2013, 35, 1834–1841. [Google Scholar] [CrossRef]
- Kadir, M.F.Z.; Aspanut, Z.; Yahya, R.; Arof, A.K. Chitosan-PEO proton conducting polymer electrolyte membrane doped with NH4NO3. Mater. Res. Innov. 2011, 15, s164–s167. [Google Scholar] [CrossRef]
- Ramly, K.; Isa, M.I.N.; Khiar, A.S.A. Conductivity and dielectric behaviour studies of starch/PEO + x wt-%NH4NO3 polymer electrolyte. Mater. Res. Innov. 2011, 15, s82–s85. [Google Scholar] [CrossRef]
- Bhide, A.; Hariharan, K. Ionic transport studies on (PEO)6:NaPO3 polymer electrolyte plasticized with PEG400. Eur. Polym. J. 2007, 43, 4253–4270. [Google Scholar] [CrossRef]
- Rajendran, S.; Sivakumar, P. An investigation of PVdF/PVC-based blend electrolytes with EC/PC as plasticizers in lithium battery applications. Physica B 2008, 403, 509–516. [Google Scholar] [CrossRef]
- Abdullah, O.G.; Saleem, S.A. Effect of copper sulfide nanoparticles on the optical and electrical behavior of poly(vinyl alcohol) films. J. Electron. Mater. 2016, 45, 5910–5920. [Google Scholar] [CrossRef]
- Mathew, C.M.; Kesavan, K.; Rajendran, S. Dielectric and thermal response of poly(vinylidene chloride-co-acrylonitrile/poly(methyl methacrylate) blend membranes. Polym. Int. 2015, 64, 750–757. [Google Scholar] [CrossRef]
- Wojdyr, M. Fityk: a general-purpose peak fitting program. J. Appl. Crystallogr. 2010, 43, 1126–1128. [Google Scholar] [CrossRef]
- Rani, N.S.; Sannappa, J.; Demappa, T. Effects of CdCl2 concentration on the structural, thermal and ionic conductivity properties of HPMC polymer electrolyte films. Ionics 2015, 21, 133–140. [Google Scholar] [CrossRef]
- Yu, C.; Xie, Q.; Bao, Y.; Shan, G.; Pan, P. Crystalline and spherulitic morphology of polymers crystallized in confined systems. Crystals 2017, 7, 147. [Google Scholar]
- Tang, Z.; Wang, J.; Chen, Q.; He, W.; Shen, C.; Mao, X.; Zhang, J. A novel PEO-based composite polymer electrolyte with absorptive glass mat for Li-ion batteries. Electrochim. Acta 2007, 52, 6638–6643. [Google Scholar] [CrossRef]
- Xi, J.; Tang, X. Novel composite polymer electrolyte comprising poly(ethylene oxide) and triblock copolymer/mesostructured silica hybrid used for lithium polymer battery. Electrochim. Acta 2005, 50, 5293–5304. [Google Scholar] [CrossRef]
- Sundar, M.; Selladurai, S. Effect of fillers on magnesium-poly(ethylene oxide) solid polymer electrolyte. Ionics 2006, 12, 281–286. [Google Scholar] [CrossRef]
- Pereira, A.G.B.; Paulino, A.T.; Nakamura, C.V.; Britta, E.A.; Rubira, A.F.; Muniz, E.C. Effect of starch type on miscibility in poly(ethylene oxide) (PEO)/starch blends and cytotoxicity assays. Mater. Sci. Eng. C 2011, 31, 443–451. [Google Scholar] [CrossRef]
- Polu, A.R.; Rhee, H.W.; Kim, D.K. New solid polymer electrolytes (PEO20–LiTDI–SN) for lithium batteries: structural, thermal and ionic conductivity studies. J. Mater. Sci. Mater. Electron. 2015, 26, 8548–8554. [Google Scholar] [CrossRef]
- Sengwa, R.J.; Choudhary, S.; Sankhla, S. Low frequency dielectric relaxation processes and ionic conductivity of montmorillonite clay nanoparticles colloidal suspension in poly(vinyl pyrrolidone)−ethylene glycol blends. Express Polym. Lett. 2008, 2, 800–809. [Google Scholar] [CrossRef]
- Thakur, A.K.; Pradhan, D.K.; Samantaray, B.K.; Choudhary, R.N.P. Studies on an ionically conducting polymer nanocomposite. J. Power Sources 2006, 159, 272–276. [Google Scholar] [CrossRef]
- Sengwa, R.J.; Sankhla, S.; Choudhary, S. Dielectric relaxation processes and ionic conduction behaviour in poly(ethylene oxide)–montmorillonite clay nanocomposite aqueous colloidal suspensions. Colloid Polym. Sci. 2009, 287, 1013–1024. [Google Scholar] [CrossRef]
- Abdullah, O.G.; Hanna, R.R.; Salman, Y.A.K. Structural, optical, and electrical characterization of chitosan: methylcellulose polymer blends based film. J. Mater. Sci. Mater. Electron. 2017, 28, 10283–10294. [Google Scholar] [CrossRef]
- Aziz, S.B.; Abdullah, O.G.; Hussein, S.A. Role of silver salts lattice energy on conductivity drops in chitosan based solid electrolyte: Structural, morphological and electrical characteristics. J. Electron. Mater. 2018, 47, 3800–3808. [Google Scholar] [CrossRef]
- Aziz, S.B.; Abdullah, O.G.; Saeed, S.R.; Ahmed, H.M. Electrical and dielectric properties of copper ion conducting solid polymer electrolytes based on chitosan: CBH model for ion transport mechanism. Int. J. Electrochem. Sci. 2018, 13, 3812–3826. [Google Scholar] [CrossRef]
- Croce, F.; Sacchetti, S.; Scrosati, B. Advanced, high-performance composite polymer electrolytes for lithium batteries. J. Power Sources 2006, 161, 560–564. [Google Scholar] [CrossRef]
- Miyamoto, T.; Shibayama, K. Free-volume model for ionic conductivity in polymers. J. Appl. Phys. 1973, 44, 5372–5376. [Google Scholar] [CrossRef]
- Ramesh, S.; Yahaya, A.H.; Arof, A.K. Dielectric behaviour of PVC-based polymer electrolytes. Solid State Ion. 2002, 152–153, 291–294. [Google Scholar] [CrossRef]
- Parameswaran, V.; Nallamuthu, N.; Devendran, P.; Nagarajan, E.R.; Manikandan, A. Electrical conductivity studies on Ammonium bromide incorporated with Zwitterionic polymer blend electrolyte for battery application. Physica B: Condens. Mat. 2017, 515, 89–98. [Google Scholar] [CrossRef]
- Farag, A.A.M.; Mansour, A.M.; Ammar, A.H.; Rafea, M.A.; Farid, A.M. Electrical conductivity, dielectric properties and optical absorption of organic based nanocrystalline sodium copper chlorophyllin for photodiode application. J. Alloy. Compd. 2012, 513, 404–413. [Google Scholar] [CrossRef]
- Ng, L.S.; Mohamad, A.A. Effect of temperature on the performance of proton batteries based on chitosan–NH4NO3–EC membrane. J. Membrane Sci. 2008, 325, 653–657. [Google Scholar] [CrossRef]
- Shuhaimi, N.E.A.; Teo, L.P.; Woo, H.J.; Majid, S.R.; Arof, A.K. Electrical double-layer capacitors with plasticized polymer electrolyte based on methyl cellulose. Polym. Bull. 2012, 69, 807–826. [Google Scholar] [CrossRef]
- Buraidah, M.H.; Arof, A.K. Characterization of chitosan/PVA blended electrolyte doped with NH4I. J. Non-Cryst. Solids 2011, 357, 3261–3266. [Google Scholar] [CrossRef]
- Yusof, Y.M.; Shukur, M.F.; Illias, H.A.; Kadir, M.F.Z. Conductivity and electrical properties of corn starch-chitosan blend biopolymer electrolyte incorporated with ammonium iodide. Phys. Scripta 2014, 89, 035701. [Google Scholar] [CrossRef]
- Sengwa, R.J.; Choudhary, S.; Sankhla, S. Dielectric behaviour and relaxation processes of montmorillonite clay nano-platelet colloidal suspensions in poly(vinyl pyrrolidone)-ethylene glycol oligomer blends. Polym. Int. 2009, 58, 781–789. [Google Scholar] [CrossRef]
- Arya, A.; Sharma, A.L. Structural, electrical properties and dielectric relaxations in Na+-ion-conducting solid polymer electrolyte. J. Phys. Condens. Mat. 2018, 30, 165402. [Google Scholar] [CrossRef]
- Singh, N.; Agarwal, A.; Sanghi, S. Dielectric relaxation, conductivity behavior and magnetic properties of Mg substituted Zn–Li ferrites. Curr. Appl. Phys. 2011, 11, 783–789. [Google Scholar] [CrossRef]
- Pradhan, D.K.; Choudhary, R.N.P.; Samantaray, B.K. Studies of dielectric and electrical properties of plasticized polymer nanocomposite electrolytes. Mater. Chem. Phys. 2009, 115, 557–561. [Google Scholar] [CrossRef]
- Saif, A.A.; Poopalan, P. AC conductivity and dielectric relaxation behavior of sol-gel BaxSr1−xTiO3 thin films. J. Mater. Sci. Technol. 2011, 27, 802–808. [Google Scholar] [CrossRef]
- Abdullah, O.G.; Aziz, S.B.; Saber, D.R. Characterizations of pure and Pb2+ ion doped methylcellulose based biopolymer electrolyte films: Optical and electrical properties. Int. J. Electrochem. Sci. 2018, 13, 11931–11952. [Google Scholar] [CrossRef]
- Yakuphanoglu, F. Electrical conductivity and electrical modulus properties of α, ω-dihexylsexithiophene organic semiconductor. Physica B: Condens. Mat. 2007, 393, 139–142. [Google Scholar] [CrossRef]
- Das, S.; Ghosh, A. Ion conduction and relaxation in PEO-LiTFSI-Al2O3 polymer nanocomposite electrolytes. J. Appl. Phys. 2015, 117, 174103. [Google Scholar] [CrossRef]
- Ravi, M.; Bhavani, S.; Kumar, K.K.; Rao, V.V.R.N. Investigations on electrical properties of PVP:KIO4 polymer electrolyte films. Solid State Sci. 2013, 19, 85–93. [Google Scholar] [CrossRef]


| PEO:MC Ratio | First Peak | Second Peak | Third Peak | Forth Peak | Degree of Crystallinity % | ||||
|---|---|---|---|---|---|---|---|---|---|
| Center | FWHM | Center | FWHM | Center | FWHM | Center | FWHM | ||
| 100:0 | 23.311 | 0.714 | 19.153 | 0.470 | 26.649 | 1.105 | --- | --- | 32.33 |
| 80:20 | 19.233 | 0.252 | 23.383 | 0.589 | 26.303 | 0.263 | 27.041 | 0.252 | 21.48 |
| 60:40 | 19.209 | 0.267 | 23.373 | 0.604 | 26.603 | 1.040 | --- | --- | 15.86 |
| 40:60 | 19.161 | 0.228 | 23.317 | 0.625 | 20.507 | 4.176 | 26.942 | 1.657 | 16.37 |
| 20:80 | 20.165 | 4.337 | 23.308 | 0.610 | 19.162 | 0.213 | --- | --- | 16.81 |
| 0:100 | 20.786 | 5.173 | 19.656 | 4.619 | 21.594 | 1.858 | --- | --- | 16.10 |
| PEO:MC Ratio | 10−6) (S/cm), at Different Temperatures | |||||||
|---|---|---|---|---|---|---|---|---|
| 303 K | 313 K | 323 K | 333 K | 343 K | 353 K | 363 K | 373 K | |
| (100:0) | 0.0013 | 0.0034 | 0.0103 | 0.1117 | 4.9682 | 9.6273 | 18.800 | 40.939 |
| (80:20) | 0.0016 | 0.0132 | 0.0324 | 0.1155 | 4.3675 | 8.0903 | 16.647 | 20.537 |
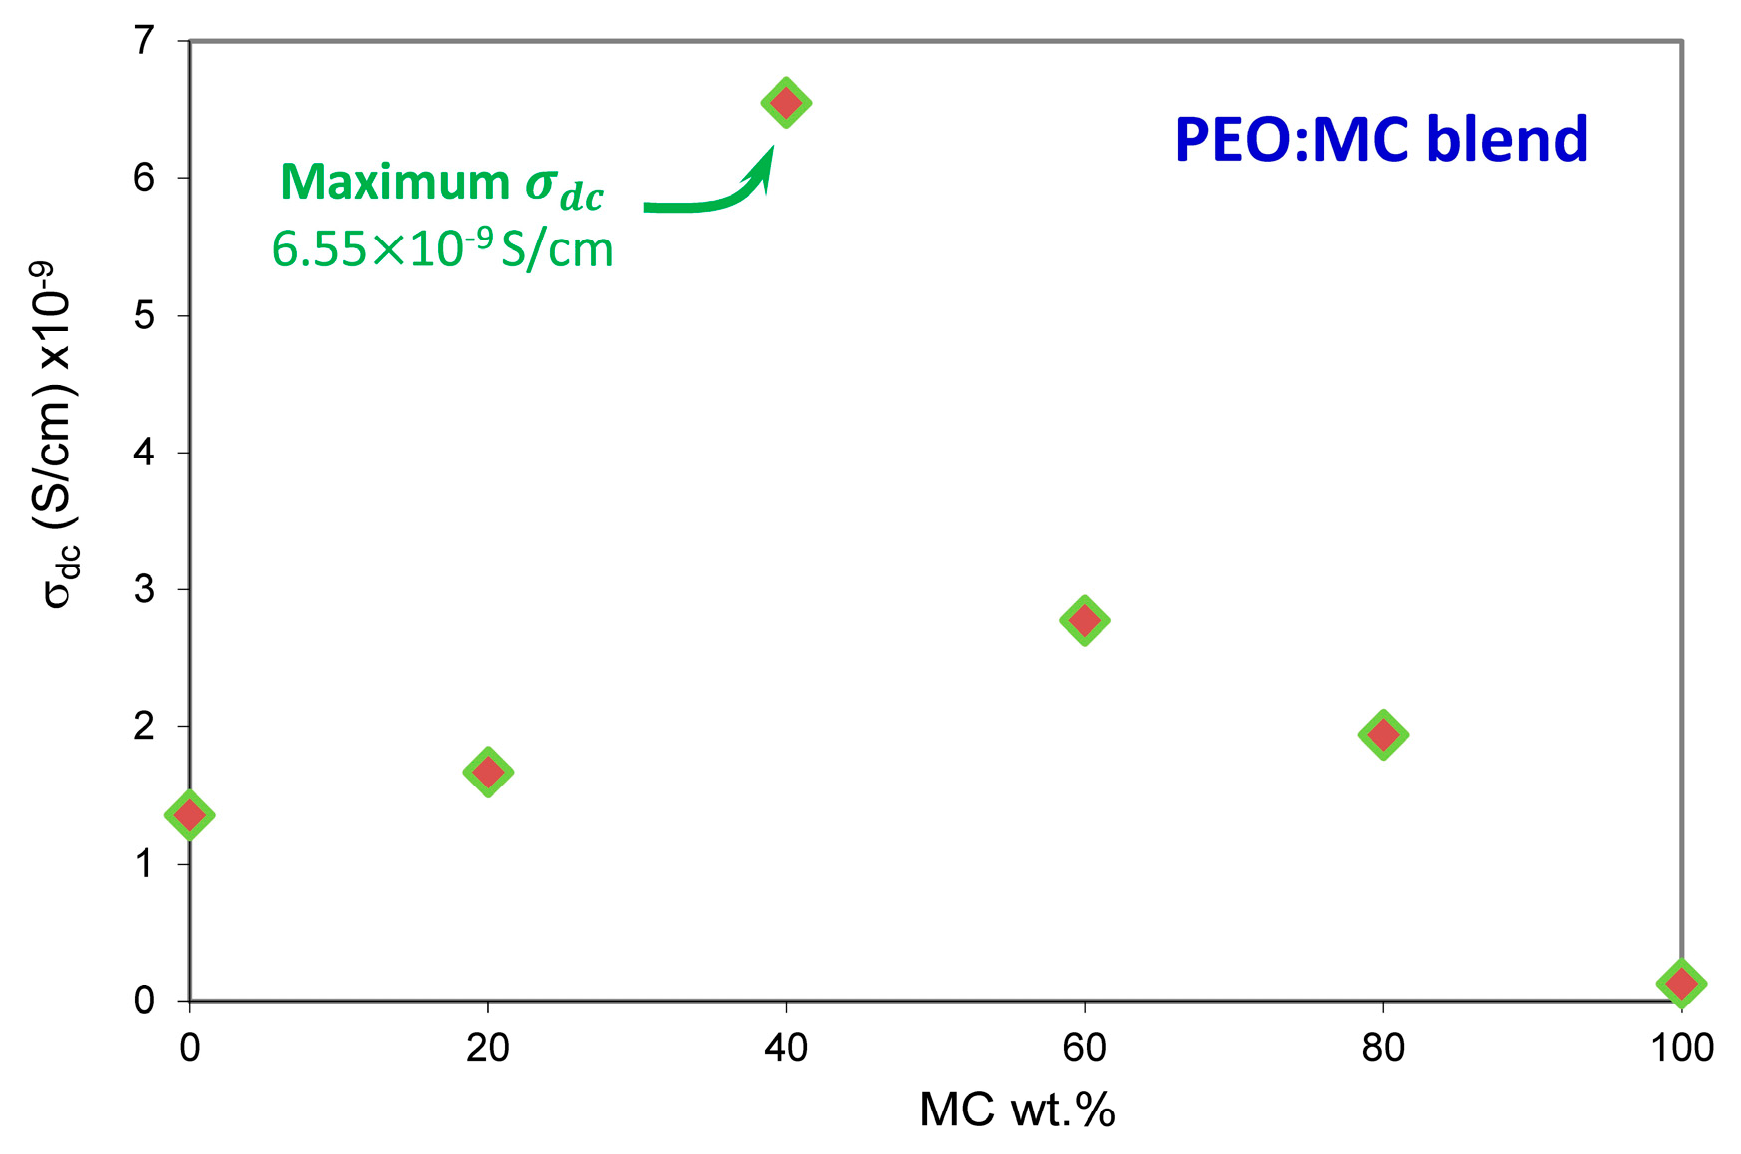
| (60:40) | 0.0065 | 0.4712 | 0.5109 | 2.2839 | 6.6989 | 10.748 | 21.898 | 26.677 |
| (40:60) | 0.0027 | 0.0018 | 0.0023 | 0.0039 | 0.1267 | 0.2457 | 0.9164 | 1.5767 |
| (20:80) | 0.0019 | 0.0016 | 0.0022 | 0.0020 | 0.0149 | 0.0169 | 0.0180 | 0.0249 |
| (0:100) | 0.0001 | 0.0019 | 0.0032 | 0.0029 | 0.0038 | 0.0050 | 0.0040 | 0.0063 |
| Temperature (K) | FWHM | |
|---|---|---|
| 313 | 2.169 | 0.525 |
| 323 | 2.078 | 0.548 |
| 333 | 1.760 | 0.647 |
| 343 | 1.684 | 0.676 |
| 353 | 1.480 | 0.770 |
| 363 | 1.454 | 0.784 |
| 373 | 1.428 | 0.798 |
© 2019 by the authors. Licensee MDPI, Basel, Switzerland. This article is an open access article distributed under the terms and conditions of the Creative Commons Attribution (CC BY) license (http://creativecommons.org/licenses/by/4.0/).
Share and Cite
Ahmed, H.T.; Abdullah, O.G. Preparation and Composition Optimization of PEO:MC Polymer Blend Films to Enhance Electrical Conductivity. Polymers 2019, 11, 853. https://doi.org/10.3390/polym11050853
Ahmed HT, Abdullah OG. Preparation and Composition Optimization of PEO:MC Polymer Blend Films to Enhance Electrical Conductivity. Polymers. 2019; 11(5):853. https://doi.org/10.3390/polym11050853
Chicago/Turabian StyleAhmed, Hawzhin T., and Omed Gh. Abdullah. 2019. "Preparation and Composition Optimization of PEO:MC Polymer Blend Films to Enhance Electrical Conductivity" Polymers 11, no. 5: 853. https://doi.org/10.3390/polym11050853
APA StyleAhmed, H. T., & Abdullah, O. G. (2019). Preparation and Composition Optimization of PEO:MC Polymer Blend Films to Enhance Electrical Conductivity. Polymers, 11(5), 853. https://doi.org/10.3390/polym11050853