Article

Tethered Semiflexible Polymer under Large Amplitude Oscillatory Shear

by
Antonio Lamura
1,* and
Roland G. Winkler
2,*
1
Istituto Applicazioni Calcolo, CNR, Via Amendola 122/D, 70126 Bari, Italy
2
Theoretical Soft Matter and Biophysics, Institute for Advanced Simulation, Forschungszentrum Jülich, D-52425 Jülich, Germany
*
Authors to whom correspondence should be addressed.
Polymers 2019, 11(4), 737; https://doi.org/10.3390/polym11040737
Submission received: 27 March 2019 / Revised: 17 April 2019 / Accepted: 18 April 2019 / Published: 23 April 2019

Abstract

:
The properties of a semiflexible polymer with fixed ends exposed to oscillatory shear flow are investigated by simulations. The two-dimensionally confined polymer is modeled as a linear bead-spring chain, and the interaction with the fluid is described by the Brownian multiparticle collision dynamics approach. For small shear rates, the tethering of the ends leads to a more-or-less linear oscillatory response. However, at high shear rates, we found a strongly nonlinear reaction, with a polymer (partially) wrapped around the fixation points. This leads to an overall shrinkage of the polymer. Dynamically, the location probability of the polymer center-of-mass position is largest on a spatial curve resembling a limaçon, although with an inhomogeneous distribution. We found shear-induced modifications of the normal-mode correlation functions, with a frequency doubling at high shear rates. Interestingly, an even-odd asymmetry for the Cartesian components of the correlation functions appears, with rather similar spectra for odd x- and even y-modes and vice versa. Overall, our simulations yielded an intriguing nonlinear behavior of tethered semiflexible polymers under oscillatory shear flow.

Graphical Abstract

1. Introduction

The structural and rheological properties of polymers are strongly affected by external fields, such as shear or extensional flows. As such, this is well established, and the external fields provide means to control the behavior of polymer solutions, melts, and networks [1,2,3,4,5]. Similarly, it has been shown that the macroscopic rheological behavior of a polymer solution, e.g., shear-rate dependent viscosities, normal-stress differences, and shear thinning, are tightly linked to the microscopic polymer conformational and dynamical properties [5,6,7,8,9,10,11]. Hence, insight into the behavior of individual polymers is fundamental in the strive to unravel the macroscopic nonequilibrium polymer properties.
Direct observation of the nonequilibrium properties of single molecules, also termed “molecular rheology” [5], in experiments [12,13,14,15,16,17,18,19] and simulations [10,13,20,21,22,23,24,25,26,27,28,29,30,31,32,33,34,35,36,37,38,39,40,41,42,43,44] has provided valuable visual illustrations of polymer conformations and has helped to characterize their nonequilibrium properties in terms of their deformation, orientation, relaxation dynamics, and rheology, both for free and tethered molecules in shear and extensional flow. These studies, however, typically probe the linear viscoelastic properties, which are usually insufficient to fully characterize the nonlinear aspects of polymers under flow.
In order to probe nonlinear properties of complex fluids, the large-amplitude oscillatory shear (LAOS) method was developed [19,45,46,47,48]. Here, in contrast to small-amplitude oscillatory shear, the stress response is typically no longer sinusoidal, but of rather complex shape. Such strong, time-dependent flows will affect the conformational properties of individual polymers to a yet unresolved extent. Studies on the dynamics of single polymers under large-amplitude oscillatory extensional flow yield qualitatively different stretching flow-rate curves (Lissajous curves) as a function of the extension rate and the oscillation frequency [19], and illustrate the complex interplay between time-dependent flows and polymer conformations. Here, further studies are desirable to resolve the time-dependent conformational properties of single polymers under large-amplitude oscillatory flows, aspects which, so far, have not been addressed by simulations.
In this article, we perform non-hydrodynamic, Brownian-type simulations of individual polymers exposed to large-amplitude oscillatory shear. The ends of the polymer are fixed and the polymer dynamics is constraint to the x y -plane of a Cartesian reference frame. We consider stiffer polymers only, with the persistence lengths L p / L = 1 / 2 and 2, respectively ( L p is the persistence and L the polymer contour length). In any case, the polymers exhibit cyclic conformational modulations, specifically at higher Weissenberg numbers ( W i ), which is the product of the applied shear rate and the longest polymer relaxation time. The tethering of the ends leads to a more-or-less linear oscillatory response at small Weissenberg numbers, where a polymer moves back and forth like grass swaying in the wind. With increasing W i , polymers (partially) wrap around the fixation points and shrink. In general, the probability of the center-of-mass position is largest on a limaçon-type curve, as a consequence of the periodic excitation, however, with a non-uniform probability. Interestingly, the center-of-mass autocorrelation function normal to the line connecting the tethering points exhibits frequency doubling with respect to the imposed shear frequency, as a consequence of the non-crossability of the polymer and the tethering points. This reflects the symmetry breaking of the polymer dynamics during an oscillation cycle. Our findings illustrated the complex nonlinear interplay of polymer internal degrees of freedom and external periodic oscillations.
The rest of the paper is organized as follows. In Section 2, the polymer model and the coupling to the shear flow are described. Section 3 presents results for conformational and dynamical properties. Our findings are summarized in Section 4.

2. Model and Method

The two-dimensional linear polymer chain is composed of N beads of mass M, with its ends, r 1 , r N , tethered at r 1 = ( H / 2 , 0 ) T and r N = ( H / 2 , 0 ) T , respectively (cf. Figure 1). The contour length L = ( N 1 ) r 0 , where r 0 is the bond length, is fixed and L > H . The interactions between the beads are defined in terms of the potential U = U b o n d + U b e n d + U e x , comprising bond, bending, and excluded-volume interactions. The bonds between consecutive beads are described by the harmonic potential:
U b o n d = κ h 2 i = 1 N 1 ( | r i + 1 r i | r 0 ) 2 ,
where r i is the position of bead i ( i = 1 , , N ) and κ h is the elastic constant. Bending restrictions are captured by the potential:
U b e n d = κ i = 1 N 2 ( 1 cos φ i ) ,
with κ the bending rigidity and φ i the angle between two consecutive bond vectors. In the limit κ , the persistence length is given by L p = 2 κ r 0 / k B T , with T the temperature and k B Boltzmann’s constant. Bead overlapping and bond crossings are prevented by the shifted and truncated Lennard–Jones potential:
U e x = 4 ϵ σ r 12 σ r 6 + 1 4 Θ ( 2 1 / 6 σ r ) ,
where r is the distance between two non-bonded beads, and Θ ( r ) is the Heaviside function; Θ ( r ) = 0 for r < 0 and Θ ( r ) = 1 for r > 0 . The dynamics of the beads is described by Newton’s equations of motion, which are integrated by the velocity-Verlet algorithm with time step Δ t p [49,50].
The polymer is coupled to a Brownian heat bath implemented via the Brownian (or random) multiparticle collision dynamics (B-MPC) approach [51,52,53]. Hence, no hydrodynamic effects are considered in the present work. MPC consist of streaming and collision steps, where collisions occur in regular time intervals of length Δ t [52,54]. During streaming, the dynamics of the beads is described by Newton’s equations of motion. In the collision step, the velocities of the beads change in a stochastic manner. In B-MPC, the Brownian interaction of a bead with the surrounding fluid is implemented by a stochastic collision with a phantom particle, taking its momentum from the Maxwell–Boltzmann distribution of variance M k B T and a mean, which is zero in absence of shear. In the presence of oscillatory shear in the x y -plan the mean momentum is M v i s ( t ) , with the shear velocity:
v i s ( t ) = γ ˙ y i cos ( ω t ) , 0 T
at the time t; γ ˙ is the shear rate and ω the frequency (cf. Figure 1). The collision is implemented via the stochastic rotation dynamics variant of MPC [52,55,56]. Here, the relative velocity of a bead, with respect to the mean of the velocities of the bead and related phantom particle, is randomly rotated by angles ± α .
We choose the following parameters for the simulations: α = 130 , M = 5 , Δ t = 0.1 t u , with the time unit t u = M r 0 2 / ( 5 k B T ) , κ h r 0 2 / ( k B T ) = 4 × 10 3 , ϵ / ( k B T ) = 1 , σ = r 0 , N = 101 , hence, the polymer length is L = 100 r 0 , and Δ t p = 10 2 Δ t . The value of κ h guarantees that the polymer length is constant within 1 % for all considered systems. Two bending rigidities are considered, corresponding to the persistence lengths L p / L = 0.5 and 2.
Simulations of free polymers yield the longest relaxations times τ r / t u = 1.9 × 10 6 and τ r / t u = 3.9 × 10 6 for the two stiffness values, determined from the end-to-end vector correlation function [11,40]. The strength of the shear flow is characterized by the Weissenberg number W i = τ r γ ˙ , for which the values W i = 10 , 25 , 50 , and 100 are considered. The frequency ω is related to the Deborah number D e = τ r ω , where we set D e = 10 .
The polymer, with H = L / 5 , is initialized with beads along a semi-elliptical contour with the major axis along the y-direction and minor axis along the x-axis. The polymers are equilibrated up to 5 × 10 6 t u > τ r , and data are collected up to the longest simulated time t L = 10 8 t u .

3. Results

The oscillatory flow dragged the beads along and, at least at small shear rates, the polymer moved back and forth like grass swaying in the wind. This is illustrated in Figure 2. The stiffer polymer ( L p / L = 2 ) closely maintained its shape at low shear rates (Figure 2b). A flexible polymer was deformed more easily, but an in-phase oscillation was still present (Figure 2a). Larger Weissenberg numbers led to stronger conformational changes and larger bead displacements (Figure 2c–h).

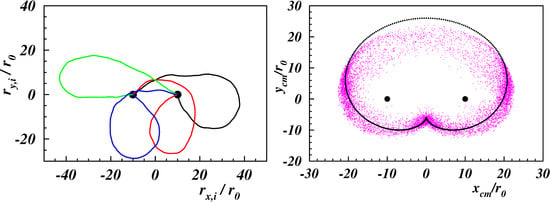
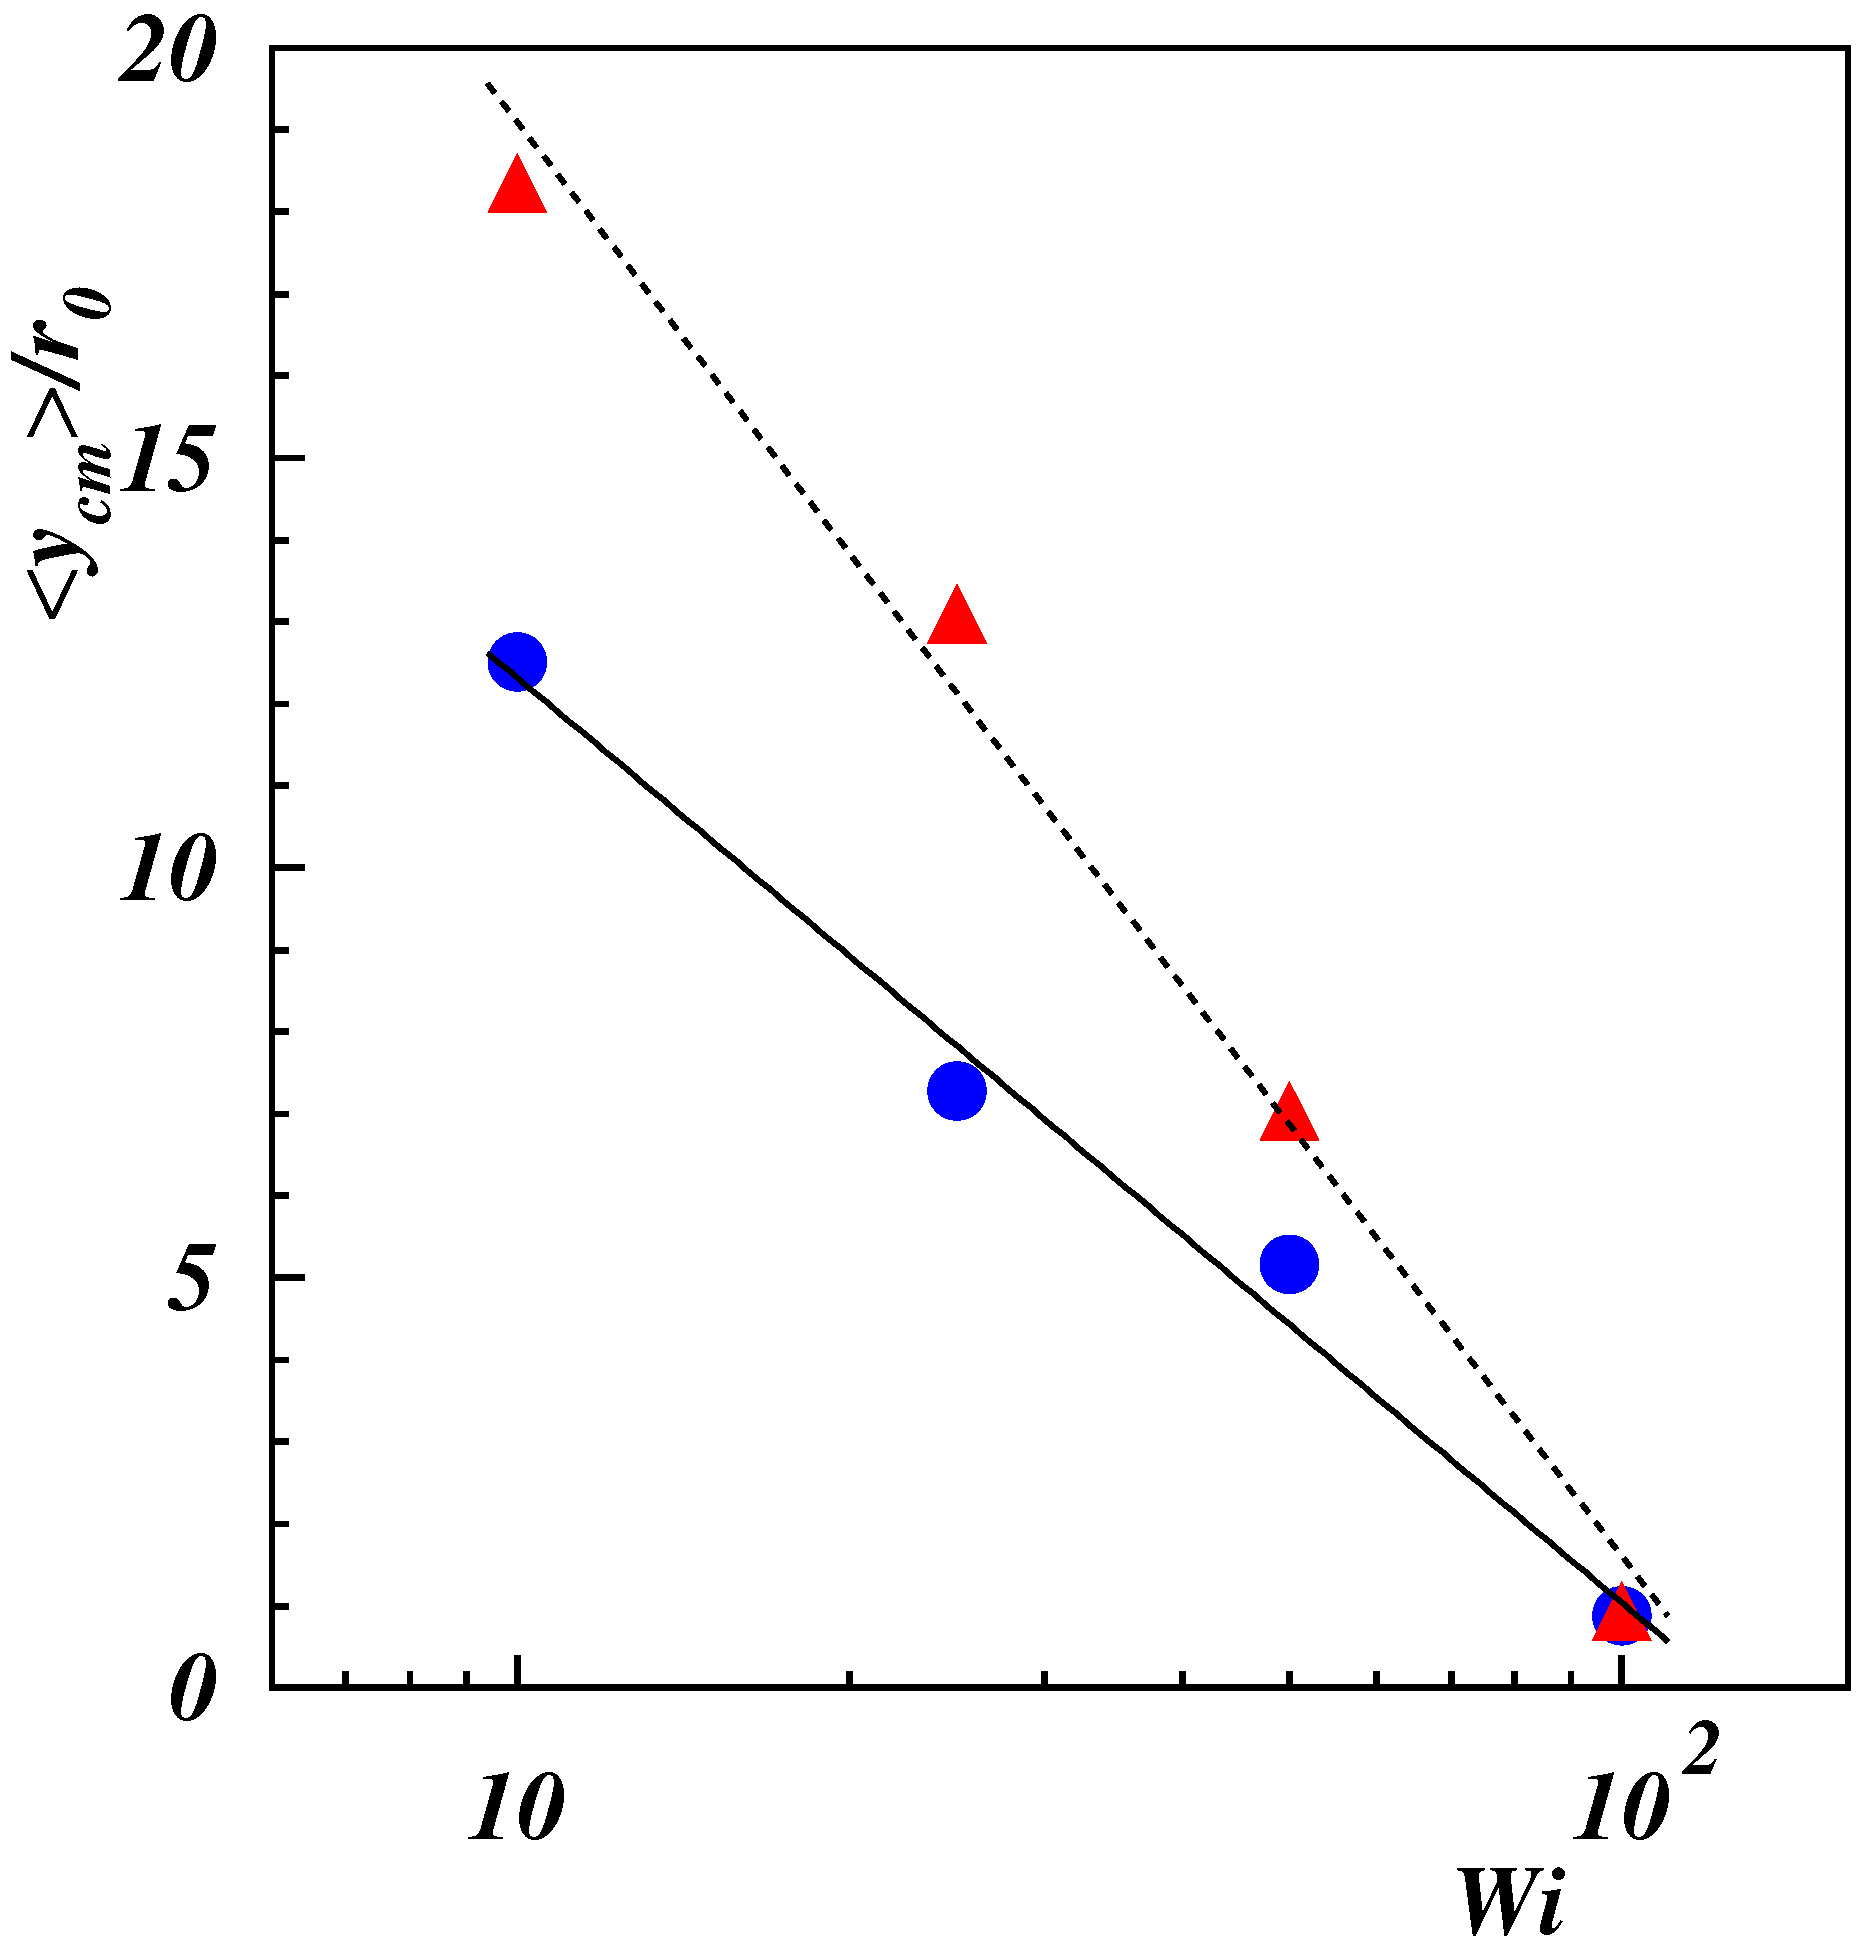
3.1. Center-of-Mass Properties

Figure 3 shows the time-dependence of the x-coordinate of the center-of-mass position for various Weissenberg numbers. For smaller W i 25 , entropic effects were strong, and x c m was only partially following the external flow. Perturbations were stronger when the polymer got trapped by the fixation points and some time was needed to disentangle it (cf. Supplementary Movies for L p / L = 0.5 , 2 and W i = 25 ). There were in-phase periods with a small phase shift, which were interrupted by time intervals with a center-of-mass motion decoupled from the flow. A stronger flow ( W i 50 ) enhanced the in-phase periodic motion, but the center-of-mass dynamics was phase shifted and seemed to be no longer harmonic. The modulations of the approximately periodic peaks became more pronounced for W i = 100 , and an original single peak split into two peaks, with the minimum of the second peak close to zero. Hence, x c m exhibited an approximate doubling of the frequency, an aspect which is more closely discussed in Section 3.2.2 in the context of normal modes. Overall, we found a highly nonlinear response of the polymer to the external excitation. This modified the polymer conformational and dynamical properties (cf. Supplementary Movies for L p / L = 0.5 , 2 and W i = 100 ).
Figure 4 depicts the probability distribution of the center-of-mass position for various Weissenberg numbers. The probability was high for positive y c m -values, specifically at lower W i . This was related to the chosen initial conditions, with a polymer always in the half-plane y > 0 . Evidently, the polymers were too stiff to restore isotropy normal to the shear-flow direction. The anisotropy was maintained at higher W i . However, the most probable center-of-mass position shifted gradually to larger | x c m | . At large Weissenberg numbers, the probability increased in the vicinity of x c m = 0 . As illustrated in Figure 2g,h, the polymers were wrapped around the tethering points by the flow. Overall, the probability of the center-of-mass position was highest on a limaçon-type curve, however, with a non-uniform distribution. A limaçon is defined as a curve formed by the path of a point fixed to a circle, when that circle rolls around the outside of a circle of equal radius. In our case, the shear flow (partially) rotated (oscillated) the semiflexible polymer of more-or-less circular shape, which looked like rolling, and the center-of-mass followed a limaçon.
The polar coordinate representation of a limaçon is r = a + b cos θ , and the parameter representation for our reference frame is [57]:
x = r cos θ = a + b sin θ cos θ ,
y = y 0 + r sin θ = y 0 + a + b sin θ sin θ ,
with the off-set y 0 . The fits of Equations (5) and (6) to our simulation results for L p / L = 2 are displayed in Figure 4. For W i = 10 , the limaçon was hardly distinguishable from an ellipse. With increasing Weissenberg number, we approached a limaçon, and for W i = 100 , the limaçon turned into a cardioid, where a = b . The limaçon curves for W i = 50 , and especially W i = 100 , did not fully agree with the simulation data for y c m / r 0 10 . The reason was the conformational freedom of the polymer and shear-induced shape changes, implying changes in the radii of the rolling circles underlaying the mathematical limaçon construction. These changes were most pronounced while the polymer explored regions of high shear rate.
The distribution functions for the center-of-mass Cartesian coordinates of the polymers are displayed in Figure 5. The distribution function for P ( x c m ) (Figure 5a,b) is symmetric with respect to the center between the tethered ends. At small shear, distinct “off-center” peaks were present as a consequence of the projection onto the x-axis. With the increasing Weissenberg number, the peaks became more pronounced and shift closer to the end positions. This is also reflected in the variance x c m 2 , which increased with W i . At high Weissenberg numbers, a peak appeared in the center, reflecting the polymer “wrapping” around the fixed ends. The asymmetry in the initial condition of y c m is also reflected in Figure 5c,d, with a pronounced peak at positive y c m . The probability of smaller y c m increased with increasing W i , and for W i 100 , a peak appeared at y c m < 0 , consistent with the high probability in the vicinity of x c m = 0 of Figure 4g,h. The snapshots in Figure 2g,h show stretching and alignment along the x-direction of the polymer-part between the fixed end point and the point where wrapping around the other fixed end appears. For such conformations, the major parts of the polymer were at y < 0 . The wrapping combined with the reversal of the polymer advective dynamics resulted in a slow lateral dynamics, resulting in a high probability with y c m < 0 . Yet, the average y c m was always positive, as shown in Figure 6, but decreased quickly with increasing W i . A fit with the logarithmic Weissenberg-dependence y c m = β r 0 ln W i yielded β = 4.9 and 7.6 for L p / L = 1 / 2 and 2, respectively. Evidently, the drop is more pronounced for the stiffer polymer.
The stronger conformational changes with increasing strength of the shear flow imply a shrinkage of the polymer. The mean square radius of gyration shrinks by 10–15%, with respect to non-sheared conformation.

3.2. Conformational Properties

3.2.1. Normal Mode Expansion

We studied the internal polymer conformational and dynamical properties via the mode amplitudes A n ( t ) = ( A n x ( t ) , A n y ( t ) ) T of the eigenfunction expansion of a polymer with fixed ends [58],
r i = H ( 2 i N 1 ) 2 ( N 1 ) x ^ + 2 n = 1 N 1 A n sin ( q n [ i 1 ] ) ,
with x ^ the unit vector along the x-axis and the wave numbers q n = n π / ( N 1 ) ( n = 1 , , N 1 ). The mode amplitudes are:
A n = 1 N 1 i = 1 N 1 S i sin ( q n [ i 1 ] ) ,
in terms of the bead positions S i x = r i x ( 2 i N 1 ) H / 2 ( N 1 ) and S i y = r i y ( i = 1 , , N ).
The mean, S , and mean square, S 2 , values of the components of S are displayed in Figure 7 for L p / L = 2 . The behavior was qualitatively similar for L p / L = 1 / 2 . The shape of S x was centrosymmetric with respect the polymer center i = 50 . Any deviation was a consequence of statistical inaccuracy. The magnitude | S x | decreased significantly with the increasing Weissenberg number, and the mean was close to zero for W i = 100 . The component S y was always positive and the largest amplitude was naturally in the polymer center. With increasing W i , the amplitudes shrunk, and S y was close to zero for all beads. The mean square values S y 2 (Figure 7, right) decreased with increasing W i . However, S x 2 changed in a nonmonotonic manner, and the fluctuations were larger for W i = 50 than for W i = 100 . This was a consequence of the symmetry-breaking shear flow with respect to the x-axis and the wrapping of the polymers around the tethering points.
Figure 8 depicts the dependence of the variance of the mode amplitudes:
δ A n 2 = A n A n 2 ,
on the mode number for the two stiffness values and the various Weissenberg numbers. For small W i , we obtained a 1 / n 4 dependence as characteristic for stiff polymers [59,60]. This even applied over a range of mode numbers 4 < n 40 at higher shear. However, the variances of the lower-mode amplitudes deviated from this dependence, with a weaker mode-number dependence for small n, and a rapid drop from mode n = 3 to n = 4 . This reflected the large-scale conformational changes by the wrapping of the polymers.

3.2.2. Dynamical Properties

Since the large-scale properties of the polymer were modified most by the shear flow, we more closely considered the dynamics of the mode amplitudes for the modes n = 1 and 2 by the mode-autocorrelation function C n ( t ) = A n ( t ) · A n ( 0 ) . Results for various Weissenberg numbers and the persistence length L p / L = 2 are presented in Figure 9. The simulation data were analyzed by fitting the exponentially damped periodic function:
F ( t ) = e γ t / T 0 cos ( Ω ω t ) ,
where T 0 = 2 π / ω is the period of the applied oscillation, γ characterizes the damping, and Ω accounts for variations of ω . The correlation C 1 x ( t ) = A 1 x ( t ) A 1 x ( 0 ) , in Figure 9a, decreased at short times and increased again for t / T 0 > 1 / 2 . Fitting yielded a factor Ω 1.2 , i.e., C 1 x ( t ) followed roughly the shear flow. At high Weissenberg numbers, an additional weak modulation appeared, which, however, did not change the primary frequency. The decay of the correlation function C 1 y ( t ) = A 1 y ( t ) A 1 y ( 0 ) showed a strong Weissenberg number dependence. As depicted in Figure 9b, C 1 y ( t ) depended only very weakly on time for W i = 10 . With the increasing Weissenberg number, the decay rate, γ , increased, and the correlation function showed damped oscillations, which were most pronounced for W i = 100 . Interestingly, the characteristic frequency was twice the externally applied frequency ( Ω 1.8 ). The correlation function C 2 x ( t ) exhibited a very similar time and Weissenberg number dependence as C 1 y ( t ) (cf. Figure 9c), in terms of drop at the various W i , as well as the characteristic frequency. The correlation C 2 y ( t ) (cf. Figure 9d) was very similar to C 1 x ( t ) , where the fitted expression closely followed the simulation data. Here, we found Ω 1 , i.e., the external frequency, but the decay was stronger with γ 1.4 . Moreover, within both sets of correlation functions, the exponential decay depended only weakly on the Weissenberg number. It was easily recognized that there was an odd-even asymmetry between the x- and y-correlation functions. This asymmetry was also obtained for higher mode numbers.
Theoretical models of flexible and semiflexible polymers predict an exponential decay of the normal-mode correlation functions of the form e t / τ n , where the τ n are the relaxation times [6,61]. In the presence of external fields, e.g., shear flow, the time dependence is modified and the normal-mode correlation functions do not necessarily decay exponentially anymore [11], but the exponential factor is still determined by the relaxation times. We did find an initial exponential decay, but no clear mode-number dependence. Figure 8 shows a deviation of the smaller mode numbers from the dependence τ n 1 / n 4 , but the relaxation times of the modes n = 1 and 2 were still different. This is not reflected in Figure 9, where the decay of A 1 x ( t ) A 1 x ( 0 ) and A 2 y ( t ) A 2 y ( 0 ) differs by approximately a factor of 2.5 , which is roughly the ratio of the mode numbers. Hence, the oscillatory flow field strongly affected the relaxation times, at least at higher Weissenberg numbers. This reflects and is consistent with a rather nonlinear response of the polymer with respect to the external periodic excitation.
The autocorrelation functions for the center-of-mass Cartesian coordinates displayed in Figure 10 help to understand the appearance of the frequency doubling. Evidently, both Cartesian components exhibited a periodic motion, with typically larger amplitudes for higher Weissenberg numbers. Clearly, the x-component shows the same frequency as the applied flow, with some modulations appearing for the highest value of W i . In contrast, the y-component revealed frequency doubling for W i 25 . The Supplementary Movies illustrate the different dynamical features of x c m and y c m . In one period, the x-position of the center of mass, let us say, moved from the maximum positive value to the minimum value (half period) and, by the oscillation, back again to the maximum x-value. The oscillation was similar to a complete “rotation” (period), and no difference between oscillation and rotation was visible. The behavior of the amplitude of y c m was different. While in a cycle, x c m decreased, y c m increased first, reached its maximum for x c m = 0 , and decreased then again. Instead of being able to complete a full cycle, the oscillation and the tethering constrained y c m to move back along a similar path as in the first half of the period, i.e., y c m ( t + T 0 / 2 ) increased, reached again a maximum and decreased then again to a value close to the initial value. Hence, y c m exhibited two maxima during a period, whereas x c m exhibited only one. As a consequence, the correlation function y c m ( t ) y c m ( 0 ) showed twice the frequency than the respective correlation function of the x-coordinate. The primary reason was the self-avoidance by the tethering points, which forced a reversal of the dynamics along the y-direction.

4. Summary and Conclusions

We have analyzed the nonequilibrium properties of semiflexible polymers confined in two dimensions with tethered ends exposed to oscillatory shear. The applied Brownian multiparticle collision dynamics algorithm neglected hydrodynamic interactions. It coupled the polymer dynamics in a stochastic (Brownian) manner to the local flow field and allowed for fluctuations, since the average flow field was imposed only.
For small shear rates, low Weissenberg numbers ( W i 10 ), the tethering of the ends led to a more-or-less linear oscillatory response, where the polymers moved back and forth like grass swaying in the wind. With increasing W i , the polymers (partially) wrapped around the fixation points and a more complex, nonlinear response emerged. In fact, the wrapping significantly changed the polymer conformations, and the overall size, measured by the radius of gyration, shrunk. Dynamically, the probability of the polymer center-of-mass position was largest on a spatial curve resembling a limaçon, although the distribution was inhomogeneous. Of course, this was a consequence of tethering and periodic excitation of the polymer, moving it cyclically back and forth, which led to an approximate rolling motion of the center-of-mass, the origin of the limaçon.
At high Weissenberg numbers, we found shear-induced modifications of the mode-spectrum of the mode-amplitude correlation functions. Since we considered semiflexible polymers only, the mode spectrum exhibited the characteristic 1 / n 4 dependence for low W i . At high W i , the lower modes, specifically the modes n 3 , showed a weaker n dependence. This is reflected in a particular dynamical behavior, where a frequency doubling appeared for the normal-mode amplitudes along the x- and y-direction. However, the doubling appeared alternating for even and odd modes—the correlation function A 1 y ( t ) A 1 y ( 0 ) shows twice the frequency of A 1 x ( t ) A 1 x ( 0 ) , whereas A 2 x ( t ) A 2 x ( 0 ) is similar to A 1 y ( t ) A 1 y ( 0 ) . The frequency doubling is also reflected in the autocorrelation function of the y-coordinate of the center-of-mass position. It was a consequence of the hindered and truncated “rotational” motion of the polymer by the tethering points.
In the current simulations, hydrodynamic interactions (HI) have been neglected. Such interactions are of major importance for flexible polymers, since they significantly change the relaxation time spectrum, but are less relevant for semiflexible polymers, where they provide approximately logarithmic corrections only [62]. Hence, we expected only minor differences between the presented results for free-draining polymers and simulations, accounting for HI as long as the polymer motion follows instantaneously the fluid flow.
Our studies revealed an intriguing behavior of tethered polymers under oscillatory flow, which affects their macroscopic rheological behavior. Specifically, the overall shrinkage of the polymer reduced the viscosity. The consequences of the frequency doubling on macroscopic properties need to be further analyzed.

Author Contributions

R.G.W. and A.L. conceived the project. A.L. performed the simulations. R.G.W. and A.L. interpreted the data and wrote the paper. Both authors discussed the results and commented on the manuscript.

Conflicts of Interest

The authors declare no conflict of interest.

References

  1. Bird, R.B.; Armstrong, R.C.; Hassager, O. Dynamics of Polymer Liquids; John Wiley & Sons: New York, NY, USA, 1987; Volume 1. [Google Scholar]
  2. Rubinstein, M.; Colby, R.C. Polymer Physics; Oxford University Press: Oxford, UK, 2003. [Google Scholar]
  3. Larson, R.G.; Desai, P.S. Modeling the rheology of polymer melts and solutions. Ann. Rev. Fluid Mech. 2015, 47, 47–65. [Google Scholar] [CrossRef]
  4. Shaw, M.T.; MacKnight, W.J. Introduction to Polymer Viscoelasticity; John Wiley & Sons: Hoboken, NJ, USA, 2018. [Google Scholar]
  5. Schroeder, C.M. Single polymer dynamics for molecular rheology. J. Rheol. 2018, 62, 371–403. [Google Scholar] [CrossRef] [Green Version]
  6. Doi, M.; Edwards, S.F. The Theory of Polymer Dynamics; Clarendon Press: Oxford, UK, 1986. [Google Scholar]
  7. Bird, R.B.; Curtiss, C.F.; Armstrong, R.C.; Hassager, O. Dynamics of Polymer Liquids; John Wiley & Sons: New York, NY, USA, 1987; Volume 2. [Google Scholar]
  8. Öttinger, H.C. Stochastic Processes in Polymeric Fluids; Springer: Berlin, Germany, 1996. [Google Scholar]
  9. Prakash, J.R. Rouse chains with excluded volume interactions: Linear viscoelasticity. Macromolecules 2001, 34, 3396–3411. [Google Scholar] [CrossRef]
  10. Huang, C.C.; Winkler, R.G.; Sutmann, G.; Gompper, G. Semidilute polymer solutions at equilibrium and under shear flow. Macromolecules 2010, 43, 10107–10116. [Google Scholar] [CrossRef]
  11. Winkler, R.G. Conformational and rheological properties of semiflexible polymers in shear flow. J. Chem. Phys. 2010, 133, 164905. [Google Scholar] [CrossRef]
  12. Smith, D.E.; Babcock, H.P.; Chu, S. Single-Polymer Dynamics in Steady Shear Flow. Science 1999, 283, 1724–1727. [Google Scholar] [CrossRef] [PubMed] [Green Version]
  13. Schroeder, C.M.; Teixeira, R.E.; Shaqfeh, E.S.G.; Chu, S. Characteristic Periodic Motion of Polymers in Shear Flow. Phys. Rev. Lett. 2005, 95, 018301. [Google Scholar] [CrossRef]
  14. Teixeira, R.E.; Babcock, H.P.; Shaqfeh, E.S.G.; Chu, S. Shear Thinning and Tumbling Dynamics of Single Polymers in the Flow-Gradient Plane. Macromolecules 2005, 38, 581–592. [Google Scholar] [CrossRef]
  15. Schroeder, C.M.; Teixeira, R.E.; Shaqfeh, E.S.G.; Chu, S. Dynamics of DNA in the flow-gradient plane of steady shear flow: Observations and simulations. Macromolecules 2005, 38, 1967–1978. [Google Scholar] [CrossRef]
  16. Doyle, P.S.; Ladoux, B.; Viovy, J.L. Dynamics of a tethered polymer in shear flow. Phys. Rev. Lett. 2000, 84, 4769. [Google Scholar] [CrossRef] [PubMed]
  17. Ladoux, B.; Doyle, P.S. Stretching tethered DNA chains in shear flow. Europhys. Lett. 2000, 52, 511. [Google Scholar] [CrossRef]
  18. Gerashchenko, S.; Steinberg, V. Statistics of Tumbling of a Single Polymer Molecule in Shear Flow. Phys. Rev. Lett. 2006, 96, 038304. [Google Scholar] [CrossRef] [PubMed]
  19. Zhou, Y.; Schroeder, C.M. Single polymer dynamics under large amplitude oscillatory extension. Phys. Rev. Fluid 2016, 1, 053301. [Google Scholar] [CrossRef]
  20. Liu, T. Flexible polymer chain dynamics and rheological properties in steady flows. J. Chem. Phys. 1989, 90, 5826–5842. [Google Scholar] [CrossRef]
  21. Delgado-Buscalioni, R. Cyclic Motion of a Grafted Polymer under Shear Flow. Phys. Rev. Lett. 2006, 96, 088303. [Google Scholar] [CrossRef]
  22. Hur, J.S.; Shaqfeh, E.S.G.; Larson, R.G. Brownian dynamics simulations of single DNA molecules in shear flow. J. Rheol. 2000, 44, 713–742. [Google Scholar] [CrossRef] [Green Version]
  23. Jose, P.P.; Szamel, G. Single-chain dynamics in a semidilute polymer solution under steady shear. J. Chem. Phys. 2008, 128, 224910. [Google Scholar] [CrossRef] [PubMed]
  24. He, G.L.; Messina, R.; Löwen, H.; Kiriy, A.; Bocharova, V.; Stamm, M. Shear-induced stretching of adsorbed polymer chains. Soft Matter 2009, 5, 3014–3017. [Google Scholar] [CrossRef]
  25. Knudsen, K.D.; de la Torre, J.G.; Elgsaeter, A. Gaussian chains with excluded volume and hydrodynamic interaction: shear rate dependence of radius of gyration, intrinsic viscosity and flow birefringence. Polymer 1996, 37, 1317–1322. [Google Scholar] [CrossRef]
  26. Lyulin, A.V.; Adolf, D.B.; Davies, G.R. Brownian dynamics simulations of linear polymers under shear flow. J. Chem. Phys. 1999, 111, 758–771. [Google Scholar] [CrossRef]
  27. Petera, D.; Muthukumar, M. Brownian dynamics simulation of bead–rod chains under shear with hydrodynamic interaction. J. Chem. Phys. 1999, 111, 7614–7623. [Google Scholar] [CrossRef]
  28. Jendrejack, R.M.; de Pablo, J.J.; Graham, M.D. Stochastic simulations of DNA in flow: Dynamics and the effects of hydrodynamic interactions. J. Chem. Phys. 2002, 116, 7752–7759. [Google Scholar] [CrossRef] [Green Version]
  29. Hsieh, C.C.; Larson, R.G. Modelling hydrodynamic interaction in Brownian dynamics: Simulation of extensional and shear flows of dilute solutions of high molecular weight polystyrene. J. Rheol. 2004, 48, 995–1021. [Google Scholar] [CrossRef]
  30. Liu, S.; Ashok, B.; Muthukumar, M. Brownian dynamics simulations of bead-rod-chain in simple shear flow and elongational flow. Polymer 2004, 45, 1383–1389. [Google Scholar] [CrossRef]
  31. Pamies, R.; Martinez, M.C.L.; Cifre, J.G.H.; de la Torre, J.G. Non-Newtonian viscosity of dilute polymer solutions. Macromolecules 2005, 38, 1371–1377. [Google Scholar] [CrossRef]
  32. Sendner, C.; Netz, R.R. Shear-induced repulsion of a semiflexible polymer from a wall. EPL 2008, 81, 54006. [Google Scholar] [CrossRef]
  33. Pierleoni, C.; Ryckaert, J.P. Deformation and orientation of flexible polymers in solution under shear flow: A new picture of intermediate reduced shear rates. Macromolecules 1995, 28, 5097–5108. [Google Scholar] [CrossRef]
  34. Aust, C.; Kröger, M.; Hess, S. Structure and dynamics of dilute polymer solutions under shear flow via nonequilibrium molecular dynamics. Macromolecules 1999, 32, 5660–5672. [Google Scholar] [CrossRef]
  35. Gratton, Y.; Slater, G.W. Molecular dynamics study of tethered polymers in shear flow. Eur. Phys. J. E 2005, 17, 455–465. [Google Scholar] [CrossRef]
  36. Zhang, Y.; Donev, A.; Weisgraber, T.; Alder, B.J.; Graham, M.G.; de Pablo, J.J. Tethered DNA dynamics in shear flow. J. Chem. Phys. 2009, 130, 234902. [Google Scholar] [CrossRef]
  37. Ryder, J.F.; Yeomans, J.M. Shear thinning in dilute polymer solutions. J. Chem. Phys. 2006, 125, 194906. [Google Scholar] [CrossRef]
  38. Ripoll, M.; Winkler, R.G.; Gompper, G. Star polymers in shear flow. Phys. Rev. Lett. 2006, 96, 188302. [Google Scholar] [CrossRef]
  39. Kobayashi, H.; Yamamoto, R. Tumbling motion of a single chain in shear flow: A crossover from Brownian to non-Brownian behavior. Phys. Rev. E 2010, 81, 041807. [Google Scholar] [CrossRef]
  40. Lamura, A.; Winkler, R.G. Semiflexible polymers under external fields confined to two dimensions. J. Chem. Phys. 2012, 137, 244909. [Google Scholar] [CrossRef] [PubMed] [Green Version]
  41. Winkler, R.G.; Fedosov, D.A.; Gompper, G. Dynamical and rheological properties of soft colloid suspensions. Curr. Opin. Colloid Interface Sci. 2014, 19, 594–610. [Google Scholar] [CrossRef]
  42. Cannavacciuolo, L.; Winkler, R.G.; Gompper, G. Mesoscale simulation of polymer dynamics in microchannel flows. EPL 2008, 83, 34007. [Google Scholar] [CrossRef]
  43. Chelakkot, R.; Winkler, R.G.; Gompper, G. Migration of semiflexible polymers in microcapillary flow. EPL 2010, 91, 14001. [Google Scholar] [CrossRef]
  44. Chelakkot, R.; Winkler, R.G.; Gompper, G. Flow-Induced Helical Coiling of Semiflexible Polymers in Structured Microchannels. Phys. Rev. Lett. 2012, 109, 178101. [Google Scholar] [CrossRef] [PubMed] [Green Version]
  45. Bogie, K.; Harris, J. An experimental analysis of the Weissenberg rheogoniometer. Rheol. Acta 1966, 5, 212–215. [Google Scholar] [CrossRef]
  46. Philippoff, W. Vibrational Measurements with Large Amplitudes. Trans. Soc. Rheol. 1966, 10, 317–334. [Google Scholar] [CrossRef]
  47. Giacomin, A.J.; Dealy, J.M. Large-amplitude oscillatory shear. In Techniques in Rheological Measurement; Collyer, A.A., Ed.; Springer: Dordrecht, The Netherland, 1993; pp. 99–121. [Google Scholar]
  48. Hyun, K.; Wilhelm, M.; Klein, C.O.; Cho, K.S.; Nam, J.G.; Ahn, K.H.; Lee, S.J.; Ewoldt, R.H.; McKinley, G.H. A review of nonlinear oscillatory shear tests: Analysis and application of large amplitude oscillatory shear (LAOS). Prog. Poly. Sci. 2011, 36, 1697–1753. [Google Scholar] [CrossRef] [Green Version]
  49. Swope, W.C.; Andersen, H.C.; Berens, P.H.; Wilson, K.R. A computer simulation method for the calculation of equilibrium constants for the formation of physical clusters of molecules: Application to small water clusters. J. Chem. Phys. 1982, 76, 637–649. [Google Scholar] [CrossRef]
  50. Allen, M.P.; Tildesley, D.J. Computer Simulation of Liquids; Clarendon Press: Oxford, UK, 1987. [Google Scholar]
  51. Ripoll, M.; Winkler, R.G.; Gompper, G. Hydrodynamic screening of star polymers in shear flow. Eur. Phys. J. E 2007, 23, 349–354. [Google Scholar] [CrossRef]
  52. Gompper, G.; Ihle, T.; Kroll, D.M.; Winkler, R.G. Multi-Particle Collision Dynamics: A particle-based mesoscale simulation approach to the hydrodynamics of complex Fluids. Adv. Polym. Sci. 2009, 221, 1. [Google Scholar]
  53. Kikuchi, N.; Gent, A.; Yeomans, J.M. Polymer collapse in the presence of hydrodynamic interactions. Eur. Phys. J. E 2002, 9, 63–66. [Google Scholar] [CrossRef] [PubMed] [Green Version]
  54. Kapral, R. Multiparticle Collision Dynamics: Simulations of complex systems on mesoscale. Adv. Chem. Phys. 2008, 140, 89–146. [Google Scholar]
  55. Ihle, T.; Kroll, D.M. Stochastic rotation dynamics: A Galilean-invariant mesoscopic model for fluid flow. Phys. Rev. E 2001, 63, 020201(R). [Google Scholar] [CrossRef]
  56. Lamura, A.; Gompper, G.; Ihle, T.; Kroll, D.M. Multiparticle collision dynamics: Flow around a circular and a square cylinder. Europhys. Lett. 2001, 56, 319–325. [Google Scholar] [CrossRef]
  57. Bronshtein, I.N.; Semendyayev, K.A. A Guide Book to Mathematics: Fundamental Formulas· Tables· Graphs· Methods; Springer: Berlin, Germany, 1973. [Google Scholar]
  58. Winkler, R.G. Analytical Calculation of the Relaxation Dynamics of Partially Stretched Flexible Chain Molecules: Necessity of a Wormlike Chain Description. Phys. Rev. Lett. 1999, 82, 1843. [Google Scholar] [CrossRef]
  59. Harnau, L.; Winkler, R.G.; Reineker, P. Dynamic properties of molecular chains with variable stiffness. J. Chem. Phys. 1995, 102, 7750–7757. [Google Scholar] [CrossRef]
  60. Aragón, S.R.; Pecora, R. Dynamics of wormlike chains. Macromolecules 1985, 18, 1868–1875. [Google Scholar] [CrossRef]
  61. Winkler, R.G.; Keller, S.; Rädler, J.O. Intramolecular Dynamics of Linear Macromolecules by Fluorescence Correlation Spectroscopy. Phys. Rev. E 2006, 73, 041919. [Google Scholar] [CrossRef] [PubMed]
  62. Harnau, L.; Winkler, R.G.; Reineker, P. Dynamic Structure Factor of Semiflexible Macromolecules in Dilute Solution. J. Chem. Phys. 1996, 104, 6355–6368. [Google Scholar] [CrossRef]
Figure 1. Sketch of the tethered bead-spring polymer exposed to oscillatory linear shear flow.
Polymers 11 00737 g001
Figure 2. Conformations of the polymer at times t = 0 (solid line), 0.5 π / ω (dashed line), π / ω (dotted line), 1.5 π / ω (dash-dotted line) after equilibration for L p / L = 0.5 (left), 2 (right), and W i = 10, 25, 50, 100 (from top to bottom). Black dots denote the position of fixed beads.
Polymers 11 00737 g002
Figure 3. Time-dependence of the center-of-mass coordinate along the x-axis for L p / L = 0.5 (left) and 2 (right), and W i = 10, 25, 50, 100 (from top to bottom). The black lines correspond to the externally applied shear flow with arbitrary amplitude.
Polymers 11 00737 g003
Figure 4. Probability distribution of the center-of-mass position of the tethered polymers for L p / L = 0.5 (left) and 2 (right), and W i = 10 , 25 , 50 , 100 (from top to bottom). Black dots indicate the position of fixed ends. The lines for L p / L = 2 (right) are limaons according to Equations (5) and (6) for the parameters: (b) a / r 0 = 20.48 , b / r 0 = 1.92 , y 0 = 0 , (d) a / r 0 = 19.91 , b / r 0 = 2.72 , y 0 = 0 , (f) a / r 0 = 17 , b / r 0 = 14 , y 0 / r 0 = 6 , (h) a / r 0 = 16 , b / r 0 = 16 , y 0 / r 0 = 6 .
Polymers 11 00737 g004
Figure 5. Probability distribution functions of the x (top) and y (bottom) coordinates of the polymer center of mass for L p / L = 0.5 (left), 2 (right) and W i = 10 ( ) , 25 ( ) , 50 ( ) , 100 ( ) .
Polymers 11 00737 g005
Figure 6. Average position along the y-direction of the polymer center of mass as a function of the Weissenberg number for L p / L = 0.5 (•), 2 (▴). Lines are the fits < y c m > / r 0 β ln W i with β = 4.9 ± 0.4 (full line) β = 7.6 ± 0.6 (dashed line).
Polymers 11 00737 g006
Figure 7. Mean (left) and mean square (right) values of the components of the displacement S as a function of the bead index, i, of the semiflexible polymer with L p / L = 2 for W i = 10 ( ) , 25 ( ) , 50 ( ) , 100 ( ) . Open symbols indicate S x and filled symbols S y .
Polymers 11 00737 g007
Figure 8. Variance of the mode components A n x (open symbols with solid lines) and A n y (solid symbols with dashed lines) as functions of mode number n for L p / L = 0.5 (left), 2 (right) and W i = 10 ( ) , 25 ( ) , 50 ( ) , 100 ( ) . The slope of the solid lines is 4 .
Polymers 11 00737 g008
Figure 9. Autocorrelation function of the mode amplitudes for the modes n = 1 (top) and n = 2 (bottom) as a function of time along the x- (left) and y-direction (right). The polymer stiffness is L p / L = 2 and the Weissenberg numbers W i = 10 ( ) , 25 ( ) , 50 ( ) , 100 ( ) . The black solid lines are fits of a damped sinusoidal oscillation.
Polymers 11 00737 g009
Figure 10. Autocorrelation function of center-of-mass Cartesian coordinates as a function of time along the x- (left) and y-direction (right). The polymer stiffness is L p / L = 2 and the Weissenberg numbers W i = 10 ( ) , 25 ( ) , 50 ( ) , 100 ( ) .
Polymers 11 00737 g010

