CO2 in Lyotropic Liquid Crystals: Phase Equilibria Behavior and Rheology


Abstract
:
1. Introduction
2. Materials and Methods
2.1. Materials
2.2. Vapor–Liquid Equilibrium (VLE) Experiments
2.3. CO2 Absorption of 60% L92/10% MEA in Round Bottom Flask
2.4. Thermal Degradation Experiments
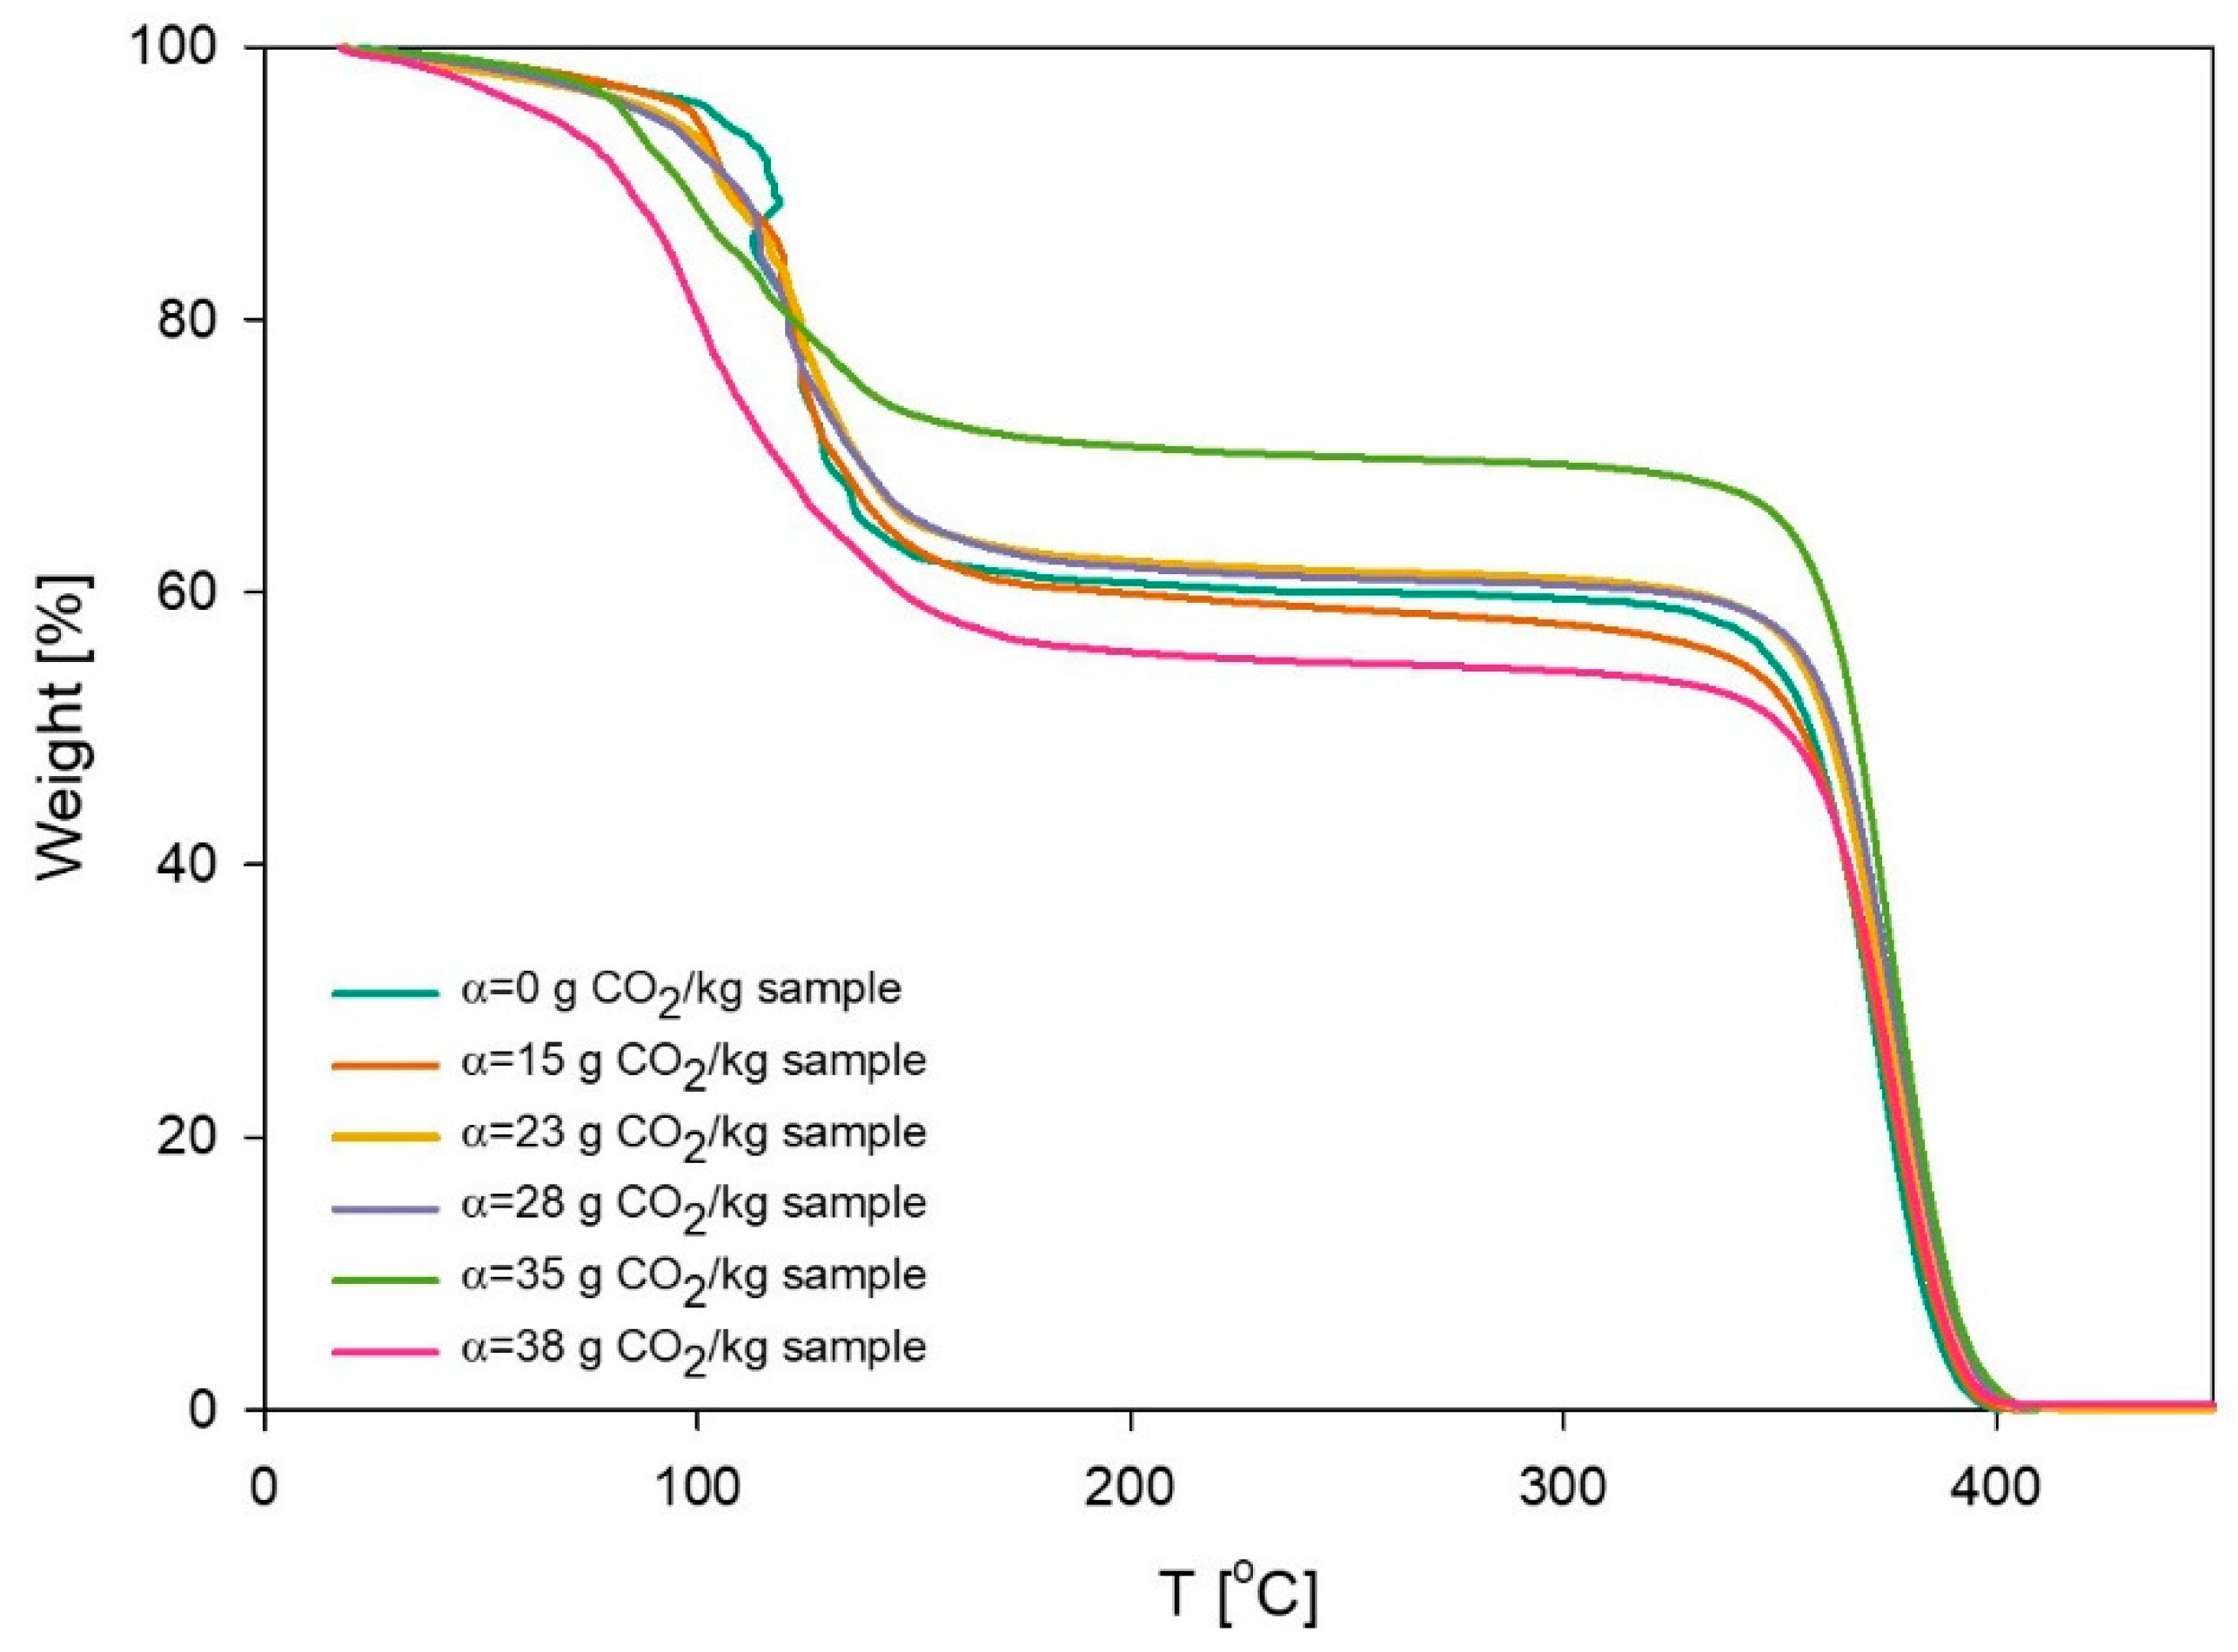
2.5. Thermogravimetric Analysis (TGA)
2.6. Cross-Polarized Visual Inspection
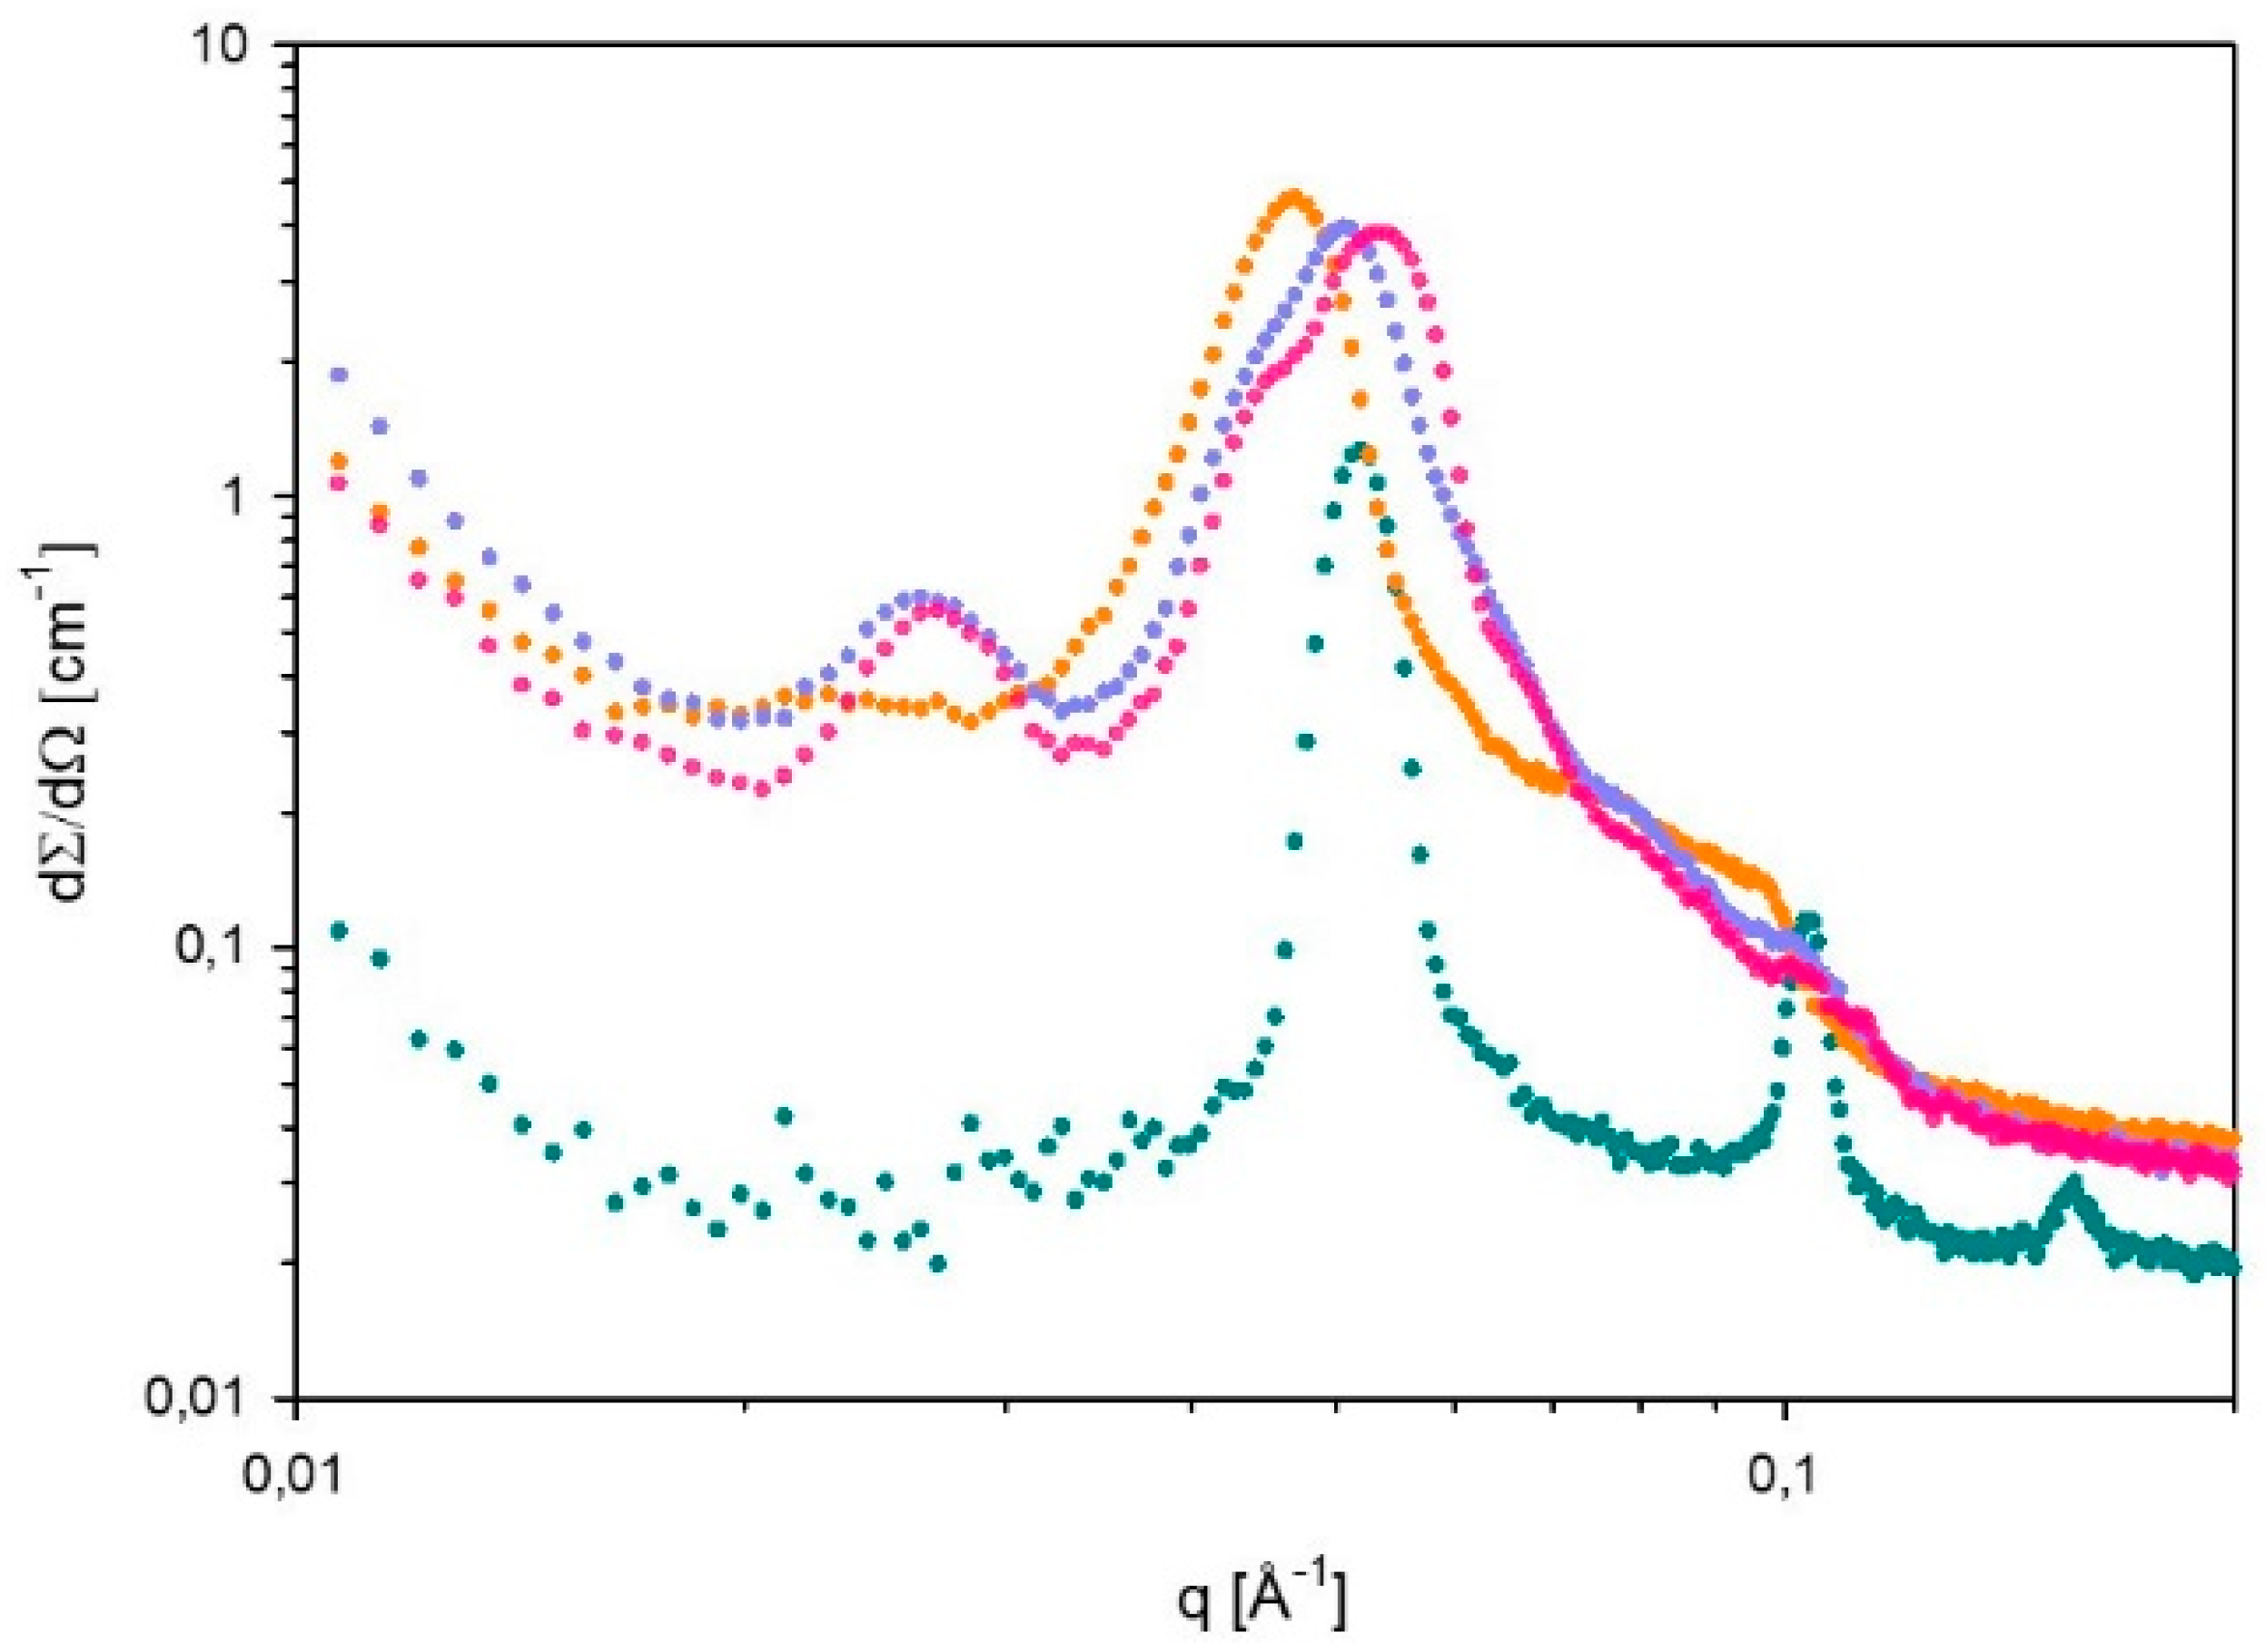
2.7. Small Angle X-ray Scattering (SAXS)
2.8. Rheology
2.9. Titration Methods
3. Results and Discussion
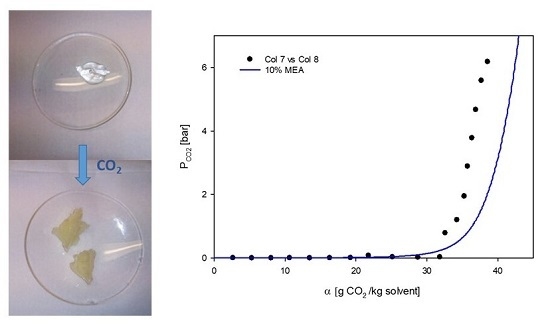
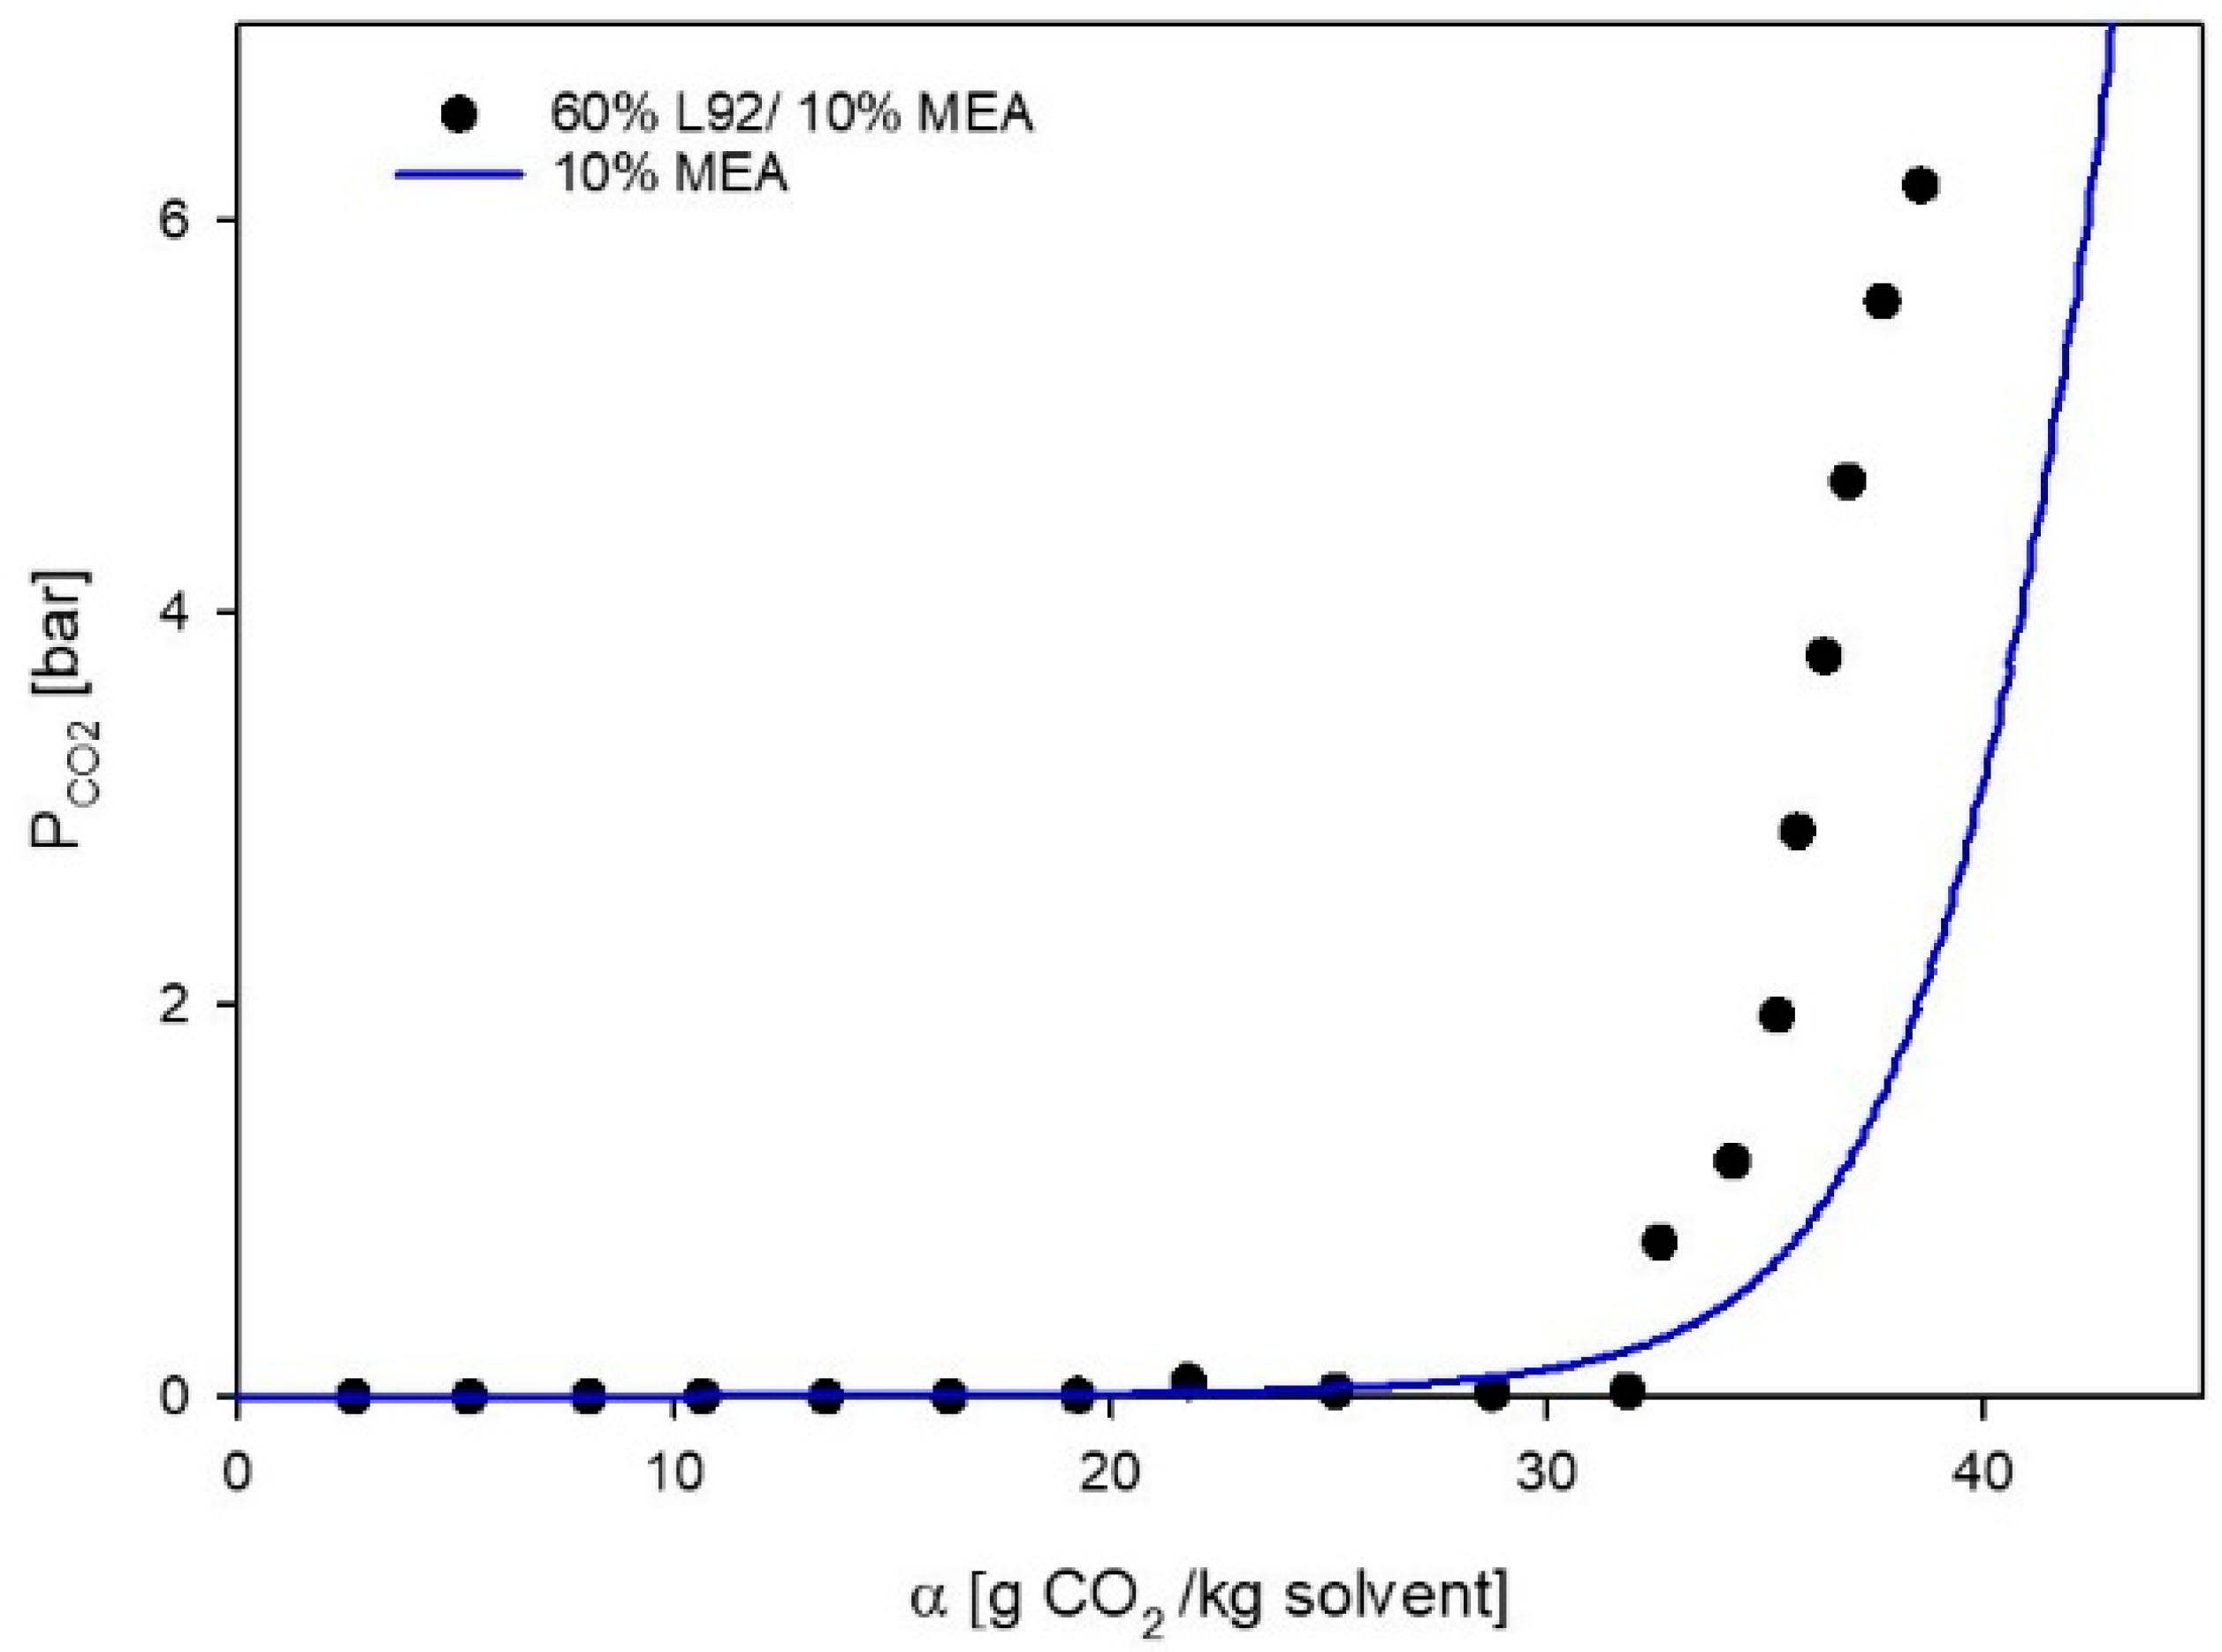
3.1. VLE Experiments
3.2. Phase Behavior of 60% L92/10% MEA during CO2 Absorption
3.3. Rheological Behavior
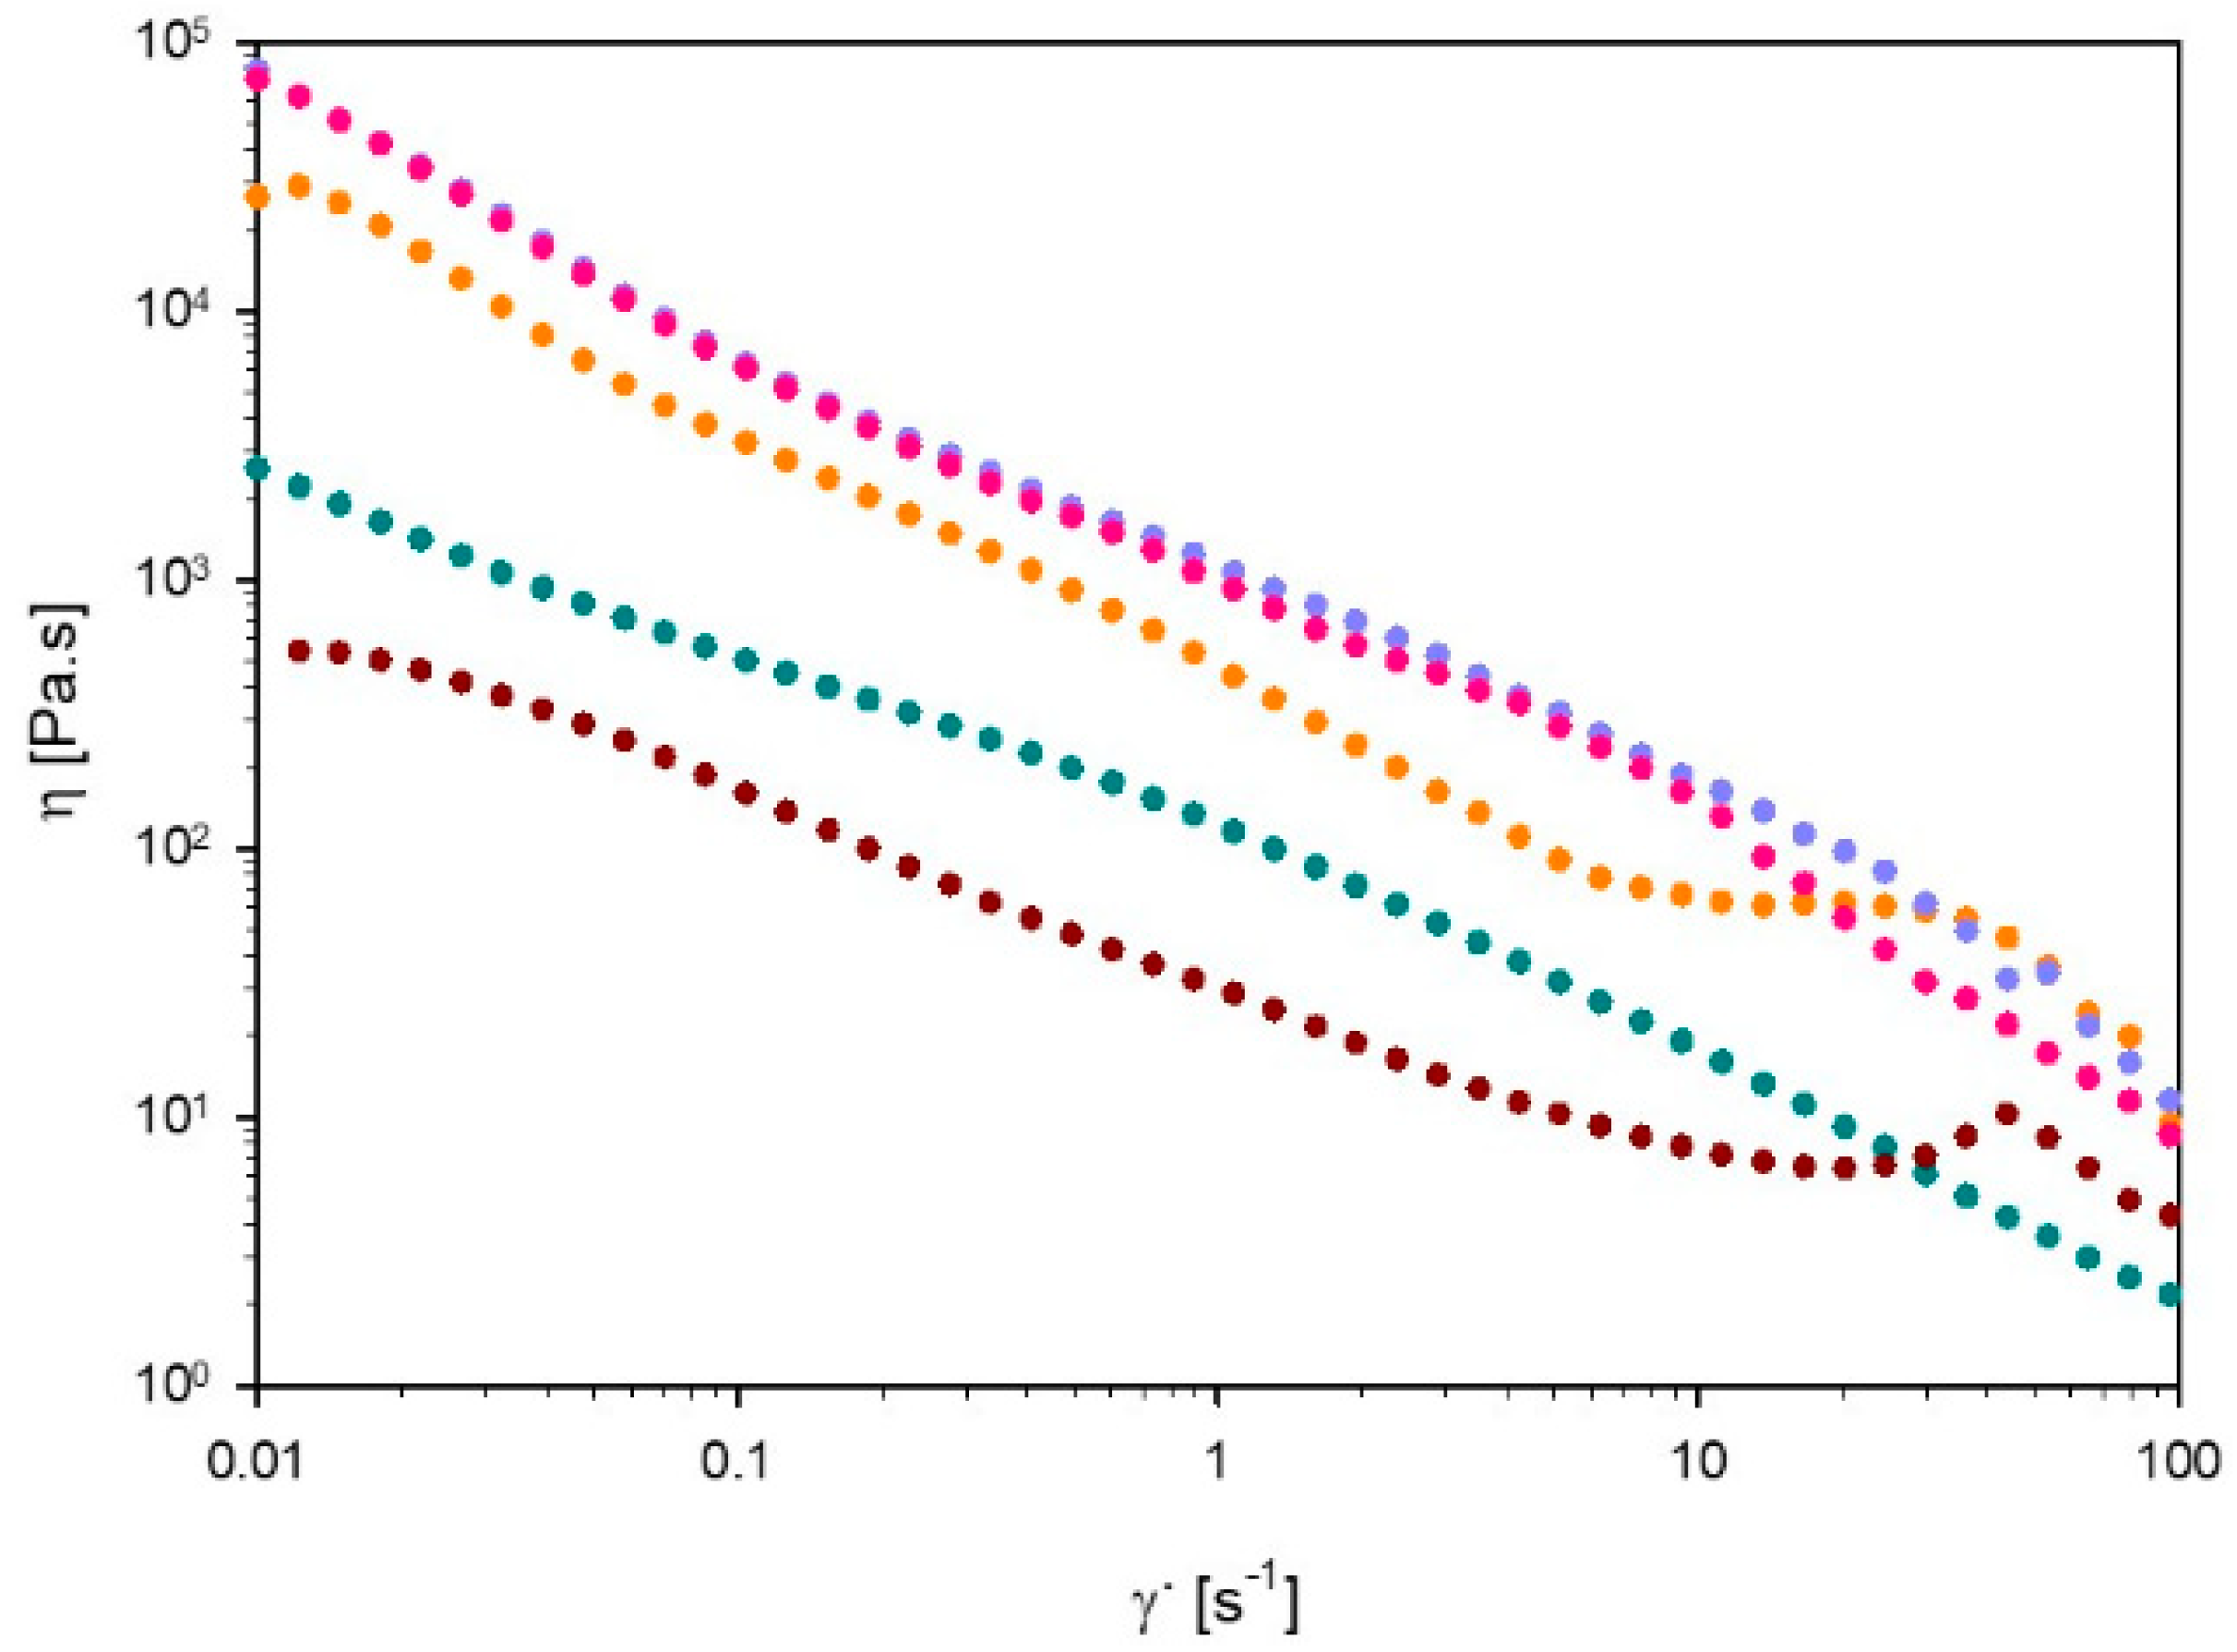
3.3.1. Viscosity
3.3.2. Oscillatory Experiments
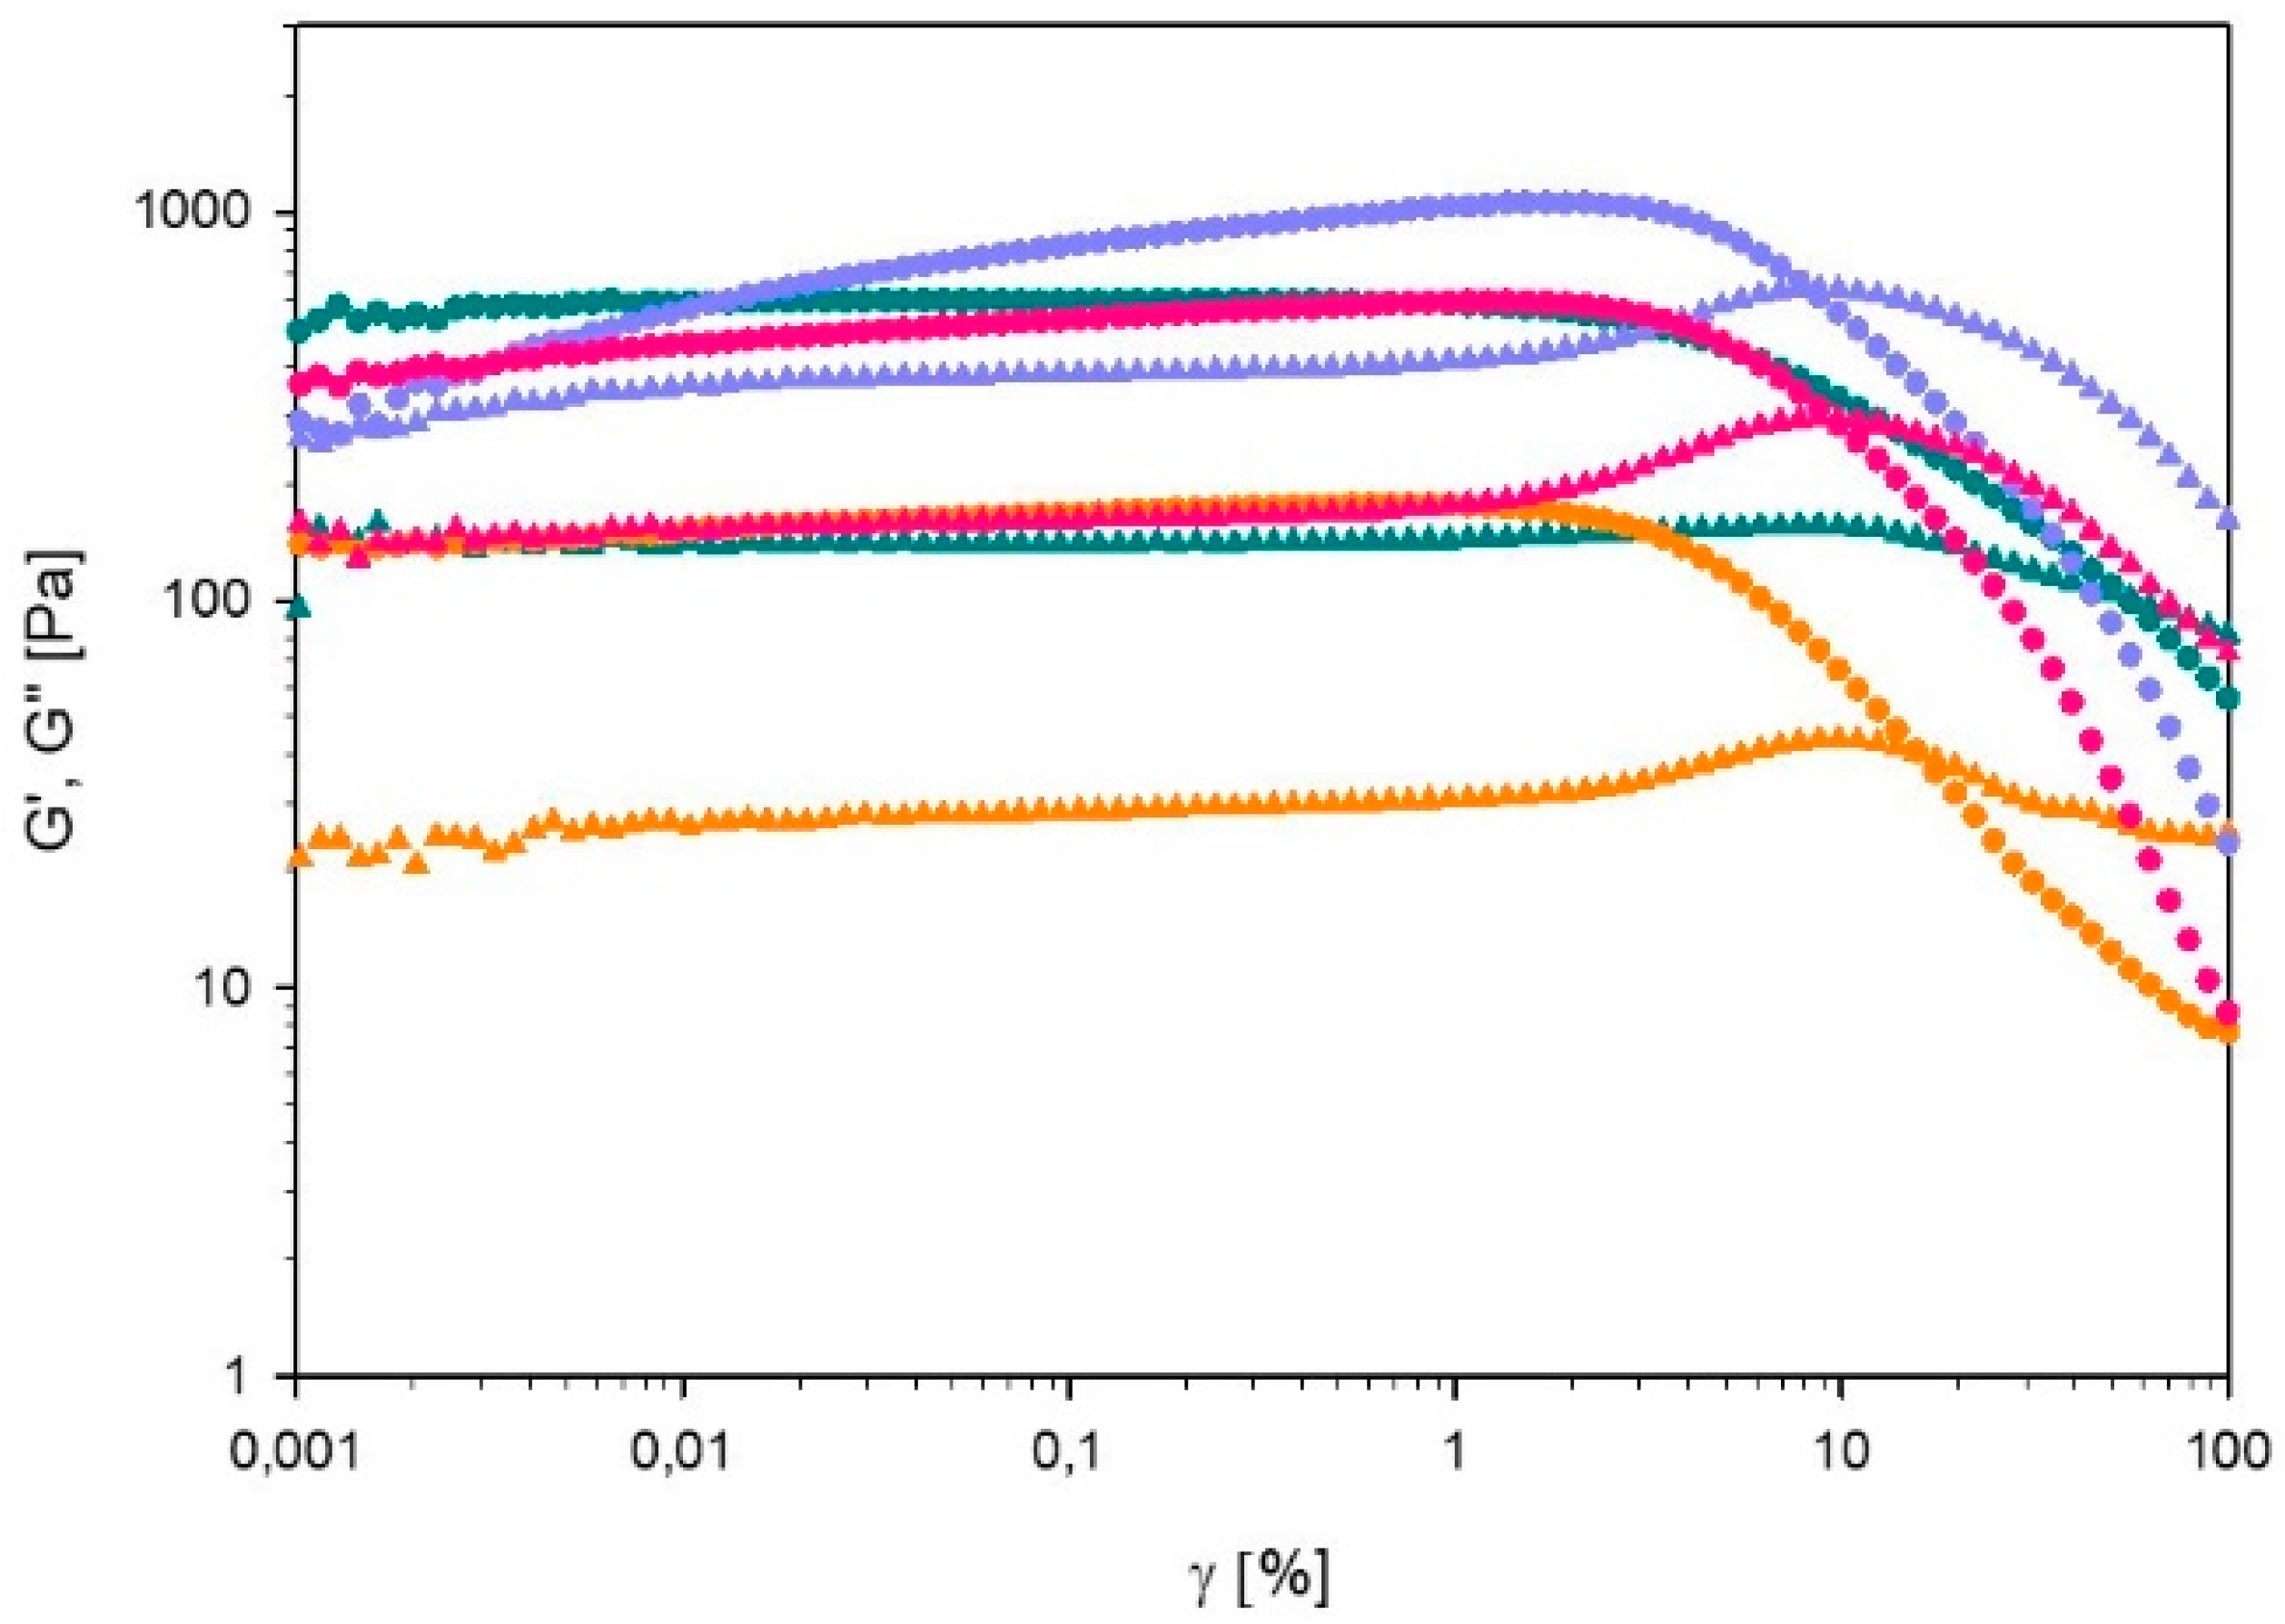
Strain Sweep
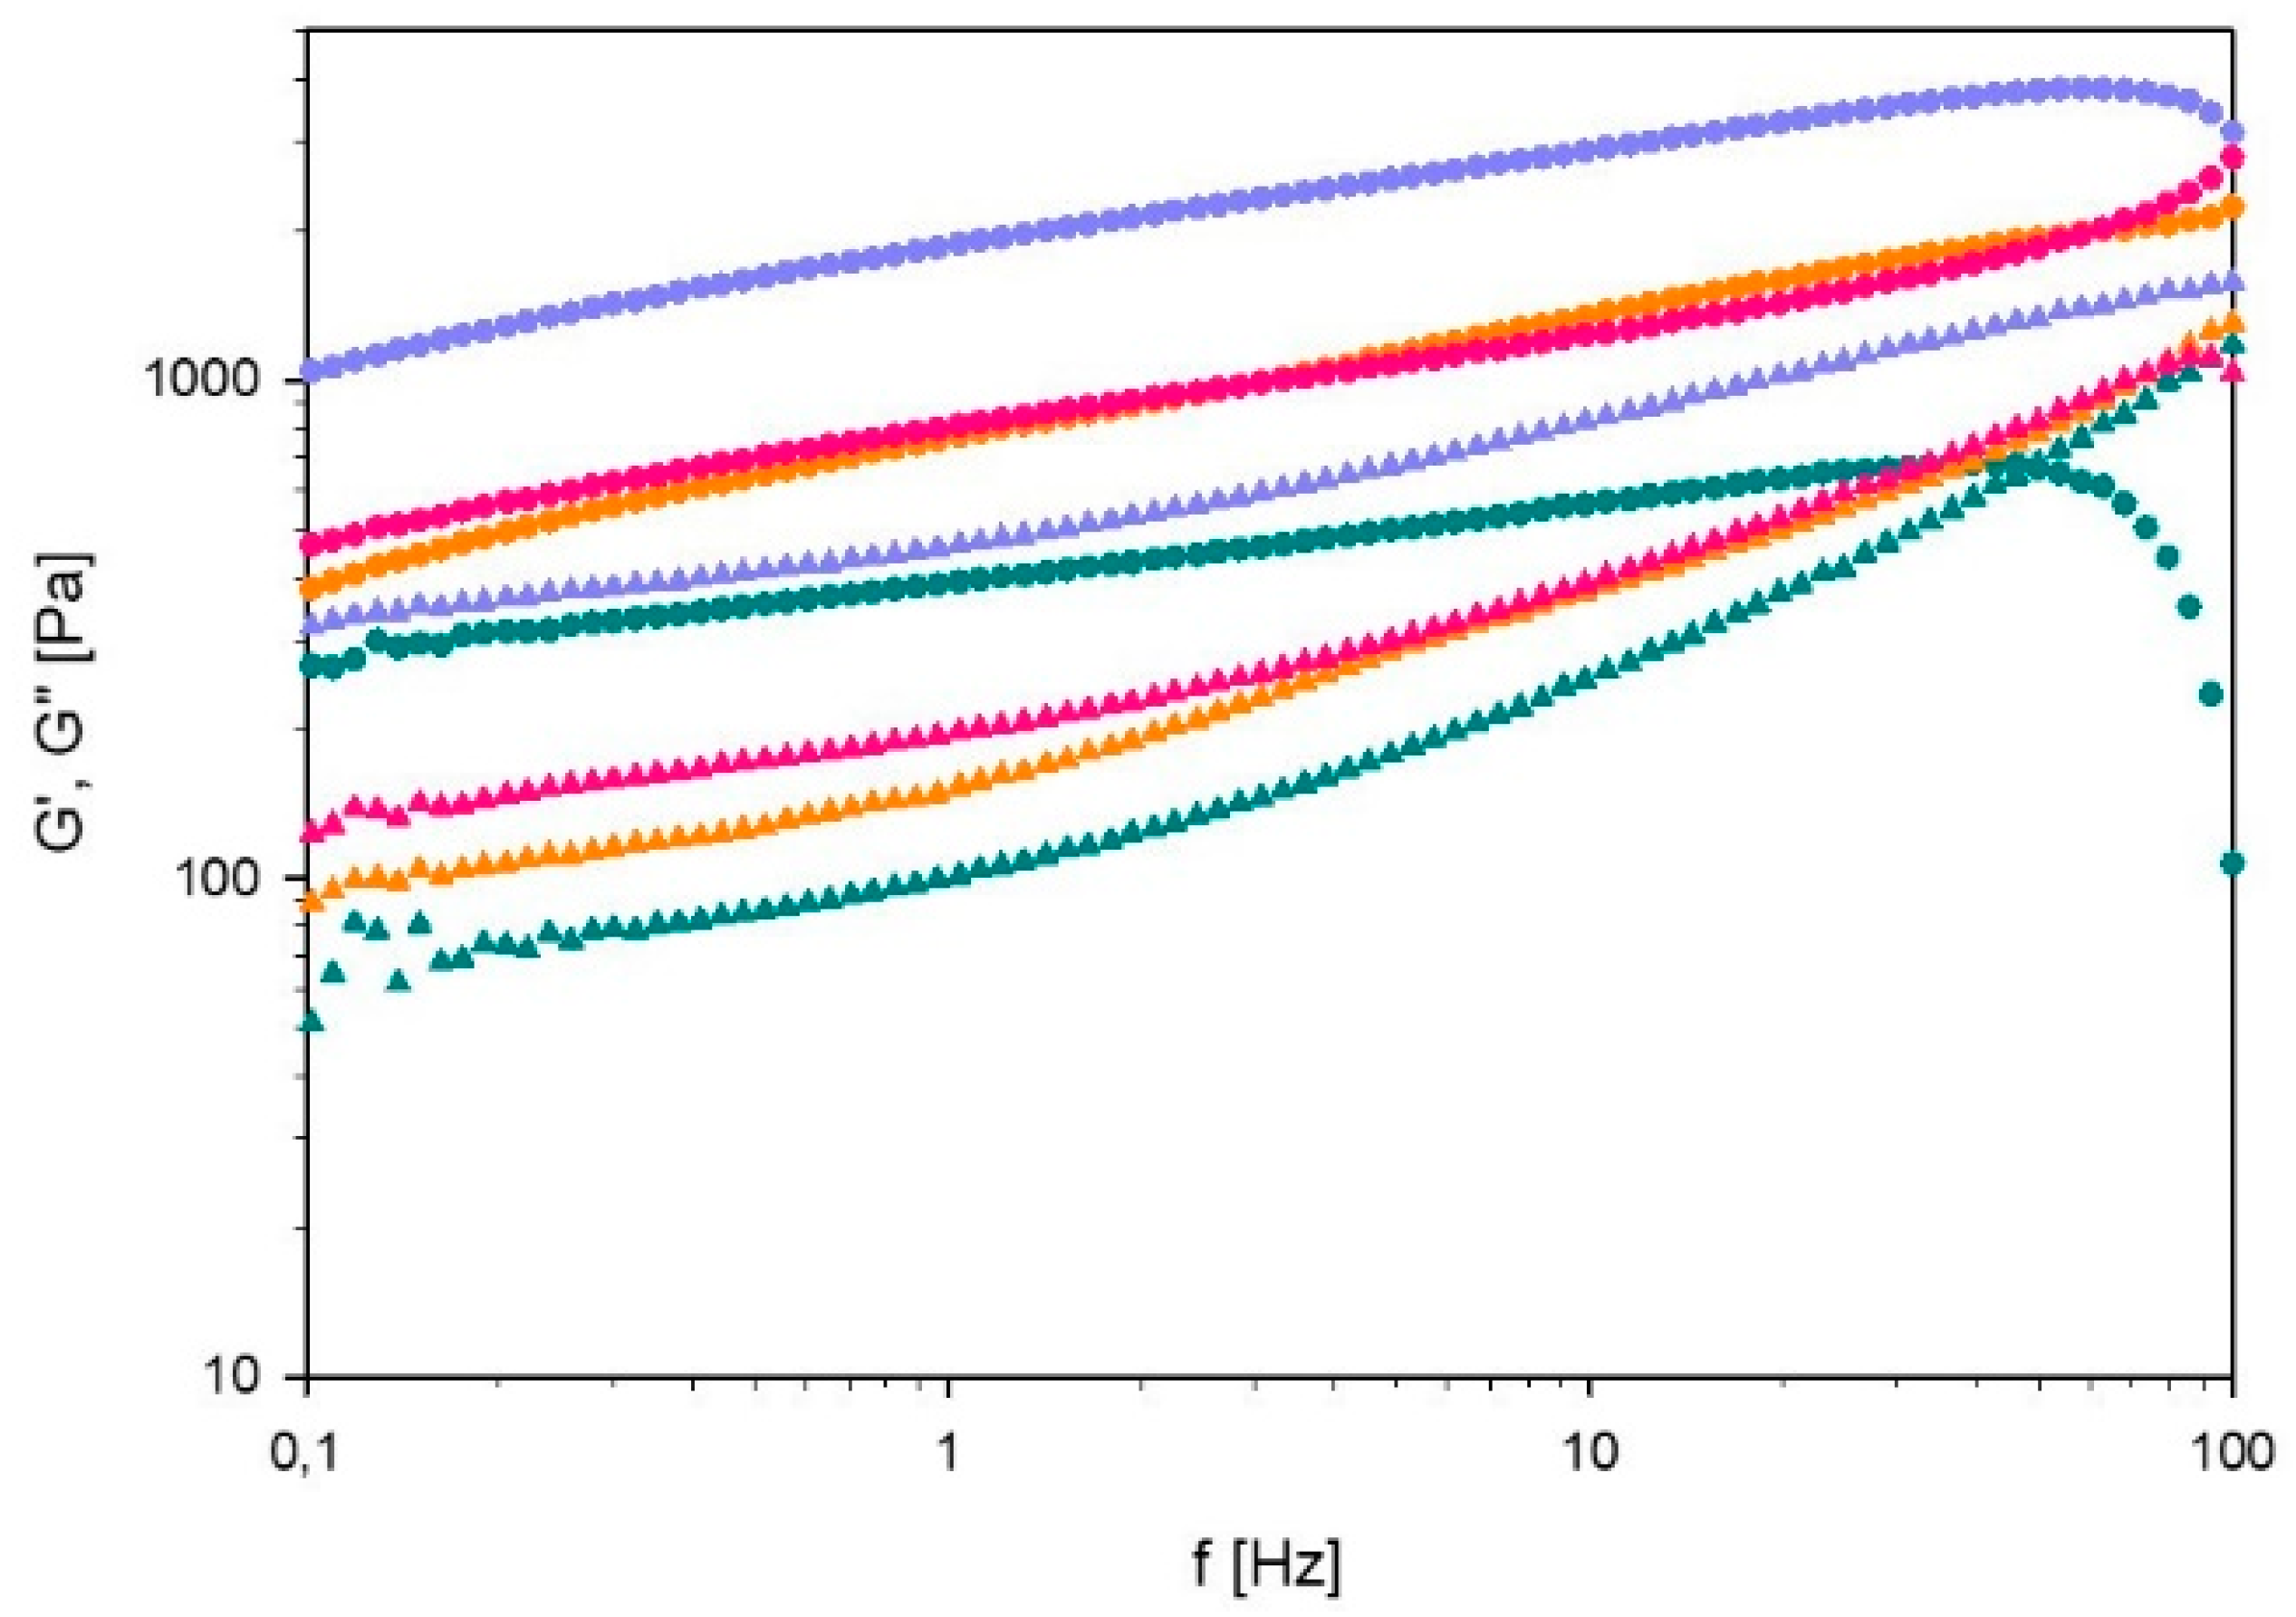
Frequency Sweep
3.4. Thermal Degradation Experiments
5. Conclusions
Supplementary Materials
Author Contributions
Funding
Acknowledgments
Conflicts of Interest
References
- BASF. Pluronic Pe Types—Technical Information; BASF: Ludwigshafen, Germany, 1996. [Google Scholar]
- Zu, S.-Z.; Han, B.-H. Aqueous Dispersion of Graphene Sheets Stabilized by Pluronic Copolymers: Formation of Supramolecular Hydrogel. J. Phys. Chem. C 2009, 113, 13651–13657. [Google Scholar] [CrossRef]
- Lee, S.; Iten, R.; Müller, M.; Spencer, N.D. Influence of Molecular Architecture on the Adsorption of Poly(Ethylene Oxide)−Poly(Propylene Oxide)−Poly(Ethylene Oxide) on Pdms Surfaces and Implications for Aqueous Lubrication. Macromolecules 2004, 37, 8349–8356. [Google Scholar] [CrossRef]
- Wulff-Pérez, M.; Torcello-Gómez, A.; Gálvez-Ruíz, M.J.; Martín-Rodríguez, A. Stability of Emulsions for Parenteral Feeding: Preparation and Characterization of O/W Nanoemulsions with Natural Oils and Pluronic F68 as Surfactant. Food Hydrocoll. 2009, 23, 1096–1102. [Google Scholar] [CrossRef]
- Batrakova, E.V.; Kabanov, A.V. Pluronic Block Copolymers: Evolution of Drug Delivery Concept from Inert Nanocarriers to Biological Response Modifiers. J. Control Release 2008, 130, 98–106. [Google Scholar] [CrossRef]
- Kabanov, A.V.; Batrakova, E.V.; Alakhov, V.Y. Pluronic® Block Copolymers as Novel Polymer Therapeutics for Drug and Gene Delivery. J. Control Release 2002, 82, 189–212. [Google Scholar] [CrossRef]
- Alexandridis, P. Poly(Ethylene Oxide)/Poly(Propylene Oxide) Block Copolymer Surfactants. Curr. Opin. Colloid Interface Sci. 1997, 2, 478–489. [Google Scholar] [CrossRef]
- Svensson, M.; Alexandridis, P.; Linse, P. Phase Behavior and Microstructure in Binary Block Copolymer/Selective Solvent Systems: Experiments and Theory. Macromolecules 1999, 32, 637–645. [Google Scholar] [CrossRef]
- Alexandridis, P.; Zhou, D.; Khan, A. Lyotropic Liquid Crystallinity in Amphiphilic Block Copolymers: Temperature Effects on Phase Behavior and Structure for Poly(Ethylene Oxide)-B-Poly(Propylene Oxide)-B-Poly(Ethylene Oxide) Copolymers of Different Composition. Langmuir 1996, 12, 269–2700. [Google Scholar] [CrossRef]
- Noolandi, J.; Shi, A.-C.; Linse, P. Theory of Phase Behavior of Poly(Oxyethylene)−Poly(Oxypropylene)−Poly(Oxyethylene) Triblock Copolymers in Aqueous Solutions. Macromolecules 1996, 29, 5907–5919. [Google Scholar] [CrossRef]
- Ivanova, R.; Lindman, B.; Alexandridis, P. Effect of Glycols on the Self-Assembly of Amphiphilic Block Copolymers in Water. 1. Phase Diagrams and Structure Identification. Langmuir 2000, 16, 3660–3675. [Google Scholar] [CrossRef]
- Ivanova, R.; Lindman, B.; Alexandridis, P. Modification of the Lyotropic Liquid Crystalline Microstructure of Amphiphilic Block Copolymers in the Presence of Cosolvents. Adv. Colloid Interface Sci. 2001, 89–90, 351–382. [Google Scholar] [CrossRef]
- Ivanova, R.; Lindman, B.; Alexandridis, P. Evolution in Structural Polymorphism of Pluronic F127 Poly(Ethylene Oxide)−Poly(Propylene Oxide) Block Copolymer in Ternary Systems with Water and Pharmaceutically Acceptable Organic Solvents: From “Glycols” to “Oils”. Langmuir 2000, 16, 9058–9069. [Google Scholar] [CrossRef]
- Karlstrom, G.; Carlsson, A.; Lindman, B. Phase Diagrams of Nonionic Polymer-Water Systems. Experimental and Theoretical Studies of the Effects of Surfactants and Other Cosolutes. J. Phys. Chem. 1990, 94, 5005–5015. [Google Scholar] [CrossRef]
- Samii, A.A.; Karlstrom, G.; Lindman, B. Phase Behavior of Poly (Ethylene Oxide)–Poly (Propylene Oxide) Block Copolymers in Nonaqueous Solution. Langmuir 1991, 7, 1067–1071. [Google Scholar] [CrossRef]
- Robles-Vásquez, O.; Corona-Galván, S.; Soltero, J.F.A.; Puig, J.E.; Tripodi, S.B.; Vallés, E.; Manero, O. Rheology of Lyotropic Liquid Crystals of Aerosol Ot. J. Colloid Interface Sci. 1993, 160, 65–71. [Google Scholar] [CrossRef]
- Mezzenga, R.; Meyer, C.; Servais, C.; Romoscanu, A.I.; Sagalowicz, L.; Hayward, R.C. Shear Rheology of Lyotropic Liquid Crystals: A Case Study. Langmuir 2005, 21, 3322–3333. [Google Scholar] [CrossRef]
- Prud’homme, R.K.; Wu, G.; Schneider, D.K. Structure and Rheology Studies of Poly(Oxyethylene−Oxypropylene−Oxyethylene) Aqueous Solution. Langmuir 1996, 12, 4651–4659. [Google Scholar] [CrossRef]
- Hyun, K.; Nam, J.G.; Wilhelm, M.; Ahn, K.H.; Lee, S.J. Large Amplitude Oscillatory Shear Behavior of Peo-Ppo-Peo Triblock Copolymer Solutions. Rheol. Acta 2006, 45, 239–249. [Google Scholar] [CrossRef]
- Hyun, K.; Kim, S.H.; Ahn, K.H.; Lee, S.J. Large Amplitude Oscillatory Shear as a Way to Classify the Complex Fluids. J. Non-Newtonian Fluid 2002, 107, 51–65. [Google Scholar] [CrossRef]
- Rodríguez-Fabià, S.; Norrman, J.; Sjöblom, J.; Paso, K. CO2 in Lyotropic Liquid Crystals: Monoethanolamine-Facilitated Uptake and Swelling. Polymers 2018, 10, 883. [Google Scholar] [CrossRef]
- D’Alessandro, D.M.; Smit, B.; Long, J.R. Carbon Dioxide Capture: Prospects for New Materials. Angew. Chem. Int. Edit. 2010, 49, 6058–6082. [Google Scholar] [CrossRef] [PubMed]
- Wang, M.; Lawal, A.; Stephenson, P.; Sidders, J.; Ramshaw, C. Post-Combustion CO2 Capture with Chemical Absorption: A State-of-the-Art Review. Chem. Eng. Res. Des. 2011, 89, 1609–1624. [Google Scholar] [CrossRef]
- Yu, C.H.; Huang, C.H.; Tan, C.S. A Review of CO2 Capture by Absorption and Adsorption. Aerosol Air Qual. Res. 2012, 12, 745–769. [Google Scholar] [CrossRef]
- Vaidya, P.D.; Kenig, E.Y. CO2-Alkanolamine Reaction Kinetics: A Review of Recent Studies. Chem. Eng. Technol. 2007, 30, 1467–1474. [Google Scholar] [CrossRef]
- Olajire, A.A. CO2 Capture and Separation Technologies for End-of-Pipe Applications—A Review. Energy 2010, 35, 2610–2628. [Google Scholar] [CrossRef]
- Rayer, A.V.; Henni, A.; Tontiwachwuthikul, P. High Pressure Physical Solubility of Carbon Dioxide (CO2) in Mixed Polyethylene Glycol Dimethyl Ethers (Genosorb 1753). Can. J. Chem. Eng. 2012, 90, 576–583. [Google Scholar] [CrossRef]
- Li, J.; Ye, Y.; Chen, L.; Qi, Z. Solubilities of CO2 in Poly(Ethylene Glycols) from (303.15 to 333.15) K. J. Chem. Eng. Data 2012, 57, 610–616. [Google Scholar] [CrossRef]
- Hartono, A.; Kim, I.; Knuutila, H.K.; van der Ham, L.V.; Goetheer, E. Calorimetric Studies of Precipitating Solvent System. Energy Procedia 2017, 114, 744–755. [Google Scholar] [CrossRef]
- Fytianos, G.; Ucar, S.; Grimstvedt, A.; Hyldbakk, A.; Svendsen, H.F.; Knuutila, H.K. Corrosion and Degradation in Mea Based Post-Combustion CO2 Capture. Int. J. Greenh. Gas Control 2016, 46, 48–56. [Google Scholar] [CrossRef]
- Weiland, R.H.; Trass, O. Titrimetric Determination of Acid Gases in Alkali Hydroxides and Amines. Anal. Chem. 1969, 41, 1709–1710. [Google Scholar] [CrossRef]
- Ma’mun, S.; Svendsen, H.F.; Hoff, K.A.; Juliussen, O. Selection of New Absorbents for Carbon Dioxide Capture. Energy Convers. Manag. 2007, 48, 251–258. [Google Scholar] [CrossRef]
- Putta, K.R.; Pinto, D.D.D.; Svendsen, H.F.; Knuutila, H.K. CO2 Absorption into Loaded Aqueous Mea Solutions: Kinetics Assessment Using Penetration Theory. Int. J. Greenh. Gas Control 2016, 53, 338–353. [Google Scholar] [CrossRef]
- Chen, G.-H.; Springer, J. Sorption and Diffusion of Gases in Liquid Crystalline Substances. Mol. Cryst. Liq. Cryst. A 2000, 339, 31–44. [Google Scholar] [CrossRef]
- Montalvo, G.; Valiente, M.; Rodenas, E. Rheological Properties of the L Phase and the Hexagonal, Lamellar, and Cubic Liquid Crystals of the Ctab/Benzyl Alcohol/Water System. Langmuir 1996, 12, 5202–5208. [Google Scholar] [CrossRef]
- Hyun, K.; Wilhelm, M.; Klein, C.O.; Cho, K.S.; Nam, J.G.; Ahn, K.H.; Lee, S.J.; Ewoldt, R.H.; McKinley, G.H. A Review of Nonlinear Oscillatory Shear Tests: Analysis and Application of Large Amplitude Oscillatory Shear (Laos). Prog. Polym. Sci. 2011, 36, 1697–1753. [Google Scholar] [CrossRef]
- Läuger, J.; Stettin, H. Effects of Instrument and Fluid Inertia in Oscillatory Shear in Rotational Rheometers. J. Rheol. 2016, 60, 393–406. [Google Scholar] [CrossRef]
- Davis, J.; Rochelle, G. Thermal Degradation of Monoethanolamine at Stripper Conditions. Energy Procedia 2009, 1, 327–333. [Google Scholar] [CrossRef]


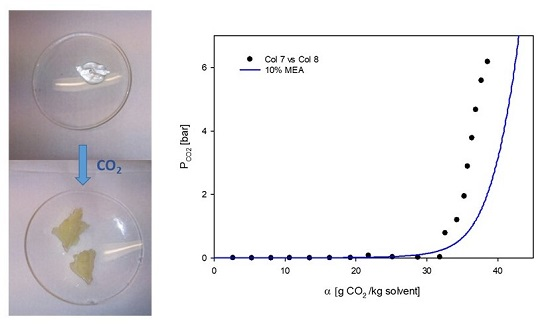
| Sample | CO2 Loading α (g CO2/kg Sample) |
|---|---|
| t = 1 | 14.9 ± 1.4 |
| t = 2 | 22.6 * |
| t = 3 | 27.3 ± 0.3 |
| t = 4 | 34.8 * |
| t = 5 | 37.7 ± 1.1 |
| Sample | 15 °C | 25 °C | ||
|---|---|---|---|---|
| Phases | a, d [Å] | Phases | a, d [Å] | |
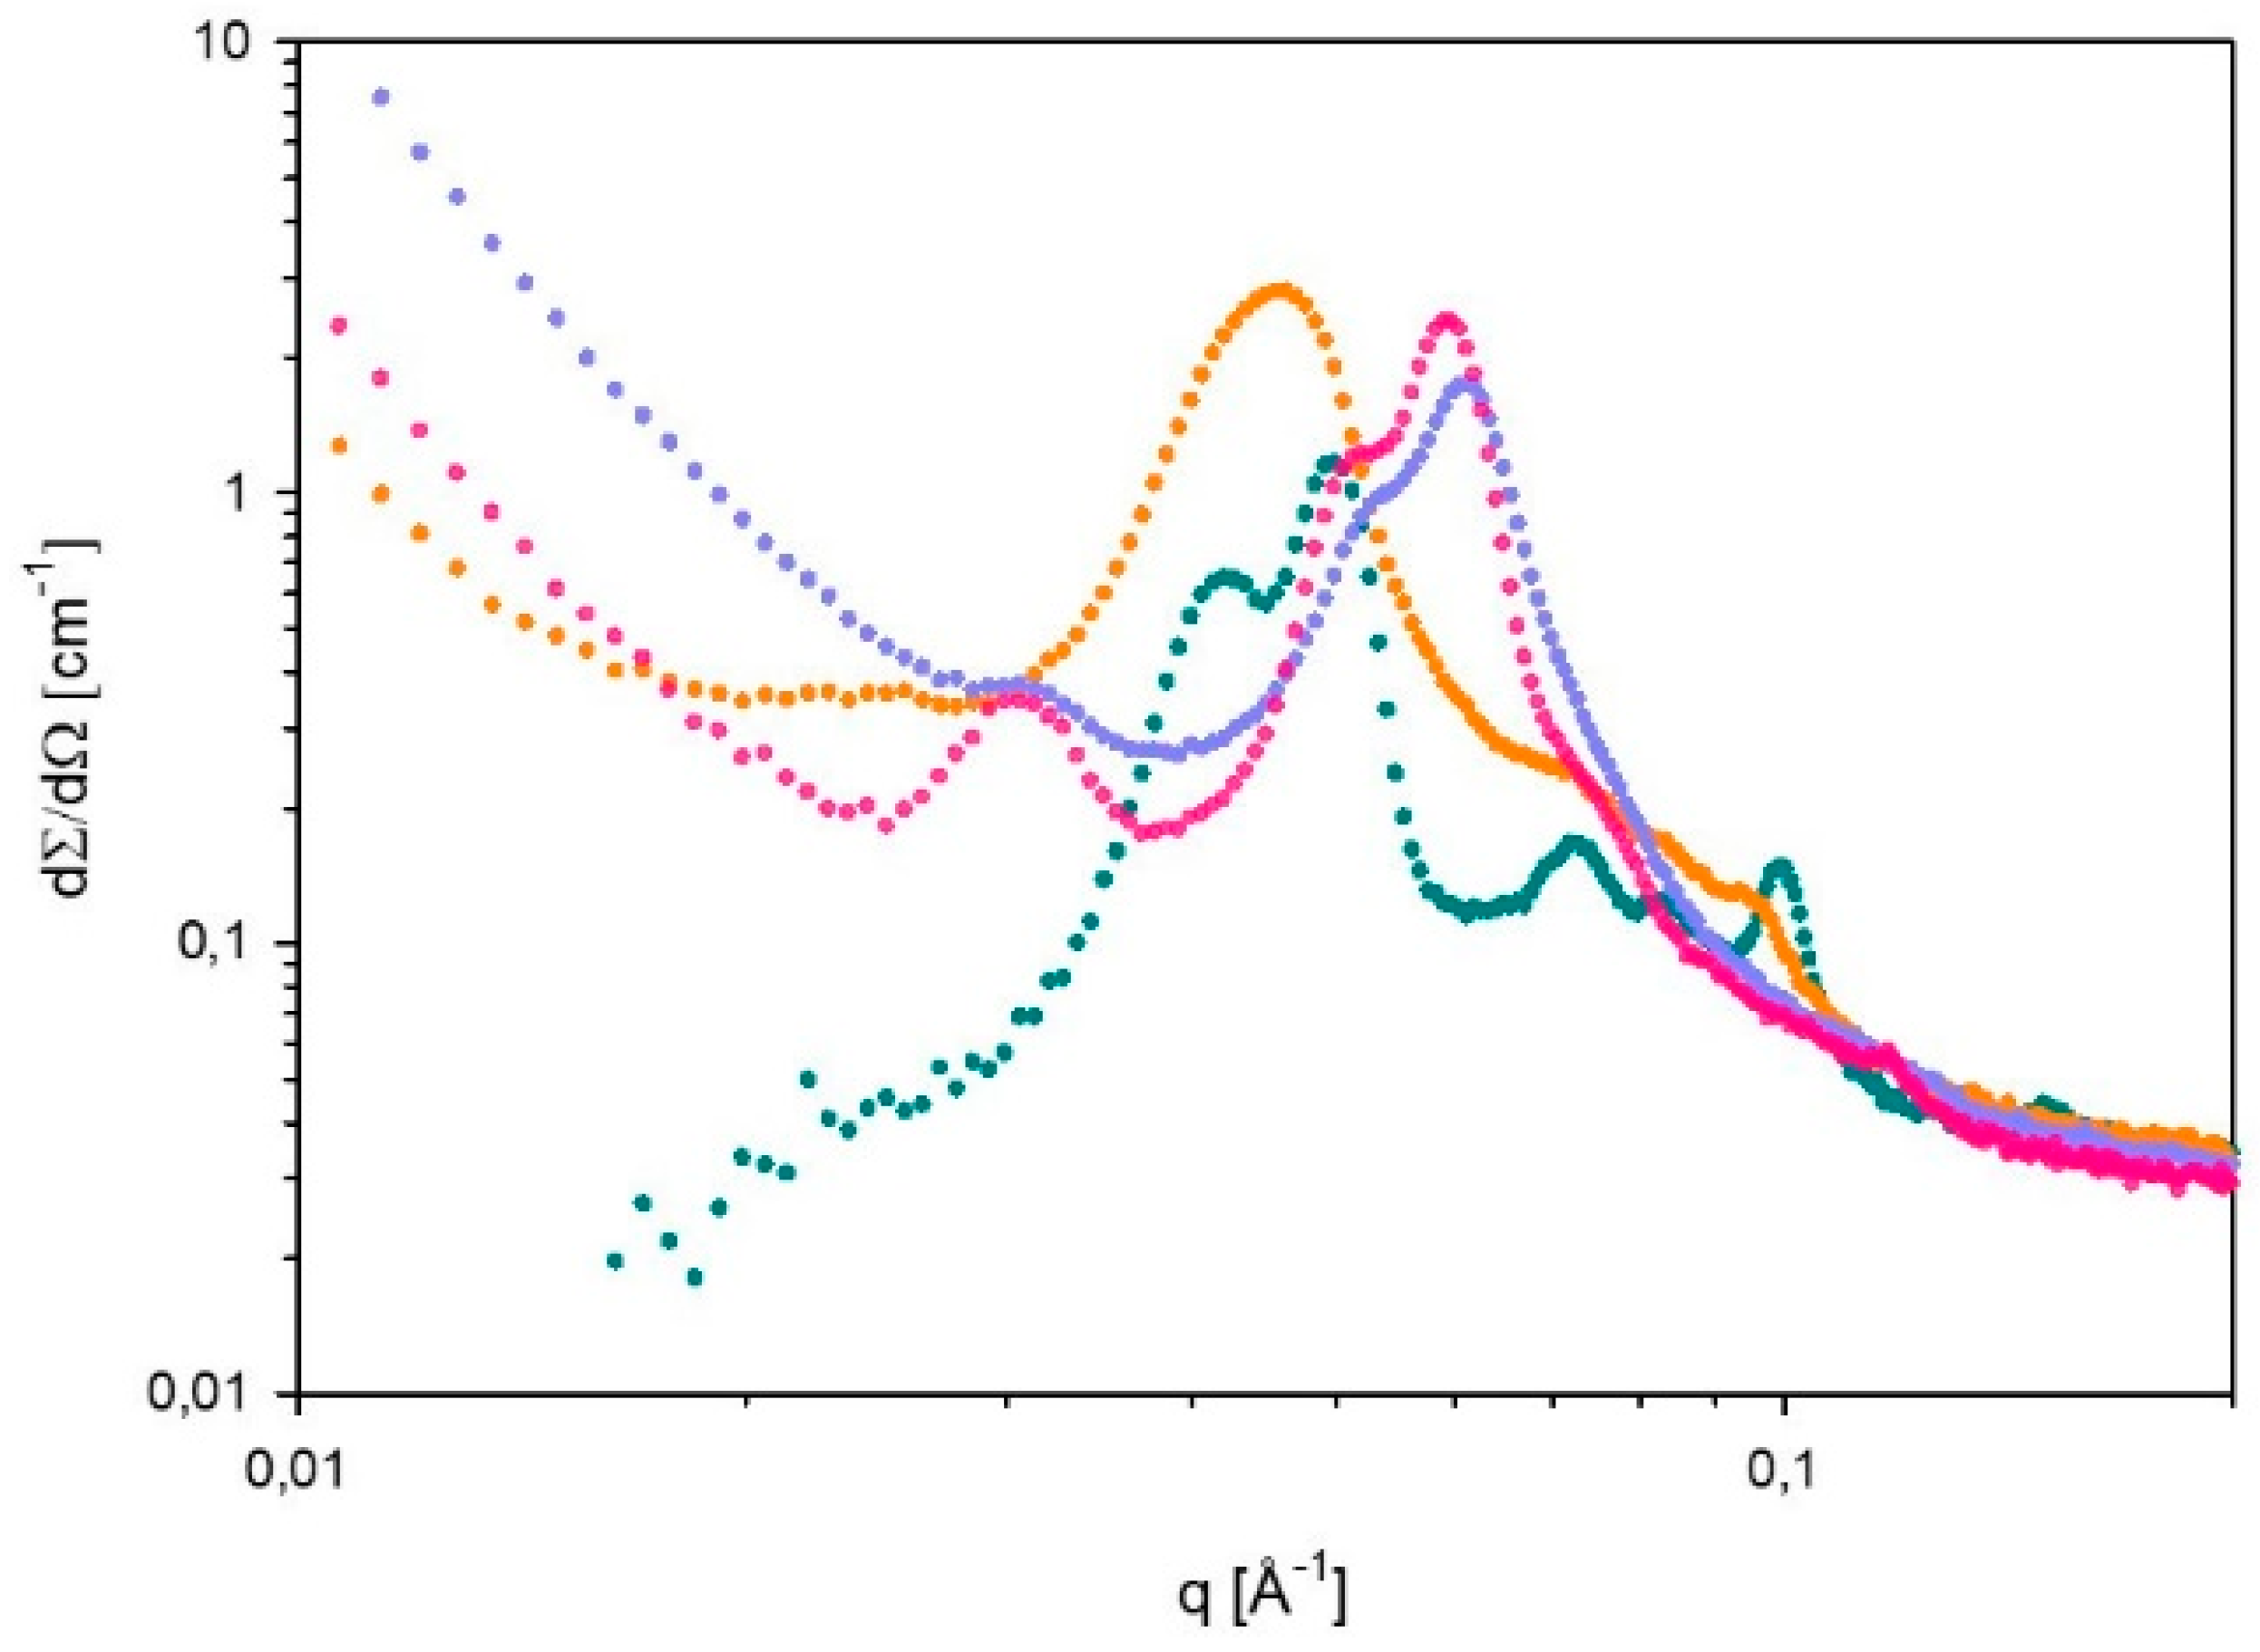
| α = 0 g CO2/kg sample | Lα | 123 | Lα+H | a=173; d=126 |
| α = 15 g CO2/kg sample | - | - | - | - |
| α = 27 g CO2/kg sample | H | 278 | H | 237 |
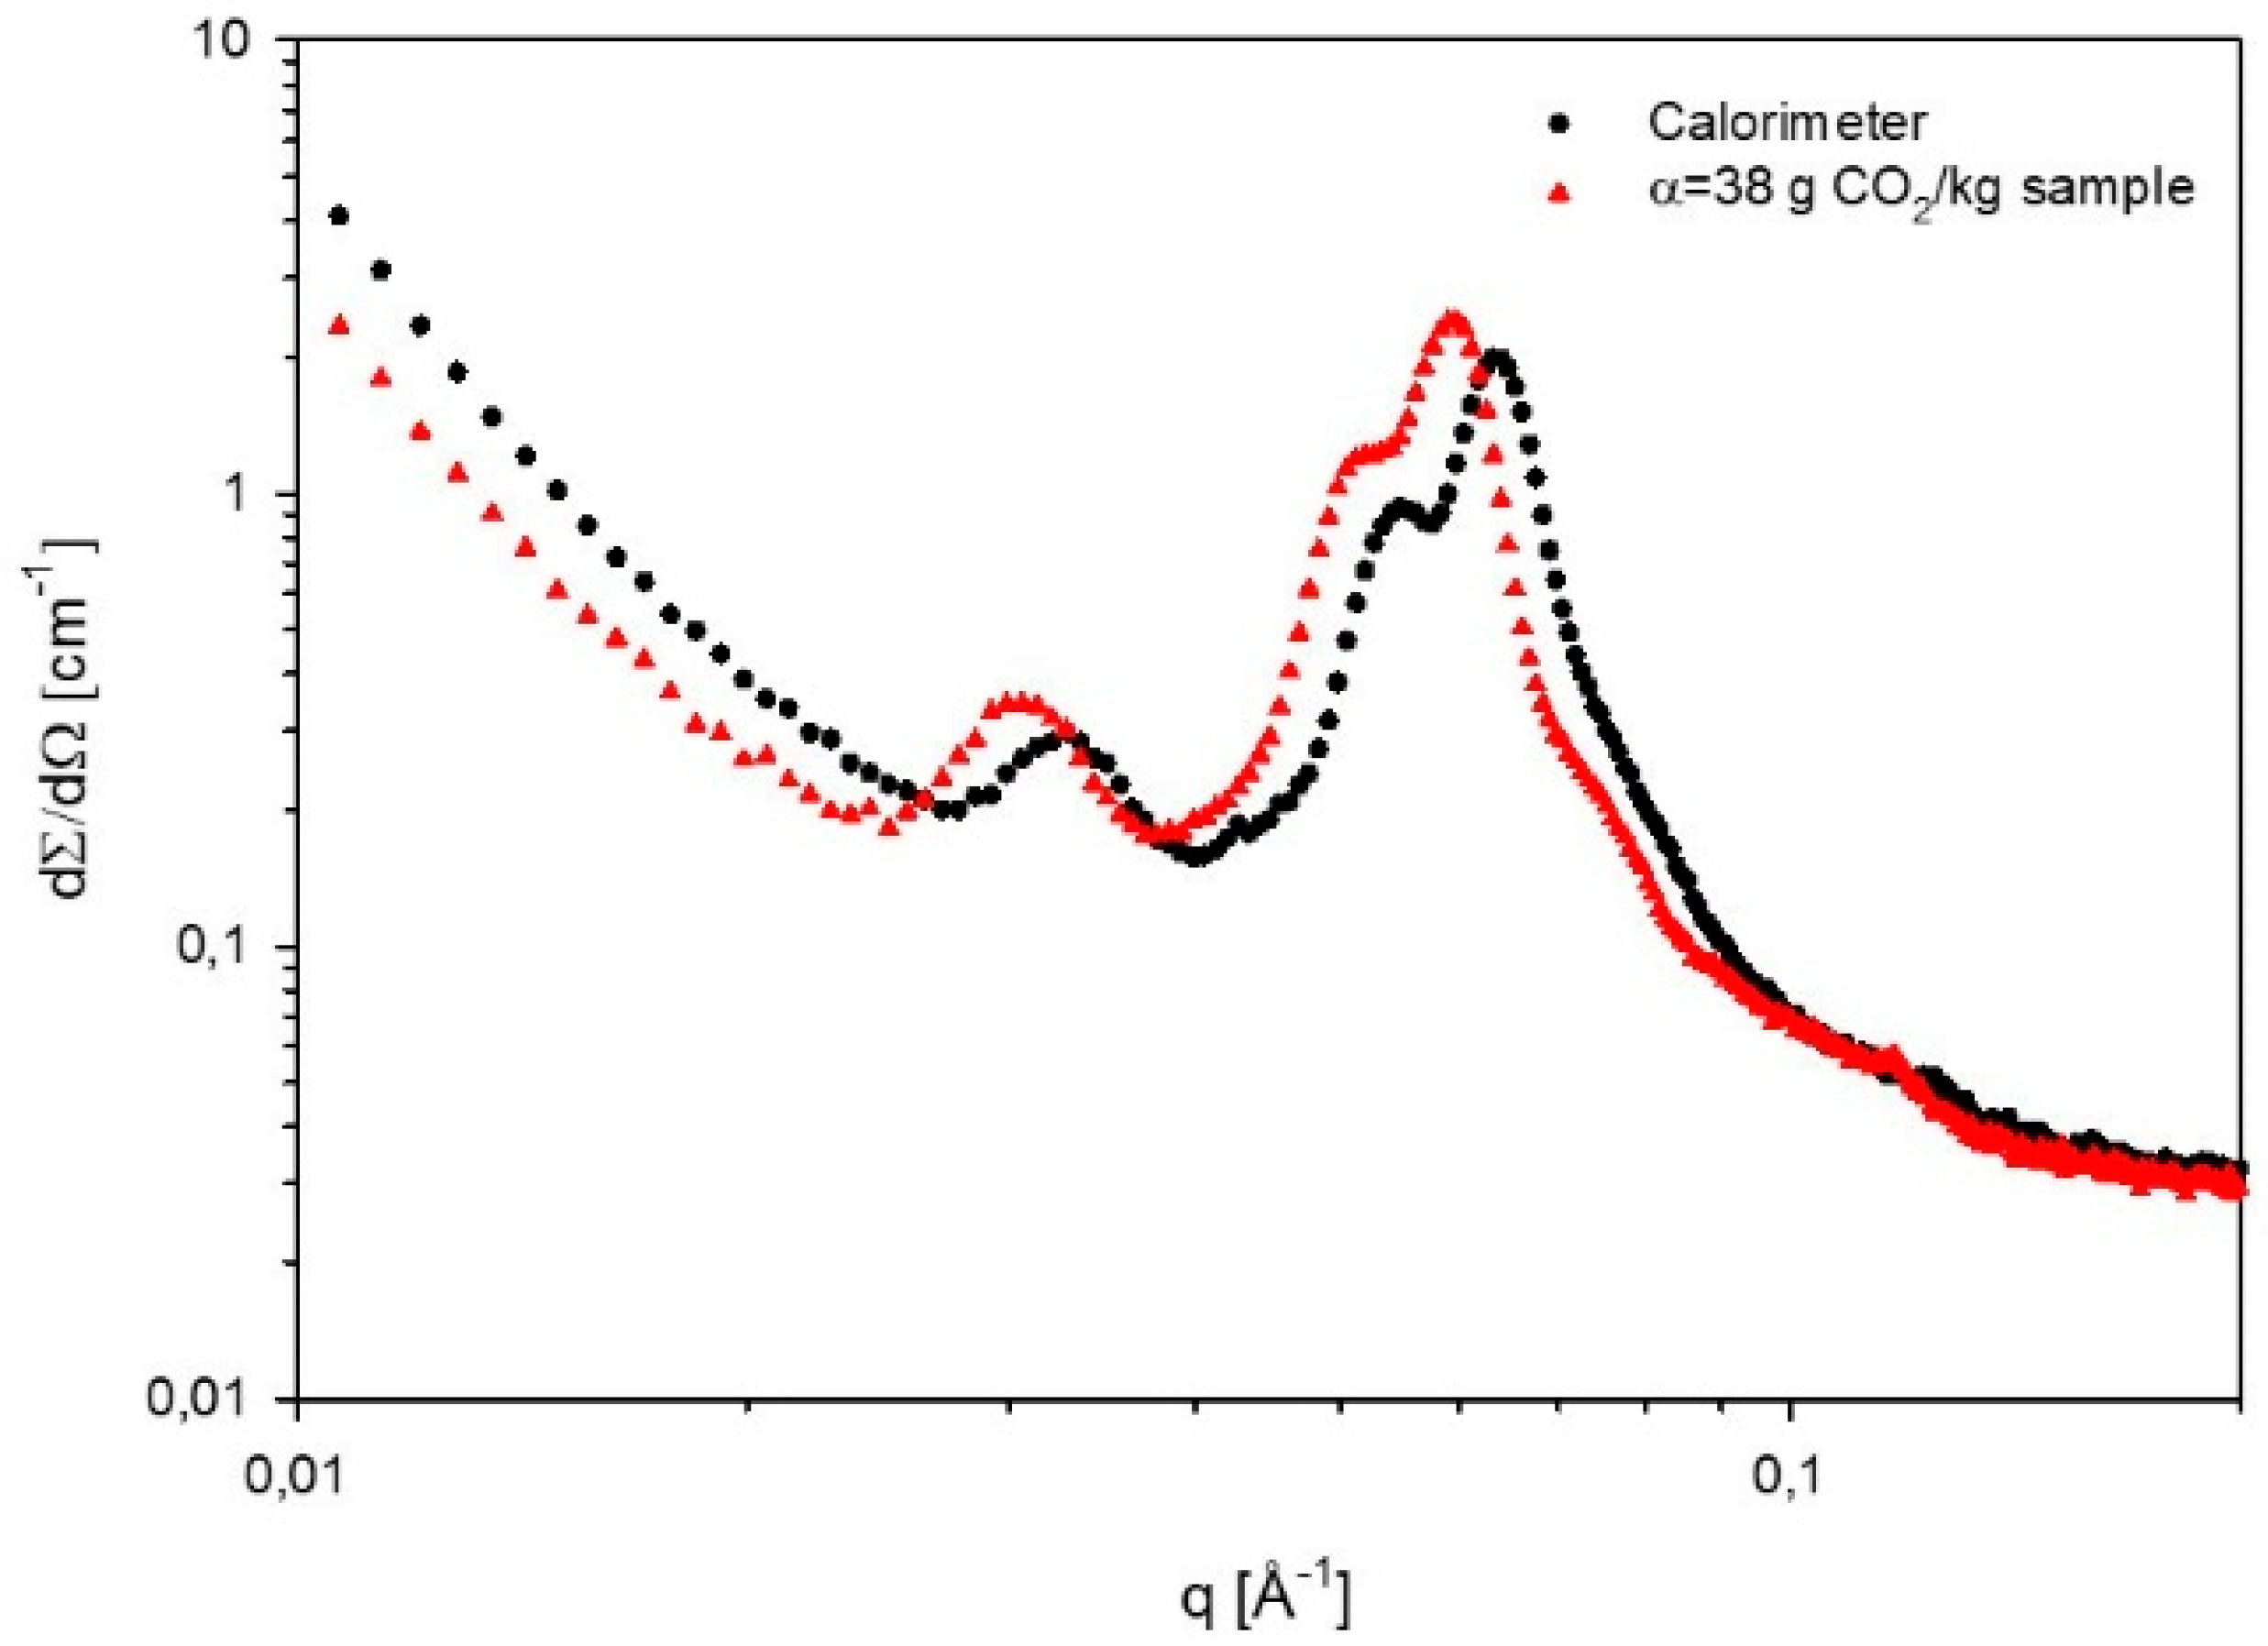
| α = 38 g CO2/kg sample | H | 268 | H | 237 |
| Calorimeter | - | - | H | 243 |
| Sample | Amine Groups (mol/g CO2 + g Sample) |
|---|---|
| α = 38 g CO2/kg sample | 1.441 ± 0.002 |
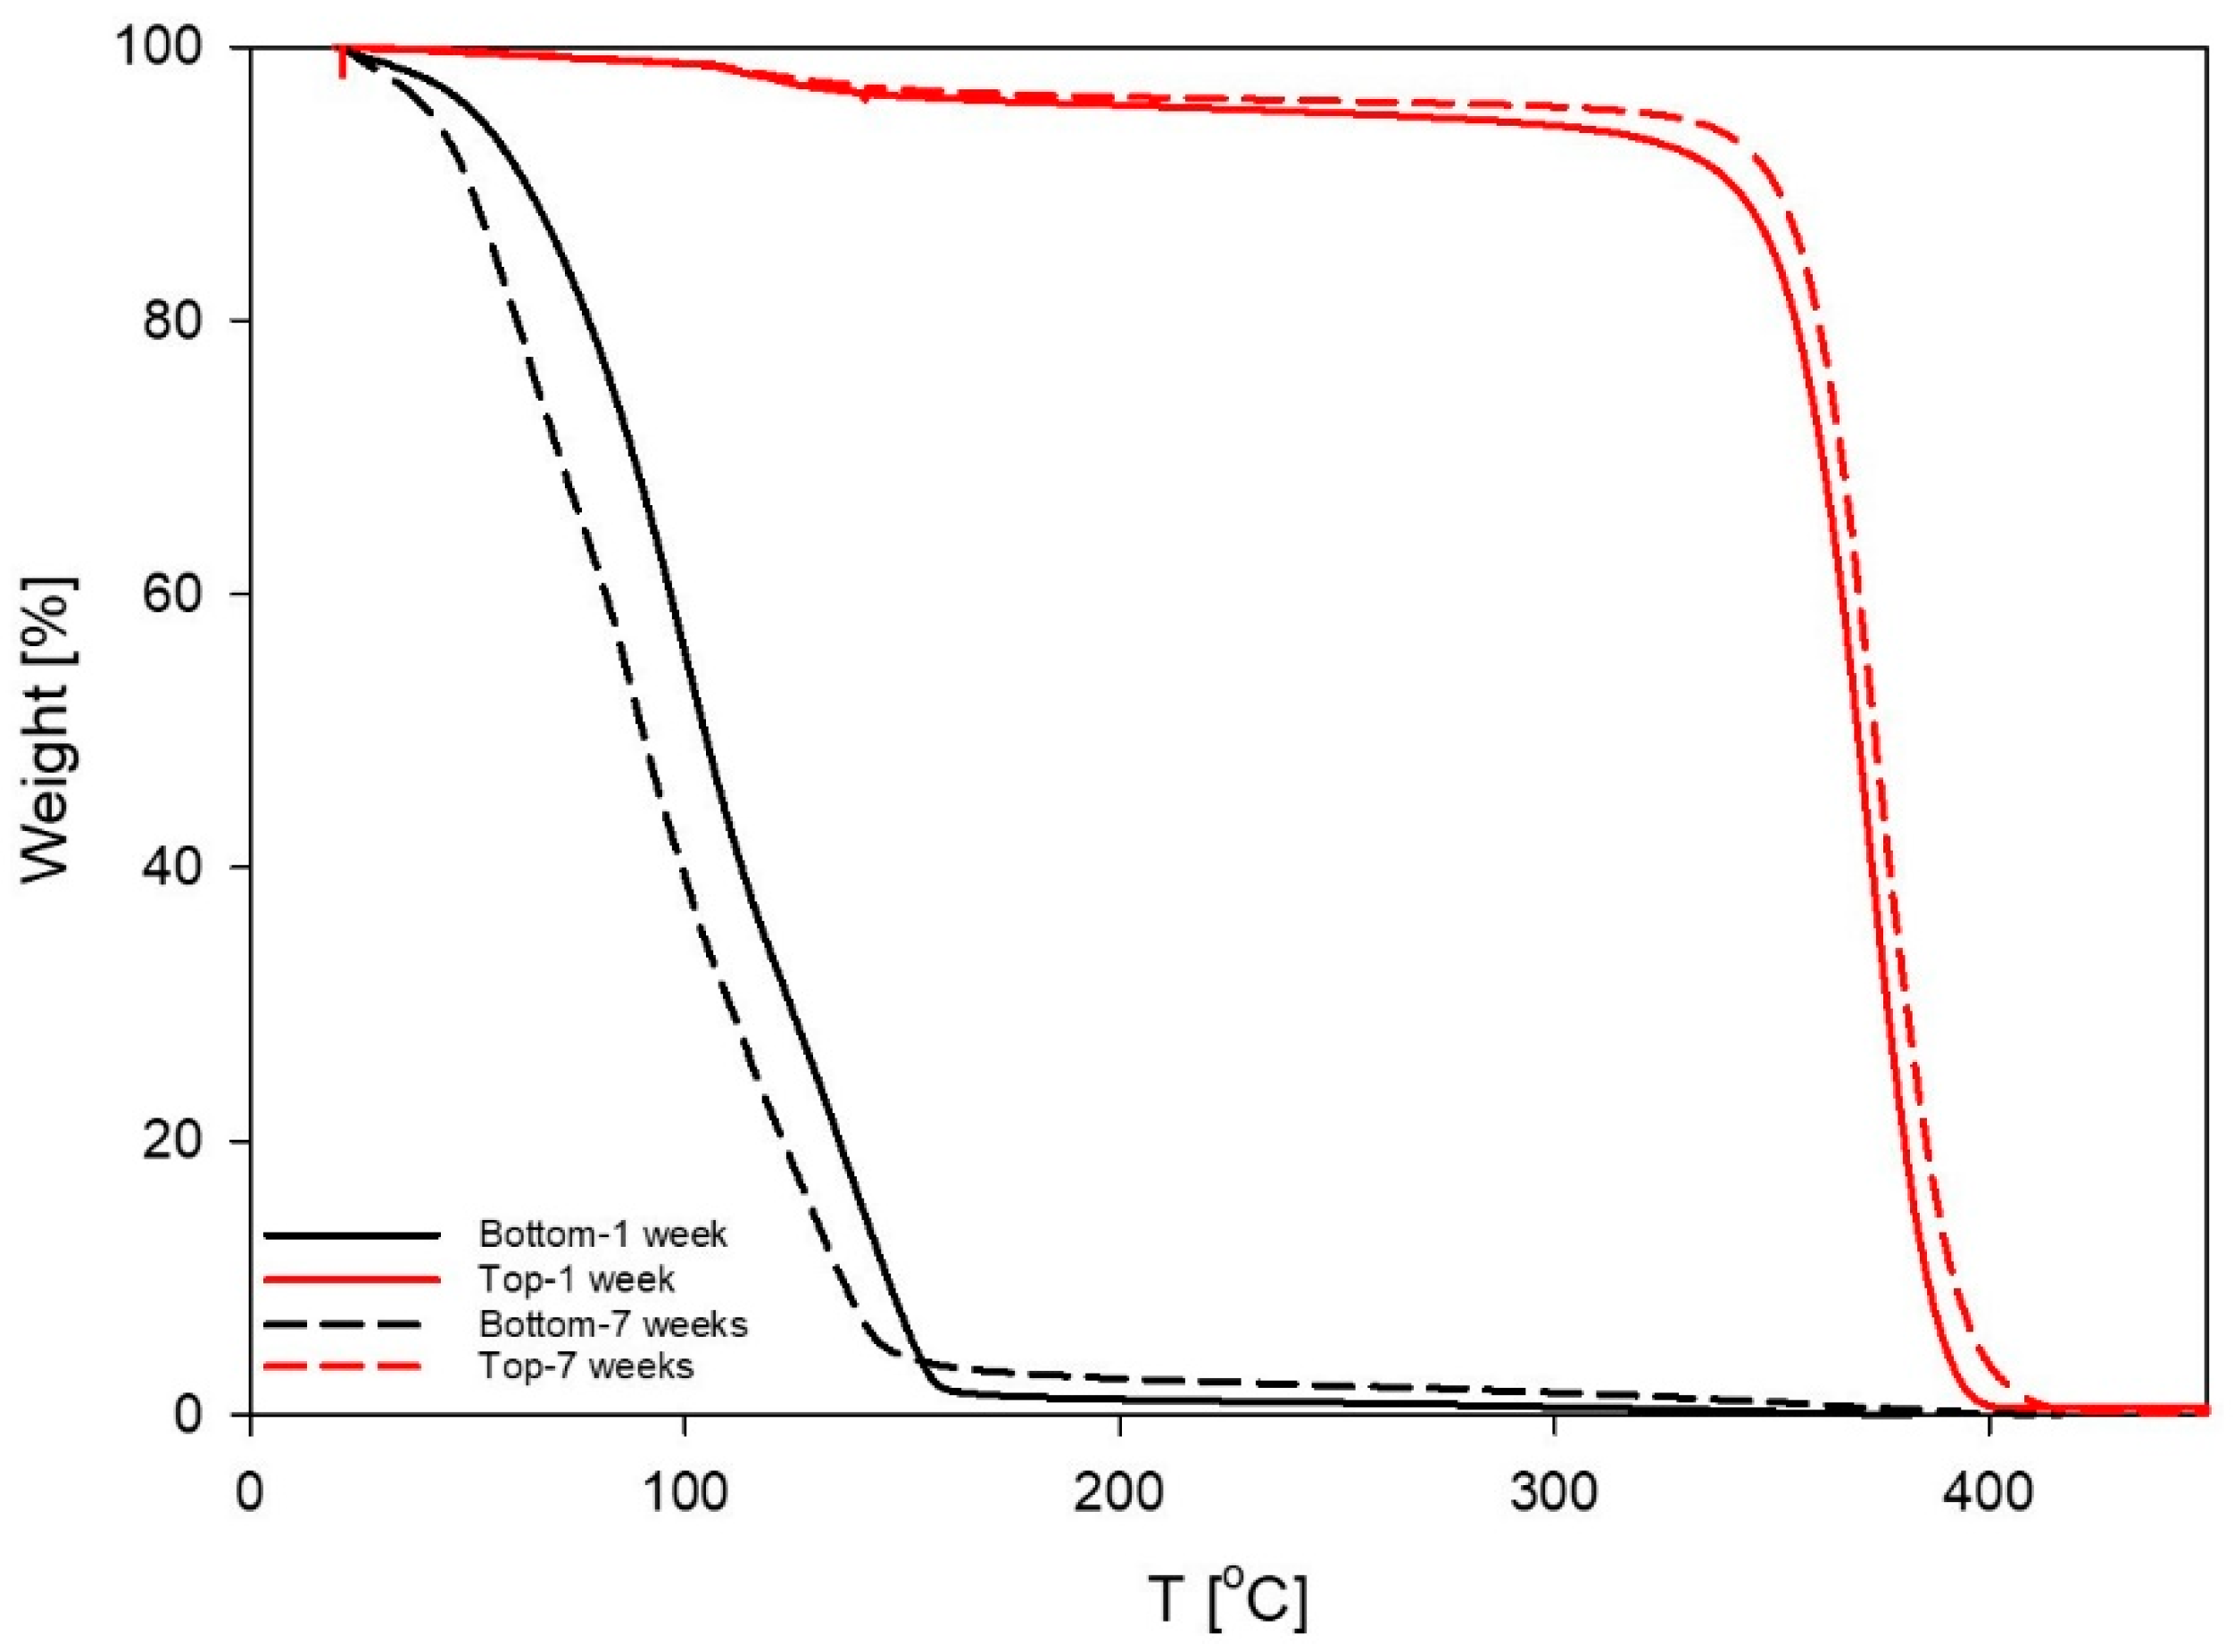
| Top phase (1 week) | N/A |
| Bottom phase (1 week) | 3.628 ± 0.008 |
| Top phase (7 weeks) | N/A |
| Bottom phase (7 weeks) | 3.78 ± 0.010 |
| Estimated degraded sample 1 week | 1.425 |
| Estimated degraded sample 7 weeks | 1.485 |
© 2019 by the authors. Licensee MDPI, Basel, Switzerland. This article is an open access article distributed under the terms and conditions of the Creative Commons Attribution (CC BY) license (http://creativecommons.org/licenses/by/4.0/).
Share and Cite
Rodríguez-Fabià, S.; Norrman, J.; Knuutila, H.K.; Sjöblom, J.; Paso, K. CO2 in Lyotropic Liquid Crystals: Phase Equilibria Behavior and Rheology. Polymers 2019, 11, 309. https://doi.org/10.3390/polym11020309
Rodríguez-Fabià S, Norrman J, Knuutila HK, Sjöblom J, Paso K. CO2 in Lyotropic Liquid Crystals: Phase Equilibria Behavior and Rheology. Polymers. 2019; 11(2):309. https://doi.org/10.3390/polym11020309
Chicago/Turabian StyleRodríguez-Fabià, Sandra, Jens Norrman, Hanna K. Knuutila, Johan Sjöblom, and Kristofer Paso. 2019. "CO2 in Lyotropic Liquid Crystals: Phase Equilibria Behavior and Rheology" Polymers 11, no. 2: 309. https://doi.org/10.3390/polym11020309
APA StyleRodríguez-Fabià, S., Norrman, J., Knuutila, H. K., Sjöblom, J., & Paso, K. (2019). CO2 in Lyotropic Liquid Crystals: Phase Equilibria Behavior and Rheology. Polymers, 11(2), 309. https://doi.org/10.3390/polym11020309