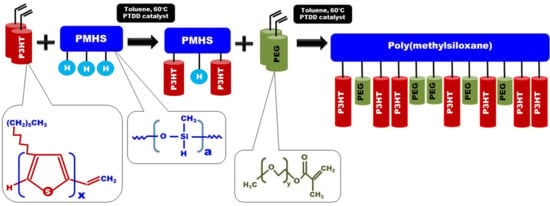
3.1. Material Identification
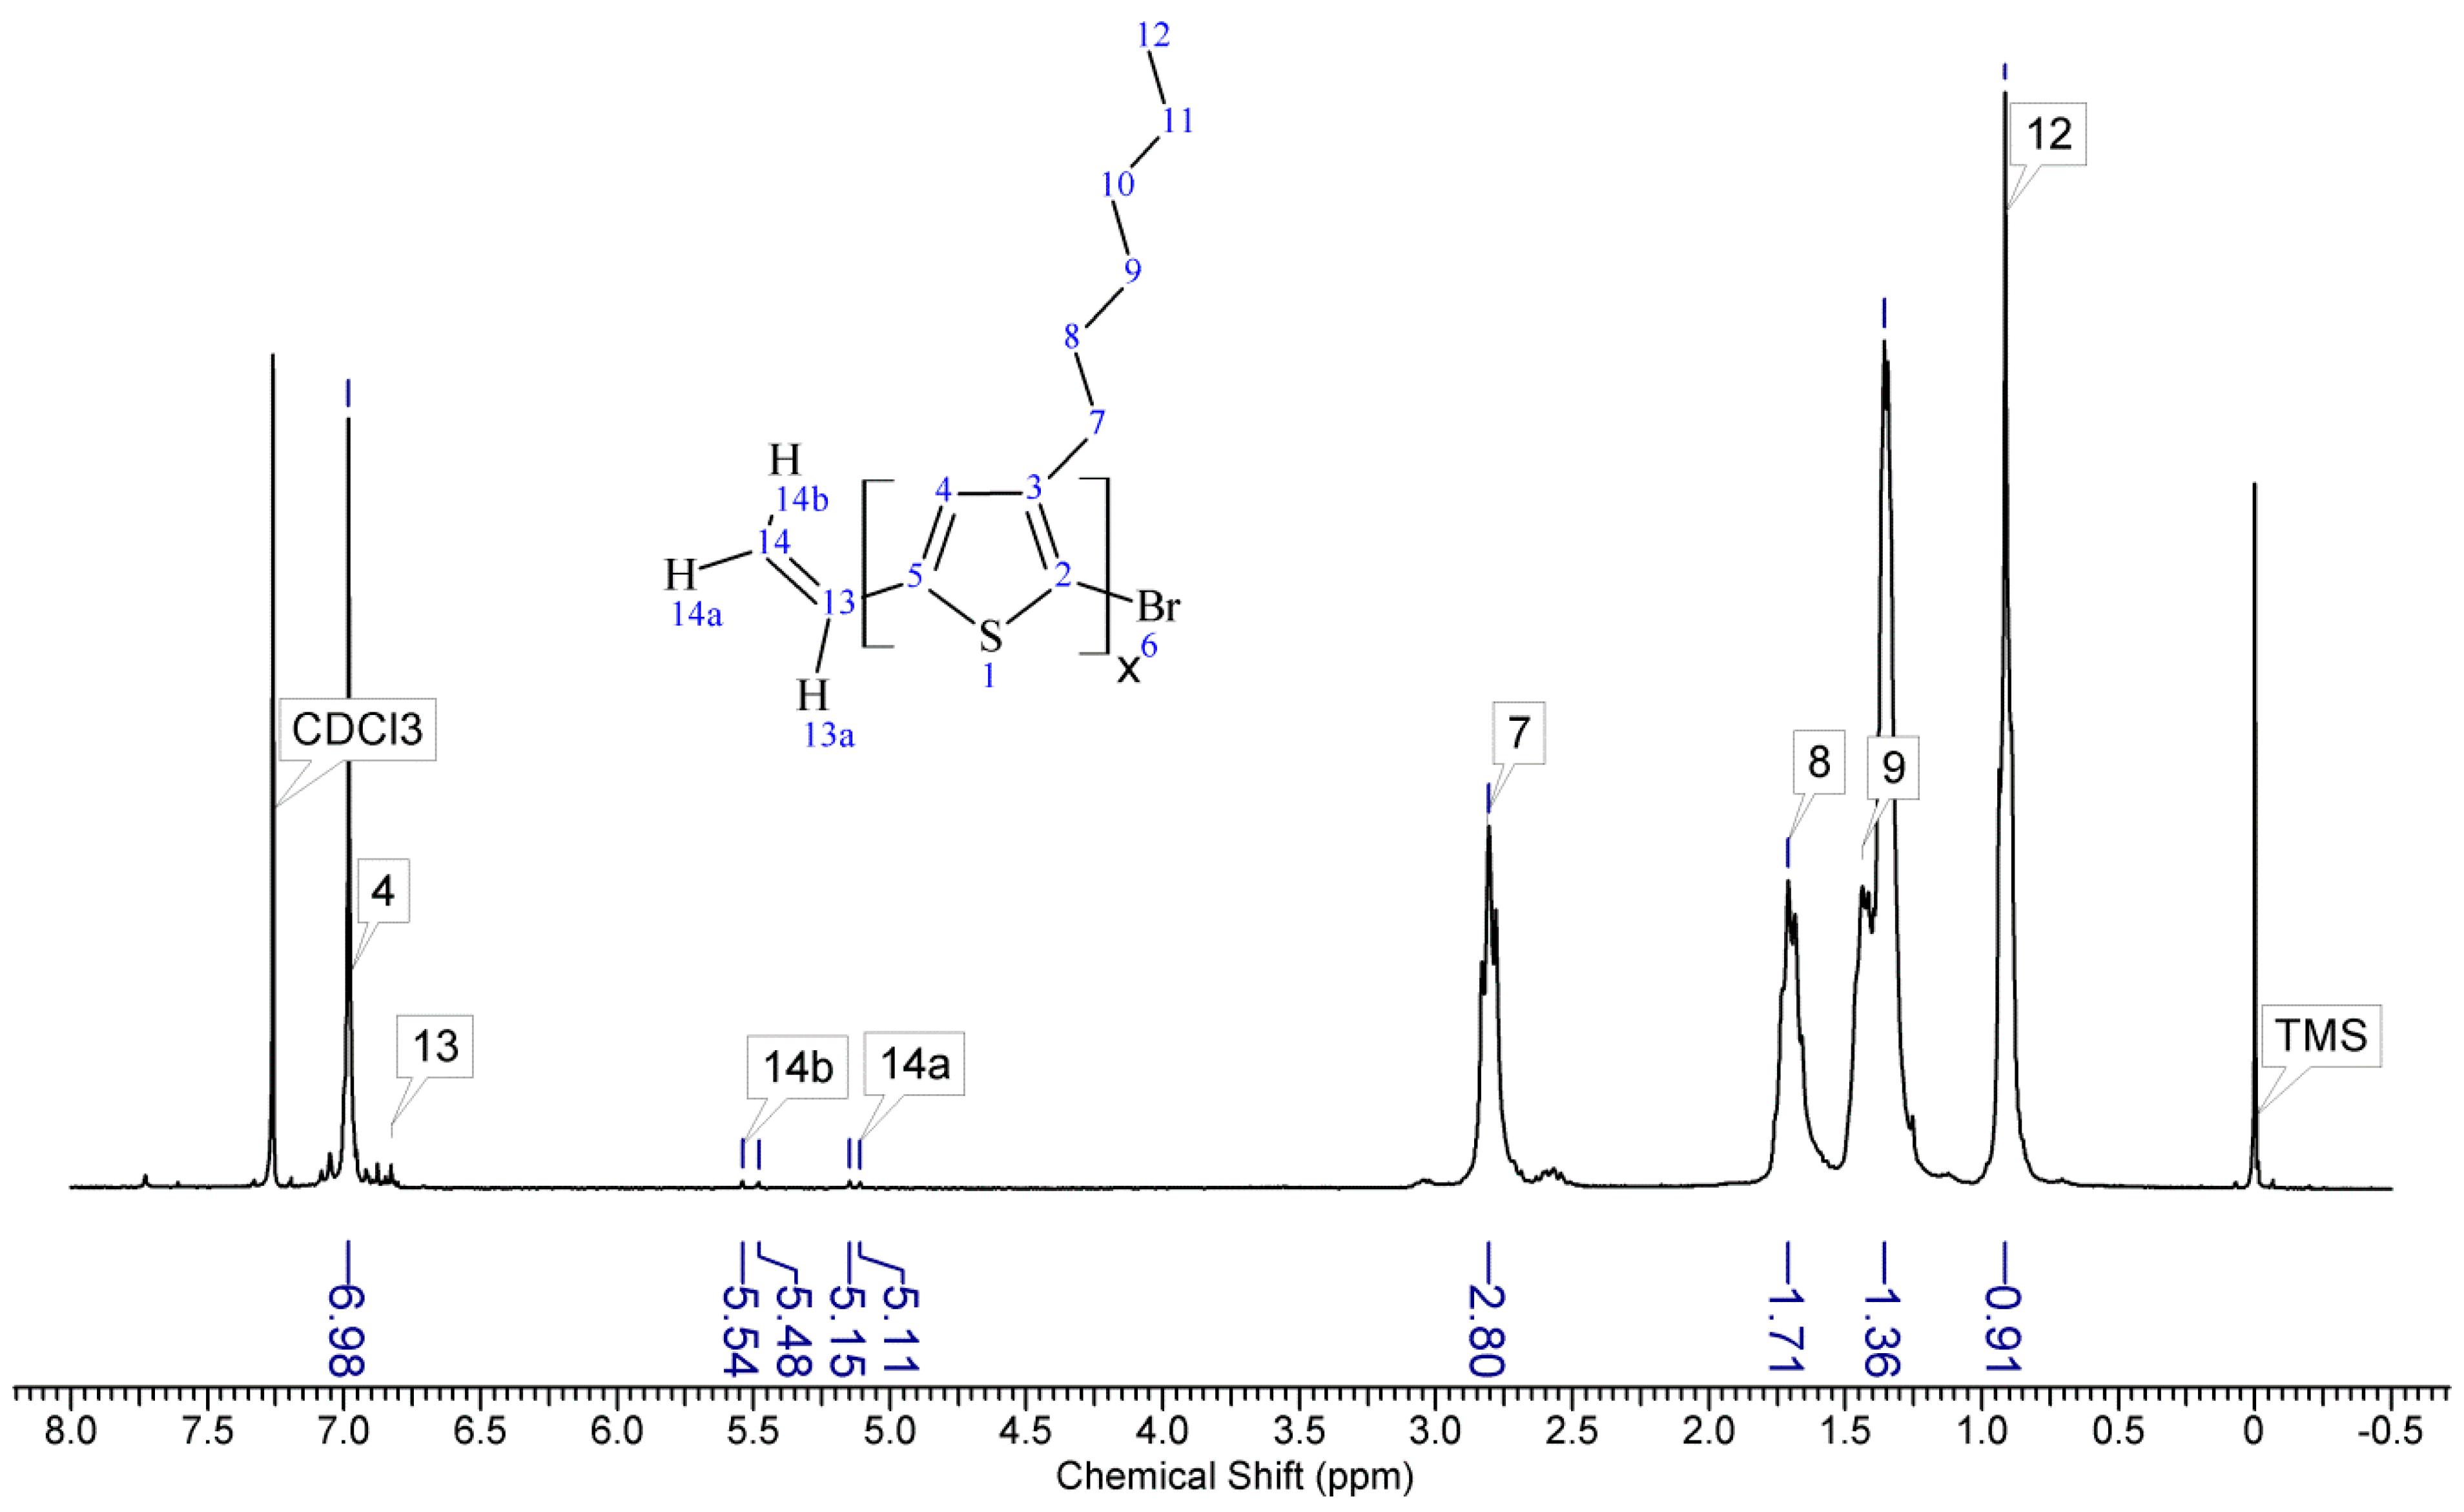
Regioregular poly(3-hexylthiophene) functionalised with terminal vinyl group was synthesised via the GRIM method with in situ end group attaching. Polysiloxane-graft-(P3HT; PEG) samples were prepared via a variation of the hydrosilylation reaction, in the course of a facile one-pot synthesis. In all syntheses, an excess of PMHS over P3HT was used. The structure of the obtained products was confirmed by comparing the
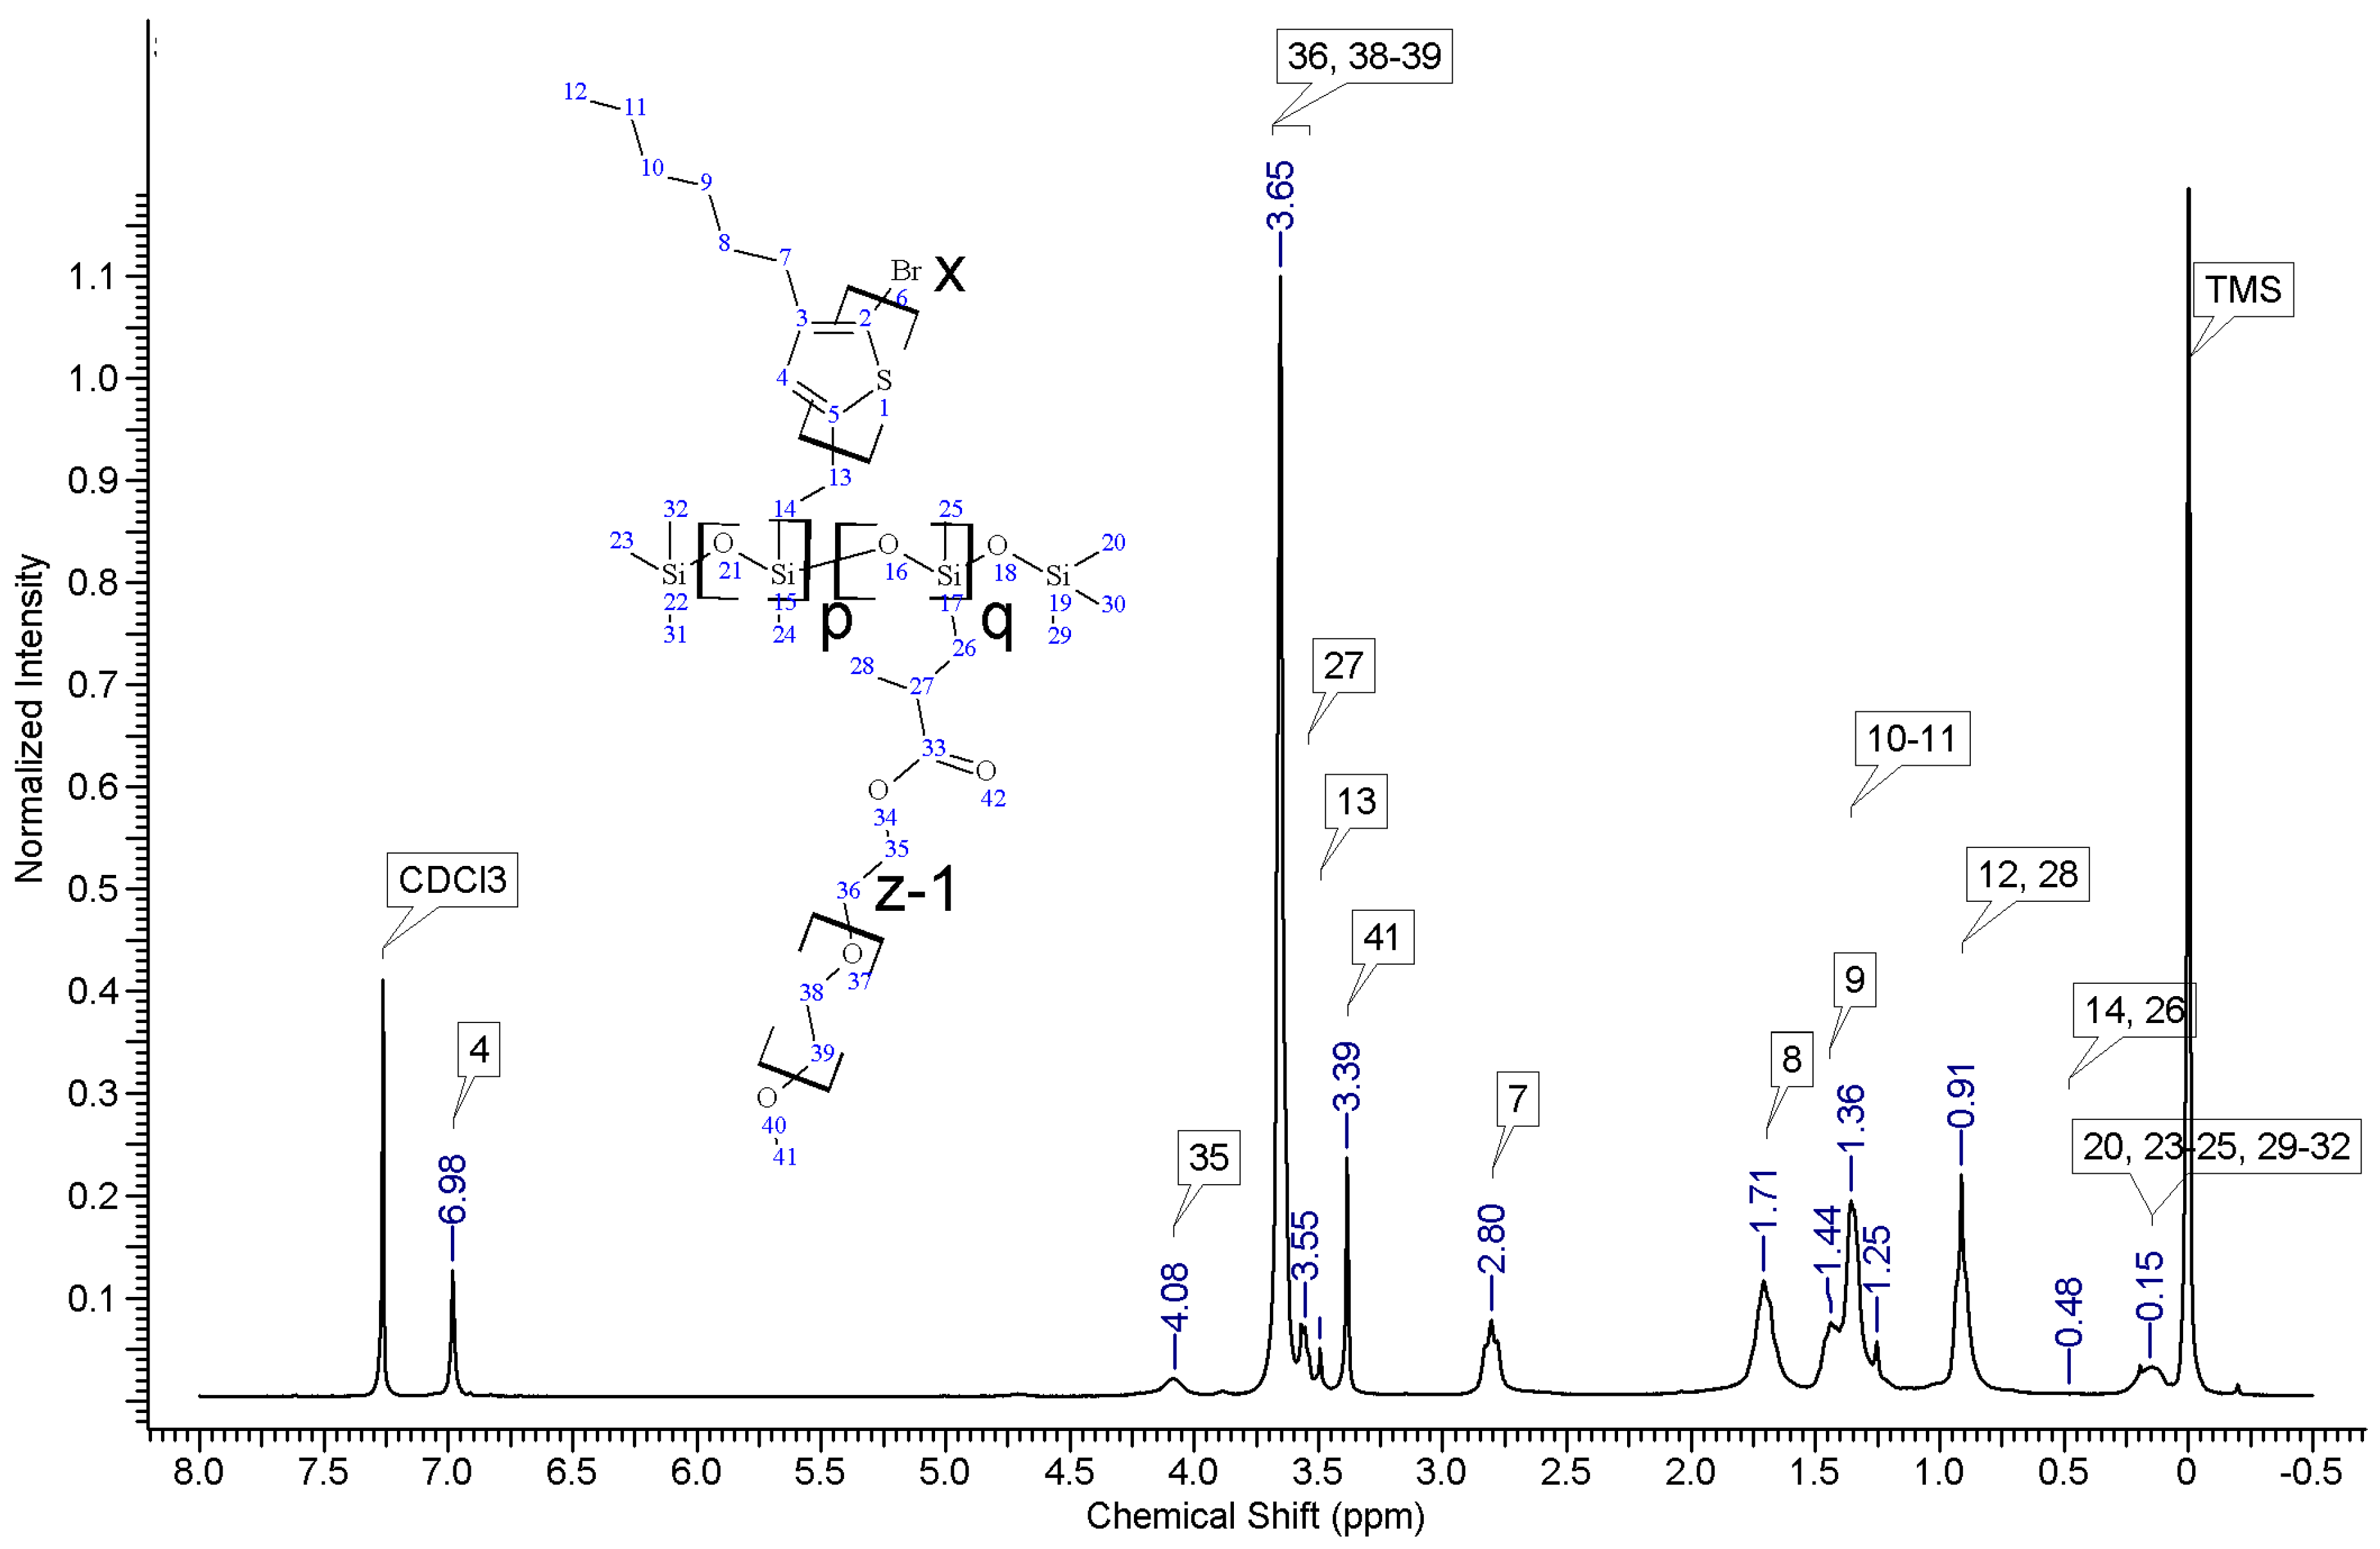
1HNMR spectra of reactants and the final product. On the spectrum of the copolymer, the disappearance of the signal of protons originating from the vinyl group at δ 5.13 and 5.51 ppm [
18] and the disappearance of the proton signal of hydrogen atom attached to the silicon atom in the main chain (4.67–4.72 ppm) is observed. Comparative analysis of
1H-NMR spectra (see
Appendix A) indicate that grafting on poly(methylhydrosiloxane) backbones has occurred in each case. The vinyl terminated P3HT spectrum clearly shows the signals of the geminal protons in vinyl terminal group: two doublets at δ 5.51 (H14b, J
H14b-H13a = 17.8 Hz) and 5.13 ppm (H14a, J
H14a-H13a = 11.4 Hz) (
Figure A1 in
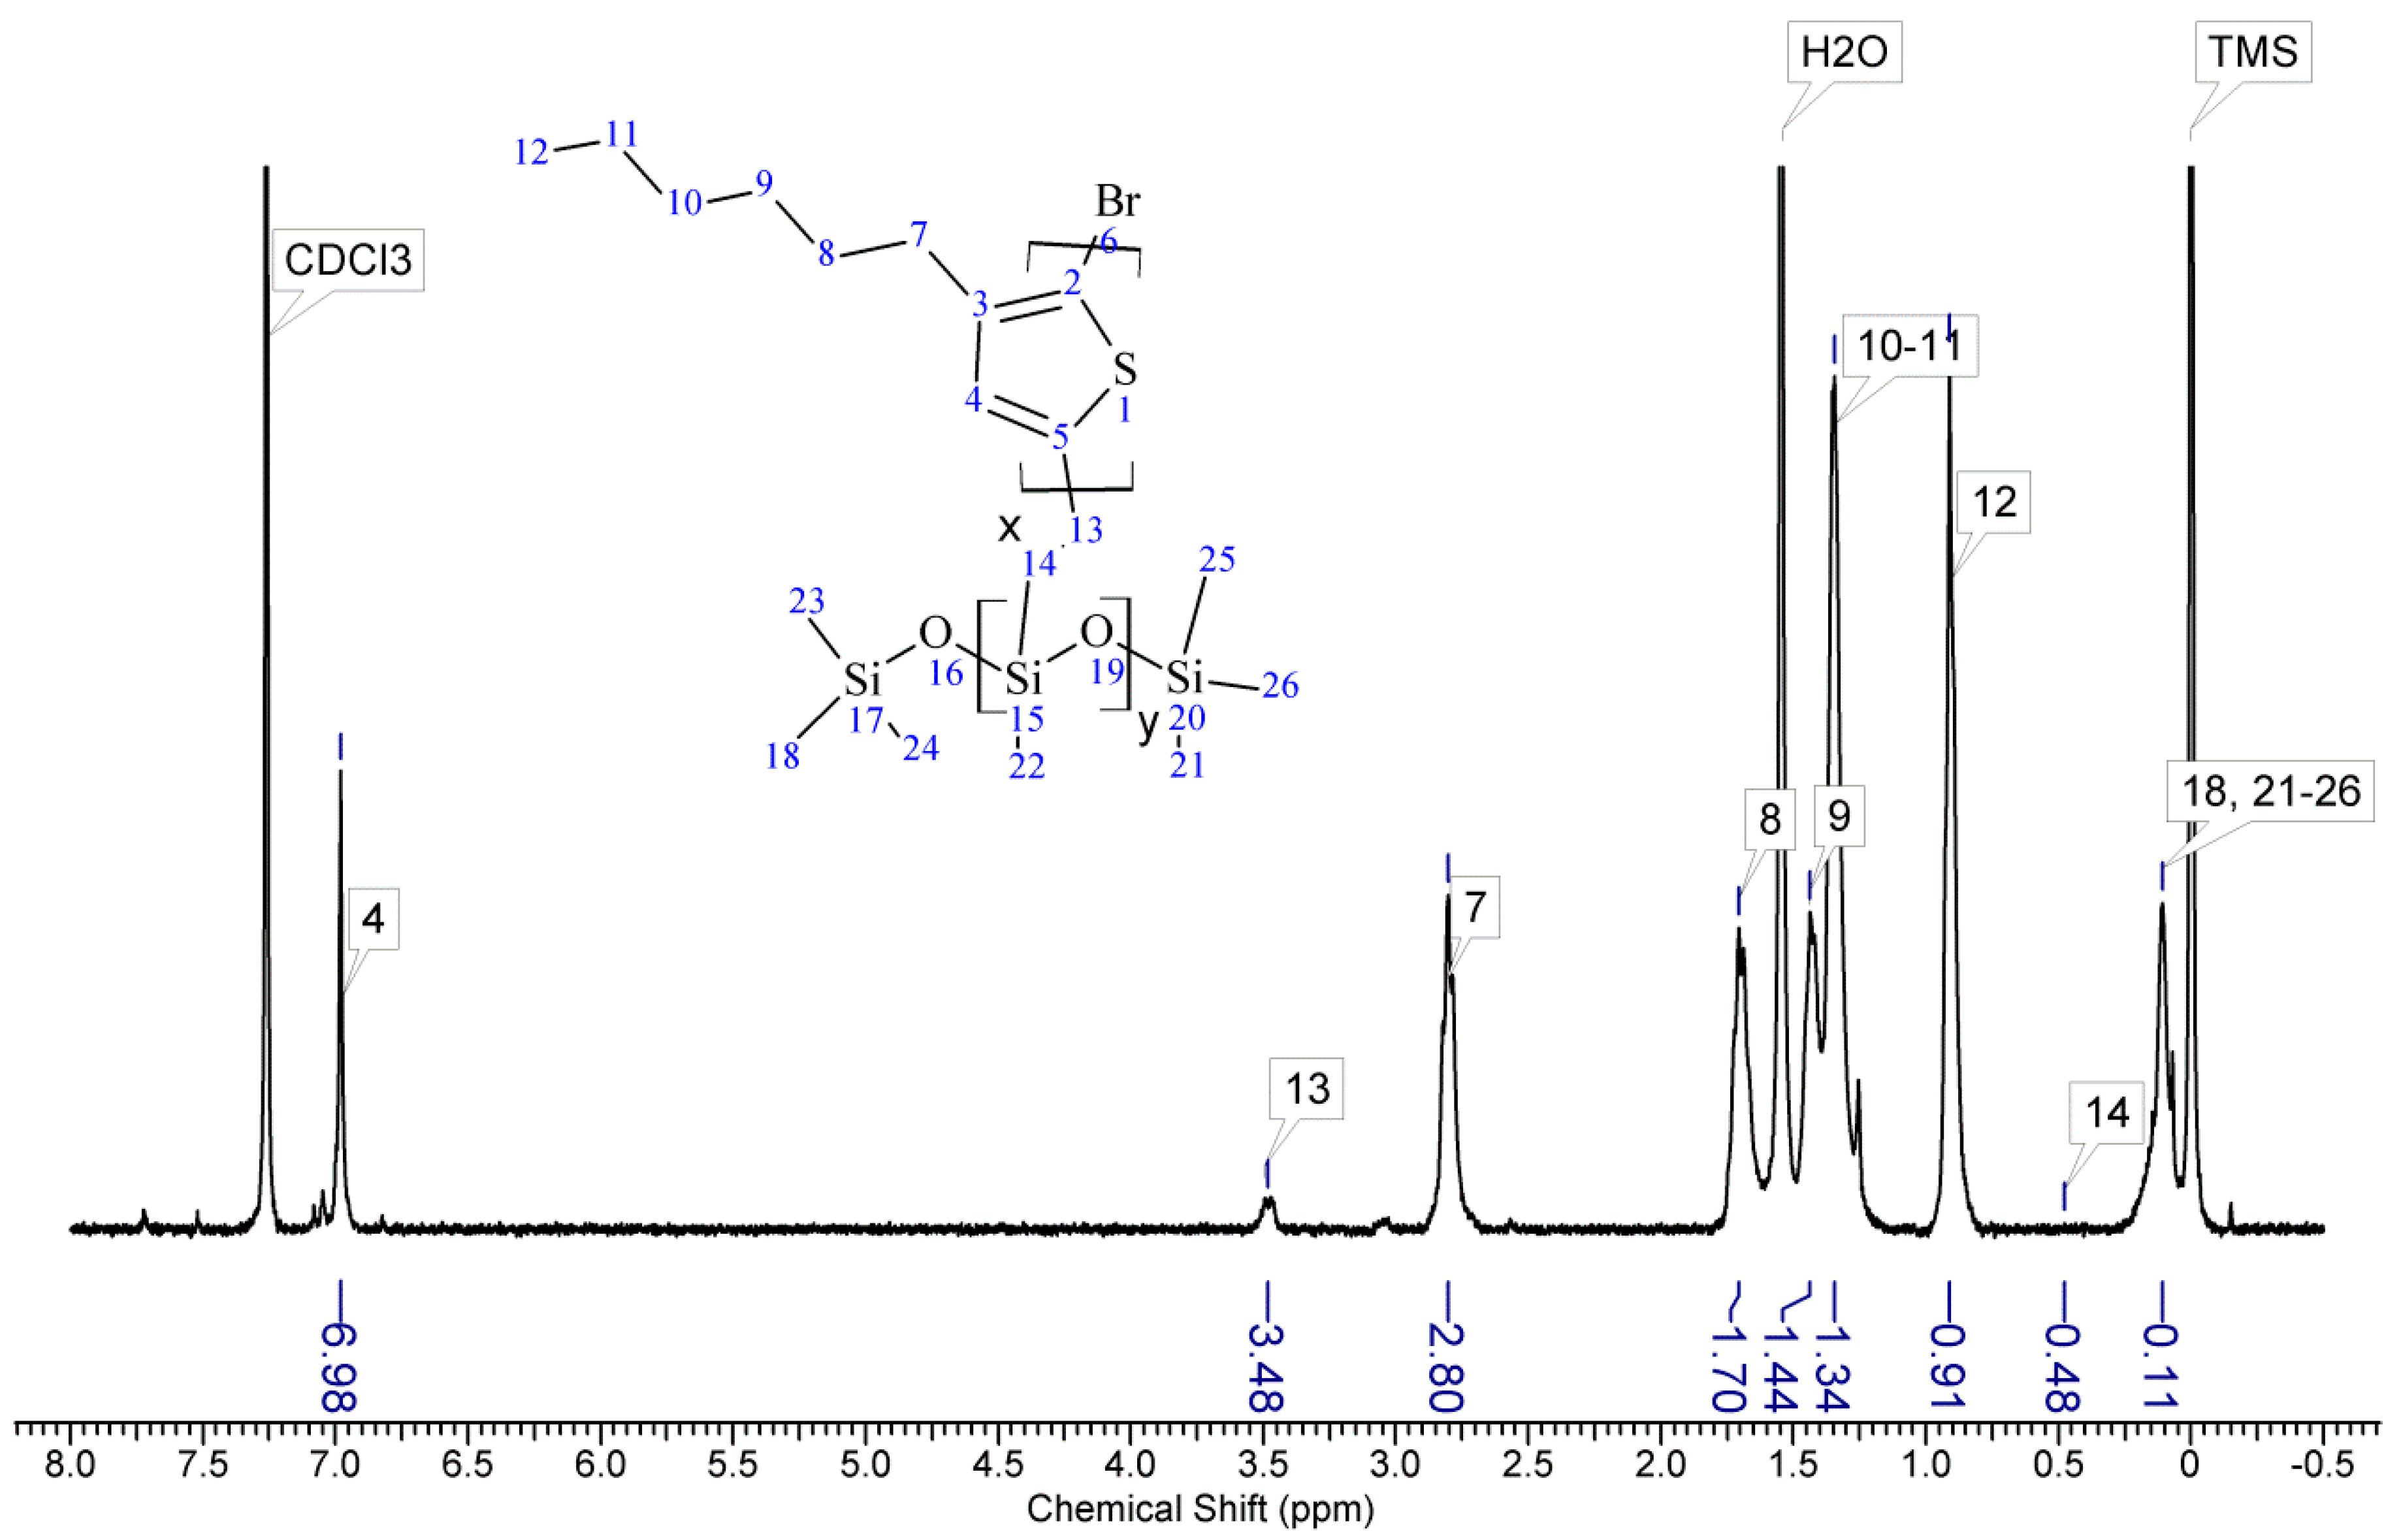
Appendix A). The signal of the third proton of vinyl group, adjacent to thiophene ring (H13a, ddδ6.84 ppm) overlaps with the group of aromatic protons signals. There are no vinyl proton signals on any copolymer spectrum, but a new signal at δ3.48 ppm appears, derived from the protons of the –CH
2– group adjacent to the aromatic ring originating from the vinyl group being transformed in the course of grafting vinyl terminated P3HT onto poly(methylhydrosiloxane) backbone (
Figure A2,
Figure A3,
Figure A4 and
Figure A5,
Scheme A2 in
Appendix A). A broad signal of the Si–CH
3 protons originating from the polysiloxane chains appears on the spectra of all copolymers at δ0.10–0.25 ppm and a broad signal of new Si–CH
2 groups at about 0.48–0.50 ppm arises, while the Si–H proton signal at δ4.67–4.72 ppm declines. Also. the signal at δ0.10–0.25 ppm is broadened and significantly different comparing to original signal on PMHS spectrum. This implies changes arising from alteration of Si–CH
3 protons surrounding resulting from the grafting. Furthermore, it should be noted that if the P3HTvin and polysiloxane segments were not chemically bonded, the elution of unbound polysiloxane chains during methanol extraction would occur. Simultaneously, the abovementioned δ0.10–0.25 ppm signals of Si–CH
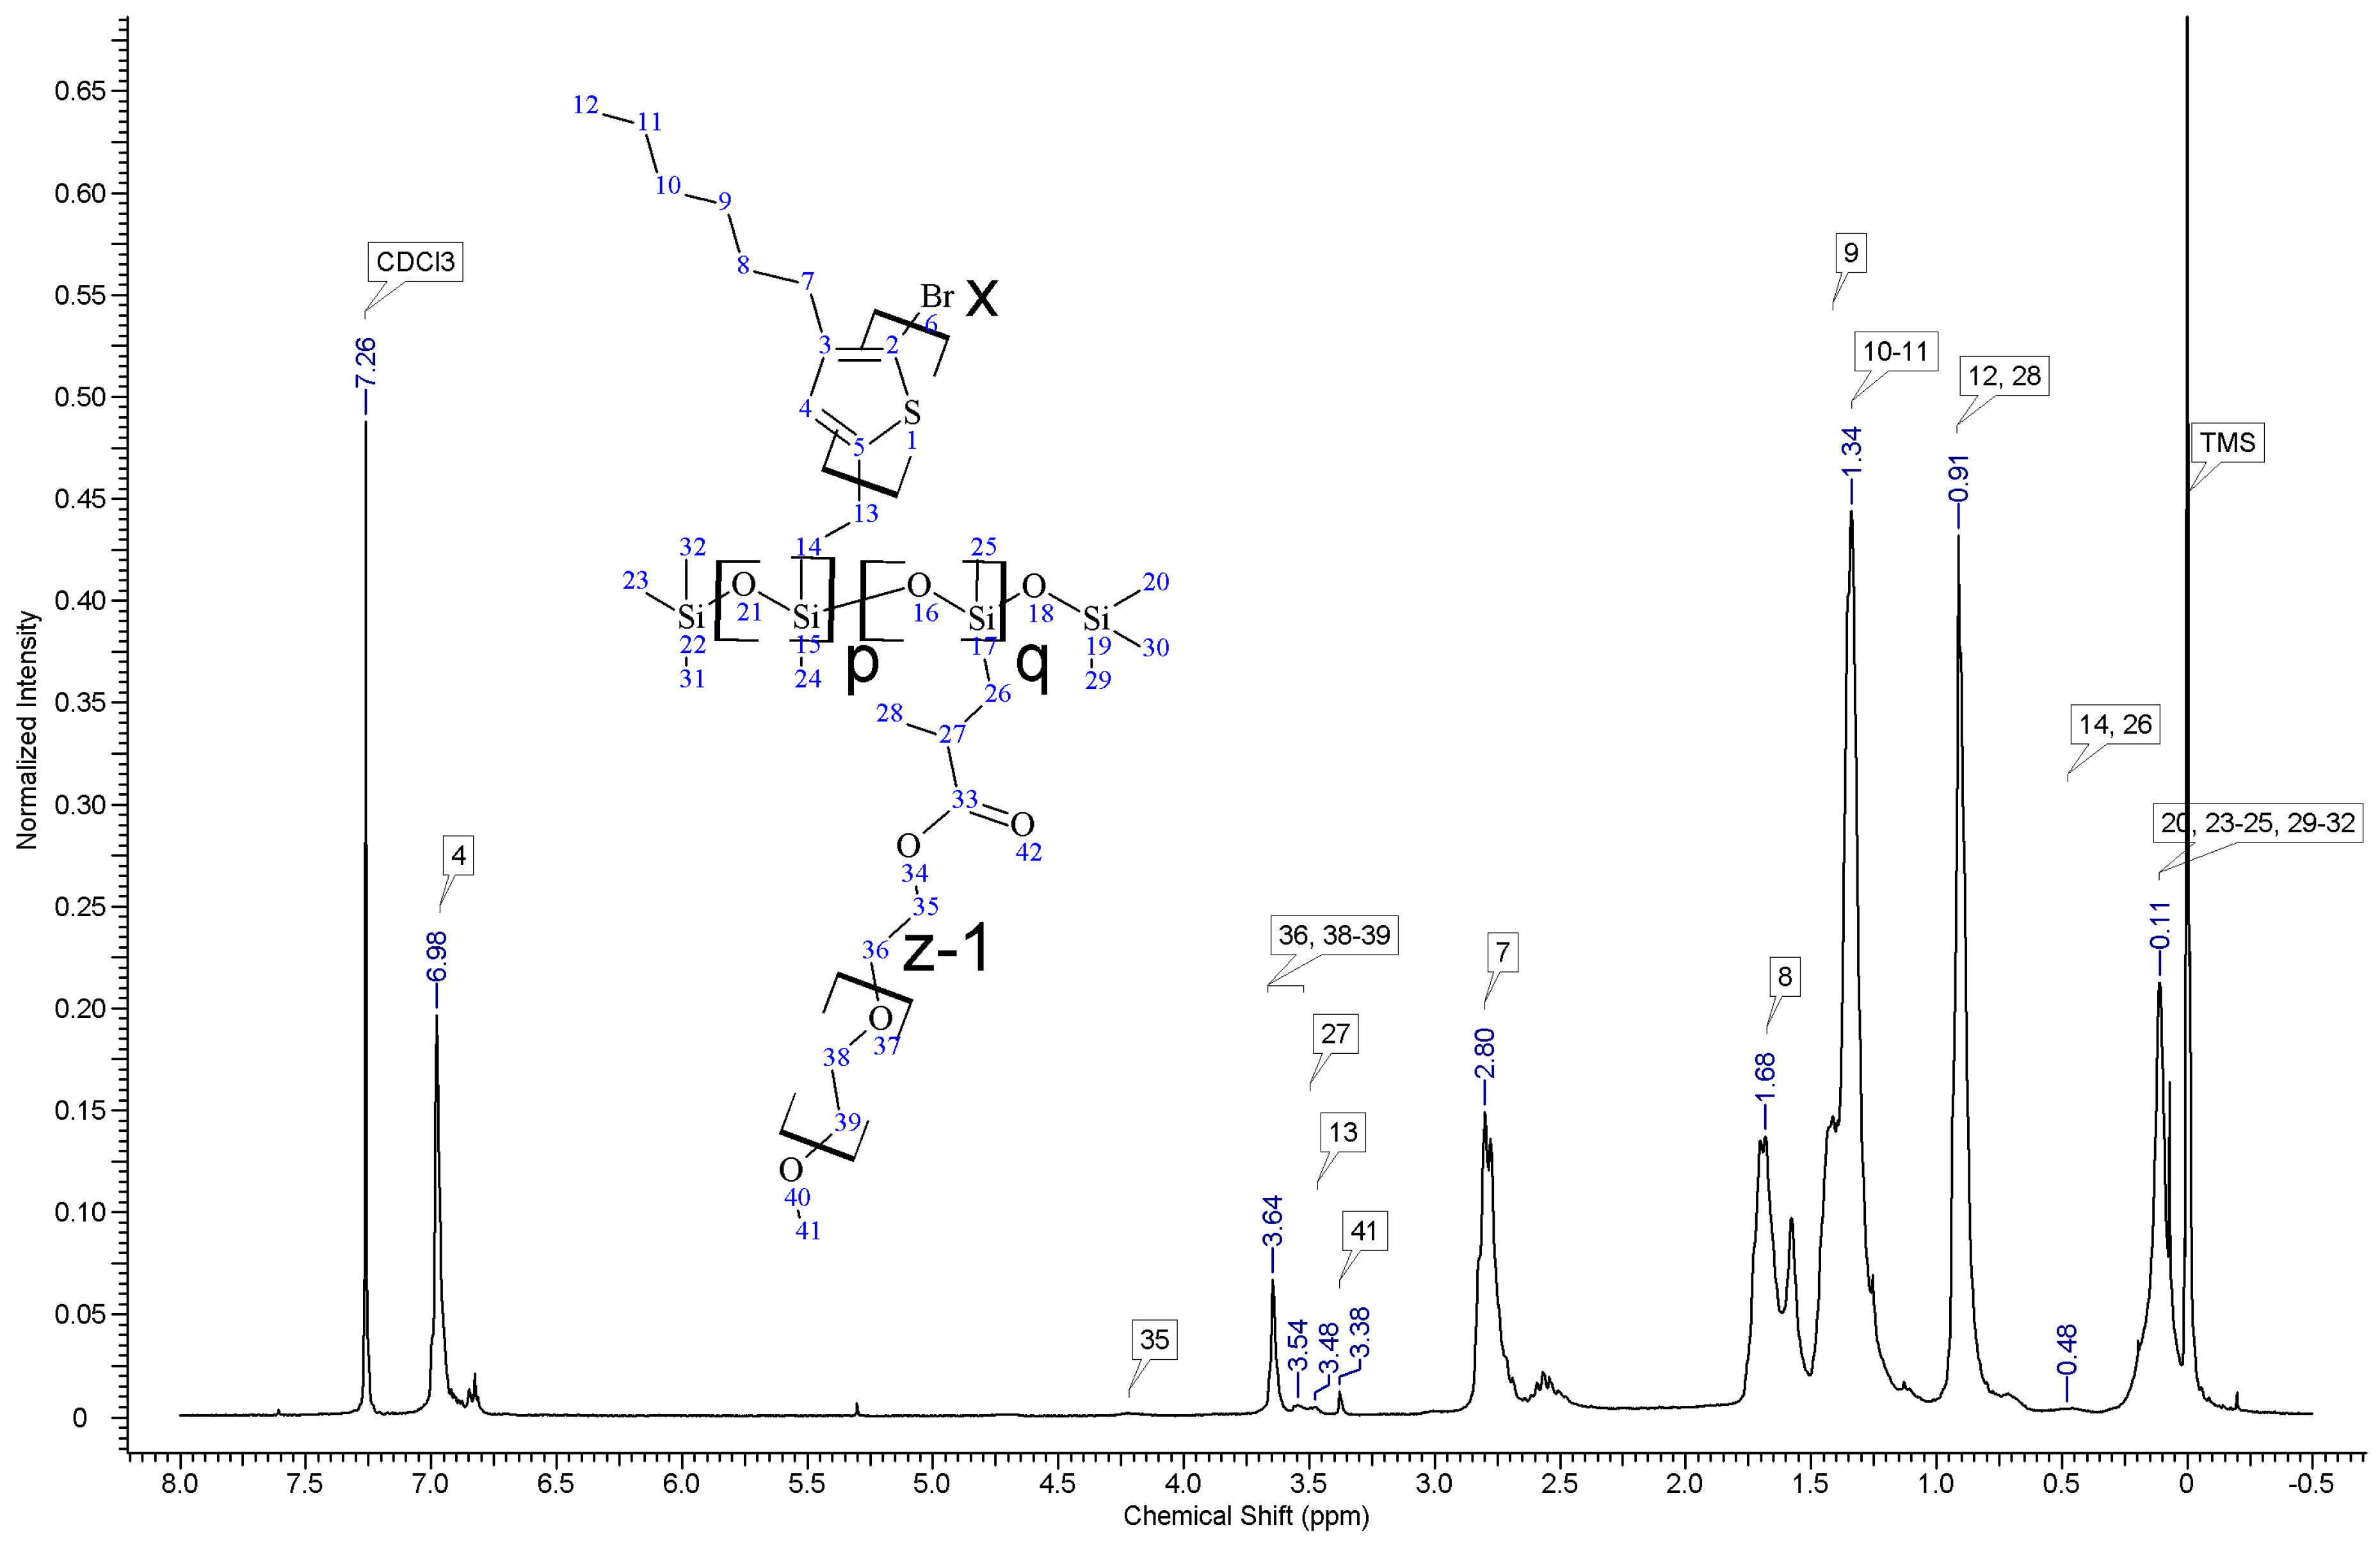
3 protons would not be present in the hexane and chloroform fractions of the graft copolymers. On all P3HT-Sil-PEGs spectra the signals of O–CH
2 (δ 3.65–3.55 ppm) and O–CH
3 protons (δ 3.38 ppm) are present, confirming grafting of polyether co-monomer at polysiloxane backbone.
In all cases of grafting, excess of PMHS was used. During the first step of grafting P3HT chains are attached to the polysiloxane backbone, then in the second step PEG is added to saturate unreacted Si–H groups. As can be seen in NMR spectra (
Figure A3 and
Figure A4) copolymers grafted on short polysiloxane chain (PMHS390): P3HT-Sil-PEG1, and P3HT-Sil-PEG2 contain very low amount of PEG chains. That is probably due to the tendency of P3HT chains to stack and be grafted next to each other on the PMHS backbone. Moreover, chloroform fraction chains of P3HT (longer and more regioregular than hexane fraction chains) should exhibit greater tendency towards π-stacking and agglomeration than hexane fraction chains, resulting in higher P3HT grafting density on PMHS and higher P3HT to PEG ratio in P3HT-Sil-PEG2 (bearing chloroform fraction P3HT chains) than in P3HT-Sil-PEG1 (bearing hexane fraction P3HT chains) (
Table 1). On the other hand, using longer polysiloxane chain (PMHS1700—3200) as a backbone allows for obtaining copolymer with higher PEG content (
Figure A5,
Table 1).
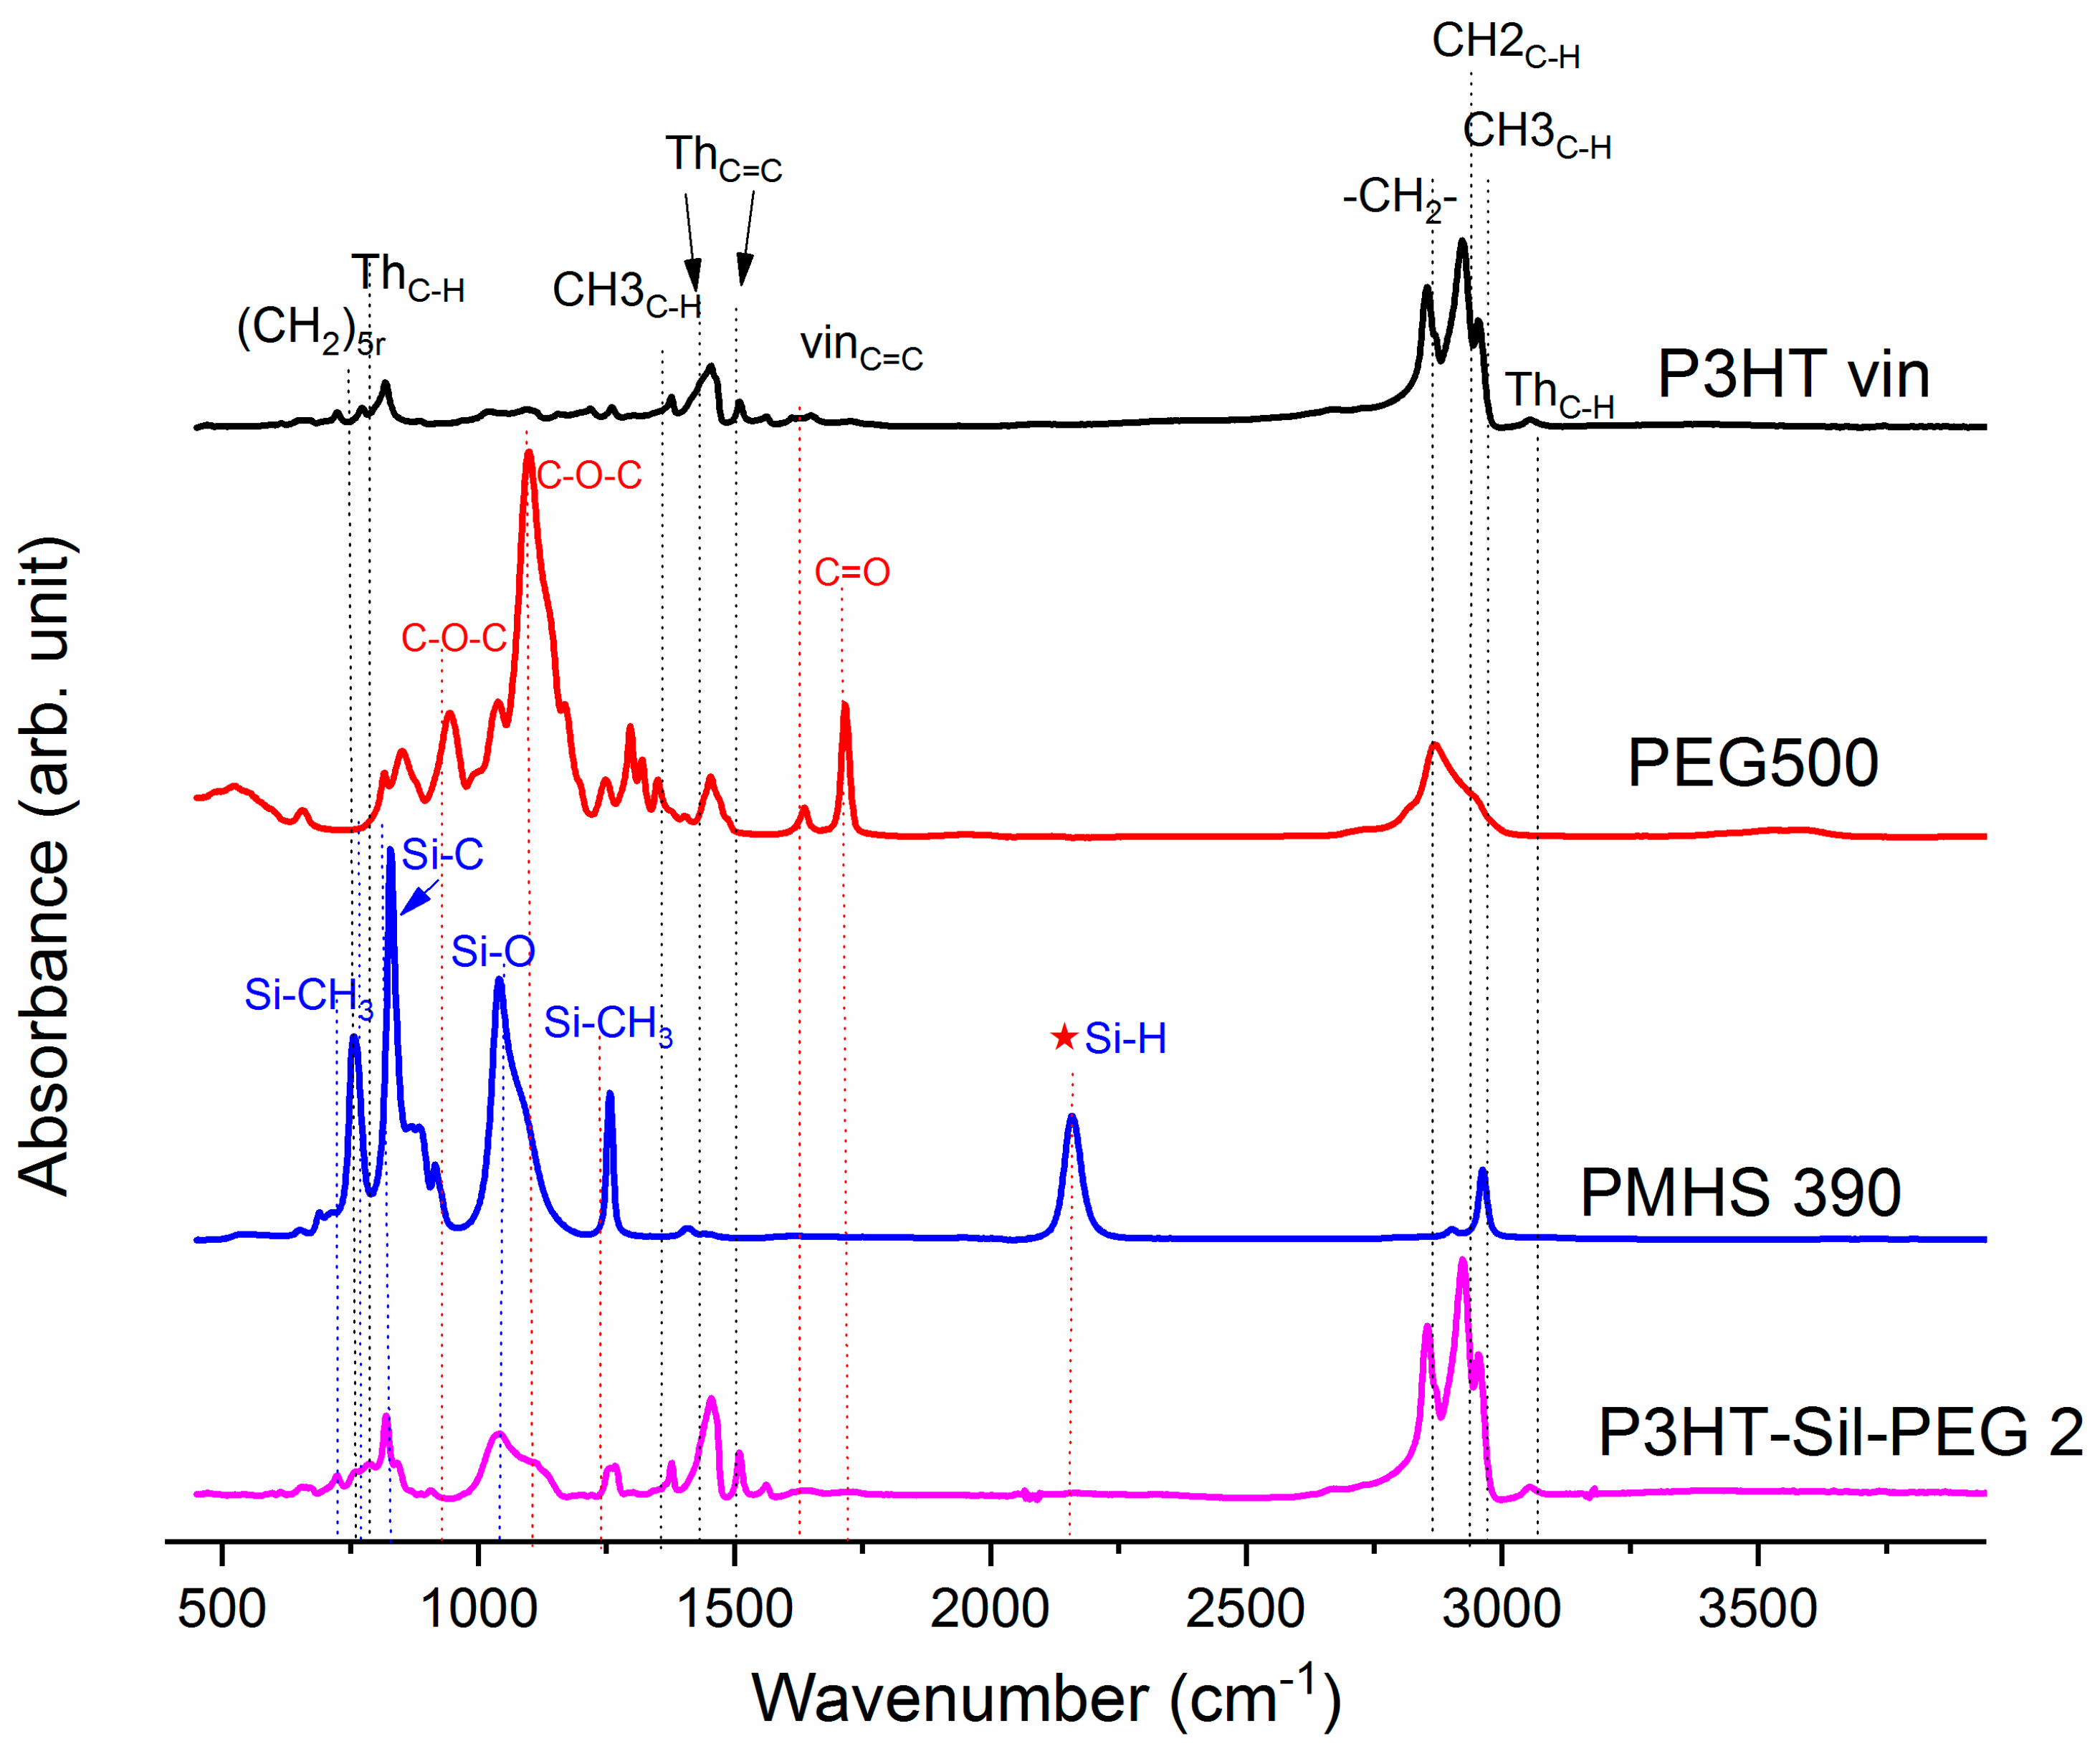
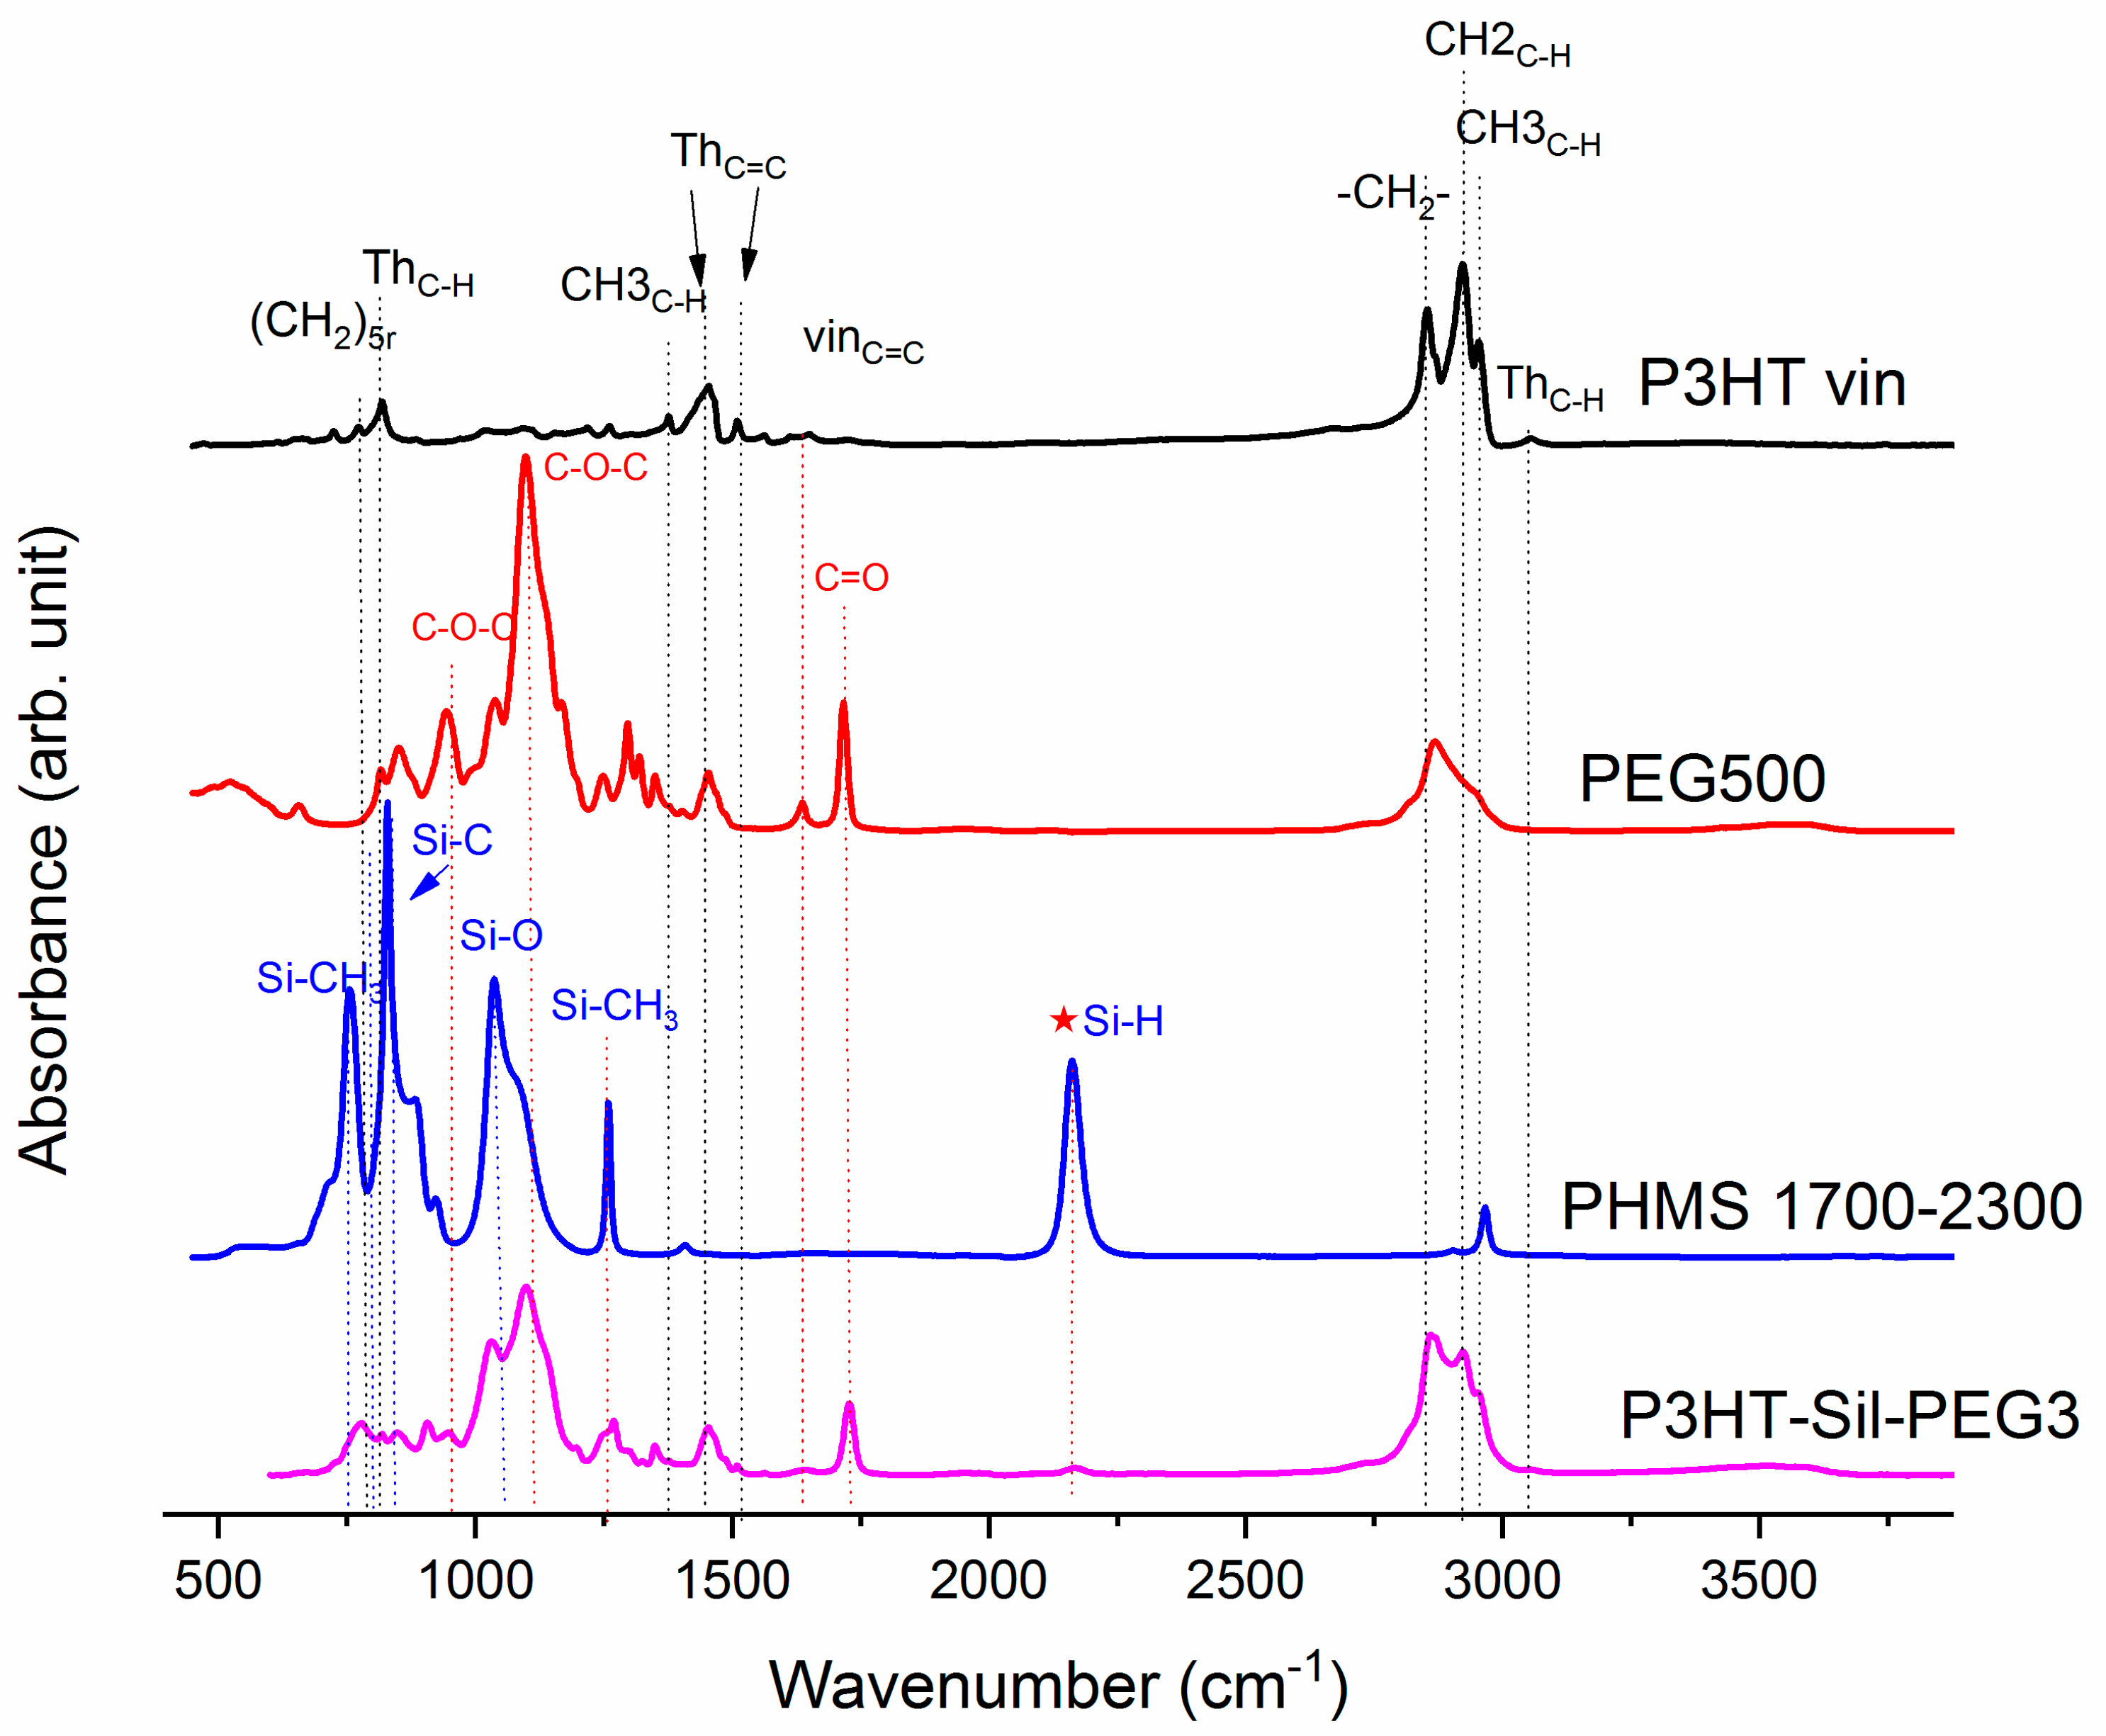
On
Figure 1, the ATR-IR spectra of the P3HTvin, PHMS390, and the graft copolymer P3HT-Sil are presented.
The IR spectra of other copolymers are included in
Appendix A. In the case of P3HT, the hexyl side chains give rise to the three bands at 3000–2850, 1378 and 728 cm
−1. The peak at 1378 cm
−1 is assigned to the deformation vibration of terminal methyl groups –CH
3, while the peak at 728 cm
−1 confirms the rocking vibration of hexyl substituent methylene groups –(CH
2)
5–. The peaks within the band of 3000–2850 cm
−1 are typical for C–H bonds on the aliphatic side chain, which have been assigned respectively to the asymmetric C–H stretching vibrations of –CH
3 (2953 cm
−1) and –CH2– (2922 cm
−1) moieties, as well as the symmetric C–H stretching vibration in –CH
2– (2851 cm
−1) moieties. The signal at 3057 cm
−1 is assigned to the aromatic C–H stretching vibration of the thiophene ring, while the expected C–H out-of-plane vibration of a 2,3,5-trisubstituted ring is found at 828 cm
−1. The absorption peak at 1460 cm
−1 is associated with a symmetric C=C ring stretching vibration, while the peak at 1507 cm
−1 is related to an asymmetric C=C ring stretching vibration. The presence of a vinyl end group is confirmed by the occurrence of C=C stretching vibration, situated at 1641cm
−1.
The siloxane chains are confirmed by two broad bands at 1090 and at 1020 cm−1, which have been assigned to the Si–O–Si stretching vibrations in long chain siloxanes. The peaks at 800 and 900 cm−1 are related to Si–CH3 rock and Si–C stretch interactions. The signal at 1263 cm−1 is assigned to Si–CH3 symmetric stretching vibration in the methyl groups. The Si–H stretching vibration of PMHS is located at 2165 cm−1.
The spectrum of PEG (
Figure 2) shows the characteristic vibration bands of the CH
2 and CH
3 framework, stretching at 2883.5 cm
−1, bending CH2 and CH3 at 1467.8 cm
−1, and at 1342.4 cm
−1, respectively, as well as C–O–C asymmetric and symmetric stretching at 1103.3 cm
-1 and at 960.5 cm
−1, respectively. The presence of a vinyl end group is also evidenced by the C=C stretching vibration found at 1641 cm
−1.
The Si–H peak found for PHMS at 2160 cm
−1 was reduced in the IR spectrum of P3HT-Sil and the signal of the vinyl groups at 1641 cm
−1 from P3HTvin completely disappeared after hydrosilylation. Moreover, signals of Si–CH
2–R wagging vibration at 1252 cm
−1 appeared, as shown in
Figure 1.
The spectra of grafted copolymers not only displays all of the characteristic peaks of siloxane groups Si–O–Si at 1090 and at 1020 cm
−1, as well as those of P3HT, but also shows the absorption bands of poly(ethylene glycol), such as CH
2 and CH
3 bending at 1467.8 cm
−1 and at 1342.4 cm
−1, C–O–C (see
Figure A6 and
Figure A7 in
Appendix A). This indicates that P3HT and poly(ethylene glycol) were successfully grafted onto the polysiloxane chain.
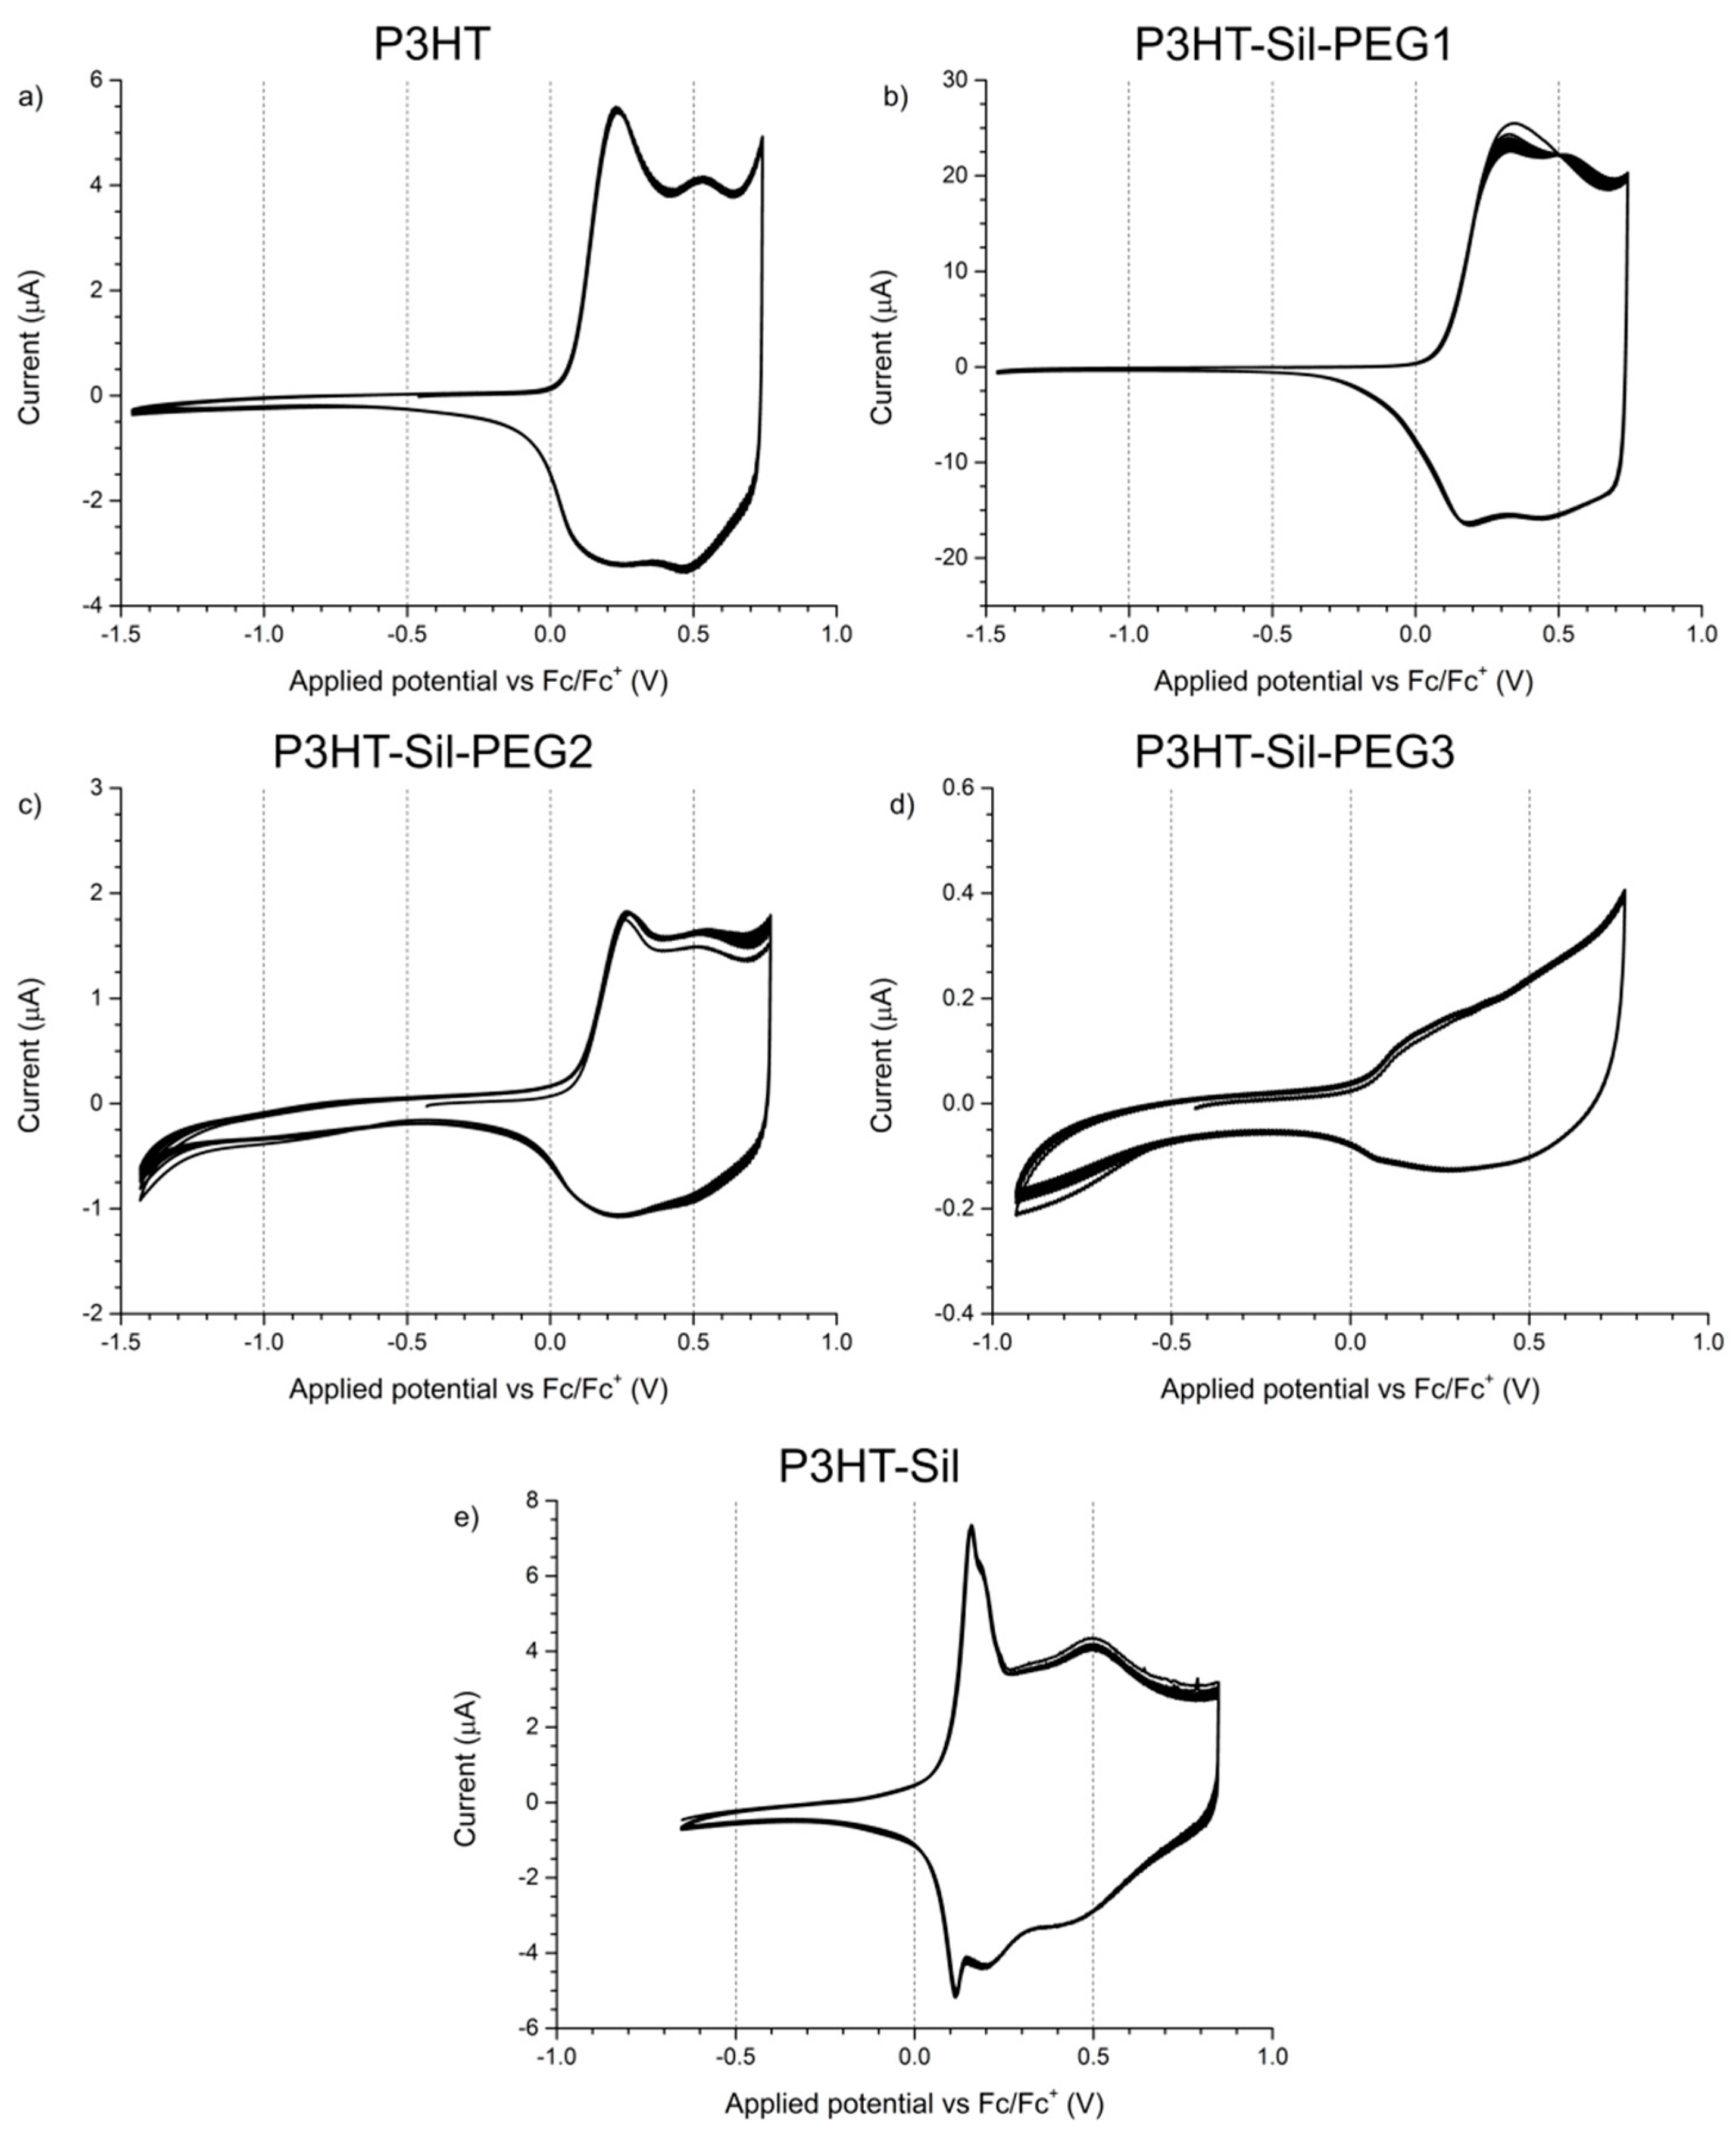
3.3. Cyclic Voltammetry
The electrochemical response of
P3HTvin films on a platinum electrode was observed at potential scanning rates of 0.1 V/s (
Figure 4a) and 0.005 V/s (
Figure 5a). In the case of the experiment using a scanning rate of 0.1 V/s, two distinct redox systems are found, with their oxidative peaks being observed at +0.24 V and at +0.53 V, as well as a slope with an onset at approximately +0.65 V, similar to what is reported in literature for P3HT and other 3-alkylthiophene polymers [
9,
20,
21,
22,
23]. The two redox systems are typically attributed to transitions between ground state polymer segments and polaron- and bipolaron-bearing segments. Interestingly, it can be shown by simulation that, in the case of the low potential redox pair, both the oxidation and reduction signals are composite, each consisting of two individual signals, roughly 0.09 V apart. The composite nature can originate from the existence of crystalline and amorphous regions in the polymer film, exhibiting different alkyl chain packing and thiophene ring stacking schemes, affecting their electronic properties [
24,
25,
26,
27,
28,
29,
30].
The oxidative slope, in turn, is commonly associated with polymer over-oxidation, as extending the applied potential range towards more positive potentials results in a rapid loss of the electrochemical response of the polymer in subsequent potential cycles, similar to what was found for polythiophene [
31]. The occurrence of over-oxidative deactivation is effectively the upper limit of the operating potential window for conjugated polymer materials, as this process is irreversible. Consequently, the potentials applied to the investigated polymer films were adequately limited (to, at most, approximately +0.7 V vs. Fc/Fc+, based on the abovementioned report), so as to minimize, if not eliminate, the influence of such over-oxidation phenomena. The overall shape of the CV curve—narrow at low potentials and broadly rectangular at more positive potentials—indicates that a significant change in the conductance of the system takes place during the measurement, which is the expected consequence of doping/dedoping the conjugated polymer film.
When the electrochemical response of
P3HTvin is observed at a 0.005 V/s scan rate, the features of the CV curve (
Figure 5a) are a single oxidation peak at +0.13 V and a single reduction peak at +0.08 V. The over-oxidative slope is present and appears to be more pronounced due to the absence of the second pair of redox signals at higher potentials. Interestingly, in subsequent potential cycles, the shape of the response is largely maintained, with the redox pair signals broadening slightly towards the high potential end of the voltammogram. After multiple potential cycles, an inflection point evolves at approximately +0.58 V, likely indicating an obscured oxidation signal. Both the broadening and the appearance of the inflection point at +0.58 V imply that the polymer undergoes reorganisation during repeated doping/dedoping, altering either the feasibility or the kinetics of the second doping stage. Similar trends are seen in the other investigated polymers upon repeated potential cycling, but the new peak is formed only in the case of
P3HTvin.
The shape of the CV curves recorded for
P3HT-Sil-PEG1 films (
Figure 4b) differs from that of regioregular P3HT films. In the first potential cycle, a single broad peak is initially observed at +0.34 V, evolving into two distinct peaks at +0.33 and +0.53 V in subsequent cycles, indicating that reorganisation of the graft copolymer takes place upon doping/dedoping. Although the low potential peak is located at significantly higher potentials than the corresponding signal for
P3HTvin (+0.24 V), making the material initially more resistant to oxidation, the high potential peak is found at +0.53 V, virtually identical to the corresponding signal for
P3HTvin. Interestingly, while the ground states of the two polymers differ significantly, their p-doping appears to give rise to electronically similar doped states. Similarly to
P3HTvin, the low-potential end of the voltammogram is relatively narrow, while the high-potential end is significantly wider. Although it is only a very rough measure of changes in the conductance of a polymer film, this effect is much more pronounced in the case of
P3HT-Sil-PEG1, with the CV width at high potentials being almost two hundred times the width at low potentials, suggesting a more significant change in relative conductance of the polymer upon doping than for
P3HTvin.
The CV curve recorded at the 0.005 V/s scan rate (
Figure 5b), unlike that of
P3HTvin, features an additional pair of sharp redox signals, with the oxidation peak being observed at +0.10 V. This phenomenon was encountered earlier, by Baranowska and Łapkowski [
32] in their studies on 2,2′-diquinoxalyl and was ascribed to changes in the adsorption of the molecule on the working electrode. Similarly, for
P3HT-Sil-PEG1, these sharp CV peaks can be attributed to changes in the conformation of the grafted P3HT chains. This type of conformation changes is, however, unlikely for well-ordered P3HT chains, due to stabilising interactions between nearby P3HT chains. Consequently, the changes in conformation would be expected to arise from segments of the copolymer bearing isolated P3HT chains, due to non-uniform grafting.
Due to the high share of 3HT units in the structure of
P3HT-Sil-PEG2, its electrochemical response (
Figure 4c) is more similar to that of
P3HTvin than to that of
P3HT-Sil-PEG1. In the oxidation half-cycle, two oxidation peaks, at +0.26 and +0.52 V respectively, and a high potential over-oxidative slope are found, whereas the reduction half-cycle features a single reduction peak at +0.23 V and an inflection point, indicative of an overlapping higher potential reduction process, at +0.46 V. The low potential oxidative peak is found at a slightly higher potential than in the case of
P3HTvin or
P3HT-Sil-PEG1, indicating that a slightly higher energetic barrier needs to be overcome to introduce charges onto the grafted macromolecule, due to the lessened stabilising effect of interactions between P3HT chains. Nevertheless, the high potential oxidative peak is found at a potential similar to that of the aforementioned polymers. This, in turn, implies that a p-doped state, similar to that of
P3HTvin is achieved for both
P3HT-Sil-PEG1 and
P3HT-Sil-PEG2.
The 0.005 V/s CV of P3HT-Sil-PEG2 (
Figure 5c) is relatively similar to that of the
P3HTvin film. Interestingly, the magnitude of the peak currents, in relation to the currents of the oxidative slope is noticeably lower than in the case of P3HT.
In the case of
P3HT-Sil-PEG3 (
Figure 4d), the low P3HT content in the copolymer gives rise to a weak electrochemical response, showing only poorly developed features. Even so, the observed broad oxidative signal centred at +0.19 V and an inflection point at +0.55 V, hint at the occurrence of doping/dedoping processes, with the potentials being similar to those observed for
P3HTvin and other
P3HT-Sil-PEG copolymers.
Investigating the response of the P3HT-Sil-PEG3 film at the lower potential scanning rate (
Figure 5d) reveals that by lowering the P3HT grafting density, it is possible to significantly change the properties of the copolymer. The CV features an oxidation signal at +0.13 V and only a trace of a reduction signal at +0.06 V. This is consistent with the abovementioned lowering of peak current in relation to the magnitude of the oxidative slope currents, observed for P3HT-Sil-PEG2.
The electrochemical response of
P3HT-Sil (
Figure 4e) is particularly interesting among the investigated systems, as not only does it show the redox signals expected for a P3HT derivative, but an additional pair of sharp signals, centred at approximately +0.14 V, is also found, as in the case of the 0.005 V/s CV of
P3HT-Sil-PEG1. Assuming that the P3HT chains are indeed grafted non-uniformly, giving rise to segments of the copolymer bearing “interacting” and isolated P3HT chains, this result is within expectations. Interestingly, the fact that this feature is observed at different potential scanning rates for different copolymers is evidence that the presence or lack of co-grafts affects the kinetics of this conformational change. This difference in kinetics is most likely brought on by the additional PEG grafts, hindering changes in the conformation of neighbouring P3HT chains, both due to steric factors and to electrostatic interactions with the ether groups of PEG.
The 0.005 V/s response of P3HT-Sil consists of a pronounced redox pair (centred at approximately +0.13 V), as is the case for most other investigated copolymers, but also shows a faint oxidative peak at +0.32 V, coupled with a more pronounced reduction signal at +0.21 V.
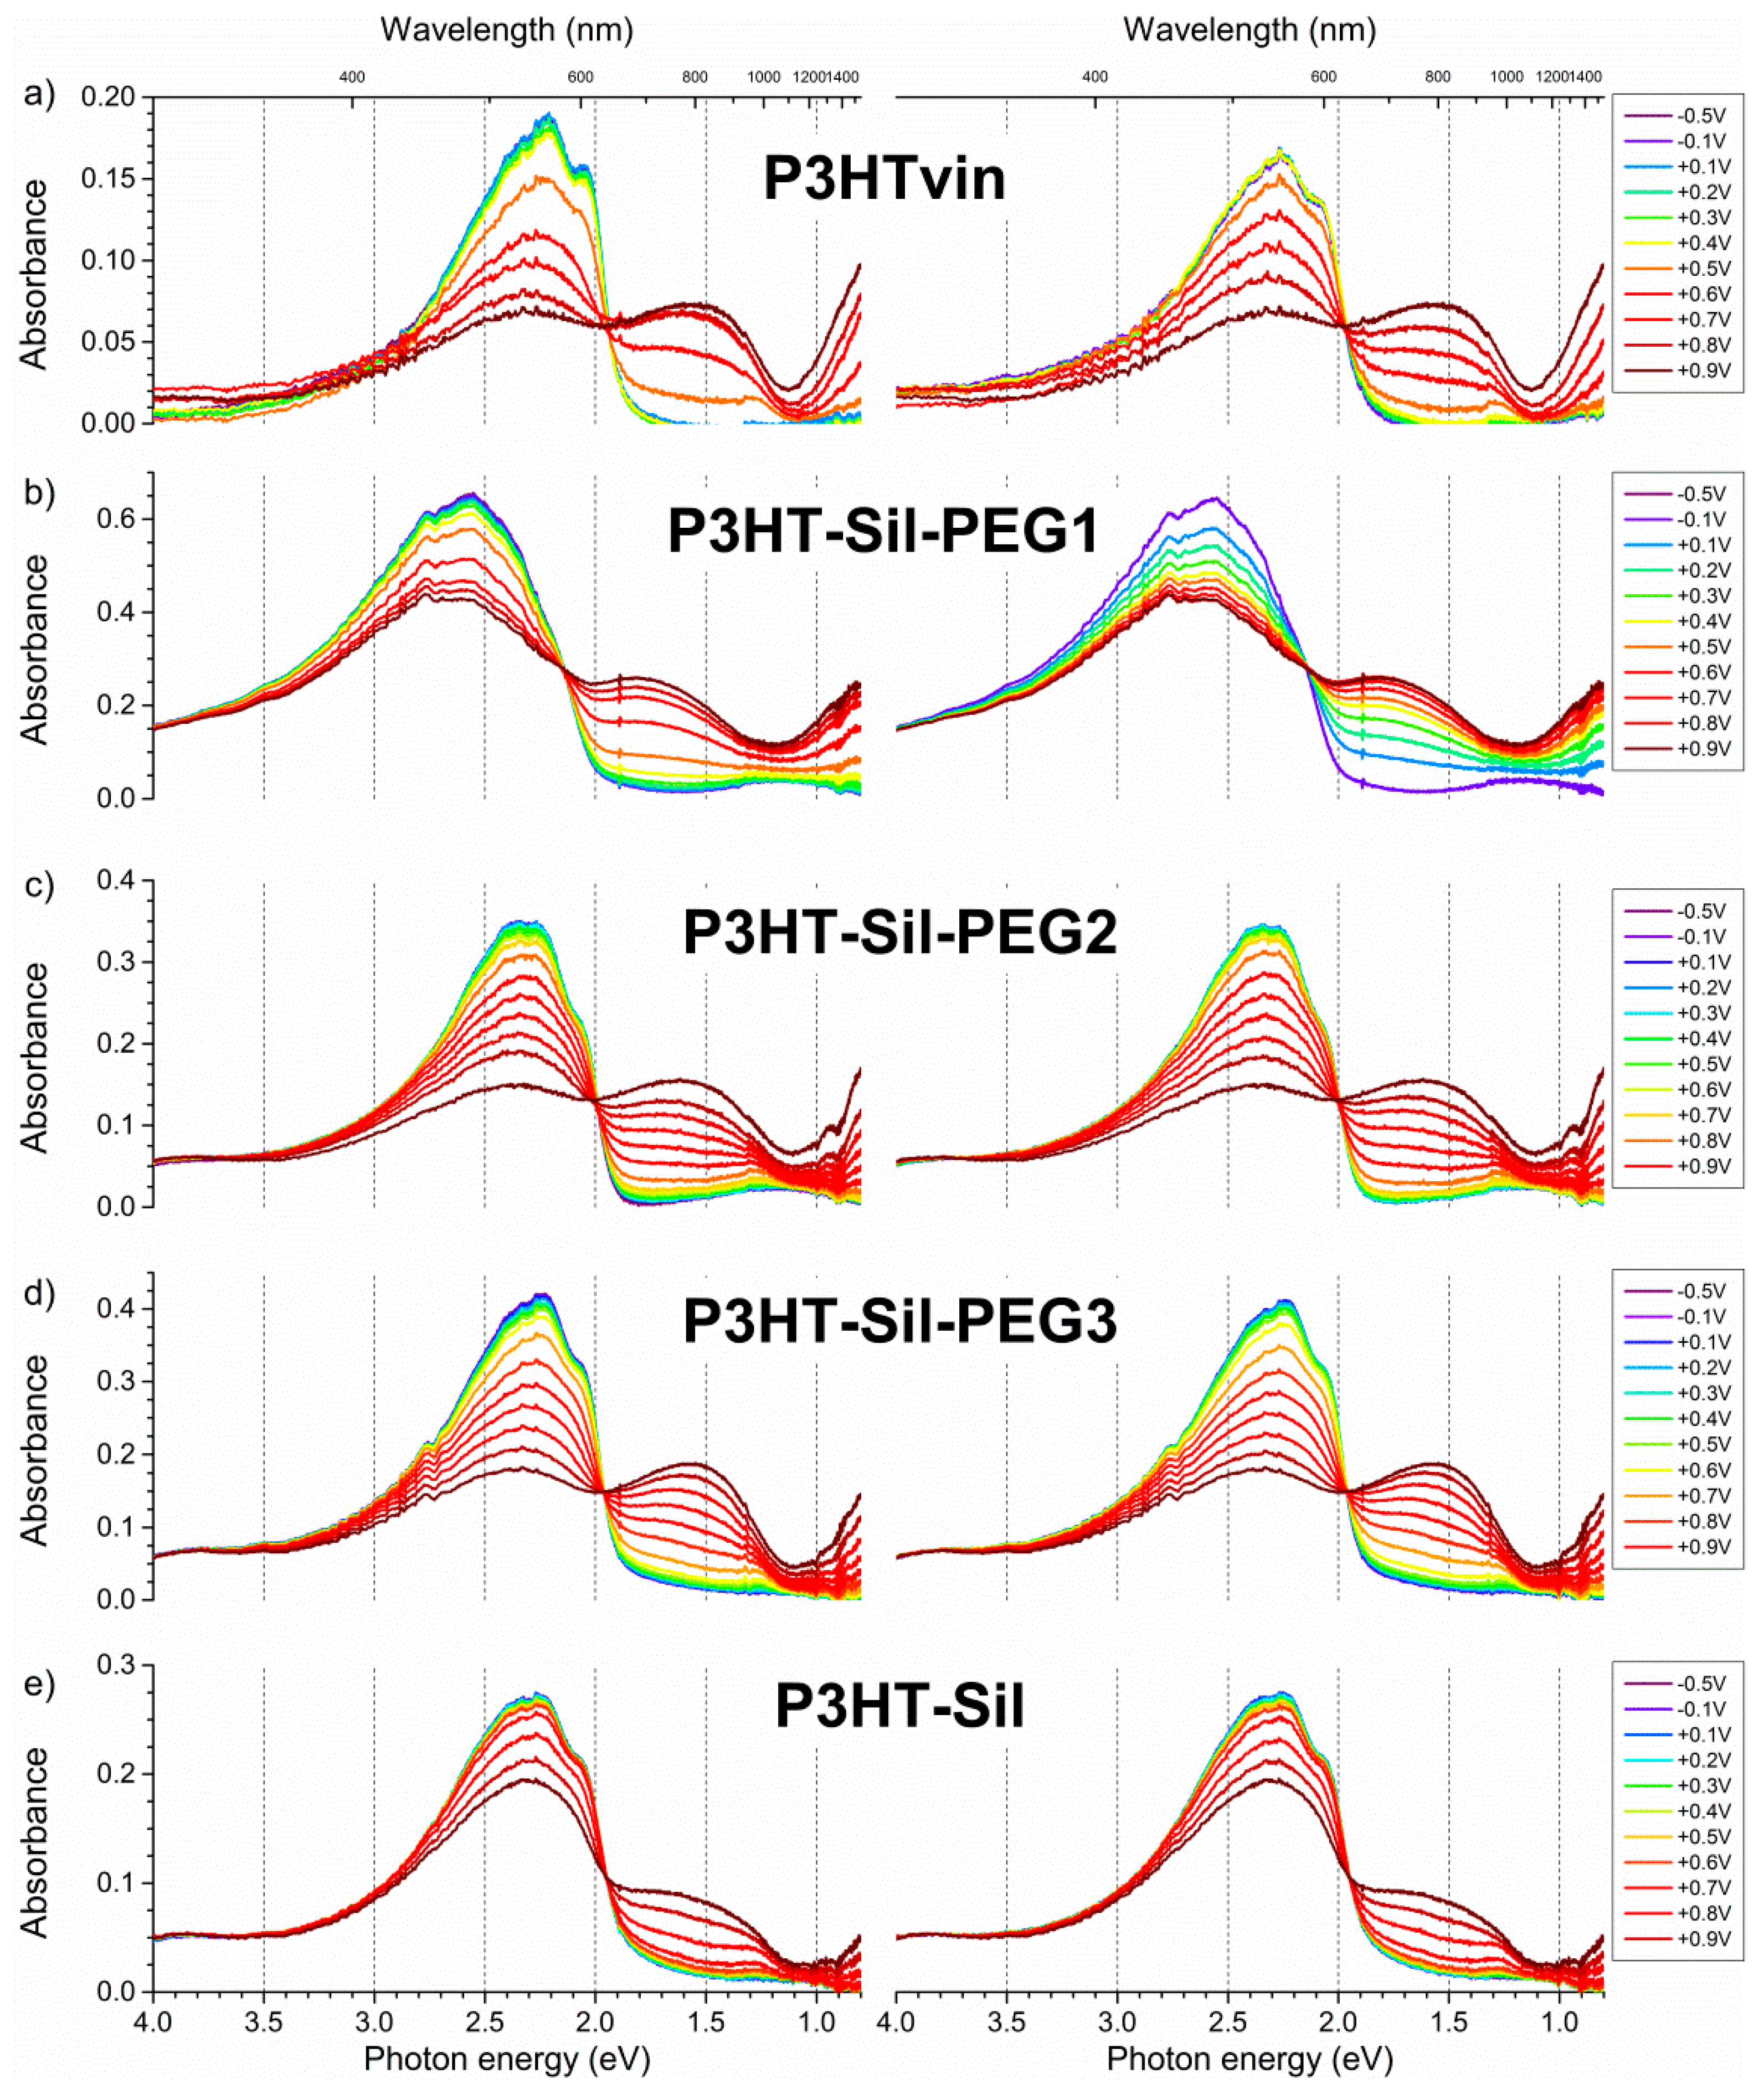
3.4. EPR-UV-Vis-NIR Spectroelectrochemistry
The UV-Vis-NIR spectrum (
Figure 6a) of the non-polarised
P3HTvin film on ITO/quartz consists of a broad absorption signal, with a slope at 655 nm, corresponding to an optical band gap of 1.89 eV. The absorption signal is composite, with three individual, overlapping absorption peaks being readily identified at 601, 561, and 535 nm, corresponding to transition energies of 2.06, 2.21, and 2.32 eV respectively. The slight differences in the absorption peak wavelengths and, therefore, energies (0.15 and 0.11 eV from the middle peak respectively) of the respective transitions likely arise due to vibronic splitting of the main transition. An interesting explanation for the origin of this signal shape has been offered by Ludwigs et al. [
33], attributing the main transition signal to the response of amorphous segments of the polymer and the vibronic signals to the ordered segments. We have utilized
1H-NMR and IR spectroscopy to confirm this, finding no evidence that these signals arise either from impurities bearing a conjugated bond system or defects in the P3HT chains. The absorption signals are also unlikely to arise from chains of sufficiently varying length, due to both the rather high molecular weight of our
P3HTvin and to the post-synthesis purification scheme involving fractional extraction, yielding samples with narrower molecular weight distributions than the raw synthesis product. Upon the application of positive potentials to the polymer films, these component signals decline at different rates.
The absorption spectra of the grafted copolymers were recorded immediately after deposition and for the films being immersed in a solution of the supporting electrolyte in open circuit conditions (
Figure 6b–e). Vibronic splitting, observed for
P3HTvin films (
Figure 6a), can also be found for the graft copolymer films (
Figure 6b–e), manifesting most noticeably for the
P3HT-Sil-PEG3 and
P3HT-Sil films, with the other two films exhibiting slightly lesser differences in the energy of the individual absorption signals, possibly hinting at a difference in the degree of freedom of rotational and translational movement of the P3HT chains.
When increasingly positive potentials are applied to a
P3HTvin film (
Figure 7a, left), the intensity of the three signals, constituting the absorption spectrum, decreases non-uniformly. The component signal at 601 nm appears to deteriorate most rapidly, resulting in a blue shift of the composite signal absorption maximum. When +0.5 V is applied to the polymer film, a broad absorption band evolves at 800 nm, being accompanied by a sharp increase in the observed relative spin concentration (
Figure 8a). The presence of this band along with that of a discernible component signal at 950 nm, rather than a single absorption peak, can imply that different doped state structures are at least transitionally present. The band and additional signal develop into a single apparent peak when +0.7V is applied to the film. Incidentally, a maximum spin concentration is predicted at approximately this potential, indicating the highest concentration of polaronic charge carriers in the polymer film. Upon reducing the applied potential (
Figure 7a, right), the observed spectral changes are partially reversed as the polymer is dedoped, however, the intensity of the 950 nm signal is noticeably lower, further supporting the claim of the occurrence of conformational changes in the polymer film at higher doping levels. Furthermore, not only do trace absorption signals remain in the NIR range even at potentials as low as −0.5 V, but also the absorption signal of the undoped polymer is not fully restored. Similarly, a detectable concentration of spin-bearing species remains in the polymer film (
Figure 8a). Although these features could imply decay of the polymer film and formation of spin-bearing degradation products, incomplete dedoping of the polymer film is more likely, as the absorption signals of these species occur in the NIR range, indicating a relatively long conjugated bond system, rather than in the UV-Vis range, as would be expected for degradation products with shorter conjugation lengths.
Upon application of increasingly positive potentials,
P3HT-Sil-PEG1 films show a small red shift of the undoped polymer signal, due to the non-uniform decay of the individual absorption signals, similar to that seen for
P3HTvin, but not as pronounced. Similar to what was seen for
P3HTvin, changes in the spectrum of the polymer film start manifesting visibly at above + 0.6 V, with a broad shoulder developing in the range of 600–800 nm, which evolves into a broad peak when more positive potentials are applied. These spectral changes are accompanied by an increase in the relative spin concentration observed in the coupled EPR experiments (
Figure 8b), evidencing the electrochemical generation of spin-bearing polaronic species. Simultaneously, absorption signals begin developing in the NIR range, with a projected signal maximum at approximately 2100 nm, well beyond the spectral range of our experimental setup. These signals can be attributed to bipolaronic charge carriers, indicating that the two types of charged species are being generated alongside each other. Interestingly, both absorption signals continue to gain intensity, even in the final potential steps to +0.9 V, which brings about a sharp decrease in spin concentration, and to +1.0 V, indicative of the transition from polarons to bipolarons as the primary charge carriers in the polymer.
When the direction of potential staircasing is reversed and progressively less positive potentials are being applied, the abovementioned absorption bands, attributed to polarons and bipolarons, begin declining as the initial shape of the absorption spectrum is restored. Although the dependence of relative spin concentration on applied potential evidences a minor doping level hysteresis, below +0.5 V no spins can be detected, unlike
P3HTvin and
P3HT-Sil, which show persistent spin concentrations even at negative potentials (
Figure 8e). This, along with the near perfect restoration of the original absorption spectrum after the experiment, shows that both over-oxidative deactivation of the polymer film and charge trapping have a much lesser influence on the doping/dedoping of
P3HT-Sil-PEG1 polymer films than on
P3HTvin films. This is even more significant if the absorbances of the undoped polymer layers are compared—0.19 and 0.64 for
P3HTvin and
P3HT-Sil-PEG1 respectively (
Figure 7). If we assume that the molar absorption coefficients for the P3HT chains are in both cases comparable, the thickness of the
P3HT-Sil-PEG1 layer would be expected to be roughly three times greater than the thickness of the
P3HTvin film. This significant thickness would be expected to severely hinder doping/dedoping reversibility; even despite this, P3HT-Sil-PEG1 shows better doping reversibility than
P3HTvin.
In the case of
P3HT-Sil-PEG2,
P3HT-Sil-PEG3, and
P3HT-Sil, very similar results are obtained in terms of the UV-Vis-NIR spectra, but virtually no doping level hysteresis is observed. The dependence of relative spin concentration on applied potential (
Figure 8c,d) for
P3HT-Sil-PEG2 and
P3HT-Sil-PEG3 layers is such that the data points observed when the applied potential is staircased towards positive potentials almost perfectly match the data points recorded when the potential is staircased back to lower potentials. In both cases, a spin concentration maximum is observed, respectively at +0.7 V and at +0.65 V for
P3HT-Sil-PEG2 and for
P3HT-Sil-PEG3.
In the case of P3HT-Sil, the maximum applied potential was severely curtailed due to the fact that irreversible changes had begun occurring in the copolymer film at higher potentials; this is most likely due to the electrolysis products reacting with the active Si–H sites (or their derivatives produced by reaction with air and moisture) that were not substituted with P3HT chains and, unlike the P3HT-Sil-PEG class, were also not substituted with PEG chains. Interestingly, for P3HT-Sil, the dependence of spin concentration on applied potential is intermediate between that of P3HTvin and those of the P3HT-Sil-PEG class; as in the case of the latter, only marginal doping state hysteresis is observed, while, as is the case for P3HTvin, generated spins persist in the material even at strongly negative potentials. This implies that, while grafting P3HT chains on the polysiloxane scaffold improves doping/dedoping reversibility, the preventative influence of PEG chains on the formation dedoping-resistant charge carriers is also significant.
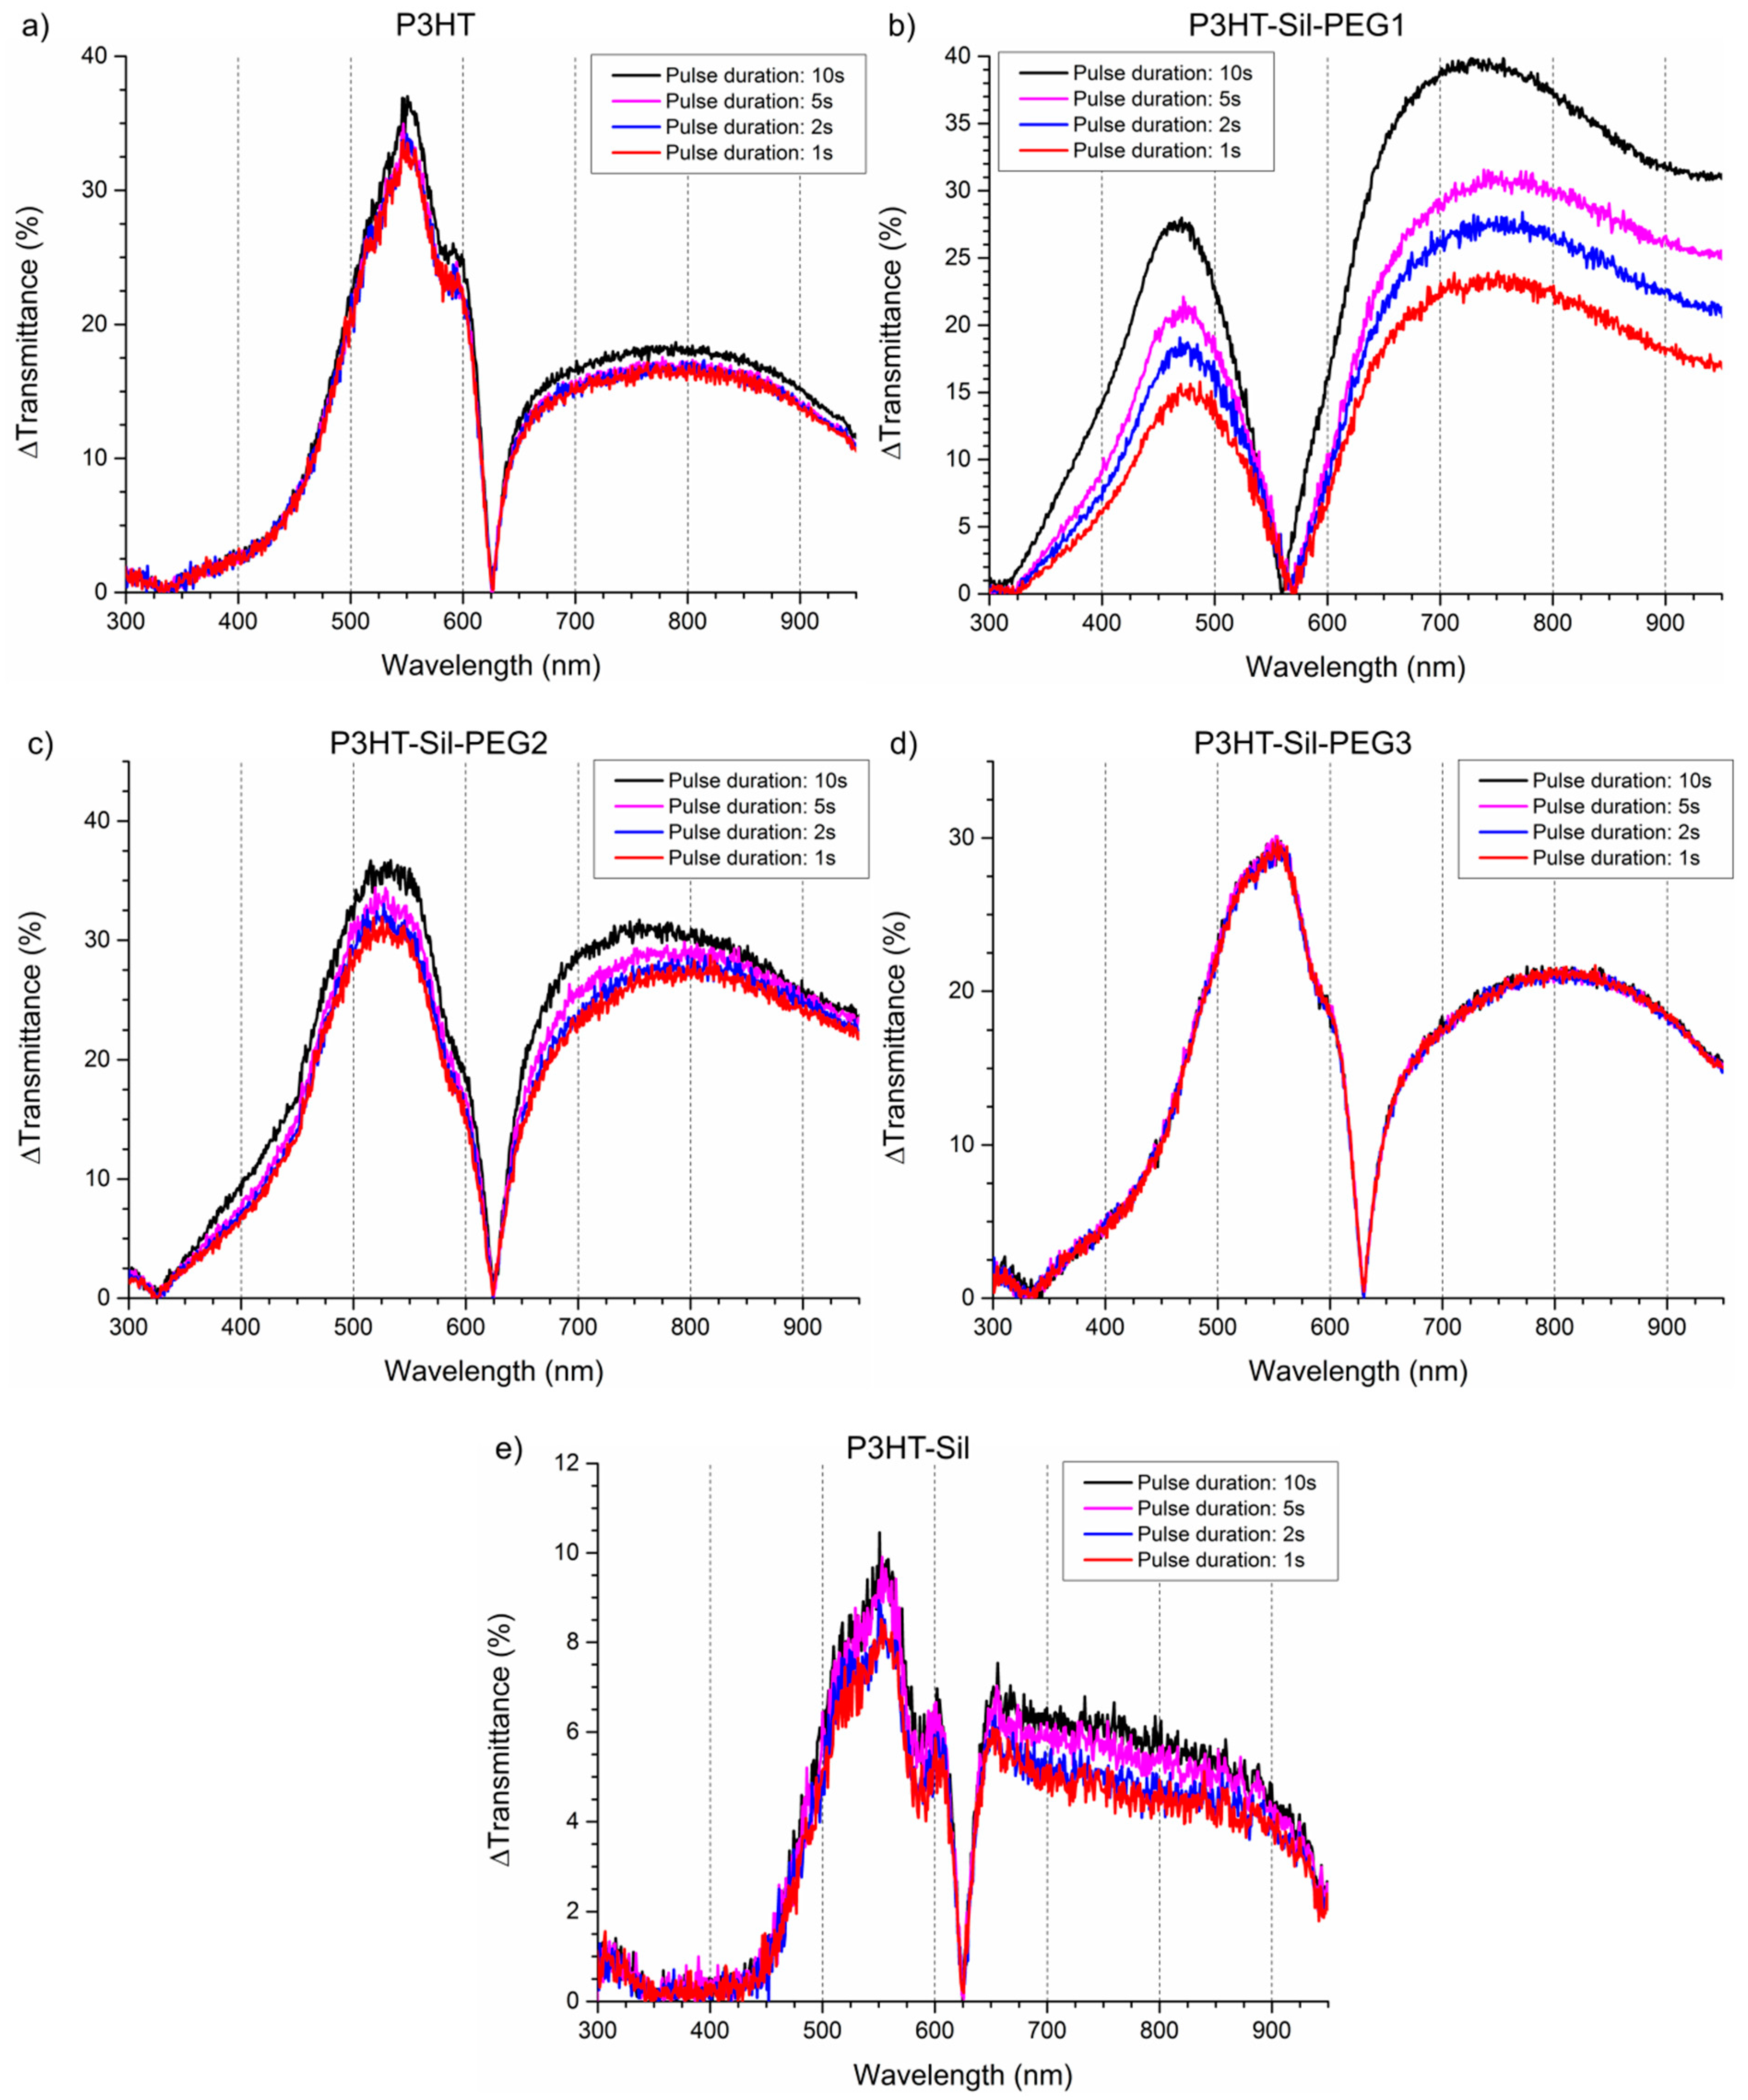
3.5. Time-Resolved UV-Vis Spectroelectrochemistry
Time-resolved UV-Vis spectroelectrochemistry was employed to investigate the electrochromic capabilities of the synthesised copolymers in relation to those of
P3HTvin. The experiments utilised two types of electrochemical stimuli: the standard approach of alternating between two potential values with a fixed step width (i.e. multi-step chronoamperometry), and a slow sweep between the two boundary potentials (using cyclic voltammetry). The latter type of stimuli, with its slow potential changes, was introduced as means of approximating a “near-equilibrium” doping/dedoping process. The absorbance of the undoped polymer absorption signal maximum was used to compare the apparent thickness of the polymer film, based on the assumption that the molar absorption coefficient for the P3HT chains is within a single order of magnitude regardless of whether the chain is a free P3HT chain or one grafted to the polysiloxane scaffold. Although control over the thickness of the polymer films was acceptable, it was not precise enough to allow obtaining exactly the same absorbance values for all samples, even with a large number of films being deposited. As such, several polymer films were investigated for each macromolecule (
Table 2), typically a “thin” and a “thick” film, with some more extreme samples being included in the comparison as well. The dependence of the achieved optical contrast on the wavelength is shown in detail in
Figure A8 in
Appendix A.
Relatively high optical contrasts are observed for the polymer films, with the
P3HT-Sil-PEG class compounds generally outperforming
P3HTvin films (
Figure 9) of a similar apparent thickness. The
P3HT-Sil system, lacking PEG grafts, in turn shows slightly worse performance, although the experiments were conducted in a narrower range of potentials than in the case of the other polymer films. Switching times for
P3HTvin and
P3HT-Sil-PEG3 are below 1 s (assuming a criterion that at least 90 % of the contrast, observed in the 10 s pulse width switching experiment, is achieved), whereas a switching time in the range of 2–3 s is seen for
P3HT-Sil-PEG2 and
P3HT-Sil. In the case of
P3HT-Sil-PEG1, despite it achieving the highest contrast values, the switching time is in excess of 5 s.
3.6. Conductance of Polymer Films
The conductance of
P3HTvin (
Figure 10a) is, interestingly, noticeable even at low potentials, indicating the existence of stable charge carriers, concurrent with our expectations. Upon application of increasingly positive potentials to the working electrodes, conductance of the polymer film increases sharply, corresponding to the electro-generation of numerous polaronic and bipolaronic charge carriers, with polarons being expected to be dominant charge carriers at low doping levels. At higher doping levels, however, the conductance of the polymer starts to slowly decline, even though these should correspond to the formation of bipolaronic charge carriers. A similar phenomenon was encountered for polythiophene by Harima et al. [
34], who ascribed it to over-oxidation of the polymer film. It is worth noting that the curves showing the dependence of conductance and apparent positive charge carrier mobility on doping level had nearly identical shape. As such, the source of this high-potential conductance decline is a decline in average charge carrier mobility rather than a drop in the overall population of charge carriers, which would be expected if over-oxidative deactivation of the polymer was significant at these doping levels.
The observed decline in conductivity is, therefore, likely due to the difference in mobility between bipolaronic and polaronic charge carriers. This explanation is again brought to mind, when we reverse the potential scan polarity—initially we see a sharp drop in conductance due to the decay of bipolarons. When lower potentials are applied, however, an increase in conductance is observed, peaking at +0.7 V. This peak in conductance coincides with a maximum concentration of spin-bearing species observed via EPR spectroelectrochemical measurements (
Figure 8a). By applying potentials below +0.7 V we dedope the polymer, with both conductance and spin concentration steadily decreasing.
Interestingly, when lower potentials, in the range of 0.2 to −0.5 V are applied, the conductance of the polymer film begins declining only marginally, indicative of an on-going charge de-trapping process. A low amount of spin centres also persists at these potentials, registered by EPR spectroelectrochemistry. The observed residual conductance, indicates that complete dedoping of the oxidised polymer segments does not take place, which could be interpreted as a symptom of charge trapping [
35,
36,
37]. For a typical conjugated polymer, at such negative potentials, we would expect to see a gradual decline in conductance of the polymer film (due to reduction of positive charge carriers in the polymer film) rather than the almost unchanging and relatively high observed conductance value. This value is by far too high to be accounted for solely by the charge carriers generated in situ due to reactions with oxygen. This implies that the “residual” charge carriers are tied to polymer segments, whose oxidised form is incapable of being reduced at the employed range of potentials.
In the case of
P3HT-Sil-PEG copolymers (
Figure 10b–d), the conductance of the undoped polymer film is initially much lower (on the order of 0.05–1 mS) than that of
P3HTvin. This can be attributed both to a lesser amount of charge carriers in the polymer film and to the effect of the polysiloxane segments present in the structure of the copolymers, acting as partial insulation between the electrode and conjugated polymer segments. In light of these observations, this copolymer would appear be much more resistant to reactions with oxygen than
P3HTvin, seeing that it shows no significant conductance in the “undoped” state. Upon application of increasingly positive potentials to the working electrodes, the conductance either decreases slightly (
P3HT-Sil-PEG1 and
P3HT-Sil-PEG3) or is maintained (
P3HT-Sil-PEG2). This is likely dependent on the population of charge carriers in the untreated copolymer films, with the initially strongly negative potentials being able to remove some of those charge carriers. Once potentials above +0.2 V (+0.4 V in the case of
P3HT-Sil-PEG1) are applied, conductance begins sharply increasing, as positive charges are being injected onto the polymer chains. At approximately +0.6 V, the conductance of all the copolymers stabilises and changes only marginally when more positive potentials are being applied. Despite this stabilisation of conductance values, the UV-Vis-NIR absorption of doped copolymer segments keeps increasing for all three
P3HT-Sil-PEG copolymers, implying that new charge carriers are being introduced. This indicates that the apparent mobility of charge carriers must be declining, for conductance to remain at roughly stable values.
Upon reversing the potential scan polarity, we observe a further growth of conductance of the polymers, rather than the expected decline due to dedoping. Interestingly, conductance is higher across all applied potentials and, only in the case of
P3HT-Sil-PEG1, coincides with noticeably higher spin concentrations than what has been observed in the doping half-cycle (
Figure 8b). As such, we cannot ascribe the increased conductance only to a difference in spin-bearing/spinless charge carrier populations. Among the results of the spectroelectrochemical investigations of these copolymer films, two primary features can be used to explain this conductance increase, also for the two other copolymers:
Cyclic voltammetry curves recorded at low potential scanning rates (
Figure 8) show a difference in the magnitudes and shapes of the oxidation and reduction peaks of
P3HT-Sil-PEG2 and
P3HT-Sil-PEG3 films, whereas for the
P3HT-Sil-PEG1 films, a sharp redox pair is seen, which is ascribed to a change in the conformation of isolated
P3HTvin grafts upon doping;
No noticeable discrepancies are observed between the UV-Vis-NIR spectra (
Figure 7) of
P3HT-Sil-PEG2 and
P3HT-Sil-PEG3 films recorded prior to and following the application of electrochemical stimuli.
The abovementioned features point to the restructuring of the different layers constituting the films, which results in the formation of conductive paths in its bulk, rather than reorganisation of the structure of individual macromolecules. This restructuring is consistent with the changes of the CV curve shape, observed when the polymer films are subjected to potential cycling at a rate of 0.005 V/s (
Figure 5). As such, this restructuring may be tied to the conformation of the non-conjugated polysiloxane and poly(ethylene glycol) chains, which are suspended in a P3HT-rich environment, whose polarity changes significantly upon doping, inducing changes in their structure.
Interestingly, in the case of
P3HT-Sil (
Figure 10e), which lacks the non-conjugated chains, we initially observe a non-zero conductance value, almost as high as for
P3HTvin, followed by a sharp increase when higher potentials are applied. As such, it would appear that the resistance of the copolymer to reactions with oxygen is largely bestowed by the non-conjugated PEG chains. When the maximum applied potential is achieved and we begin decreasing it, the polymer film initially exhibits higher conductance than in the doping half-cycle, much like for the
P3HT-Sil-PEG copolymers. At lower potentials, the conductance drops below the initial value, indicating that some of the charge carriers present in the polymer film were “detrapped”, which may also be a result of doping-induced reorganisation of the spatial structure of the film.
The doped/undoped (“ON/OFF”) conductance ratio (
Table 3) for the grafted
P3HT-Sil is higher than for
P3HTvin itself, but still is sharply lower than the ratio for the PEG-bearing copolymers, evidencing their great change in conductance upon doping/dedoping. Interestingly, the highest ratios were observed for
P3HT-Sil-PEG2 and
P3HT-Sil-PEG3, the polymers showing the most reversible behaviour (particularly so in terms of their spin concentrations,
Figure 8).
By hindering the inter-chain π-π interactions and introducing polyelectrolyte-capable PEG moieties we increase the resistance of the polymers to irreversible reactions with oxygen and facilitate the removal of charge carriers during dedoping. This indicates that the HOMO levels of the copolymers are at a higher energy than HOMO of P3HT, since the copolymers are less susceptible to reactions with oxygen.
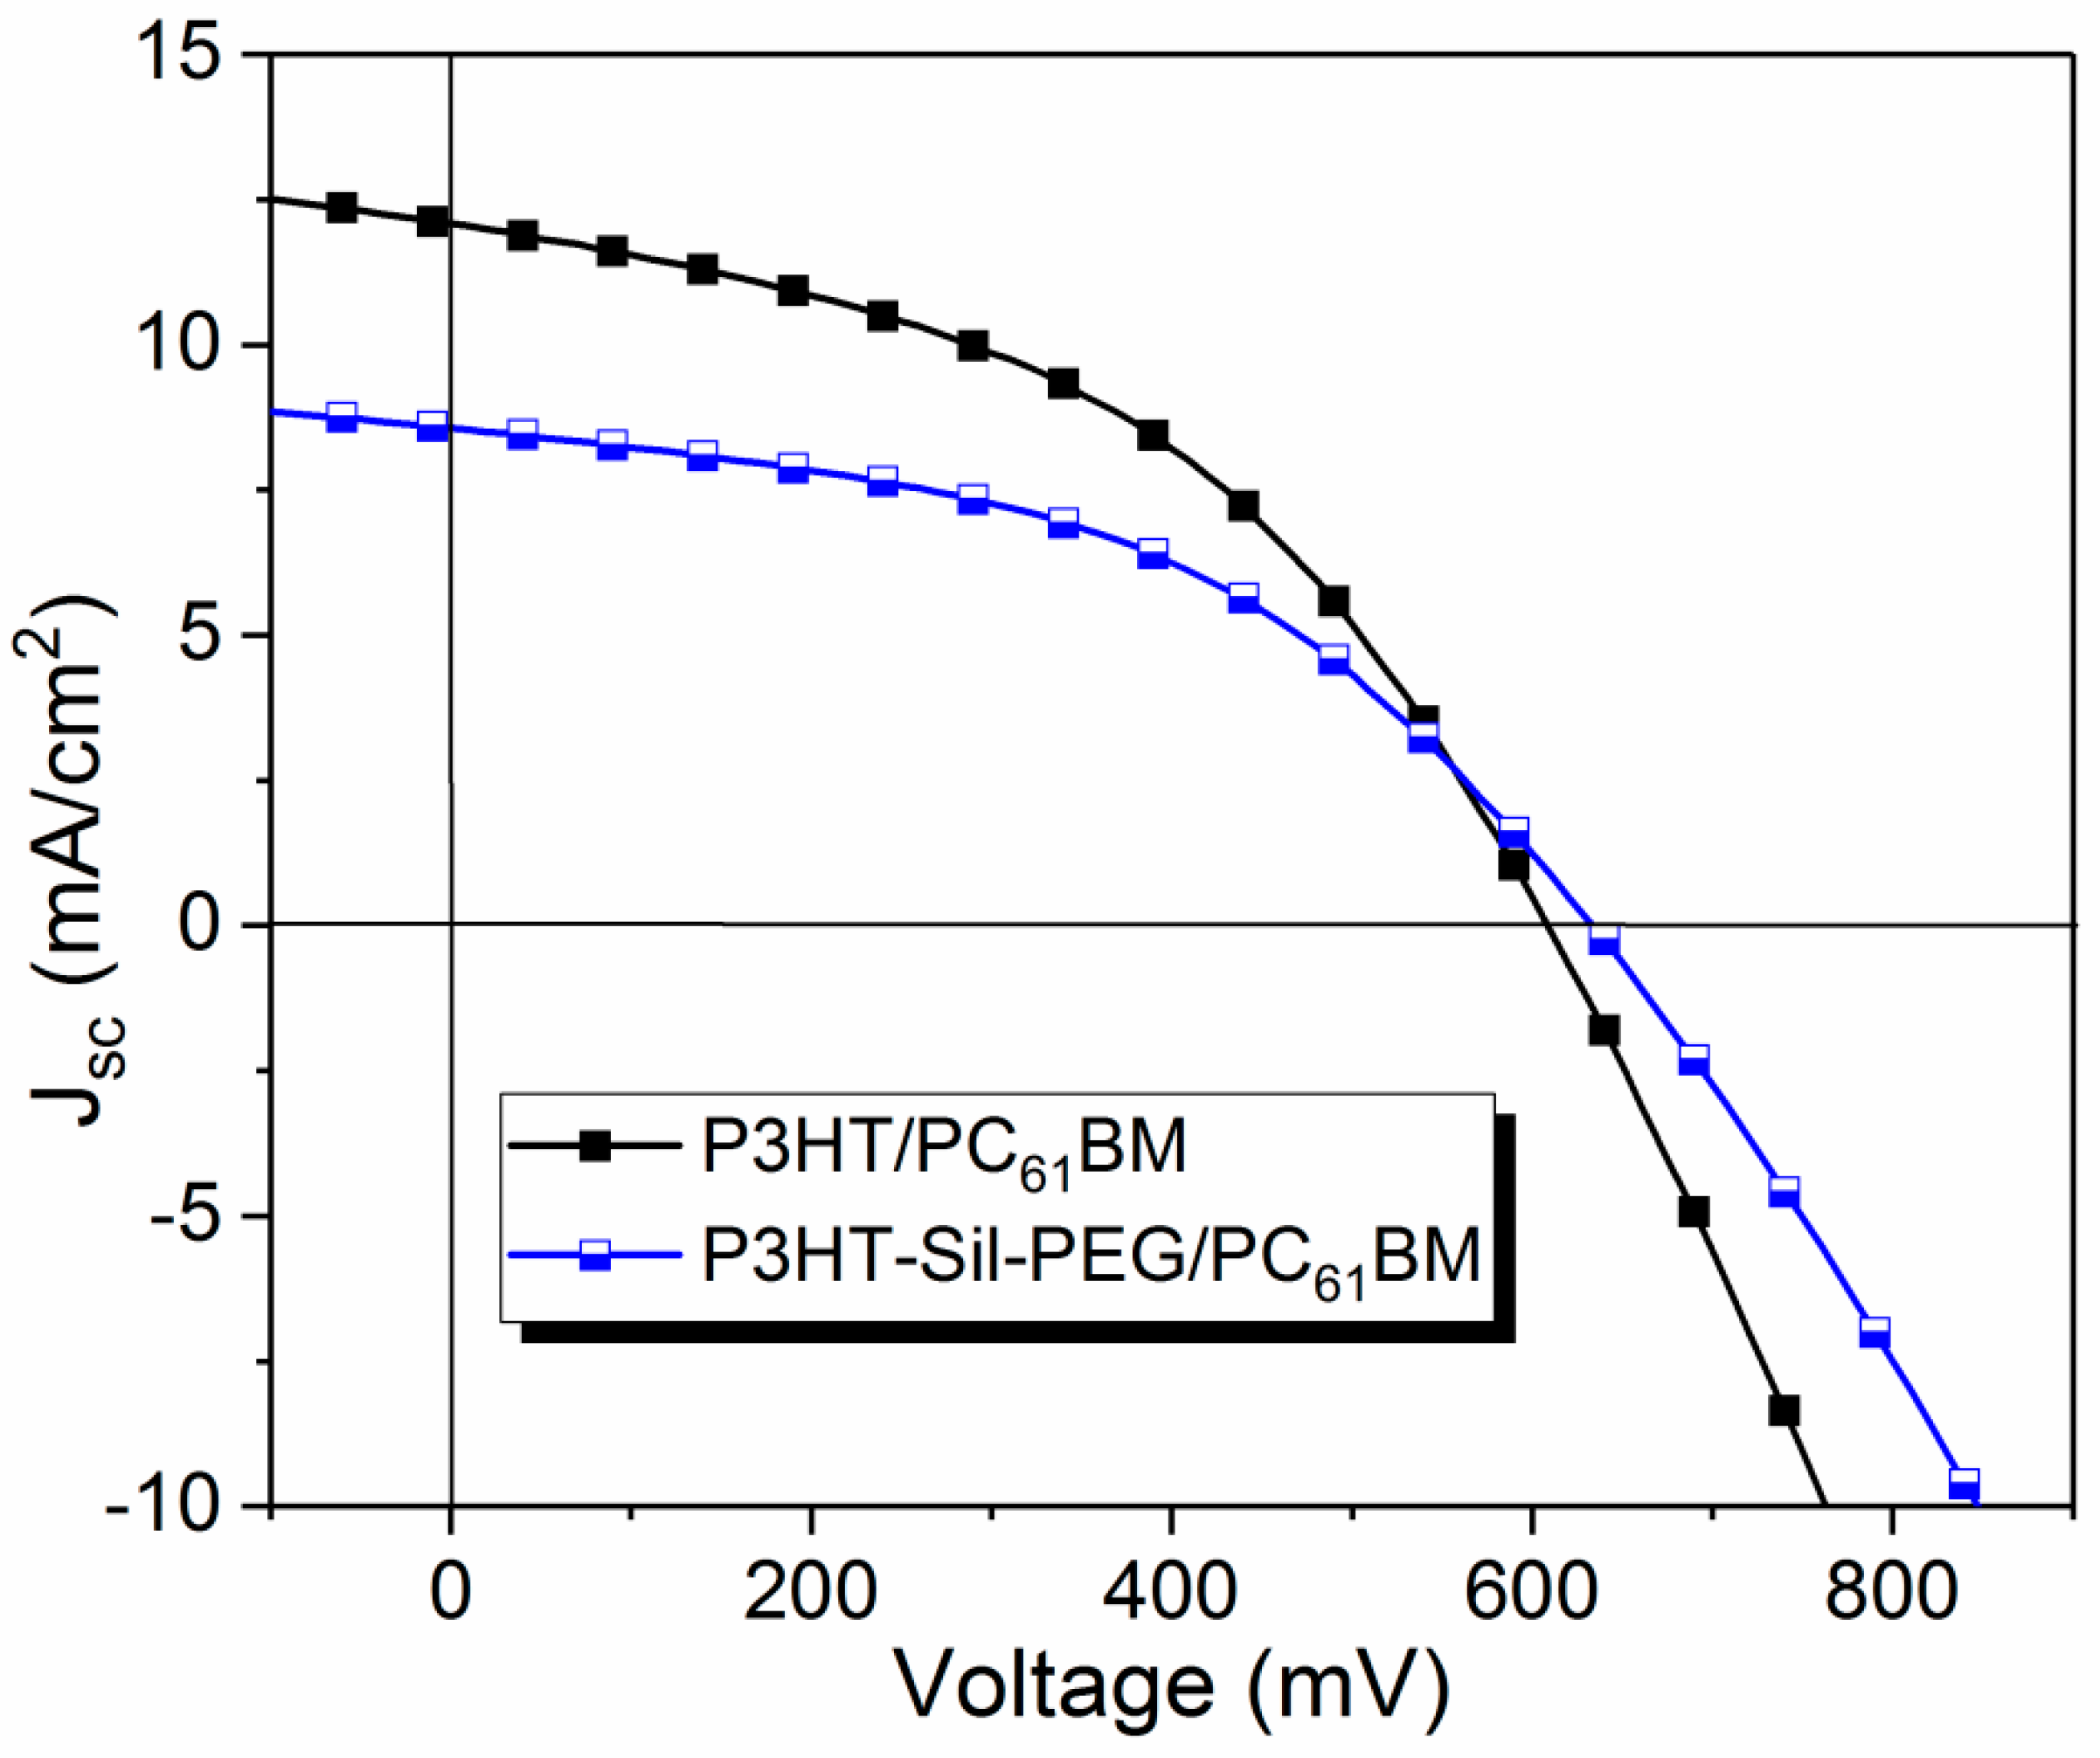
3.7. Solar Cells
The devices with the structure ITO/PEDOT:PSS/P3HT-Sil-PEG3:PC
61BM/Al, in which
P3HT-Sil-PEG3 served as the electron donor and PC
61BM as the electron acceptor were fabricated, in order to investigate the possible usefulness of the studied polymers as active materials in BHJ solar cells. Devices were fabricated without optimization. Devices containing PC
61BM and P3HT were chosen as reference. In both cases donor material/PC
61BM 2:1 weight ratio was chosen. Current density–voltage (J–V) curves are shown in
Figure 11.
The basic photovoltaic parameters are summarized in
Table 4. Power conversion efficiency (PCE) of 2.46 % was achieved for the best device containing
P3HT-Sil-PEG3. This device shows a Fill Factor (FF) of 0.46, open circuit voltage (
Voc) of 0.63 V. Similar results were obtained for the reference devices with FF of 0.45 and
Voc of 0.62 V. The difference was in short circuit current (
Jsc) with 8.57 mA/cm
2 for
P3HT-Sil-PEG3 based BHJ comparing to reference device with
Jsc of 12.58 mA/cm
2.
Although the devices with a
P3HT-Sil-PEG3/PC
61BM layer present lower efficiency than the reference devices, based on P3HT/PC
61BM BHJ, the results are very promising because the
P3HT-Sil-PEG3/PC
61BM BHJ contains significantly less P3HT than the P3HT/PC
61BM reference. Compared to other works on conductive copolymers (
Table 4), similar photovoltaic results were obtained. Moreover, further optimisation of devices and polymer structure can lead to improvement of the performance of the device. This indicates great potential of the studied polymers for their application in photovoltaics.

 ,
, 


