Poly(lactic acid)/Cellulose Films Produced from Composite Spheres Prepared by Emulsion-Solvent Evaporation Method


Abstract

1. Introduction
2. Materials and Methods
2.1. Materials
2.2. Cellulose Modification
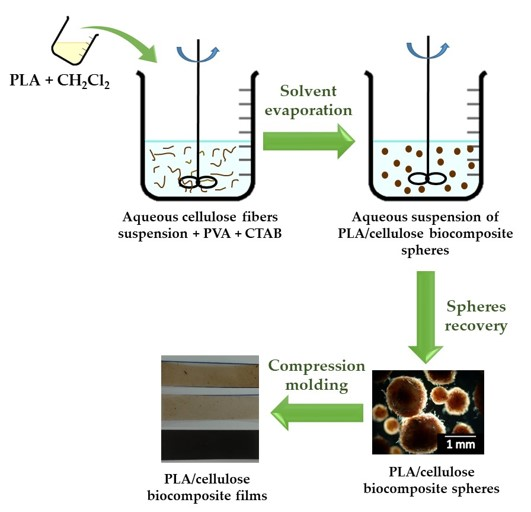
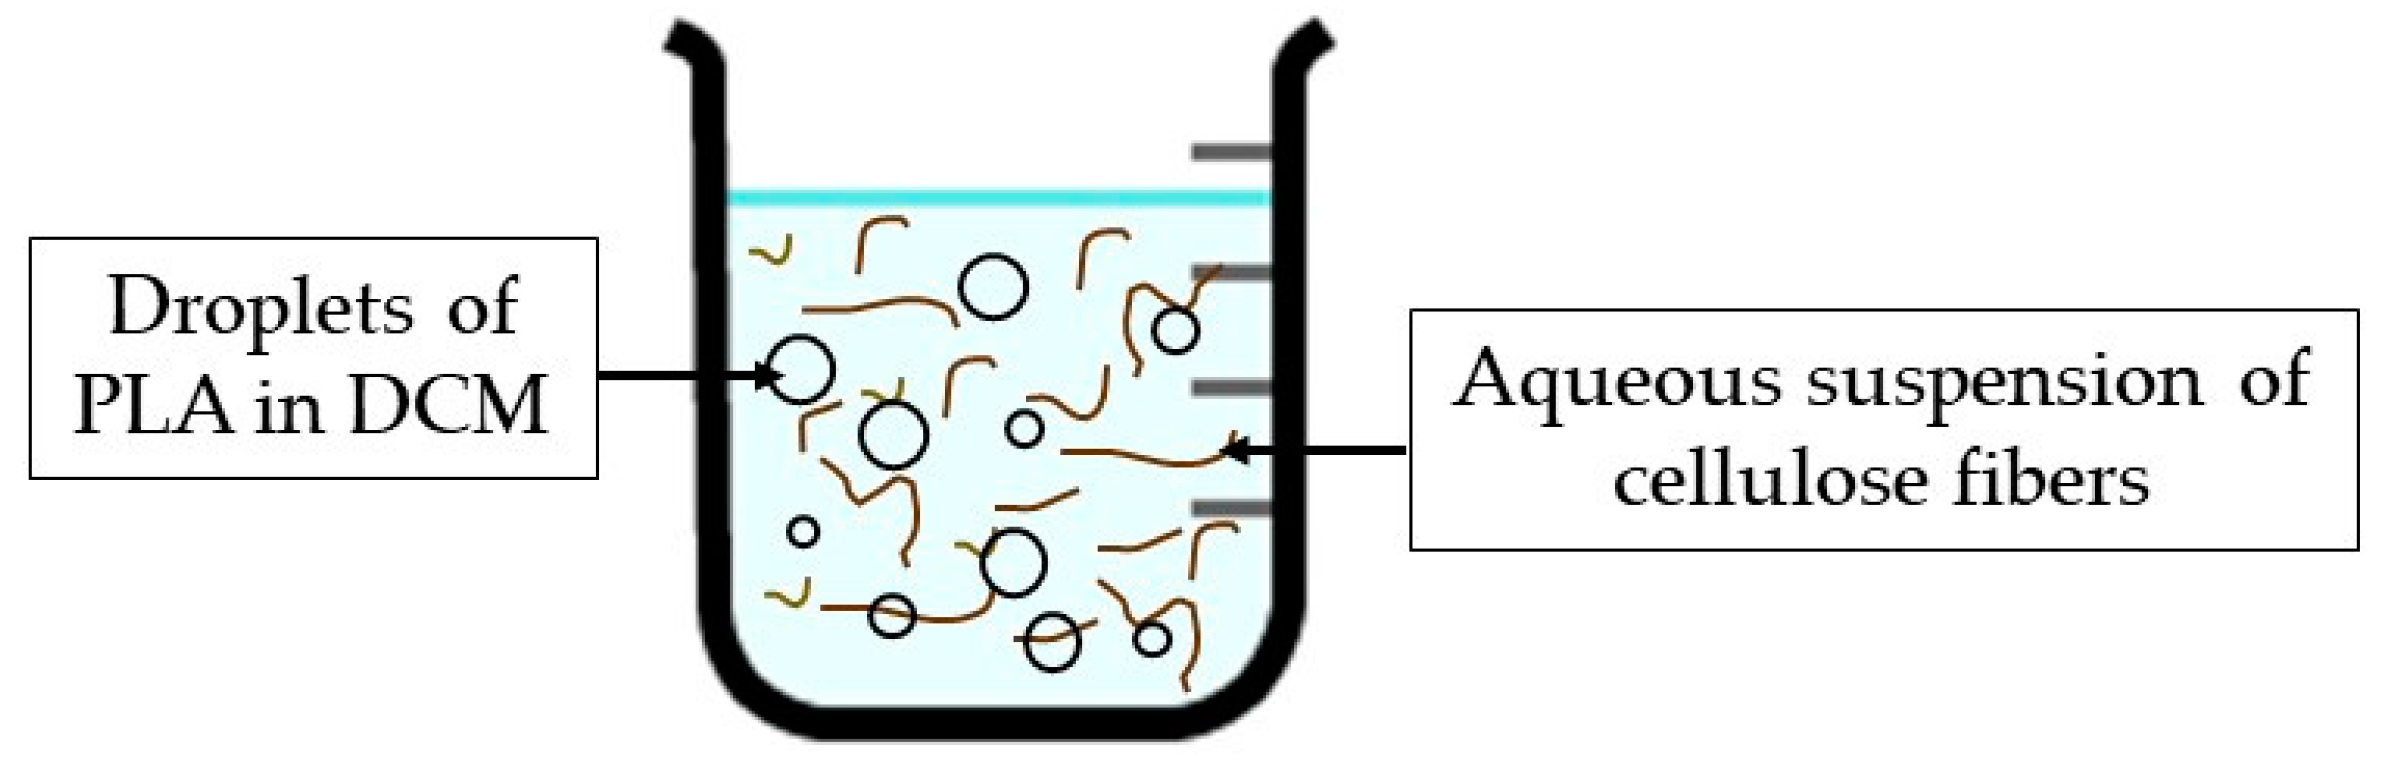
2.3. Preparation and Characterization of PLA/Cellulose Biocomposite Spheres
2.3.1. Process Yield
2.3.2. Physical Characterization of PLA/Cellulose Spheres
2.3.3. Attenuated Total Reflectance-Fourier Transform Infrared Spectroscopy
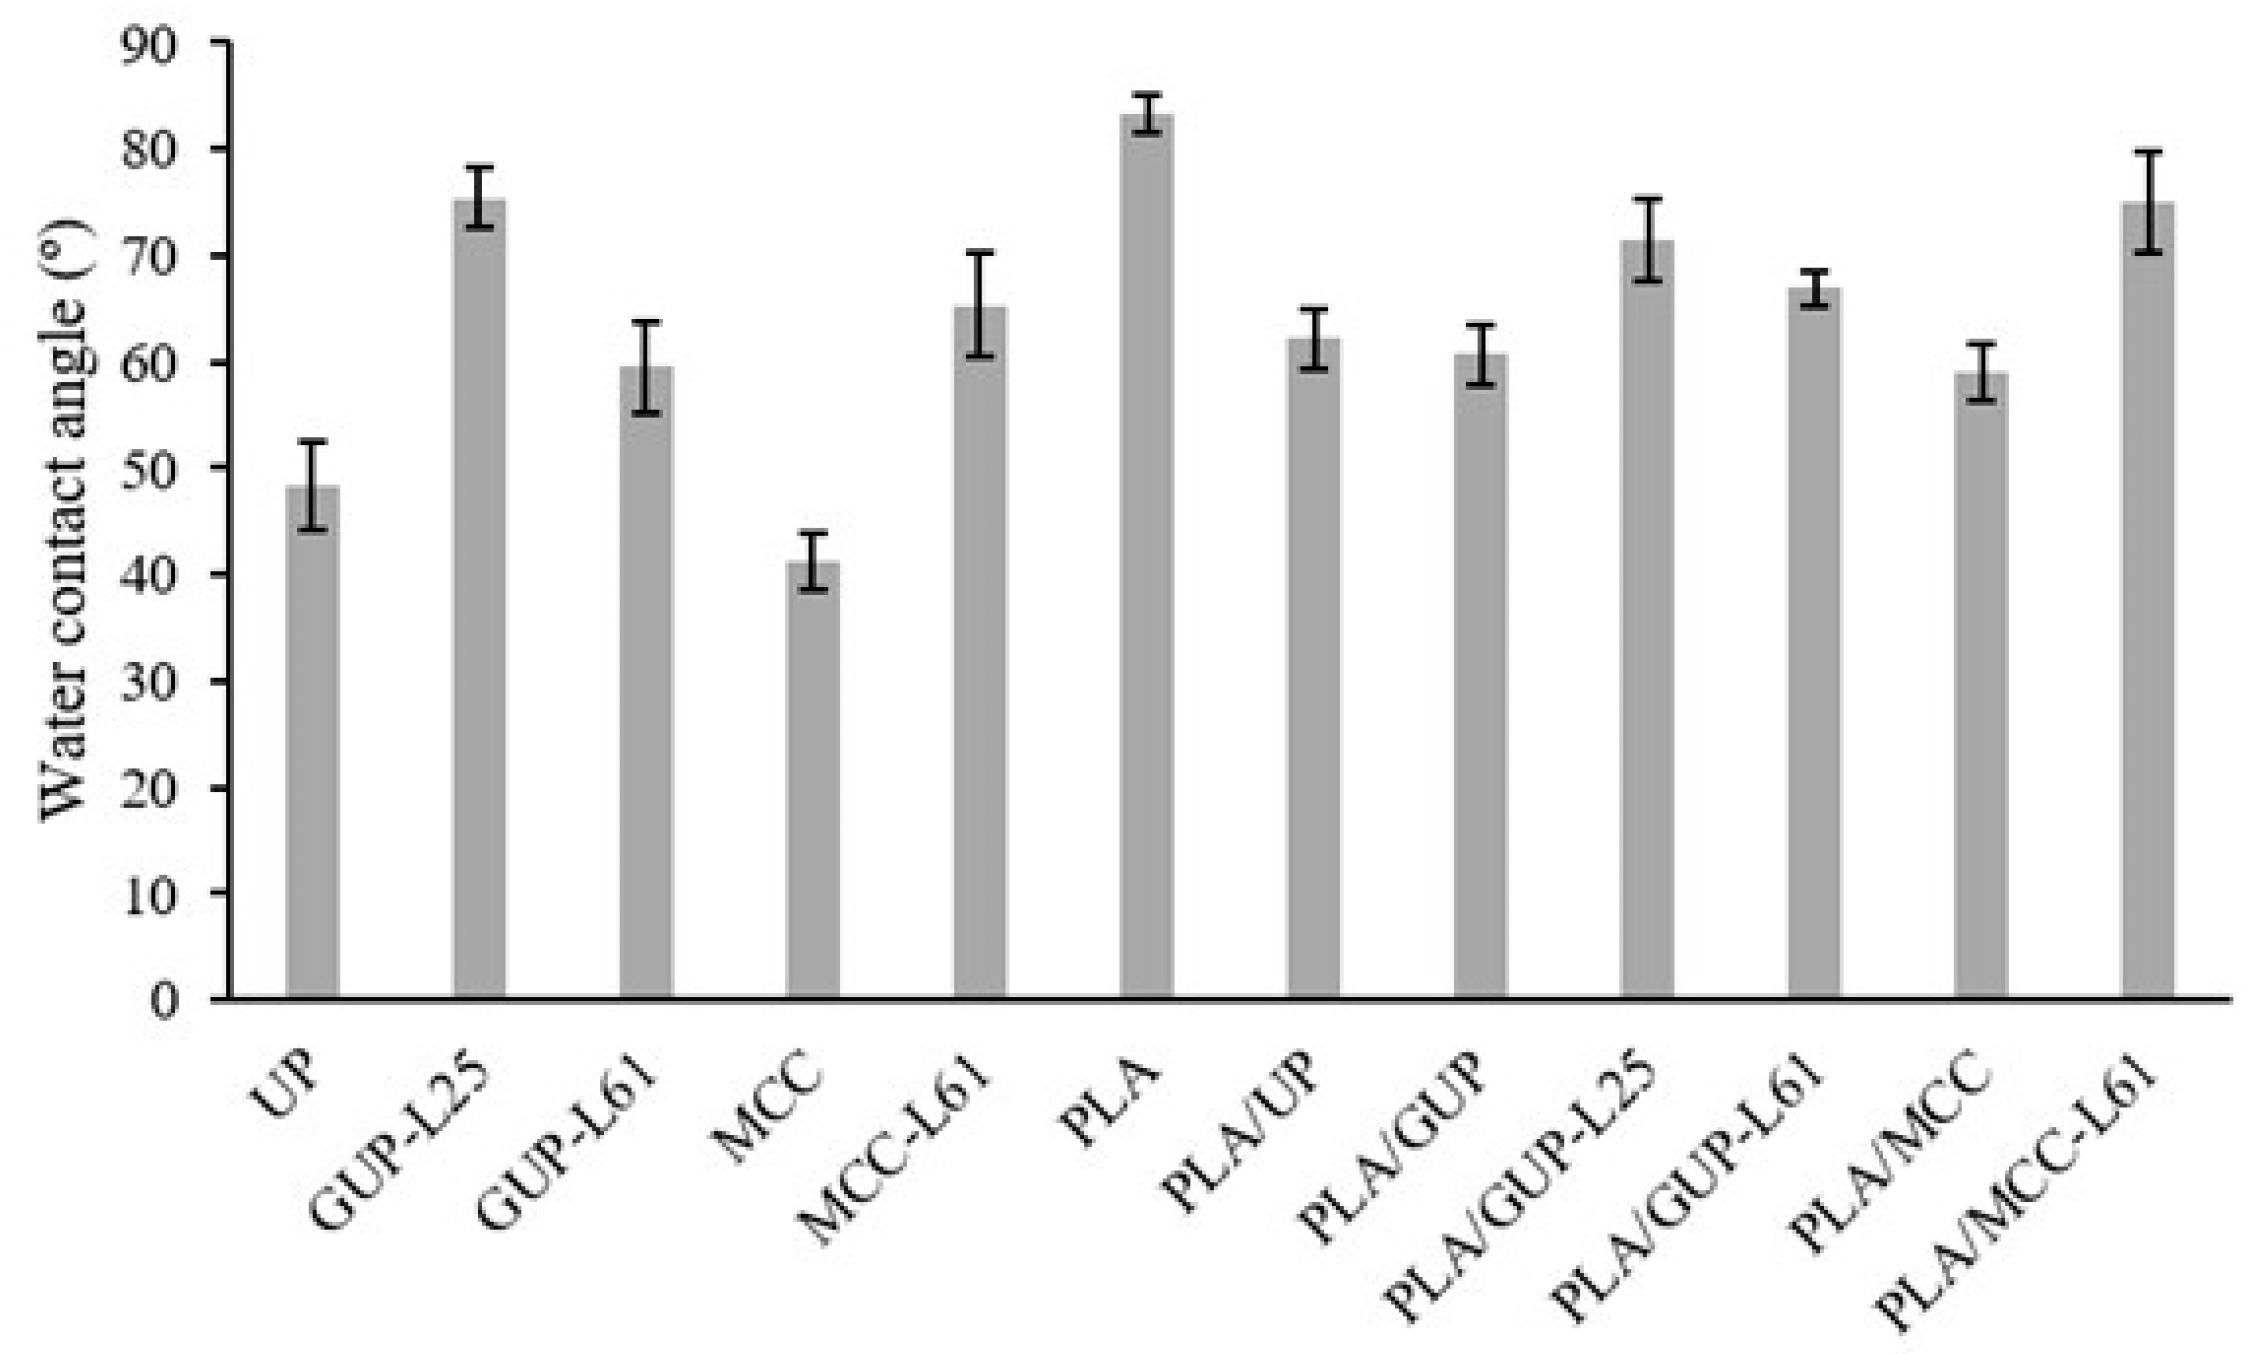
2.3.4. Contact Angle Measurements
2.4. Production and Characterization of Biocomposite Films from PLA/Cellulose Spheres
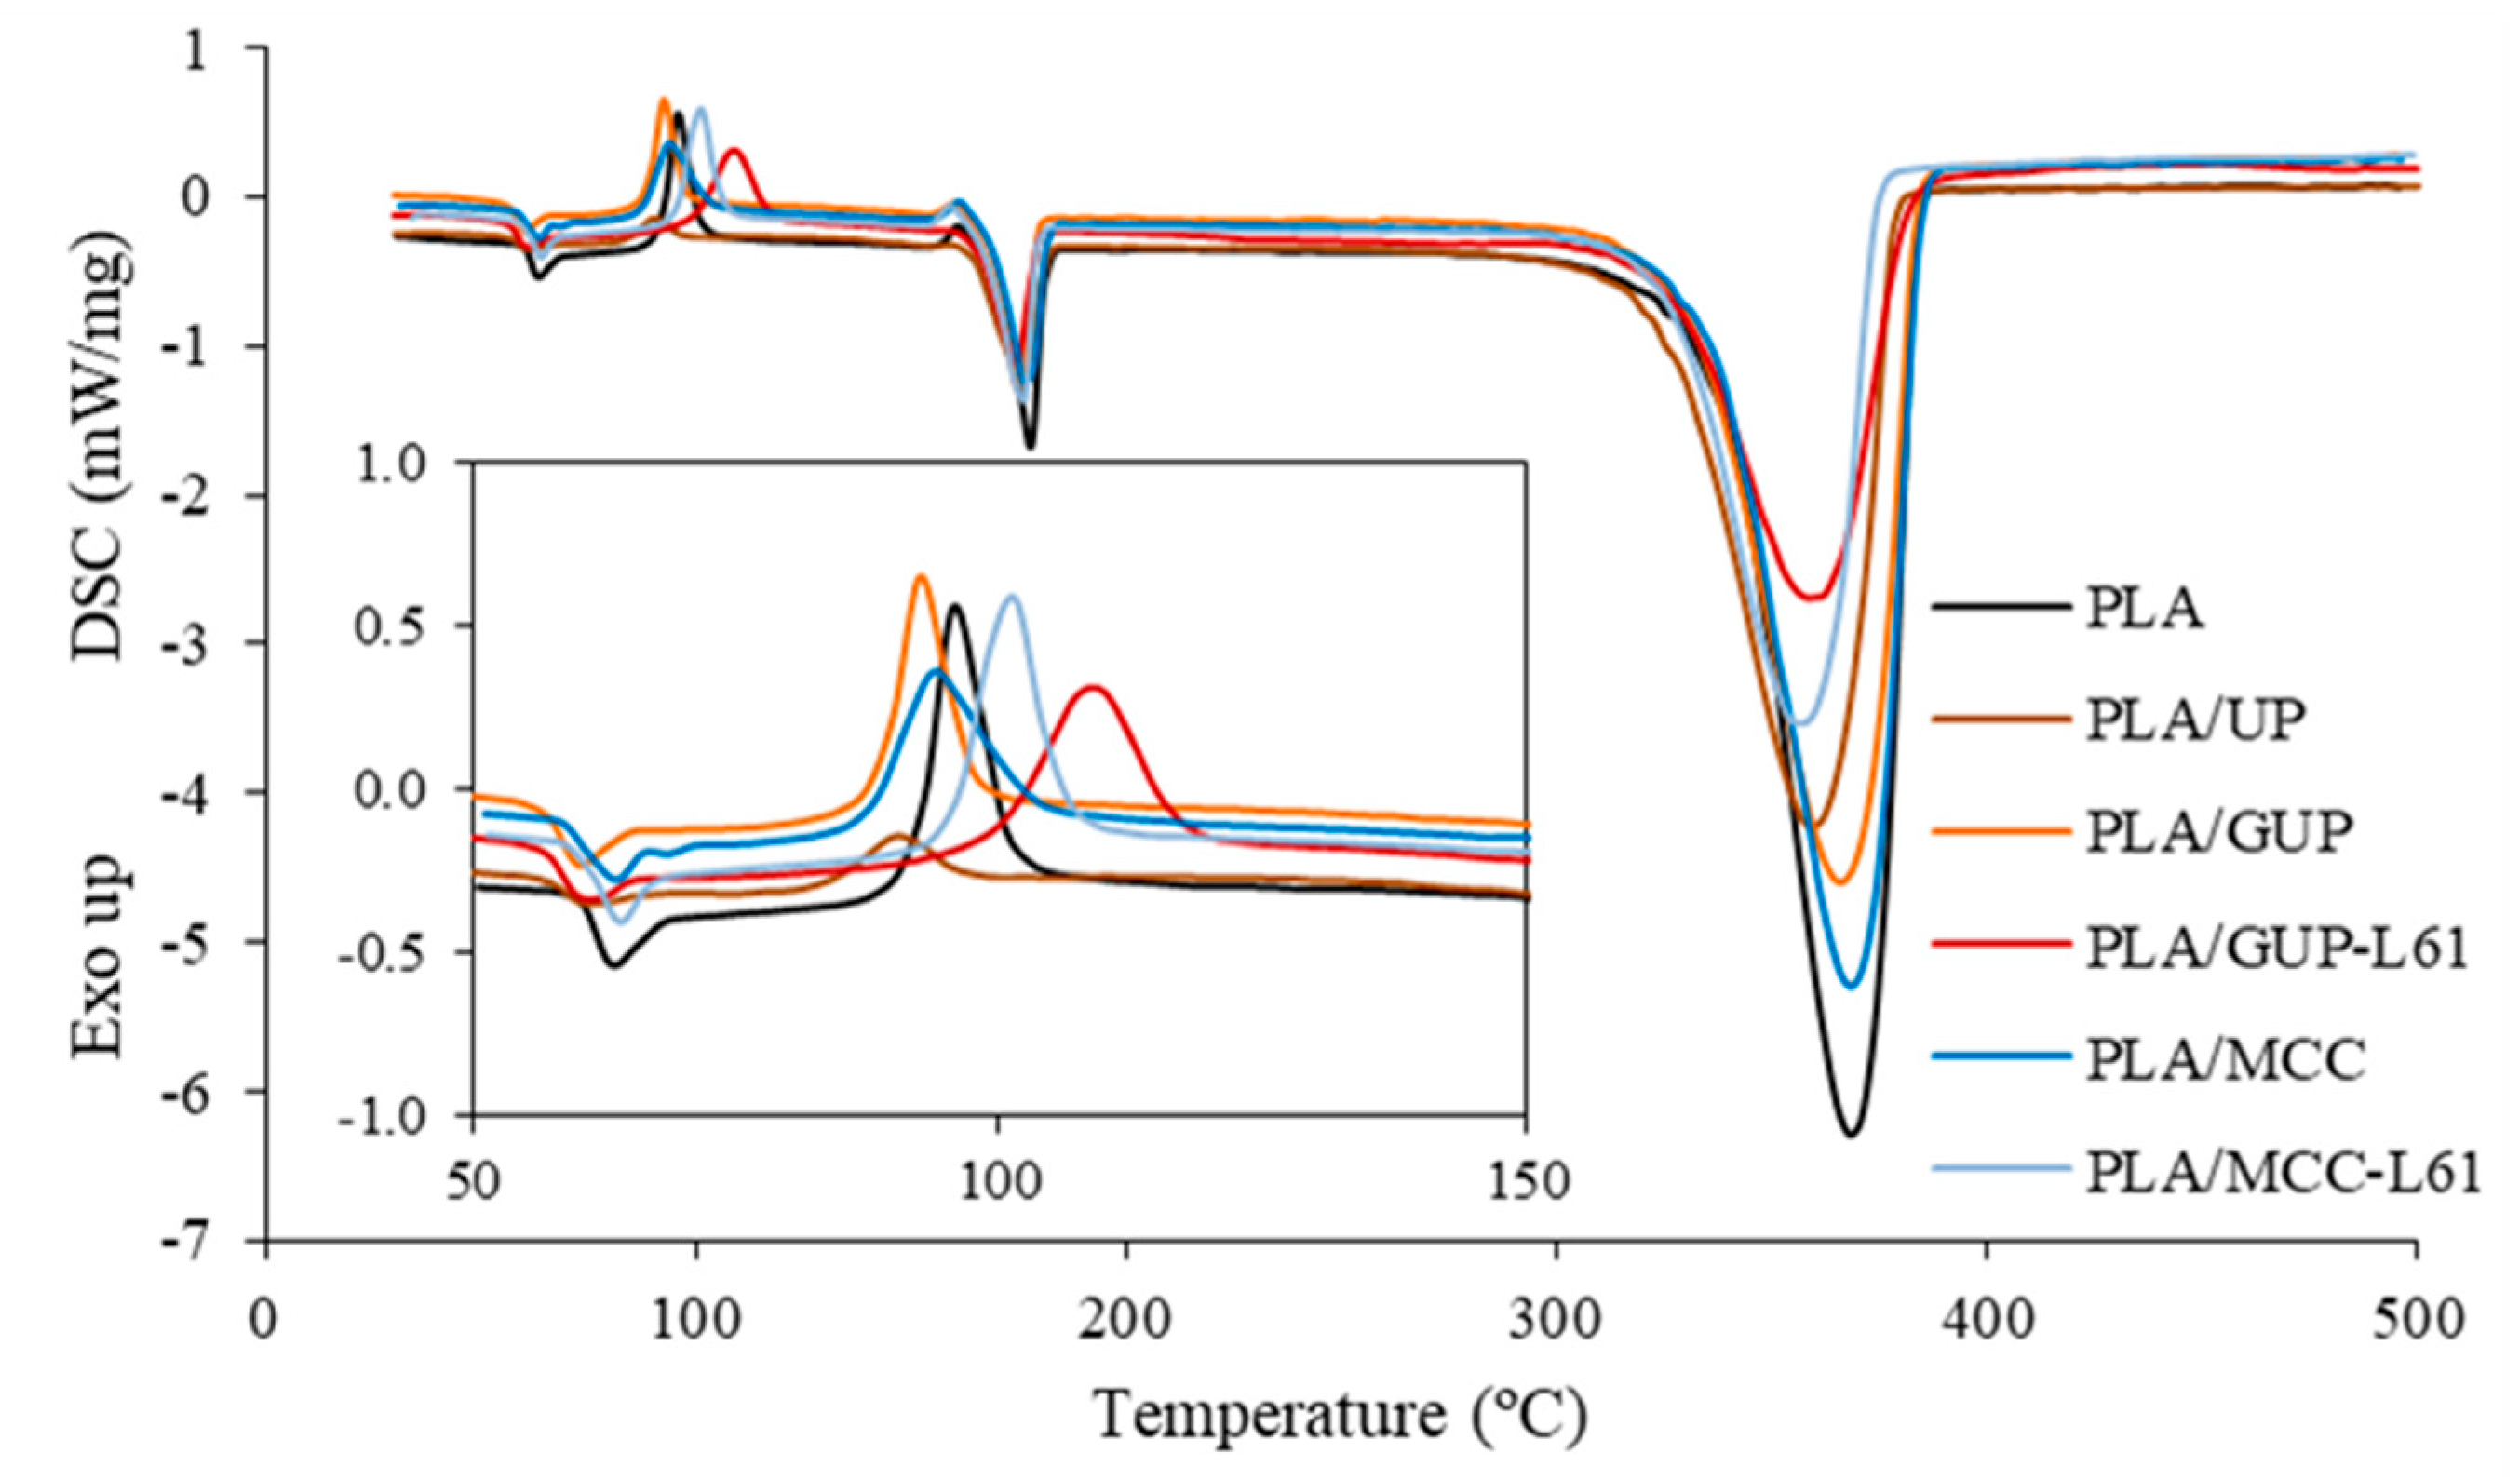
2.4.1. Differential Scanning Calorimetry Analysis
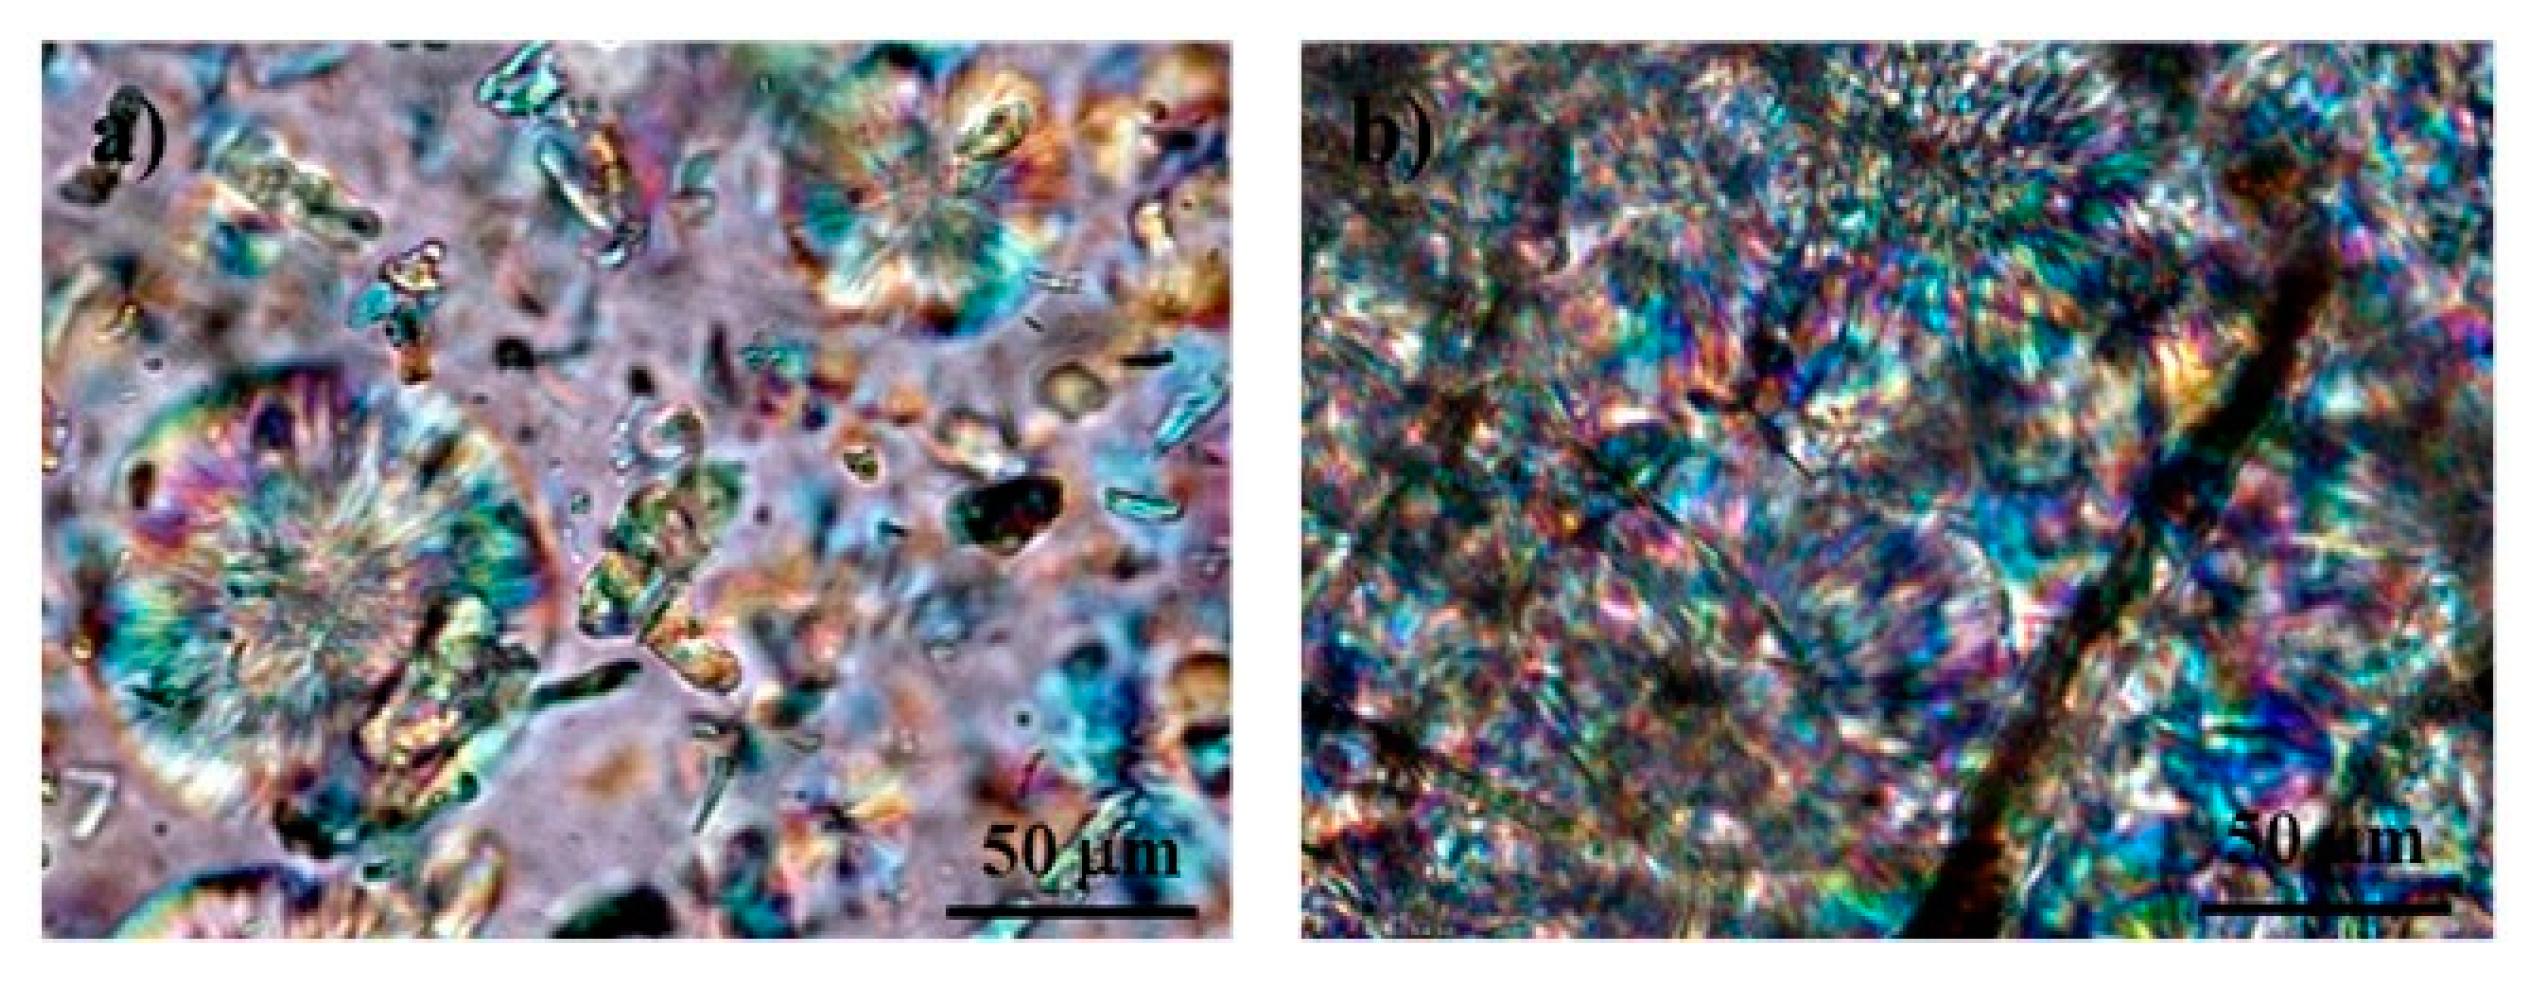
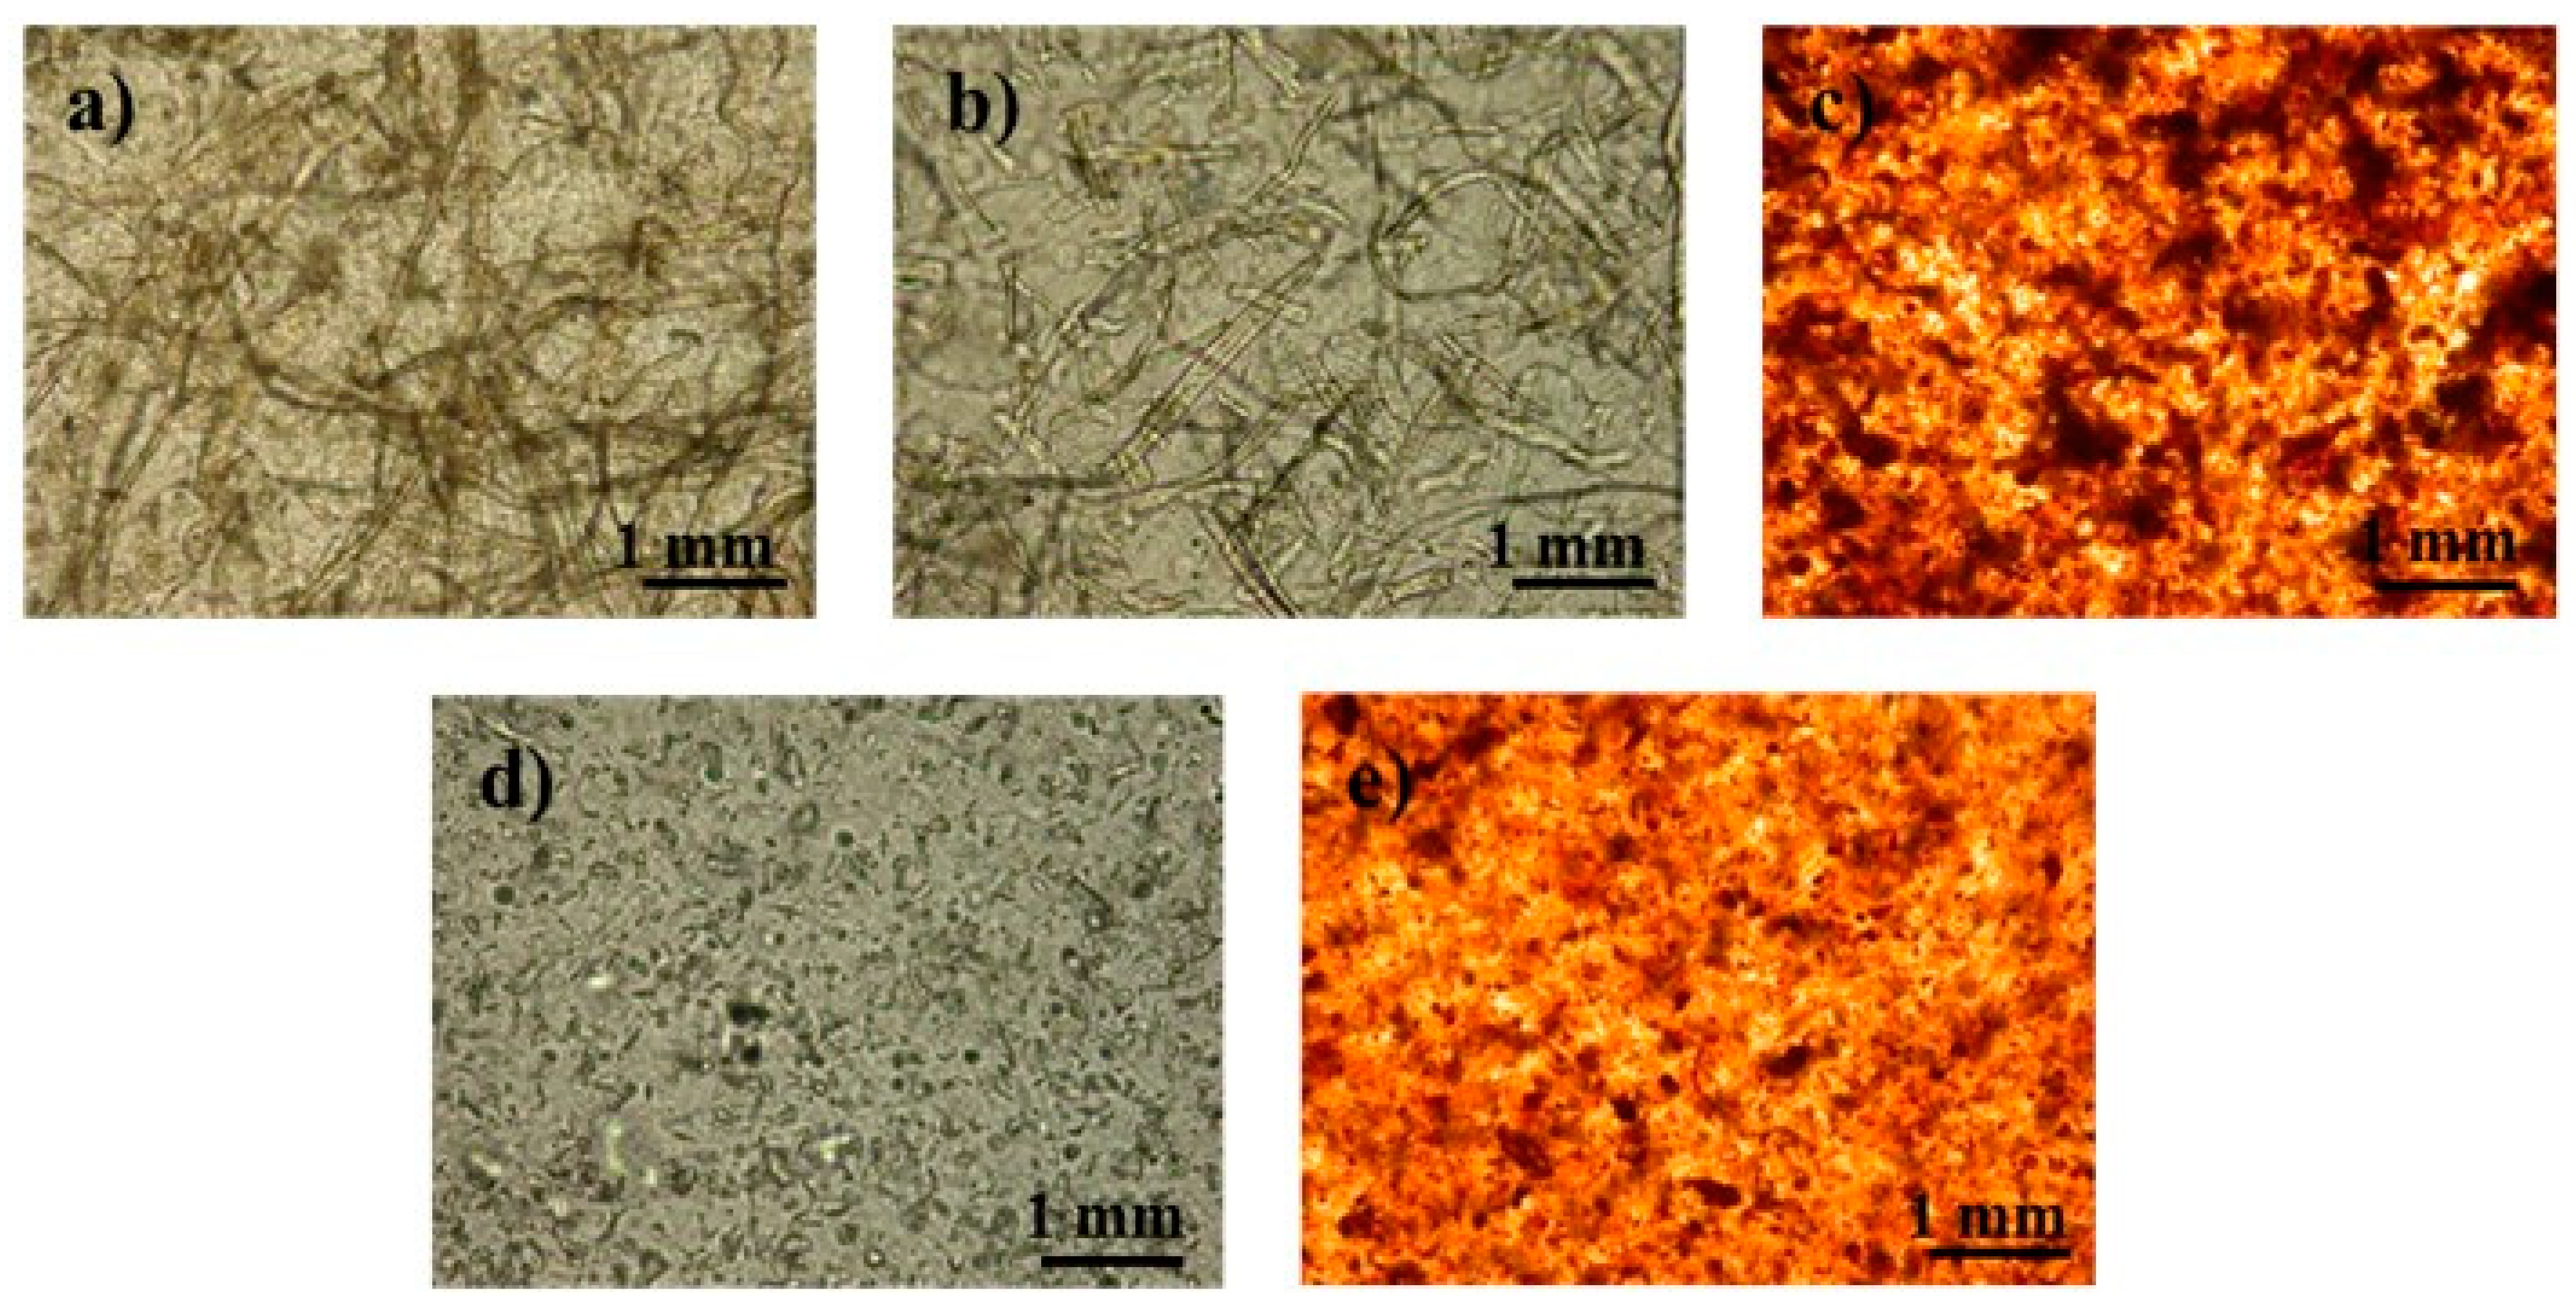
2.4.2. Structural Properties of the Biocomposite Films
2.4.3. Mechanical Testing of Biocomposite Films
3. Results and Discussion
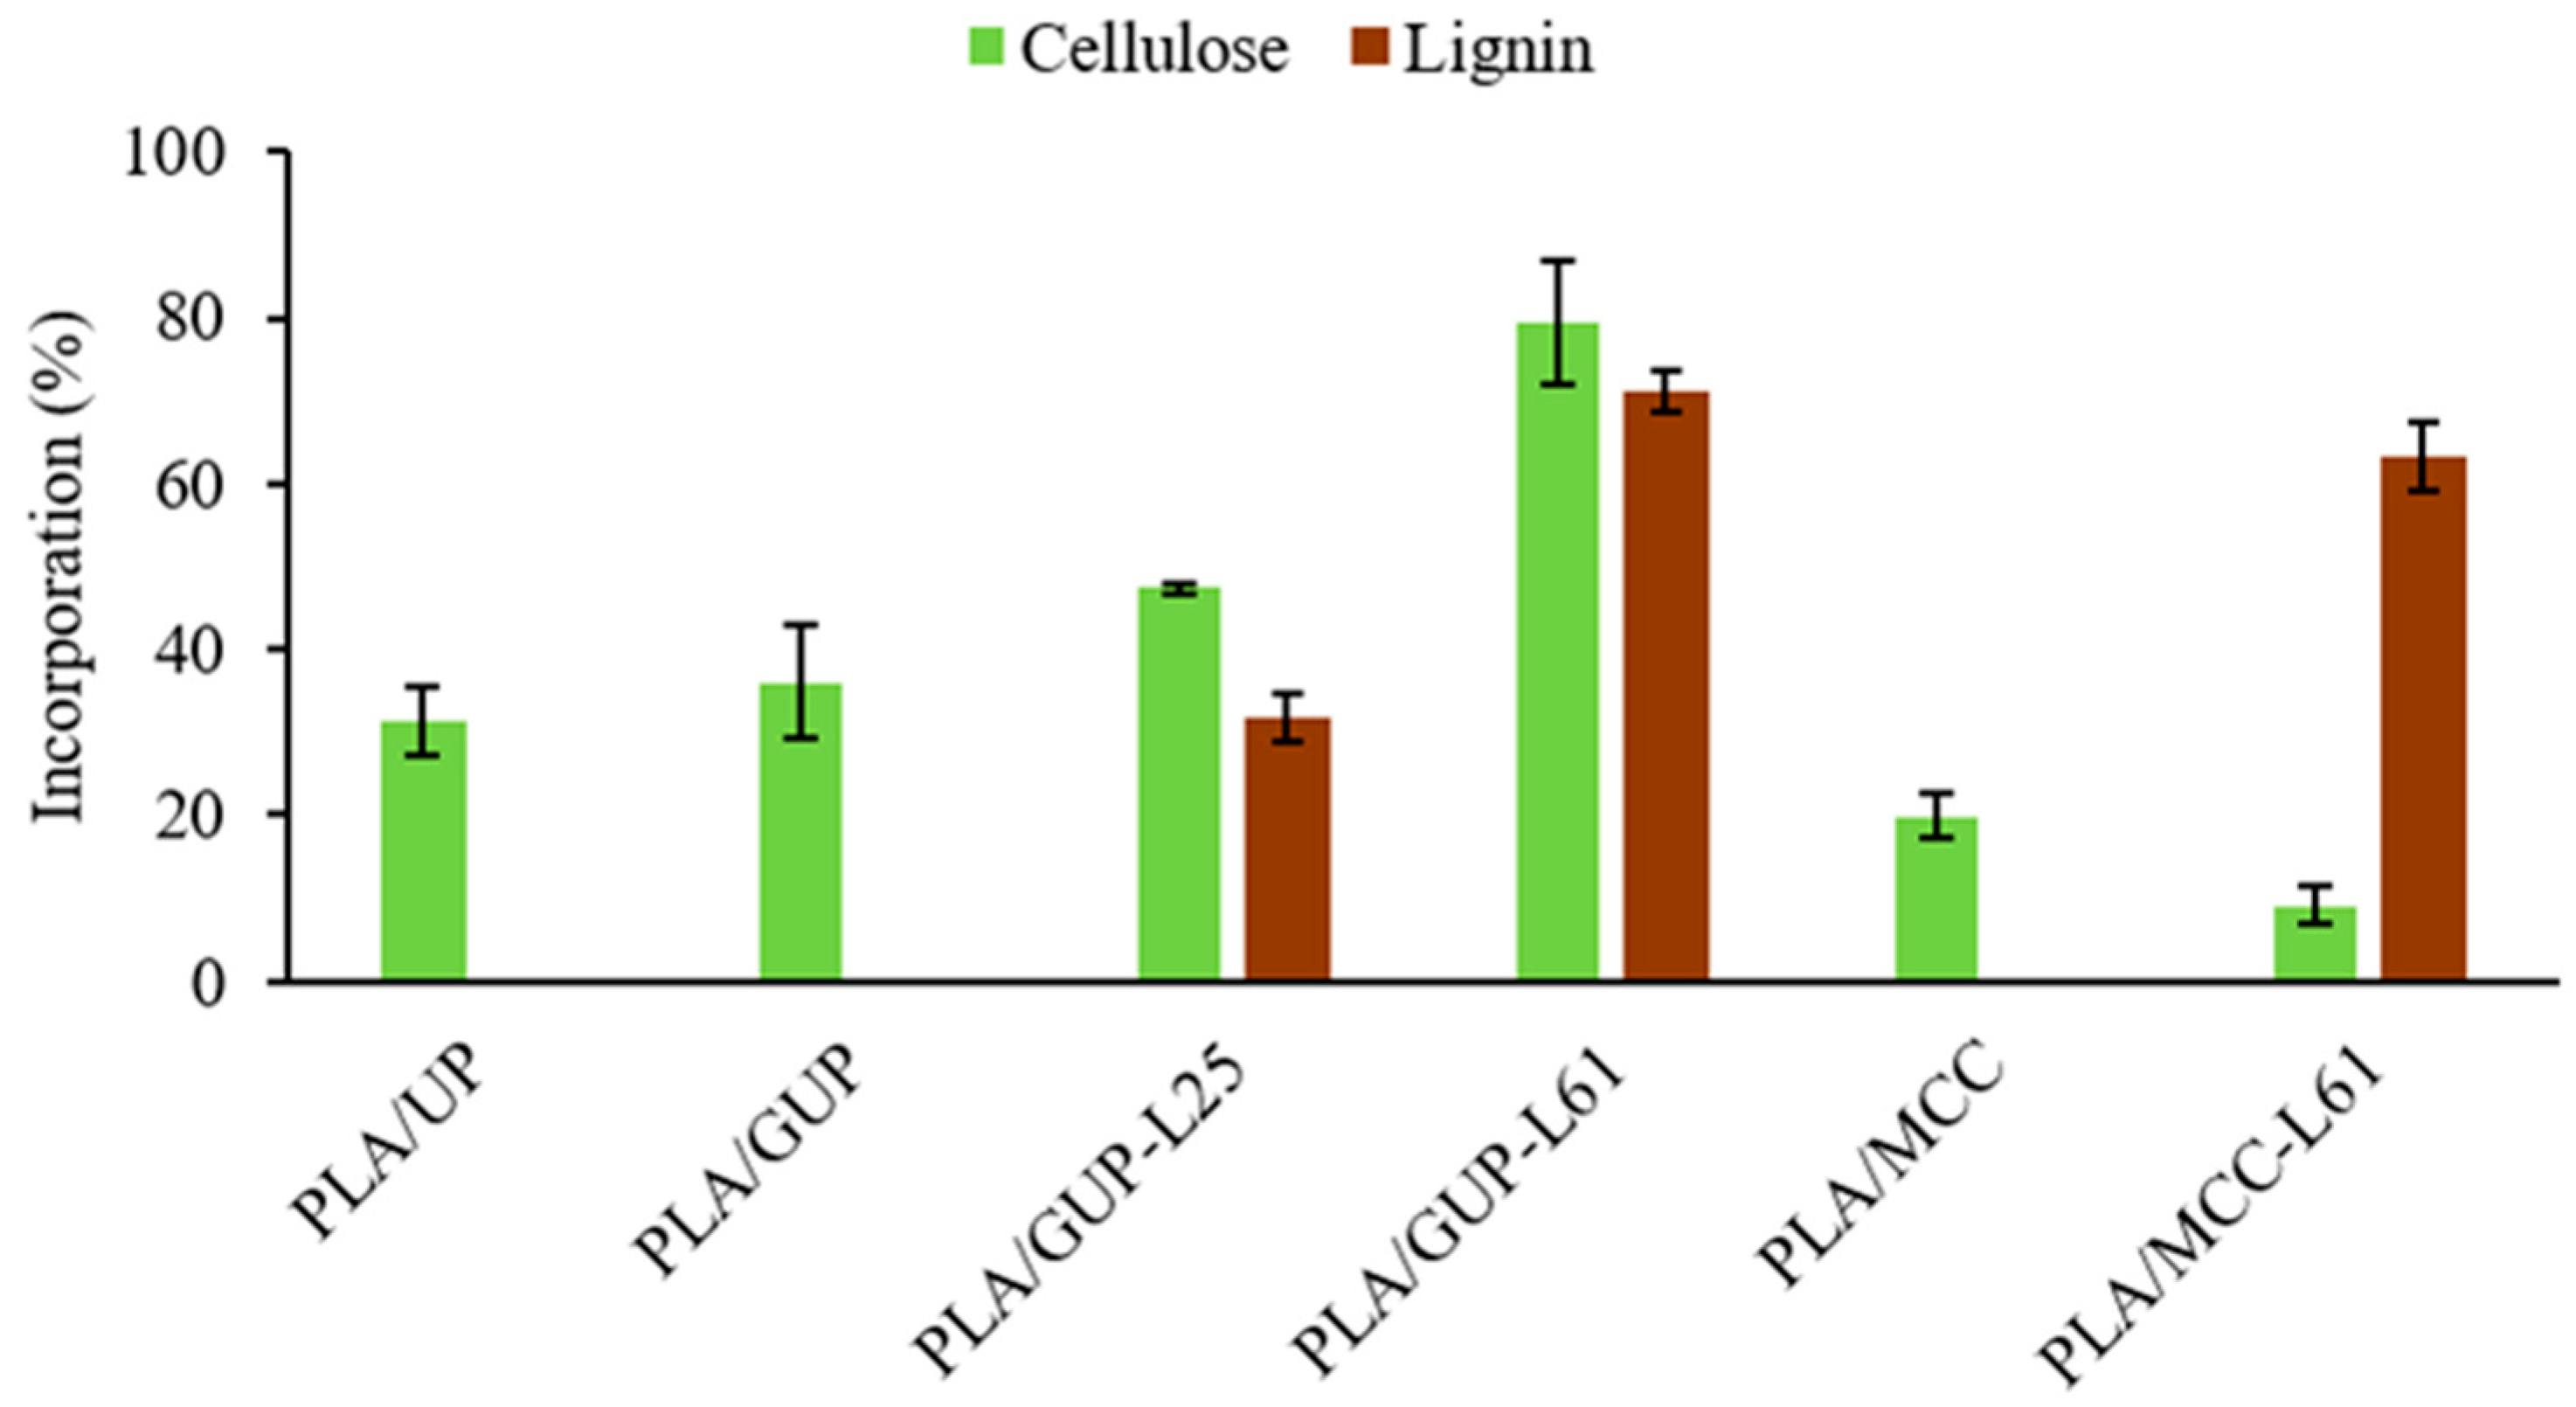
3.1. Spheres Yield and Effectiveness of Cellulose Incorporation
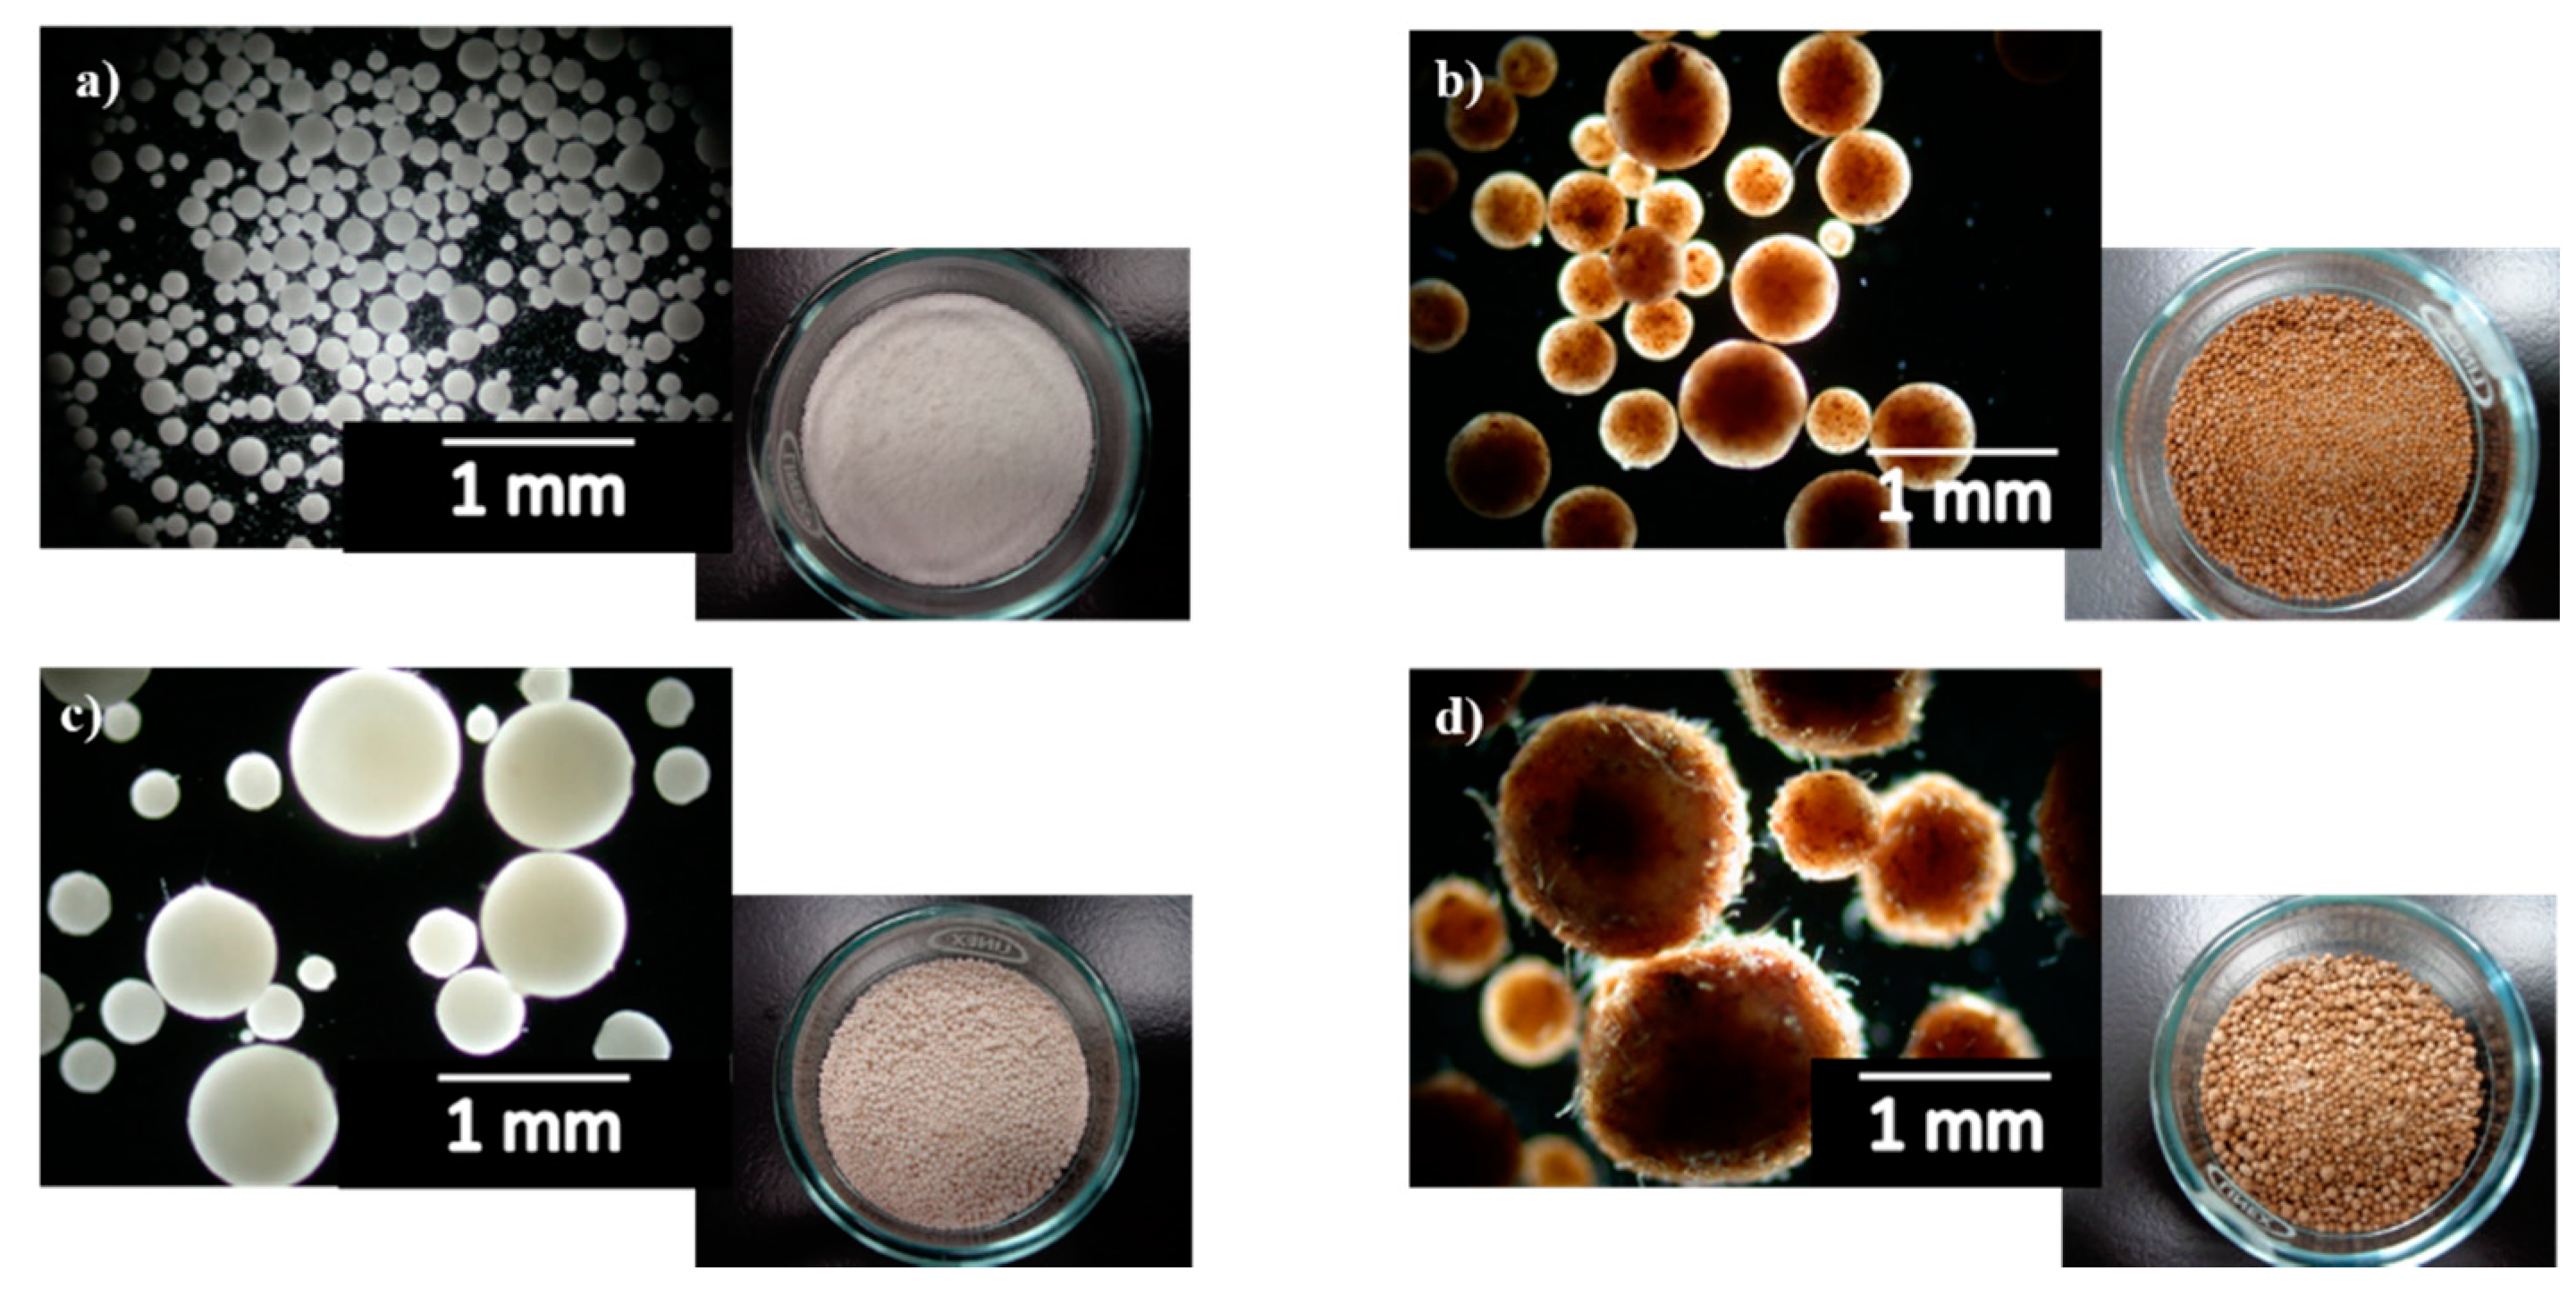
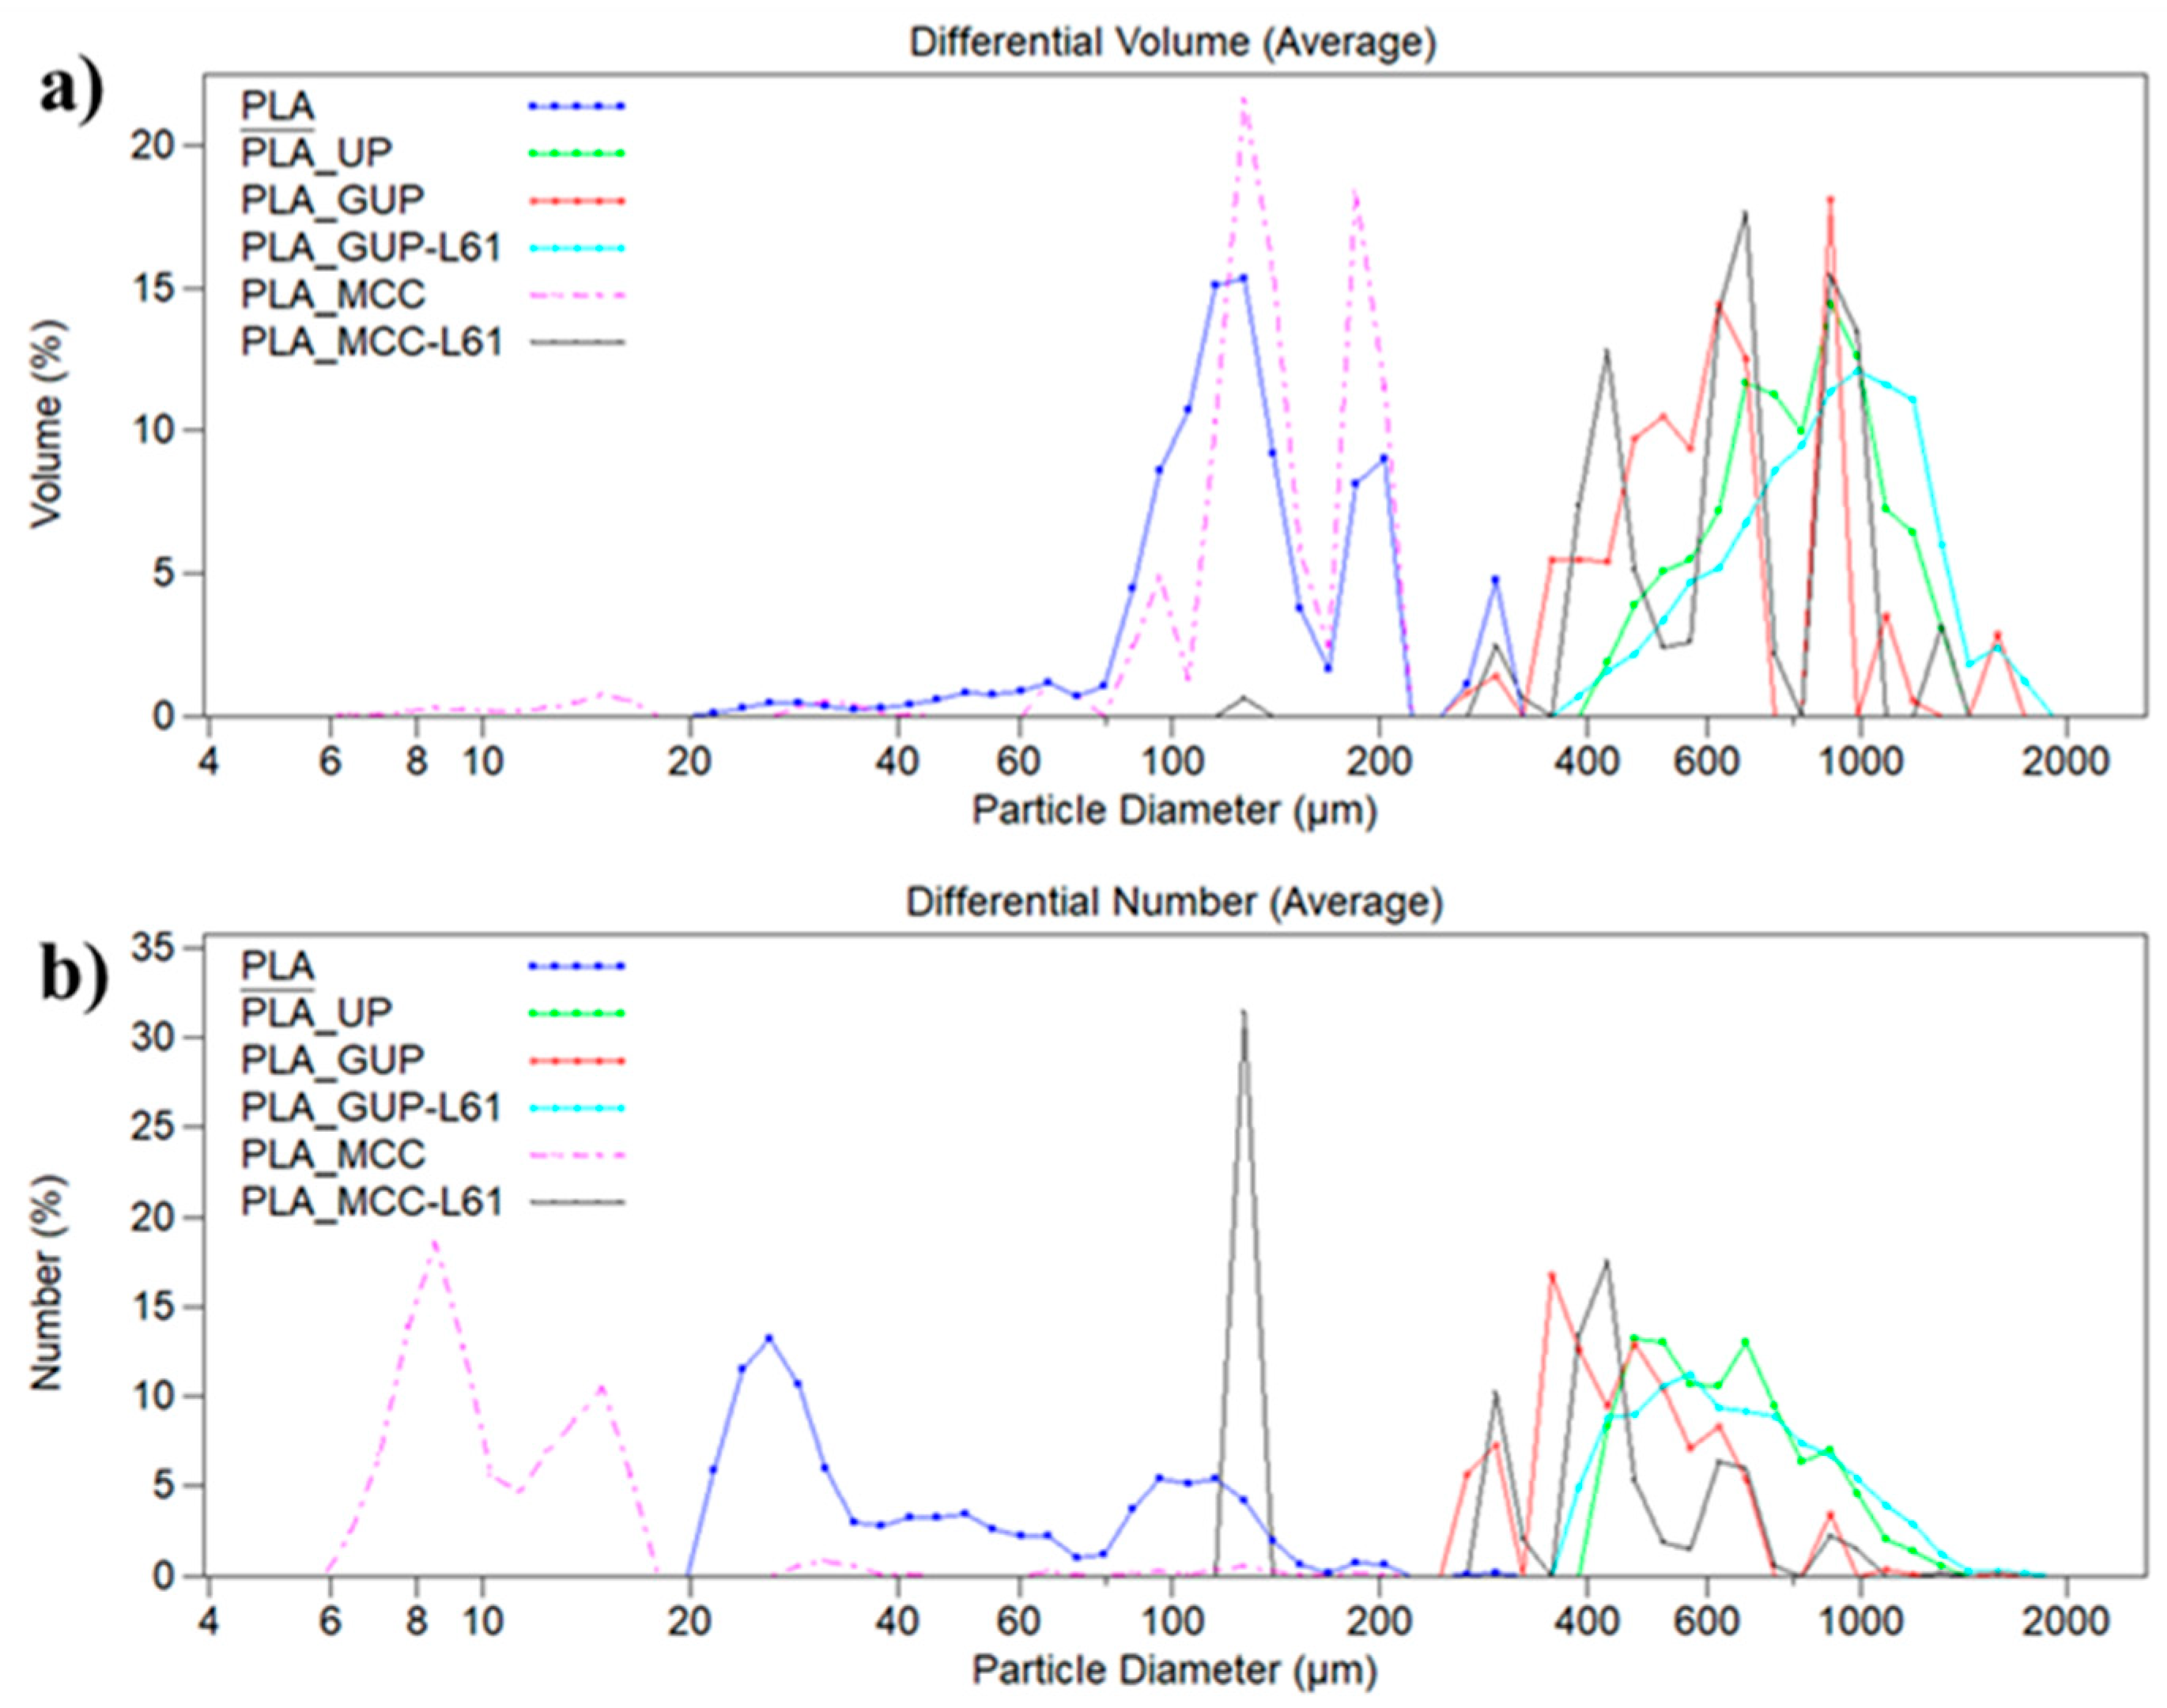
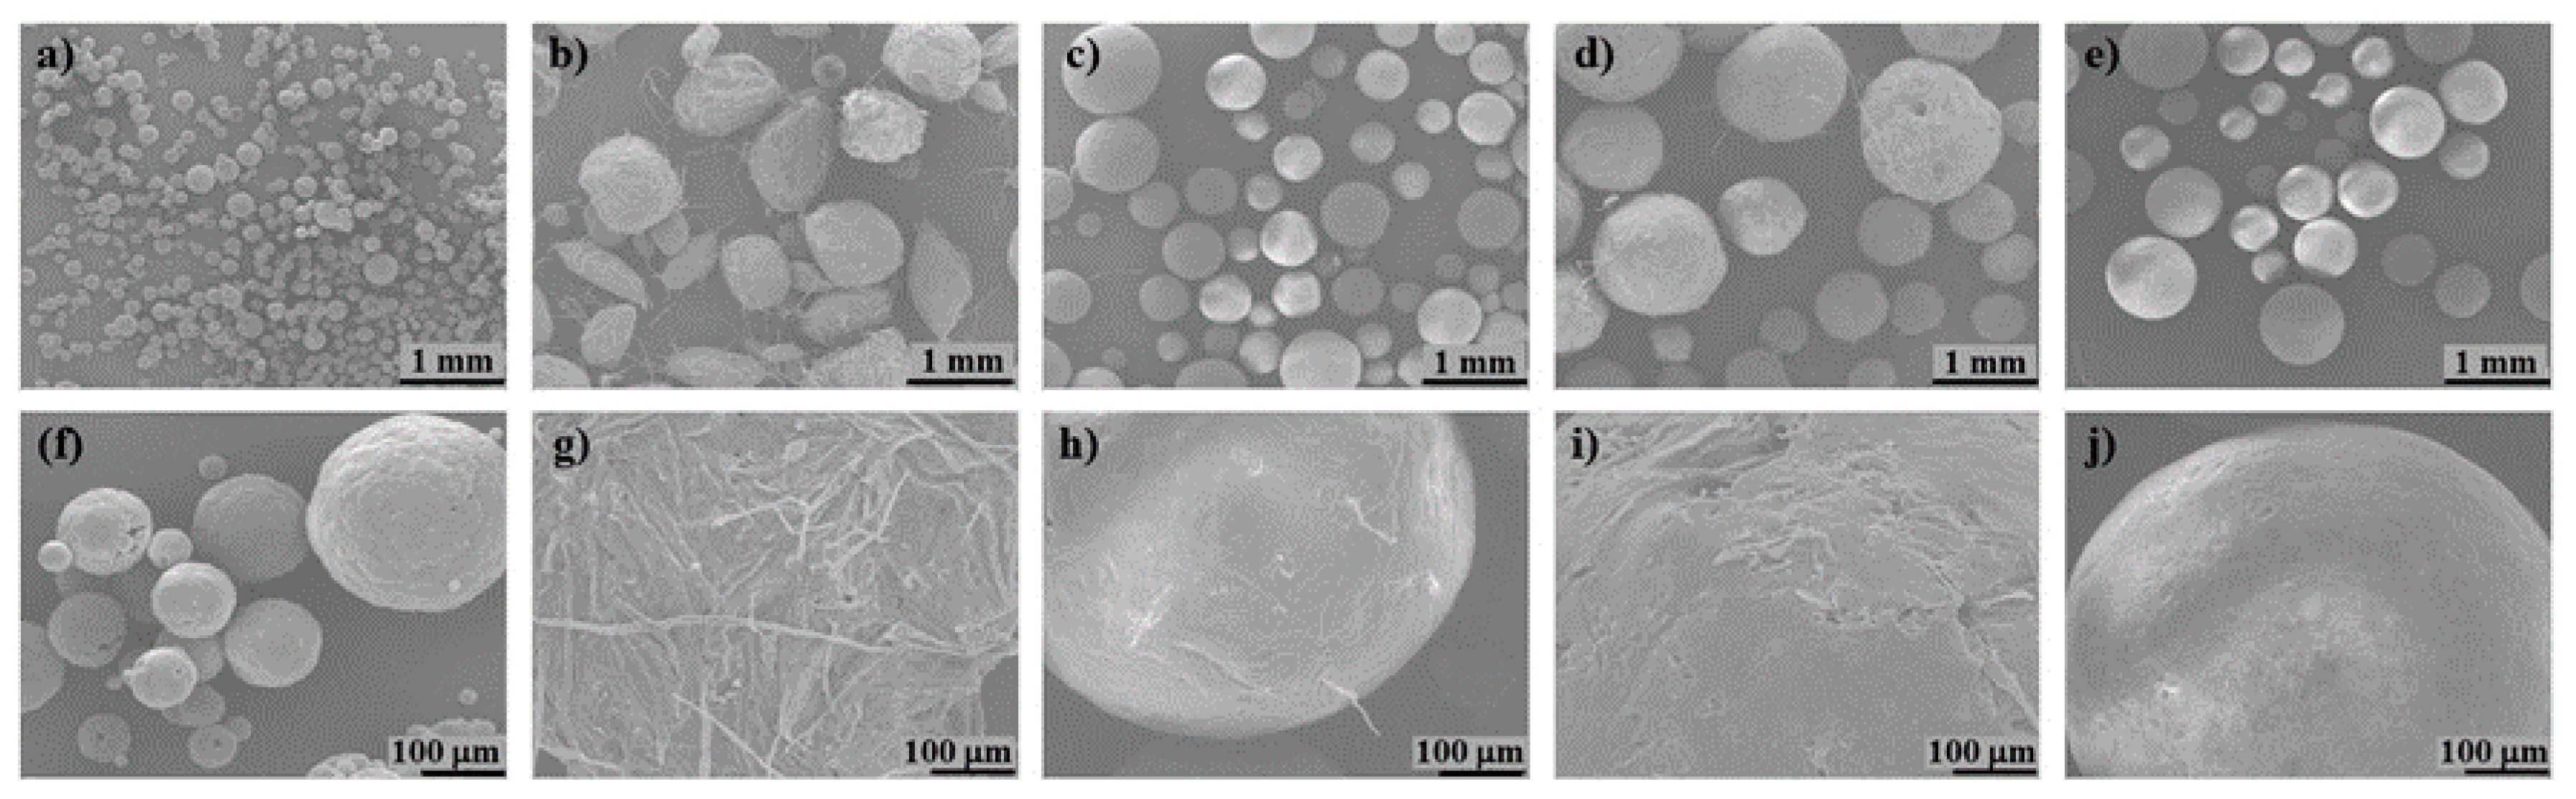
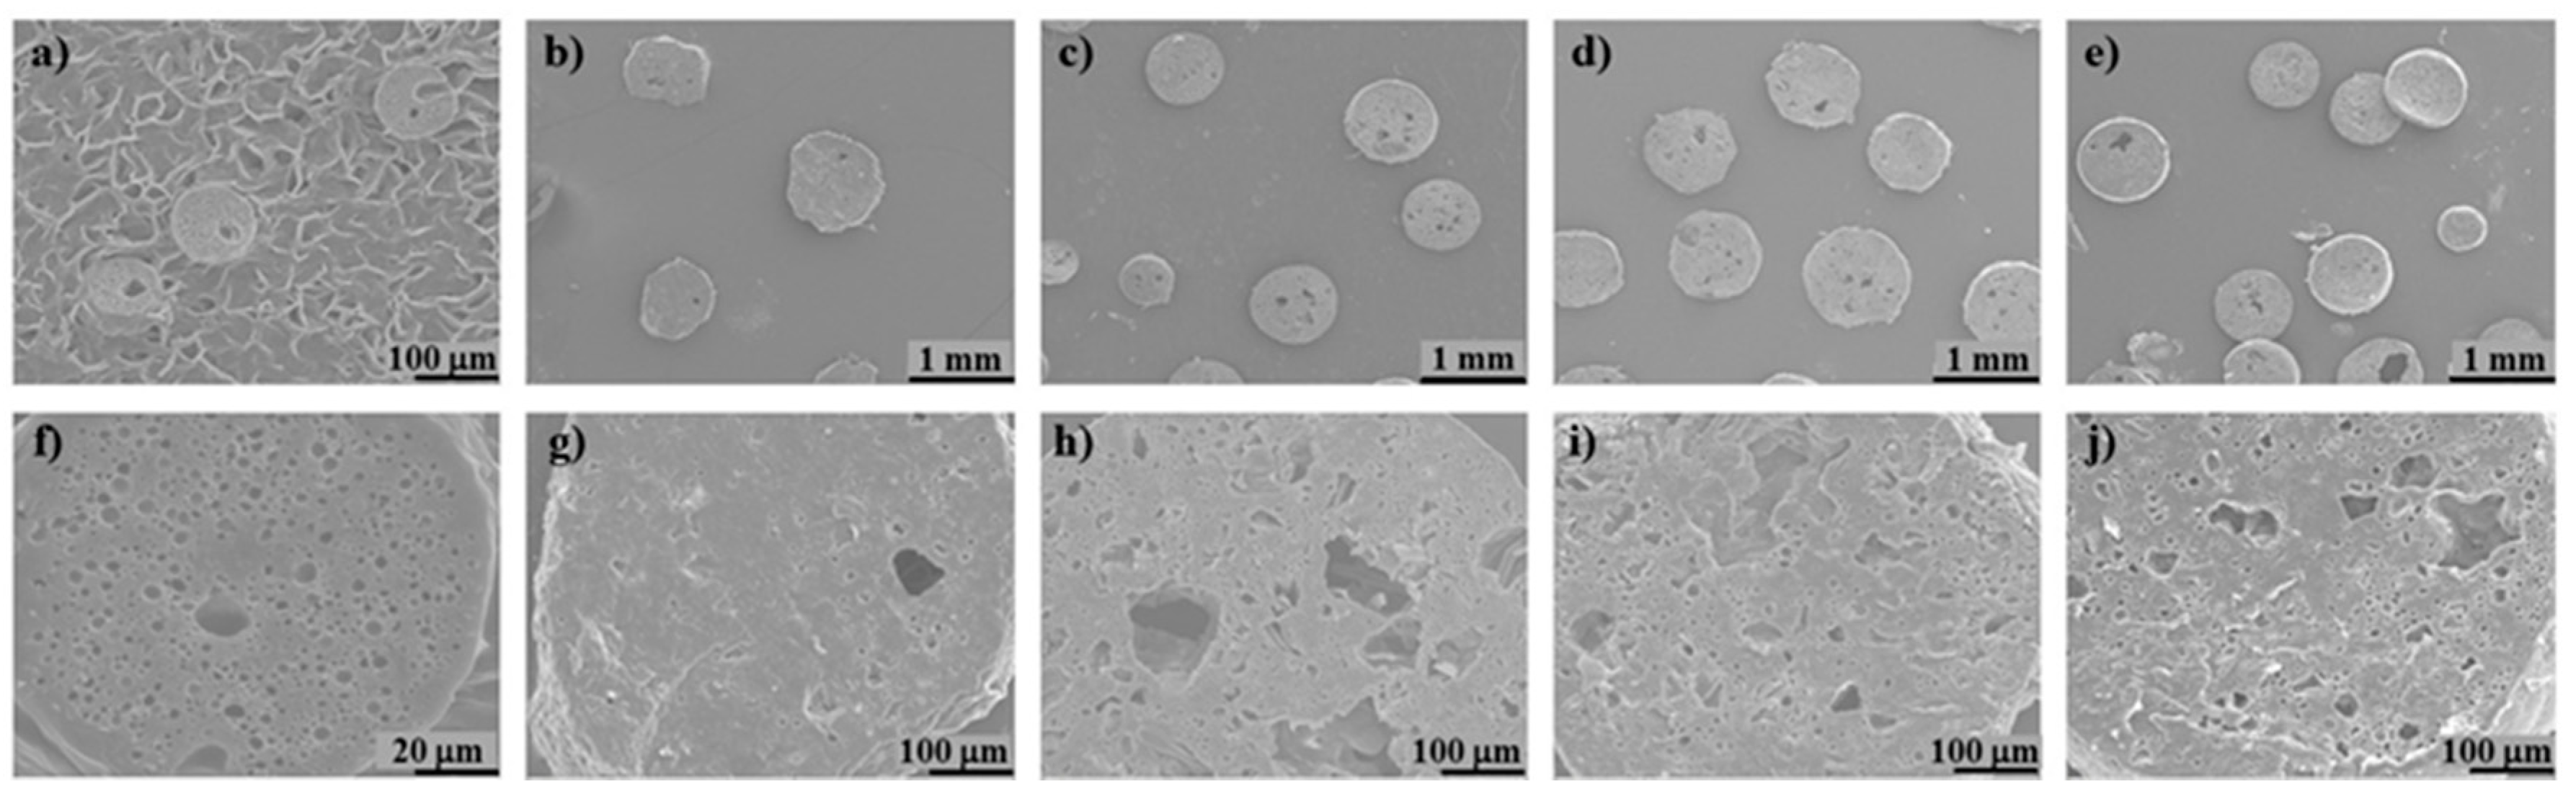
3.2. Physical Characterization of PLA/Cellulose Spheres
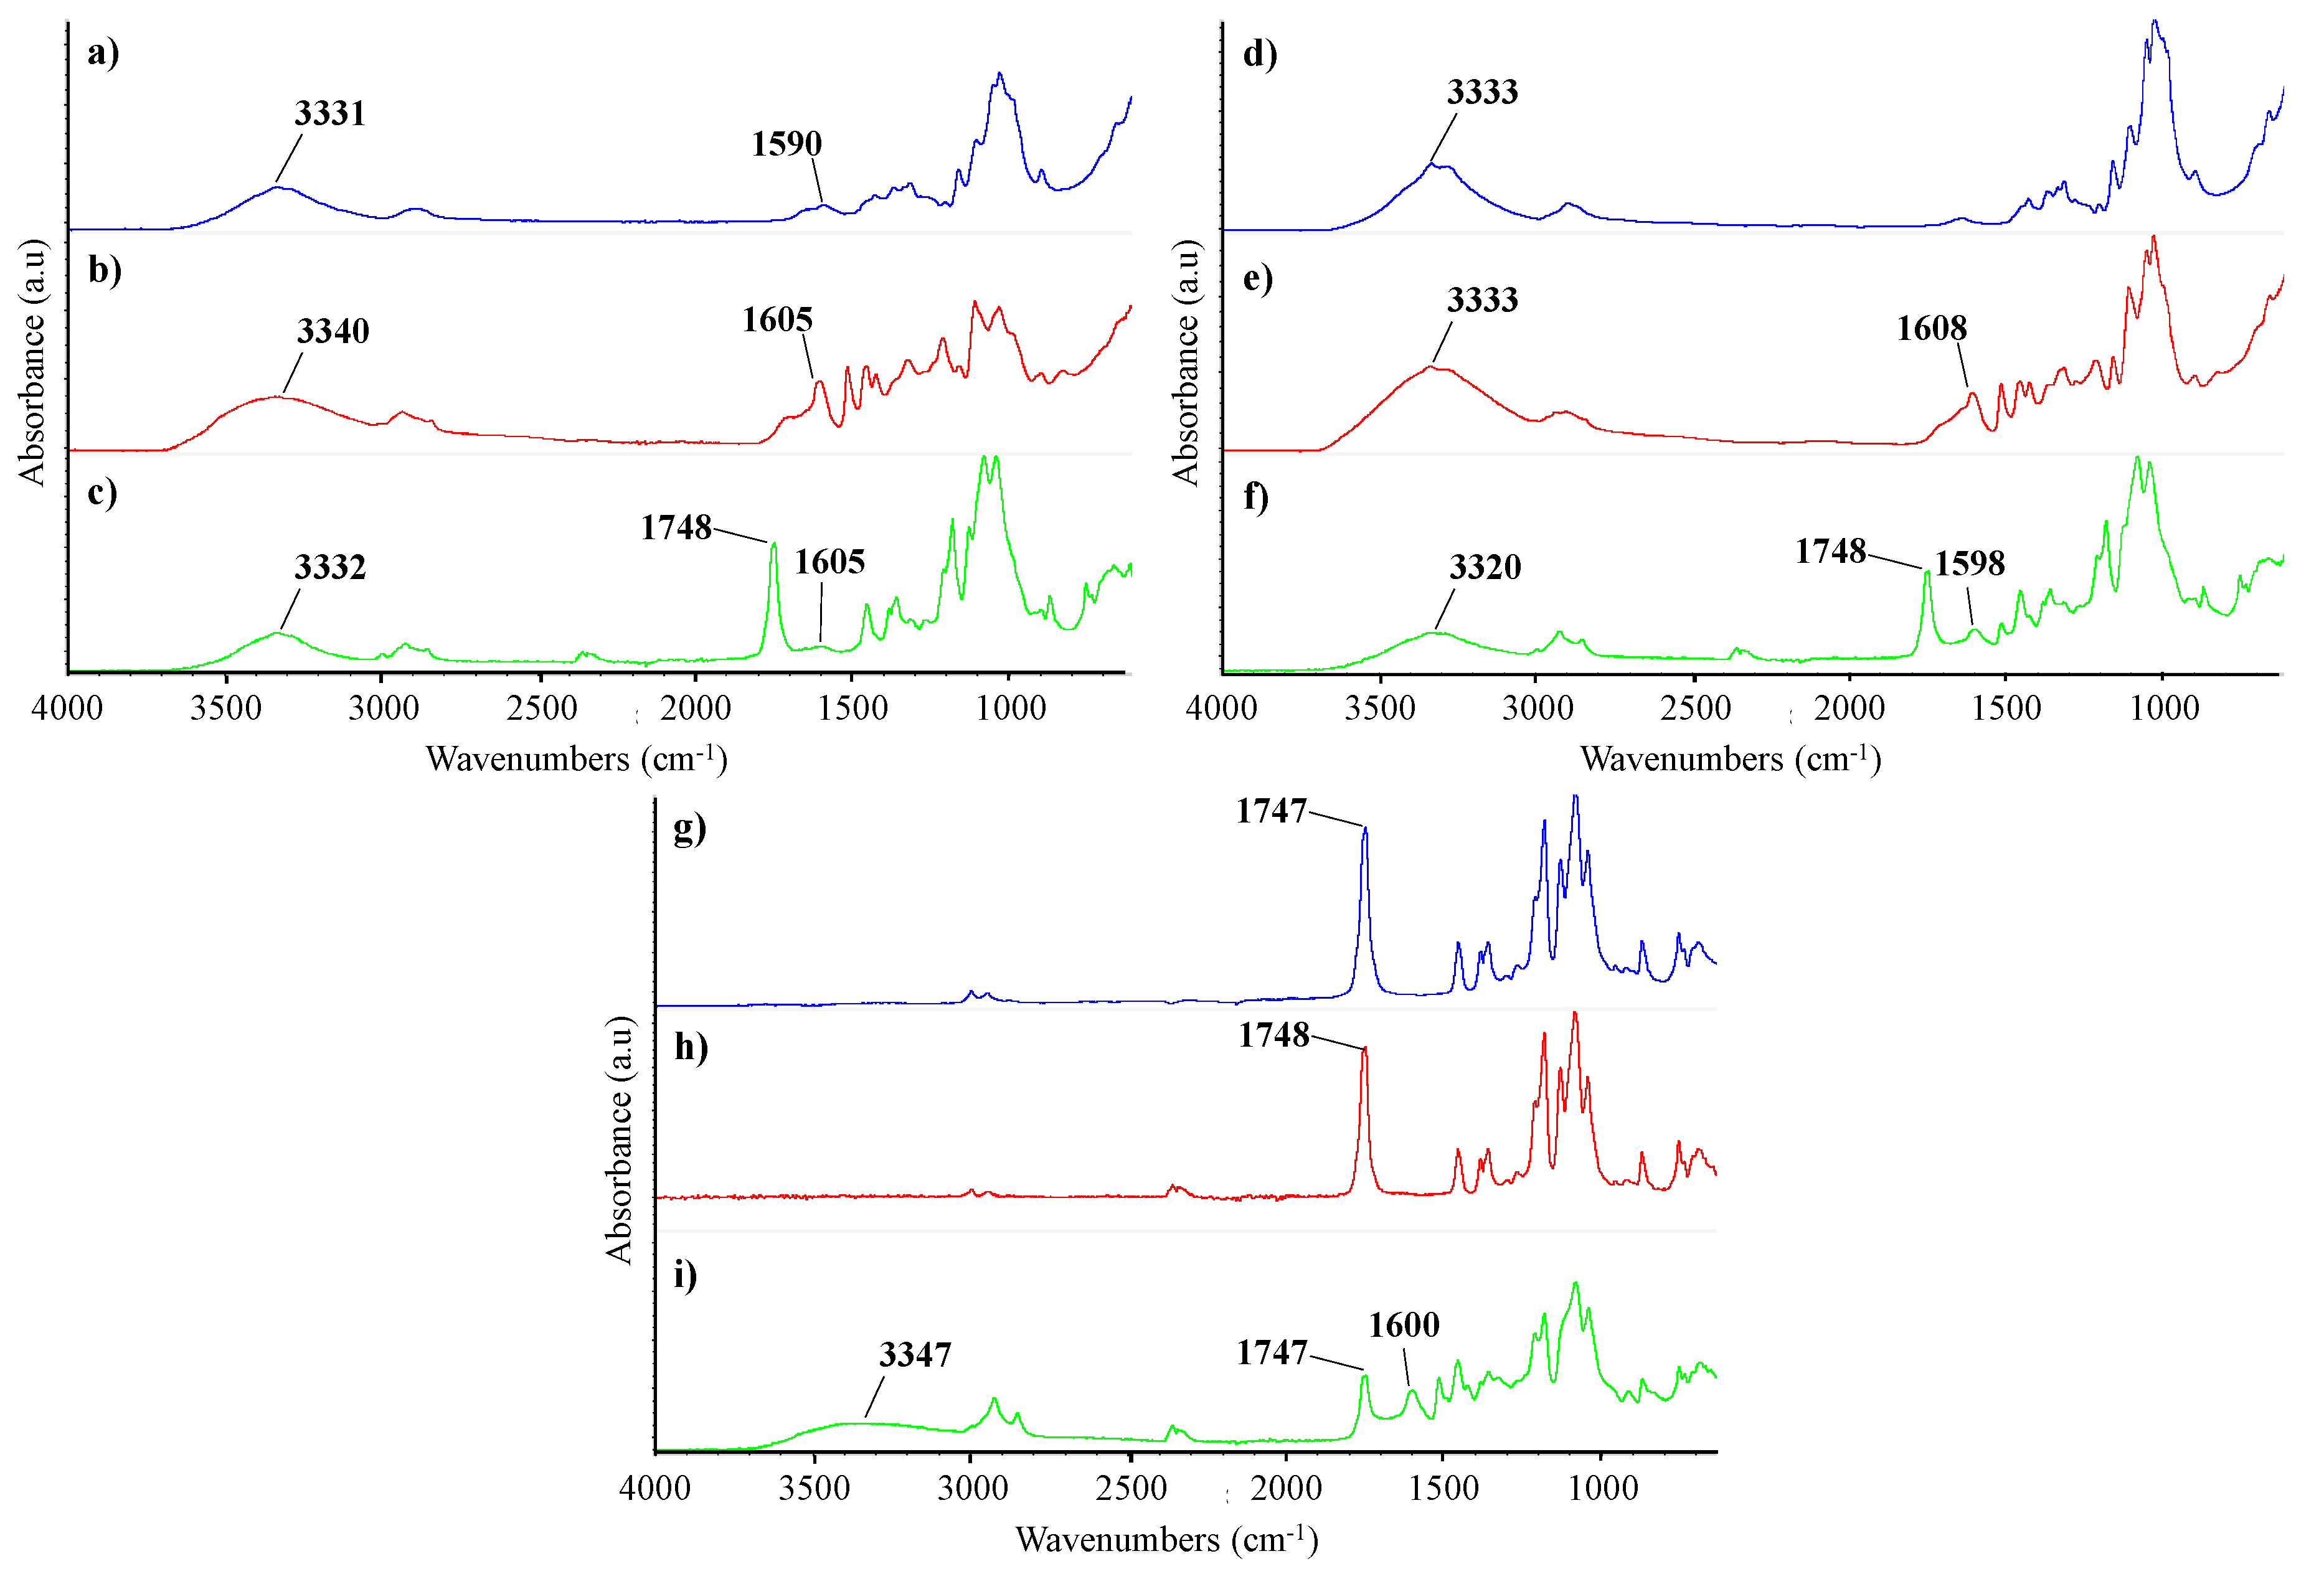
3.3. Chemical Characterization of PLA/Cellulose Spheres
3.4. Characterization of the Biocomposite Films
4. Conclusions
Author Contributions
Funding
Conflicts of Interest
References
- Mitra, B.C. Environment friendly composite materials: Biocomposites and green composites. Def. Sci. J. 2014, 64, 244–261. [Google Scholar] [CrossRef]
- Sahari, J.; Sapuan, S.M. Natural fibre reinforced biodegradable polymer composites. Rev. Adv. Mater. Sci. 2011, 30, 166–174. [Google Scholar]
- Loureiro, N.C.; Esteves, J.L.; Viana, J.C.; Ghosh, S. Development of polyhydroxyalkanoates/poly(lactic acid) composites reinforced with cellulosic fibers. Compos. Part B Eng. 2014, 60, 603–611. [Google Scholar] [CrossRef]
- Ren, H.; Zhang, Y.; Zhai, H.; Chen, J. Production and evaluation of biodegradable composites based on polyhydroxybutyrate and polylactic acid reinforced with short and long pulp fibers. Cellul. Chem. Technol. 2015, 49, 641–652. [Google Scholar]
- Avérous, L. Polylactic Acid: Synthesis, Properties and Applications. In Monomers, Polymers and Composites from Renewable Resources; Belgacem, M.N., Gandini, A., Eds.; Elsevier Ltd.: New York, NY, USA, 2008; pp. 433–451. ISBN 978-0-08-045316-3. [Google Scholar]
- Khalil, H.A.; Bath, A.; Yusra, A. Green composites from sustainable cellulose nanofibrils: A review. Carbohydr. Polym. 2012, 87, 963–979. [Google Scholar] [CrossRef]
- Murariu, M.; Dubois, P. PLA composites: From production to properties. Adv. Drug Deliv. Rev. 2016, 107, 17–46. [Google Scholar] [CrossRef] [PubMed]
- Nakagaito, A.N.; Fujimura, A.; Sakai, T.; Hama, Y.; Yano, H. Production of microfibrillated cellulose (MFC)-reinforced polylactic acid (PLA) nanocomposites from sheets obtained by a papermaking-like process. Compos. Sci. Technol. 2009, 69, 1293–1297. [Google Scholar] [CrossRef]
- Mathew, A.P.; Oksman, K.; Sain, M. Mechanical properties of biodegradable composites from poly lactic acid (PLA) and microcrystalline cellulose (MCC). J. Appl. Polym. Sci. 2005, 97, 2014–2025. [Google Scholar] [CrossRef]
- Cho, D.; Seo, J.M.; Lee, H.S.; Cho, C.W.; Han, S.O.; Park, W.H. Property improvement of natural fiber-reinforced green composites by water treatment. Adv. Compos. Mater. 2007, 16, 299–314. [Google Scholar] [CrossRef]
- Le Duigou, A.; Bourmaud, A.; Balnois, E.; Davies, P.; Baley, C. Improving the interfacial properties between flax fibres and PLLA by a water fibre treatment and drying cycle. Ind. Crops Prod. 2012, 39, 31–39. [Google Scholar] [CrossRef]
- Graupner, N. Application of lignin as natural adhesion promoter in cotton fibre-reinforced poly(lactic acid) (PLA) composites. J. Mater. Sci. 2008, 43, 5222–5229. [Google Scholar] [CrossRef]
- Le Moigne, N.; Longerey, M.; Taulemesse, J.M.; Bénézet, J.C.; Bergeret, A. Study of the interface in natural fibres reinforced poly(lactic acid) biocomposites modified by optimized organosilane treatments. Ind. Crops Prod. 2014, 52, 481–494. [Google Scholar] [CrossRef]
- Raj, G.; Balnois, E.; Baley, C.; Grohens, Y. Role of polysaccharides on mechanical and adhesion properties of flax fibres in flax/PLA biocomposite. Int. J. Polym. Sci. 2011, 2011, 1–11. [Google Scholar] [CrossRef]
- Tokoro, R.; Vu, D.M.; Okubo, K.; Tanaka, T.; Fujii, T.; Fujiura, T. How to improve mechanical properties of polylactic acid with bamboo fibers. J. Mater. Sci. 2008, 43, 775–787. [Google Scholar] [CrossRef]
- Magniez, K.; Voda, A.S.; Kafi, A.A.; Fichini, A.; Guo, Q.; Fox, B.L. Overcoming interfacial affinity issues in natural fiber reinforced polylactide biocomposites by surface adsorption of amphiphilic block copolymers. ACS Appl. Mater. Interfaces 2013, 5, 276–283. [Google Scholar] [CrossRef] [PubMed]
- Awal, A.; Rana, M.; Sain, M. Thermorheological and mechanical properties of cellulose reinforced PLA bio-composites. Mech. Mater. 2015, 80, 87–95. [Google Scholar] [CrossRef]
- Hua, S.; Chen, F.; Liu, Z.; Yang, W.; Yang, M. Preparation of cellulose-graft-polylactic acid via melt copolycondensation for use in polylactic acid based composites: Synthesis, characterization and properties. RSC Adv. 2016, 6, 1973–1983. [Google Scholar] [CrossRef]
- Xian, X.; Wang, X.; Zhu, Y.; Guo, Y.; Tian, Y. Effects of MCC content on the structure and performance of PLA/MCC biocomposites. J. Polym. Environ. 2018, 26, 1–9. [Google Scholar] [CrossRef]
- Larsson, K.; Berglund, L.A.; Ankerfors, M.; Lindström, T. Polylactide latex/nanofibrillated cellulose bionanocomposites of high nanofibrillated cellulose content and nanopaper network structure prepared by a papermaking route. J. Appl. Polym. Sci. 2012, 125, 2460–2466. [Google Scholar] [CrossRef]
- Song, Z.; Xiao, H.; Zhao, Y. Hydrophobic-modified nano-cellulose fiber/PLA biodegradable composites for lowering water vapor transmission rate (WVTR) of paper. Carbohydr. Polym. 2014, 111, 442–448. [Google Scholar] [CrossRef]
- Wang, T.; Drzal, L.T. Cellulose-nano fiber-reinforced poly(lactic acid) composites prepared by a water-based approach. ACS Appl. Mater. Interfaces 2012, 4, 5079–5085. [Google Scholar] [CrossRef] [PubMed]
- Iwatake, A.; Nogi, M.; Yano, H. Cellulose nanofiber-reinforced polylactic acid. Compos. Sci. Technol. 2008, 68, 2103–2106. [Google Scholar] [CrossRef]
- Yu, H.Y.; Zhang, H.; Song, M.L.; Zhou, Y.; Yao, J.; Ni, Q.Q. From cellulose nanospheres, nanorods to nanofibers: Various aspect ratio induced nucleation/reinforcing effects on polylactic acid for robust-barrier food packaging. ACS Appl. Mater. Interfaces 2017, 9, 43920–43938. [Google Scholar] [CrossRef] [PubMed]
- Hossain, K.M.Z.; Ahmed, I.; Parsons, A.J.; Scotchford, C.A.; Walker, G.S.; Thielemans, W.; Rudd, C.D. Physico-chemical and mechanical properties of nanocomposites prepared using cellulose nanowhiskers and poly(lactic acid). J. Mater. Sci. 2012, 47, 2675–2686. [Google Scholar] [CrossRef]
- Lee, K.Y.; Blaker, J.J.; Bismarck, A. Surface functionalisation of bacterial cellulose as the route to produce green polylactide nanocomposites with improved properties. Compos. Sci. Technol. 2009, 69, 2724–2733. [Google Scholar] [CrossRef]
- Immonen, K.; Lahtinen, P.; Pere, J. Effects of Surfactants on the Preparation of Nanocellulose-PLA Composites. Bioengineering 2017, 4, 91. [Google Scholar] [CrossRef]
- Ghasemi, S.; Behrooz, R.; Ghasemi, I.; Yassar, R.S.; Long, F. Development of nanocellulose-reinforced PLA nanocomposite by using maleated PLA (PLA-g-MA). J. Thermoplast. Compos. Mater. 2018, 31, 1090–1101. [Google Scholar] [CrossRef]
- Graupner, N.; Albrecht, K.; Hegemann, D.; Müssig, J. Plasma modification of man-made cellulose fibers (Lyocell) for improved fiber/matrix adhesion in poly(lactic acid) composites. J. Appl. Polym. Sci. 2013, 128, 4378–4386. [Google Scholar] [CrossRef]
- Gu, J.; Catchmark, J.M. Polylactic acid composites incorporating casein functionalized cellulose nanowhiskers. J. Biol. Eng. 2013, 7, 31. [Google Scholar] [CrossRef]
- Frone, A.N.; Berlioz, S.; Chailan, J.-F.; Panaitescu, D.M.; Donescu, D. Cellulose fiber-reinforced polylactic acid. Polym. Compos. 2011, 32, 976–985. [Google Scholar] [CrossRef]
- Graupner, N.; Fischer, H.; Ziegmann, G.; Müssig, J. Improvement and analysis of fibre/matrix adhesion of regenerated cellulose fibre reinforced PP-, MAPP- and PLA-composites by the use of Eucalyptus globulus lignin. Compos. Part B Eng. 2014, 66, 117–125. [Google Scholar] [CrossRef]
- Wang, X.; Jia, Y.; Liu, Z.; Miao, J. Influence of the lignin content on the properties of poly(lactic acid)/lignin-containing cellulose nanofibrils composite films. Polymers (Basel) 2018, 10, 1013. [Google Scholar] [CrossRef]
- Nair, S.S.; Chen, H.; Peng, Y.; Huang, Y.; Yan, N. Polylactic acid biocomposites reinforced with nanocellulose fibrils with high lignin content for improved mechanical, thermal, and barrier properties. ACS Sustain. Chem. Eng. 2018, 6, 10058–10068. [Google Scholar] [CrossRef]
- Oksman, K.; Aitomäki, Y.; Mathew, A.P.; Siqueira, G.; Zhou, Q.; Butylina, S.; Tanpichai, S.; Zhou, X.; Hooshmand, S. Review of the recent developments in cellulose nanocomposite processing. Compos. Part A Appl. Sci. Manuf. 2016, 83, 2–18. [Google Scholar] [CrossRef]
- Samir, M.A.S.A.; Alloin, F.; Dufresne, A. Review of recent research into cellulosic whiskers, their properties and their application in nanocomposite field. Biomacromolecules 2005, 6, 612–626. [Google Scholar] [CrossRef]
- Mesic, N.; Friman, A. Process for Manufacturing a Composition Comprising Cellulose Pulp Fibers and Thermoplastic Fibers. U.S. Patent 9,297,112, 29 March 2013. [Google Scholar]
- Freitas, S.; Merkle, H.P.; Gander, B. Microencapsulation by solvent extraction/evaporation: Reviewing the state of the art of microsphere preparation process technology. J. Controll. Release 2005, 102, 313–332. [Google Scholar] [CrossRef]
- Hong, Y.; Gao, C.; Shi, Y.; Shen, J. Preparation of porous polylactide microspheres by emulsion-solvent evaporation based on solution induced phase separation. Polym. Adv. Technol. 2005, 16, 622–627. [Google Scholar] [CrossRef]
- Lee, I.; Ji, S. Device and Method for Encapsulation of Hydrophilic Materials. U.S. Patent 9308172, 12 April 2016. [Google Scholar]
- Guay, D.; Sutherland, N.; Rantanen, W.; Malandri, N.; Stephens, A.; Mattingly, K.; Schneider, M. Comparison of fiber length analyzers. In Proceedings of the 2005 TAPPI Practical Papermaking Conference, Milwaukee, WI, USA, 22–26 May 2005; Tappi Press: Atlanta, GA, USA, 2005. [Google Scholar]
- Jiang, X.; Zhou, C.; Tang, K. Preparation of PLA and PLGA nanoparticles by binary organic solvent diffusion method. J. Cent. South. Univ. Technol. 2003, 10, 202–206. [Google Scholar] [CrossRef]
- Sullivan, E.M.; Moon, R.J.; Kalaitzidou, K. Processing and characterization of cellulose nanocrystals/polylactic acid nanocomposite films. Materials 2015, 8, 8106–8116. [Google Scholar] [CrossRef]
- Kajanto, I. Structural mechanisms of paper and board. In Papermaking Science and Technology—Paper Physics; Niskanen, K., Ed.; Fapet Oy in cooperation with the Paper Engineers’ Association and TAPPI: Helsinki, Finland, 1998; pp. 192–221, ISBN 10: 9525216160, ISBN 13: 9789525216165. [Google Scholar]
- Maa, Y.F.; Hsu, C.C. Effect of primary emulsions on microsphere size and protein-loading in the double emulsion process. J. Microencapsul. 1997, 14, 225–241. [Google Scholar] [CrossRef]
- Al-Azzam, W.; Pastrana, E.A.; Griebenow, K. Co-lyophilization of bovine serum albumin (BSA) with poly(ethylene glycol) improves efficiency of BSA encapsulation and stability in polyester microspheres by a solid-in-oil-in-oil technique. Biotechnol. Lett. 2002, 24, 1367–1374. [Google Scholar] [CrossRef]
- Ludueña, L.N.; Vecchio, A.; Stefani, P.M.; Alvarez, V.A. Extraction of cellulose nanowhiskers from natural fibers and agricultural byproducts. Fibers Polym. 2013, 14, 1118–1127. [Google Scholar] [CrossRef]
- Pandey, K.K. A study of chemical structure of soft and harwood and wood polymers by FTIR spectrscopy. J. Appl. Polym. Sci. 1999, 71, 1969–1975. [Google Scholar] [CrossRef]
- Kister, G.; Cassanas, G.; Vert, M. Effects of morphology, conformation and configuration on the IR and Raman spectra of various poly(lactic acid)s. Polymer 1998, 39, 267–273. [Google Scholar] [CrossRef]
- Gordobil, O.; Delucis, R.; Egüés, I.; Labidi, J. Kraft lignin as filler in PLA to improve ductility and thermal properties. Ind. Crops Prod. 2015, 72, 46–53. [Google Scholar] [CrossRef]
- Darie-Niţə, R.N.; Vasile, C.; Irimia, A.; Lipşa, R.; Râpa, M. Evaluation of some eco-friendly plasticizers for PLA films processing. J. Appl. Polym. Sci. 2016, 133, 1–11. [Google Scholar] [CrossRef]
- Maximova, N.; Österberg, M.; Koljonen, K.; Stenius, P. Lignin adsorption on cellulose fibre surfaces: Effect on surface chemistry, surface morphology and paper strength. Cellulose 2001, 8, 113–125. [Google Scholar] [CrossRef]
- Mathew, A.P.; Oksman, K.; Sain, M. The Effect of morphology and chemical characteristics of cellulose reinforcements on the crystallinity of polylactic acid. J. Appl. Polym. Sci. 2006, 101, 300–310. [Google Scholar] [CrossRef]
- Frone, A.N.; Berlioz, S.; Chailan, J.F.; Panaitescu, D.M. Morphology and thermal properties of PLA-cellulose nanofibers composites. Carbohydr. Polym. 2013, 91, 377–384. [Google Scholar] [CrossRef]
- Watkins, D.; Nuruddin, M.; Hosur, M.; Tcherbi-Narteh, A.; Jeelani, S. Extraction and characterization of lignin from different biomass resources. J. Mater. Res. Technol. 2015, 4, 26–32. [Google Scholar] [CrossRef]
- Li, J.; He, Y.; Inoue, Y. Thermal and mechanical properties of bodegradable blends of poly(L-lactic acid) and lignin. Polym. Int. 2003, 52, 949–955. [Google Scholar] [CrossRef]
- Haafiz, M.K.M.; Hassan, A.; Zakaria, Z.; Inuwa, I.M.; Islam, M.S.; Jawaid, M. Properties of polylactic acid composites reinforced with oil palm biomass microcrystalline cellulose. Carbohydr. Polym. 2013, 98, 139–145. [Google Scholar] [CrossRef] [PubMed]
- Abdulkhani, A.; Hosseinzadeh, J.; Dadashi, S.; Mousavi, M. A study of morphological, thermal, mechanical and barrier properties of PLA based biocomposites prepared with micro and nano sized cellulosic fibers. Cellul. Chem. Technol. 2015, 49, 7–8. [Google Scholar]


| Sample | PVA/PLA Ratio | Spheres Yield (%) |
|---|---|---|
| PLA | 0.13 | 36.4 ± 4.1 |
| PLA | 0.28 | 85.9 ± 2.2 |
| PLA * | 0.35 | 93.2 ± 0.9 |
| PLA/UP * | 0.13 | 79.9 ± 1.2 |
| PLA/UP | 0.20 | 75.8 ± 1.2 |
| PLA/GUP * | 0.13 | 82.8 ± 3.1 |
| PLA/GUP | 0.20 | 76.3 ± 2.1 |
| PLA/GUP-L25 | 0.28 | 79.6 ± 0.4 |
| PLA/GUP-L61 | 0.13 | 7.5 ± 7.3 |
| PLA/GUP-L61 | 0.20 | 0 ± 0 |
| PLA/GUP-L61 * | 0.28 | 87.2 ± 1.8 |
| PLA/MCC | 0.13 | 4.0 ± 1.5 |
| PLA/MCC | 0.20 | 4.5 ± 6.4 |
| PLA/MCC * | 0.28 | 74.0 ± 0.3 |
| PLA/MCC-L61 * | 0.13 | 84.3 ± 4.3 |
| Sample | Density (g/cm3) | Laser Diffraction | BET | ||
|---|---|---|---|---|---|
| Average Spheres Size (µm) | External Surface Area (cm2/g) | Global Surface Area (cm2/g) | |||
| Weighted by Volume | Weighted by Number | ||||
| PLA | 0.78 ± 0.03 | 126.2 ± 1.5 | 46.0 ± 1.9 | 525.0 ± 21.2 | not measured |
| PLA/UP | 0.91 ± 0.03 | 796.5 ± 1.3 | 633.4 ± 1.3 | 78.3 ± 0.4 | 10,600 |
| PLA/GUP | 0.69 ± 0.01 | 611.1 ± 1.4 | 447.2 ± 1.3 | 104.5 ± 0.7 | 11,400 |
| PLA/GUP-L61 | 0.77 ± 0.01 | 888.0 ± 1.4 | 648.4 ± 1.4 | 71.1 ± 0.2 | 9300 |
| PLA/MCC | 0.78 ± 0.00 | 130.9 ± 1.6 | 10.9 ± 1.6 | 579. 7 ± 11.3 | 5700 |
| PLA/MCC-L61 | 0.83 ± 0.02 | 641.7 ± 1.4 | 305.5 ± 1.9 | 101.0 ± 4.5 | 7400 |
| Sample | PLA (%) | Cellulose (%) | Lignin (%) |
|---|---|---|---|
| PLA/UP | 92.8 | 7.2 | ≈ 0 |
| PLA/GUP | 92.2 | 7.8 | ≈ 0 |
| PLA/GUP-L25 | 89.1 | 8.8 | 2.0 |
| PLA/GUP-L61 | 82.7 | 7.2 | 10.1 |
| PLA/MCC | 95.0 | 5.0 | 0 |
| PLA/MCC-L61 | 88.1 | 1.0 | 10.9 |
| Sample | Tg (°C) | Tcc (°C) | ΔHcc (J/g) | Tm (°C) | ΔHm (J/g) | Xc (%) | Td (°C) | Solid Residue (%) |
|---|---|---|---|---|---|---|---|---|
| PLA | 62.1 | 96.1 | 32.72 | 177.7 | 60.04 | 29.2 | 368.2 | 1.2 |
| PLA/UP | 60.0 | 90.7 | 7.09 | 175.2 | 54.49 | 54.6 | 359.4 | 2.0 |
| PLA/GUP | 58.6 | 92.7 | 26.58 | 174.8 | 51.54 | 28.9 | 365.7 | 1.2 |
| PLA/GUP-L61 | 58.7 | 108.9 | 37.04 | 174.3 | 45.13 | 10.5 | 358.9 | 10.0 |
| PLA/MCC | 61.3 | 93.8 | 29.00 | 176.7 | 55.09 | 29.3 | 368.3 | 1.0 |
| PLA/MCC-L61 | 62.1 | 100.8 | 34.07 | 175.9 | 53.88 | 24.0 | 357.1 | 5.4 |
| Sample | Basis Weight (g/m2) | Thickness (µm) | Apparent Density (g/cm3) |
|---|---|---|---|
| PLA | 153.4 ± 8.2 | 127.8 ± 10.2 | 1.205 ± 0.087 |
| PLA/UP | 163.3 ± 13.3 | 134.0 ± 12.4 | 1.220 ± 0.039 |
| PLA/GUP | 152.8 ± 10.5 | 125.7 ± 11.0 | 1.218 ± 0.037 |
| PLA/GUP-L61 | 153.5 ± 7.9 | 126.3 ± 11.1 | 1.223 ± 0.122 |
| PLA/MCC | 161.9 ± 8.0 | 132.7 ± 11.6 | 1.224 ± 0.054 |
| PLA/MCC-L61 | 154.4 ± 2.8 | 127.0 ± 4.4 | 1.217 ± 0.020 |
| Sample | Tensile Strength (MPa) | Elongation at Break (%) | Young’s Modulus (GPa) | Toughness (kJ/m3) | Bending Elastic Modulus (MPa) |
|---|---|---|---|---|---|
| PLA | 35.1 ± 5.0 | 2.7 ± 0.4 | 1.82 ± 0.27 | 520 ± 78 | 4.45 ± 0.46 |
| PLA/UP | 23.4 ± 3.6 | 1.5 ± 0.2 | 1.65 ± 0.26 | 211 ± 49 | 4.15 ± 1.01 |
| PLA/GUP | 30.6 ± 6.8 | 2.2 ± 0.3 | 1.66 ± 0.16 | 383 ± 149 | 3.83 ± 0.63 |
| PLA/GUP-L61 | 35.6 ± 6.1 | 2.3 ± 0.4 | 1.66 ± 0.09 | 408 ± 125 | 4.34 ± 1.13 |
| PLA/MCC | 43.0 ± 3.4 | 3.6 ± 0.7 | 1.53 ± 0.18 | 937 ± 267 | 4.07 ± 0.79 |
| PLA/MCC-L61 | 44.9 ± 2.4 | 3.8 ± 0.3 | 1.55 ± 0.09 | 970 ± 129 | 4.36 ± 0.42 |
© 2019 by the authors. Licensee MDPI, Basel, Switzerland. This article is an open access article distributed under the terms and conditions of the Creative Commons Attribution (CC BY) license (http://creativecommons.org/licenses/by/4.0/).
Share and Cite
Sousa, S.; Costa, A.; Silva, A.; Simões, R. Poly(lactic acid)/Cellulose Films Produced from Composite Spheres Prepared by Emulsion-Solvent Evaporation Method. Polymers 2019, 11, 66. https://doi.org/10.3390/polym11010066
Sousa S, Costa A, Silva A, Simões R. Poly(lactic acid)/Cellulose Films Produced from Composite Spheres Prepared by Emulsion-Solvent Evaporation Method. Polymers. 2019; 11(1):66. https://doi.org/10.3390/polym11010066
Chicago/Turabian StyleSousa, Sónia, Ana Costa, Abílio Silva, and Rogério Simões. 2019. "Poly(lactic acid)/Cellulose Films Produced from Composite Spheres Prepared by Emulsion-Solvent Evaporation Method" Polymers 11, no. 1: 66. https://doi.org/10.3390/polym11010066
APA StyleSousa, S., Costa, A., Silva, A., & Simões, R. (2019). Poly(lactic acid)/Cellulose Films Produced from Composite Spheres Prepared by Emulsion-Solvent Evaporation Method. Polymers, 11(1), 66. https://doi.org/10.3390/polym11010066