Article

A Comparative Study on the Characterization of Nanofibers with Cellulose I, I/II, and II Polymorphs from Wood

College of Materials Science and Engineering, Nanjing Forestry University, Nanjing 210037, China
*
Authors to whom correspondence should be addressed.
Polymers 2019, 11(1), 153; https://doi.org/10.3390/polym11010153
Submission received: 19 November 2018 / Revised: 8 January 2019 / Accepted: 14 January 2019 / Published: 17 January 2019

Abstract

:
Polymorphic changes in cellulose nanofibers (CNFs) are closely related to their properties and applications, and it is of interest to investigate how polymorphic changes influence their properties. A comparative study on the properties of CNFs with cellulose I, I/II, and II polymorphs from wood was conducted herein. CNFs were obtained by chemical extraction combined with a simple and efficient mechanical treatment (one pass through a grinder). This process resulted in a relatively high yield of 80–85% after a simple grinding treatment. The polymorphic changes in the CNFs and the chemical composition, morphology, tensile performances, and thermal properties were systematically characterized and compared. The X-ray diffraction and FTIR analyses verified the existence of three types of purified pulps and CNFs with cellulose I, cellulose I/II, and cellulose II polymorphs (CNF-I, CNF-I/II, CNF-II). Morphological observations presented that these three types of CNFs all exhibited high aspect ratios and entangled structures. Tensile testing showed that the CNF films all exhibited high tensile strengths, and the fracture strains of the CNF-I/II (11.8%) and CNF-II (13.0%) films were noticeably increased compared to those of the CNF-I film (6.0%). If CNF-II is used as reinforcing material, its larger fracture strain can improve the mechanical performance of the CNF composites, such as fracture toughness and impact strength. In addition, CNF-I, CNF-I/II, and CNF-II films showed very low thermal expansion in the range 20–150 °C, with the coefficient of thermal expansion values of 9.4, 17.1, and 17.3 ppm/K, respectively. Thermogravimetric analysis (TGA) revealed that the degradation temperature of CNF-I and CNF-II was greater than that of CNF-I/II, which was likely due to increased α-cellulose content. This comparative study of the characterization of CNF-I, CNF-I/II, and CNF-II provides a theoretical basis for the application of CNFs with different polymorphs and could broaden the applications of CNFs.

Graphical Abstract

1. Introduction

Cellulose, a linear chain of ringed glucose molecules, is the most abundant natural biopolymeric material on earth [1]. Based on the different orientation of cellulose chains and hydrogen-bond networks, several polymorphs of crystalline cellulose (I, II, III, and IV) have been identified [2,3]. Cellulose I is referred to as native cellulose, which has two forms, including Iα and Iβ [2]. Cellulose II is usually prepared from cellulose I through mercerization (alkali treatment) or regeneration (solubilization and recrystallization) [4]. During the mercerization process, the polymorphic transformation from cellulose I (parallel-chain structure) to cellulose II (antiparallel-chain structure) occurs via sodium hydroxide treatment [5]. Due to the different supermolecular structures of cellulose I and cellulose II, the mechanical, chemical, and thermal properties of these two types of fibers change significantly [6]. Interest in cellulose II fibers has increased owing to their excellent properties, and the application of cellulose in the chemicals industry has been further expanded [7]. Moreover, it was said that cellulose II is a better feedstock than cellulose I in biofuel production [8].
The development of nanostructured celluloses, or nanocellulose, has drawn significant interest in recent years due to its rich sources, nanoscale dimensions, high strength, light weight, renewability, and assembly performance [7,9]. There are several methods for preparing nanocellulose, including acid hydrolysis, enzymatic hydrolysis, mechanical treatment, and so on [1,10]; among these methods, mechanical treatment includes ultrasonication, high-pressure homogenization, grinding, and cryocrushing [11]. Nanocellulose is generally divided into two groups [12]: (a) cellulose nanofibers (CNFs), which are mainly obtained by mechanical fibrillation; and (b) cellulose nanocrystals (CNCs), which are mainly produced by acid treatment. CNFs consist of nanofibrils with long lengths and high aspect ratios, while CNCs consist of nanofibrils with relatively short lengths and low aspect ratios [2]. In some studies, fibrillated CNFs or CNCs with cellulose I polymorph have been treated with strong sodium hydroxide, and it was found that CNFs [13] or CNCs [3] are easily aggregated during mercerization when converting to cellulose II polymorph, and they cannot be effectively re-dispersed. CNCs with cellulose II polymorph (CNC-II) have been obtained by treating mercerized fibers using sulfuric acid hydrolysis and then high-pressure homogenization [14]. Gong et al. carried out a comparative study on the isolation and characterization of CNCs with different polymorphs [15]. Abe et al. [16] obtained CNFs with cellulose I polymorph (CNF-I) from wood using a very simple mechanical grinding treatment. However, the extraction of CNFs with cellulose II polymorph (CNF-II) is complex and requires great energy consumption [17,18], which limits their application.
Most published studies have focused on the investigation of CNFs with cellulose I polymorph. For a more comprehensive understanding and application of fibrillated CNFs, it is necessary to study the properties of CNFs with different polymorphs. In our previous study, we reported an efficient method for extracting CNFs with cellulose II polymorph by chemical extraction combined with a simple mechanical grinding treatment. We found that the delignification plays an important role in the polymorphic transformation from cellulose I to cellulose II during mercerization and in the subsequent fibrillation of CNF-II [19]. We have described the preparation method of individual nanofibers with cellulose II polymorph, but the properties of these cellulose II nanofibers are not known. It is of interest to investigate how polymorphic changes influence their properties. Few investigations have dealt with a comparative study on the characterization of CNFs with different polymorphs.
In this study, three types of CNFs with cellulose I, I/II, and II polymorphs were prepared using a powerful yet simple method based on our previous work. The main purpose of this study was to compare the properties of CNFs with different polymorphs. This comparative characterization would help to elucidate the chemical, physical, and morphological evolution of the properties of these three types of CNFs as they undergo fibrillation to nanofibers, and will help to broaden the potential applications of CNFs. We systematically studied these three types of CNFs, including a comparison of their chemical compositions, crystal structures, morphology, tensile performances, thermal properties, and optical properties.

2. Materials and Methods

2.1. Materials and Reagents

Wood powder from Pinus sylvestris var. mongolica Litv. was used and was ground into 80 meshes. The extracted wood powder was obtained using benzene and ethanol extraction, and was used as the raw material for all of the experiments. Benzene, ethanol, sodium chlorite (NaClO2, 80%), acetic acid, potassium hydroxide (KOH), and sodium hydroxide (NaOH) were of analytical grade and were used without further purification.

2.2. Preparation of Cellulose Nanofibers with Different Polymorphs

The isolation of purified pulps and CNFs with different polymorphs was performed as follows. The samples were divided into 3 groups and were prepared by a combination of chemical purification and mechanical treatment (one grinding treatment) according to the flowchart shown in Figure 1. During the whole process, the samples were filtered and rinsed with distilled water until the residues were neutral. In this study, the NaClO2/alkali/NaClO2-treated samples were designated as Sxyz, where x = 5, 1, or 2 (the number of acidified NaClO2 pretreatments), y = k = 6 wt % KOH treatment (or y = a = 17.5 wt % NaOH), and z = 1, 4, or 3 (the number of further NaClO2 treatments). Moreover, the samples that were further fibrillated by a single grinding treatment were designated as Nxyz. For instance, a sample receiving 5 NaClO2/KOH/1 NaClO2 treatments was designated as S5k1. Furthermore, sample S5k1, which was further fibrillated by a single grinding treatment, was designated as N5k1.
Group 1 (S5k1): Group 1 was used as a control group. The subsequent procedure followed a method described in previous studies [16]. In brief, under acidic conditions (pH 4–5), delignification was carried out with 1 wt % NaClO2 solution at 75 °C for 1 h, and the process was repeated 5 times. Then, the sample was treated overnight in 6 wt % KOH at room temperature, and then treated at 80 °C for 2 h to leach hemicelluloses. Finally, the sample was further treated with 1 wt % acidified NaClO2 solution at 75 °C for 1 h to obtain highly purified cellulose pulps.
Group 2 (S1a4): Initially, under acidic conditions (pH 4–5), a portion of lignin in the wood powders was leached by 1 wt % NaClO2 at 75 °C for 1 h. Then, the partially delignified wood powders were soaked in 17.5 wt % NaOH at 25 °C for 12 h. Finally, the residual lignin in the sample was further removed by 1 wt % acidified NaClO2 at 75 °C for 1 h, and this process was repeated 4 times.
Group 3 (S2a3): The preparation of S2a3 was conducted as follows, referring to our previous studies [19]. Briefly, a portion of lignin in the wood powders was first leached by 1 wt % acidified NaClO2 at 75 °C for 1 h, and the process was repeated 2 times. Then, the samples were soaked in 17.5 wt % NaOH at 25 °C for 12 h. Finally, the residual lignin in the sample was further removed by 1 wt % acidified NaClO2 at 75 °C for 1 h, and this process was repeated 3 times.
Finally, these three groups of purified pulps were treated by the same mechanical fibrillation method, and the steps were taken as follows: an aqueous suspension with 0.8 wt % undried purified pulps was prepared and passed once through a grinder (MKCA6-3; Masuko Sangyo Co., Saitama, Japan) at 1500 rpm to obtain the CNFs [16].

2.3. Preparation of CNF Films

The CNF suspensions were diluted to 0.2 wt % in distilled water to fabricate films. Filter membranes with pore sizes of 0.2 μm were used. After the suspension was slowly vacuum filtered and dewatered with a glass filter, a wet CNF sheet was obtained. The wet sheet was placed between two smooth wire meshes (inner layers), and then sandwiched between two filter papers (outer layers). Finally, the films were dried at 60 °C in an oven for 48 h, while a pressure of approximately 15 kPa was applied [9]. The dry CNF films were approximately 40 μm thick and 1.48 g/cm3 in density.

2.4. Characterization

2.4.1. Chemical Composition Measurement

The chemical composition including lignin content, α-cellulose content, and hemicelluloses content of the samples at different stages was determined using the methods of our previous study [18]. At least five specimens of each material were tested, and the average values were calculated.

2.4.2. X-ray Diffraction (XRD)

XRD measurement was carried out using a Rigaku X-ray diffractometer (SmartLab; Rigaku Corp., Tokyo, Japan) with CuKα radiation at 40 kV and 40 mA over the range of 2θ = 5–40° at a scan rate of 5°/min. The samples prepared for XRD were freeze-dried and then pressed into sheets.

2.4.3. Fourier Transform Infrared (FTIR) Spectroscopy

FTIR spectra of the samples were recorded on an FTIR instrument (Nicolet IS10, Thermo Scientific, Waltham, Massachusetts, USA) with an attenuated total reflectance (ATR) mode. Each sample was tested through an accumulation of 64 scans, with a resolution of 2 cm−1 at 700–4000 cm−1.

2.4.4. Field Emission Scanning Electron Microscopy (FE-SEM)

The obtained pulps were observed using a field emission scanning electron microscope (JSM-6700F; JEOL Ltd., Tokyo, Japan). In order to prevent structural collapse during the dehydration, all of the samples were solvent-exchanged and then freeze-dried.

2.4.5. Transmission Electron Microscopy (TEM)

A drop of diluted CNF suspension (0.04–0.05 wt %) was deposited on a 200-mesh ultrathin carbon-coated copper grid. A piece of filter paper was used to absorb the excess liquid on the grid. After the sample was dried, it was imaged with a transmission electron microscope (JEM-1400, JEOL Ltd., Tokyo, Japan) operated at an accelerating voltage of 80 kV. Diameters of CNFs were calculated from TEM images using ImageJ software (National Institutes of Health, Bethesda, Maryland, USA) [20]. For each sample, 200 nanofibers were selected randomly and measured from several TEM images.

2.4.6. Tensile Performance

The tensile test was conducted at a crosshead speed of 1 mm/min using a universal material testing machine (Shenzhen SANS Tensile Machine Co. Ltd., Shenzhen, China). The samples (CNF films) were 30 mm long, 6 mm wide, and 40–50 μm, and were measured with a gauge length of 20 mm. At least five CNF films of each material were tested, and the average values were calculated.

2.4.7. Thermomechanical Analysis (TMA)

The coefficient of thermal expansion (CTE) of the CNF films was measured by a thermomechanical analyzer (TMA/SS6100, SII Nanotechnology Inc., Tokyo, Japan). The samples were 20 mm long and 3 mm wide with a span of 15 mm. The measurement was performed three times with a heating rate of 5 °C min−1 under a load of 3 g in the tensile mode in a nitrogen atmosphere. The CTE value was determined at 20–150 °C in the second run. At least five specimens of each material were tested, and the average values were calculated.

2.4.8. Thermogravimetric Analysis (TGA)

The thermal stability of the CNF films was analyzed with a thermogravimetric analyzer (STA 449F3, NETZSCH Inc., Bavaria, Germany). It was measured in a nitrogen atmosphere at temperatures ranging from 30 to 500 °C with a heating rate of 10 °C/min. The weight-loss rate was obtained from the derivative of the thermogravimetric (DTG) data.

2.4.9. Light Transmittance

The regular light transmittances of the film samples were measured at wavelengths from 200 to 800 nm by an ultraviolet (UV)-visible spectrometer with an integrating sphere 60 mm in diameter (U-4100; Hitachi High Tech. Corp., Tokyo, Japan). Regular transmittance was measured by placing the samples 22 cm from the entrance ort of the integrating sphere. At least five CNF films of each material were tested, and the average values were calculated.

3. Results and Discussion

3.1. Chemical Composition Measurement

A wood cell wall consists of elastic microfibrils composed of crystalline and paracrystalline cellulose and a matrix composed of hemicelluloses and lignin [21,22]. The changes in the chemical composition due to acidified NaClO2 and alkali treatment were evaluated. Table 1 shows the chemical composition of the samples at different stages. The extracted wood fiber (after benzene and ethanol extraction) had a greater content of lignin (25.5%) and hemicelluloses (28.1%), and a lower content of α-cellulose (45.9%) compared to those of the purified samples. With increasing numbers of NaClO2 treatments, the lignin content in the wood fibers gradually decreased. The lignin contents in S1, S2, and S5 were 17.8%, 13.0%, and 4.7%, respectively. S2, which received two NaClO2 treatments, had a lignin content of 13.0%, indicating that about half of the lignin was removed from the extracted wood. When the chemical treatments were completed, the lignin content of S5k1, S1a4, and S2a3 decreased to 1.2%, 3.1%, and 2.7%, respectively.
Furthermore, after extraction with 17.5 wt % NaOH solution, the α-cellulose content of the obtained S5k1, S1a4, and S2a3 appreciably increased to approximately 84.5%, 76.3%, and 83.6%, respectively, compared to the content before alkali treatment. This may have been attributed to the alkali treatment that led to the removal of a large amount of hemicelluloses. In addition, the remaining hemicellulose percentages of S5k1, S1a4, and S2a3 were 11.8%, 16.7%, and 10.9%, respectively. S1a4 presented a greater percentage of hemicelluloses, which may be due to the higher content of lignin that remained in S1, preventing the extraction of hemicelluloses during the mercerization process. The strong interaction between lignin and hemicelluloses often prevents the extraction of hemicelluloses [23].

3.2. X-ray Diffraction (XRD) Studies

XRD studies on wood fibers, purified pulps, and CNFs were conducted to study the crystalline behavior of the samples. The original wood was used as a control sample. In Figure 2a, the original wood showed the characteristic profile of cellulose I, with peaks positioned at 2θ = 16.01° and 22.25°, which are typical signatures of the cellulose I crystal structure [24]. Figure 2a also shows that the crystalline structures of S1 and S2 did not change during the delignification process. In Figure 2b, purified pulps with different crystalline structures were obtained after alkali treatment. After 6 wt % KOH treatment, the pulp (S5k1) still showed typical cellulose I characteristics.
For S1a4, after 17.5 wt % NaOH treatment, the two diffraction peaks at 2θ = 16.01° and 22.25° decreased, and peaks at 2θ = 12.25° and 21.8° formed, indicating the presence of a mixture of cellulose I and II. A possible reason for the presence of a cellulose hybrid is that the lignocellulose (S1a) cannot be completely transferred into the swollen state, and only a portion of parallel cellulose microfibrils can rearrange to cellulose II [6]. According to the measurement of lignin content for S1, which received one NaClO2 treatment, about one-third of the lignin was removed. Thus, the swelling of cellulose in S1 was partially restricted by the presence of the remaining two-thirds of the lignin during the mercerizing process. For S2, which received two NaClO2 treatments, the lignin content decreased to 13.3%, showing that about half of the lignin was removed. For S2a3, after two NaClO2/NaOH/3 NaClO2 treatments, the sample showed diffraction peaks at 2θ = 12.25° (1–10), 20.2° (110), and 21.8° (200), which are speculated to represent the typical cellulose II pattern [24]. This implied that the delignified wood fibers with about half of the lignin removed (S2) were transformed into the cellulose II form successfully after 17.5 wt % NaOH treatment [19].
In Figure 2c, after one grinding treatment, the XRD patterns of the obtained N5k1, N1a4, and N2a3 were fairly similar to those of the purified pulps (S5k1, S1a4, and S2a3). This indicated that the mechanical fibrillation caused little damage to the crystalline structure of the CNFs, which is consistent with the previous studies [25]. Therefore, CNFs with cellulose I, cellulose I/II, and cellulose II polymorphs were obtained. In this study, CNFs with cellulose I, I/II, and II polymorphs were designated as CNF-I, CNF-I/II, and CNF-II, respectively.

3.3. Fourier Transform Infrared (FTIR) Spectroscopy

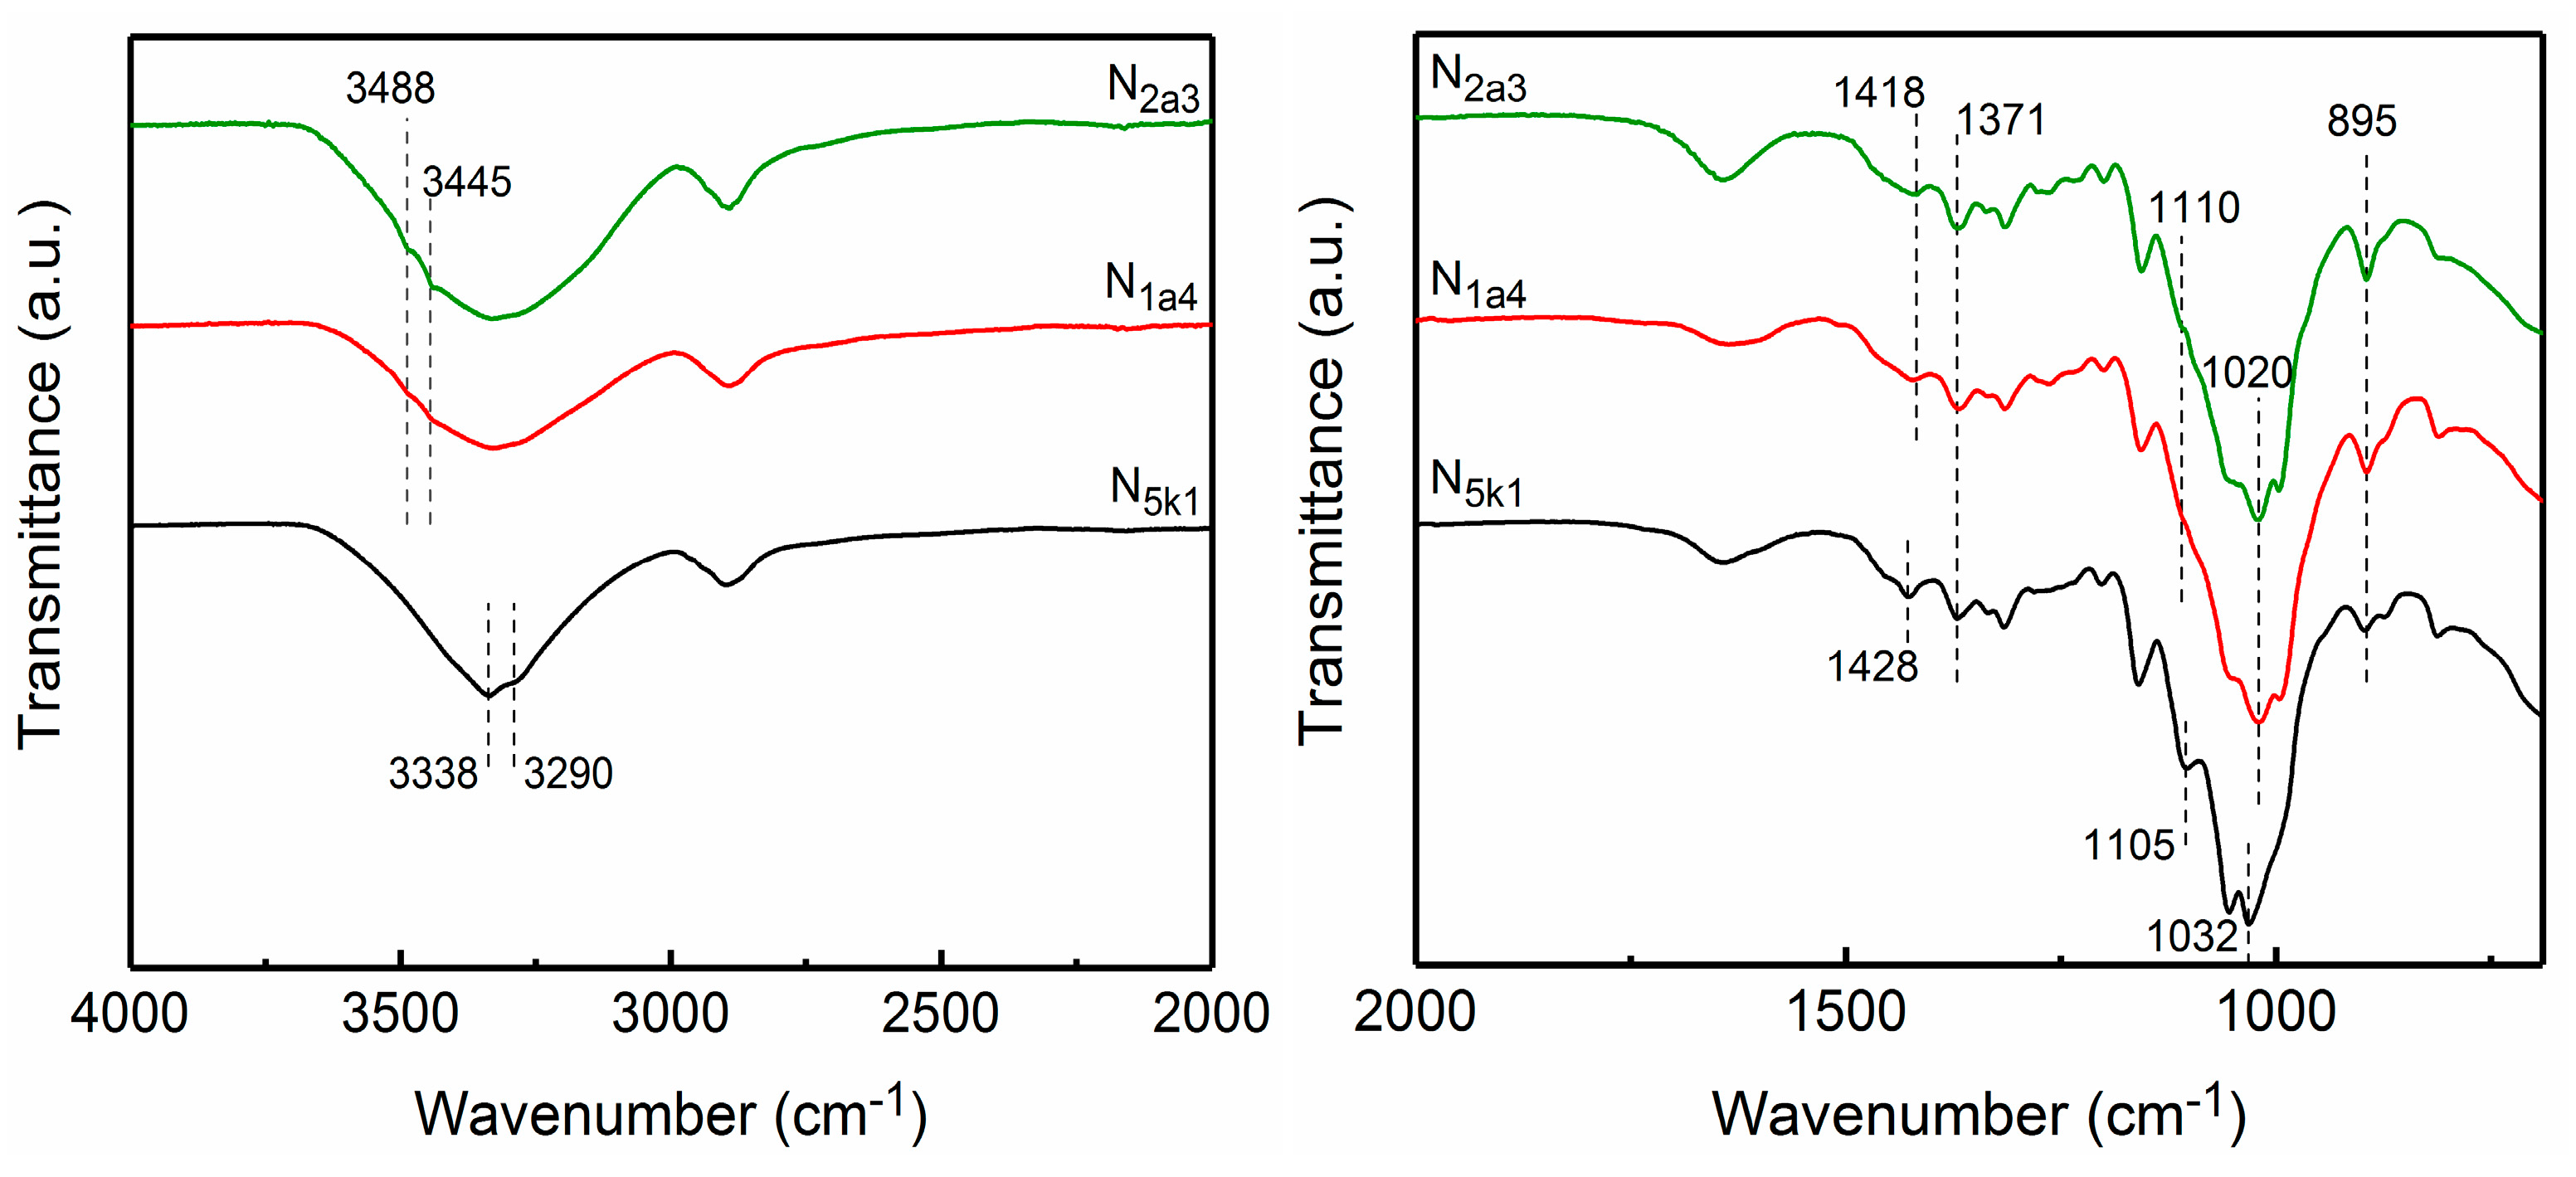
FTIR spectroscopy was used to analyze the changes in the chemical constituents and to verify the crystalline structure of the samples by different treatments. Figure 3 shows comparisons of a spectra (within the range 4000–2000 cm−1 and 2000–700 cm−1) of the original wood, S5k1, S1a4, and S2a3. The peaks at 1507 and 1460 cm−1 in the spectrum of the original wood corresponded to the aromatic ring vibration and –CH2 deformation vibration of the lignin [25,26,27,28]. The disappearance of the peak at 1507 cm−1 in purified pulps (S5k1, S1a4, and S2a3) indicated that the lignin was almost removed after a series of chemical treatments. The peak at 1737 cm−1 relates to either the acetyl and uronic ester groups of the hemicellulose or to the ester linkage of the carboxylic groups of the ferulic and p-coumaric acids of lignin and/or hemicellulose [25,27,28]. The absence of the peak at 1737 cm−1 is attributed to the leaching of hemicelluloses after alkali treatment [25,26]. The dominant peaks of –CH and –C1H deformation vibration of cellulose at 1371 and 895 cm−1 were seen in the entire spectra [6].
After alkali treatment, characteristics in crystal structure transition from cellulose I to cellulose II were observed within 3600–3000 cm−1, which was attributed to hydrogen-bond stretching [6]. For the original wood and S5k1, the peaks corresponding to the intermolecular hydrogen bonds of 6-OH···O-3′ and the intramolecular hydroxyl groups of 3-OH…O-5 were seen at 3293 and 3338 cm−1 [6,29], showing the characteristics of cellulose I. When 17.5 wt % NaOH was adopted, for S2a3 and S1a4, the band at 3338 cm−1 disappeared, and new absorbance bands at 3445 and 3488 cm−1 related to the vibration of 2-OH···O-6 intramolecular hydrogen bond appeared, indicating the characteristics of cellulose II [6,30]. Moreover, the bands at 1105 cm−1 related to anti-symmetric ring stretch, and 1032 cm−1 originating from C–O–C pyranose ring skeletal vibration shifted to 1110 and 1020 cm−1, respectively, implying the changes of cellulose crystal structure [6,29]. In addition, the band assigned to –CH2 bending with aromatic ring stretching vibrated at 1428 cm−1, turned into a weaker band, and shifted to 1418 cm−1 after crystal structure transition [6]. Furthermore, the peaks at 3445 and 3488 cm−1 (referring to the cellulose II polymorph) in S2a3 were more noticeable than those in S1a4. These results are consistent with the results of the XRD studies.
Figure 4 exhibits the spectra (within the range 4000–2000 cm−1 and 2000–700 cm−1) of the fibrillated CNFs, including N5k1, N1a4, and N2a3. After mechanical nanofibrillation by one grinding treatment, the spectra of the CNFs (N5k1, N1a4, and N2a3) were fairly close to those of the purified pulps (S5k1, S1a4, and S2a3), indicating that the molecular structures of cellulose were maintained in the case of the mechanical grinding treatment.

3.4. The Morphology of Pulps and Fibrillated Nanofibers

The X-ray diffraction results shown in Figure 2 indicate the presence of three types of purified pulps and CNFs with cellulose I, cellulose I/II, and cellulose II polymorphs. FE-SEM and TEM observations were used to study the morphological features of these samples.
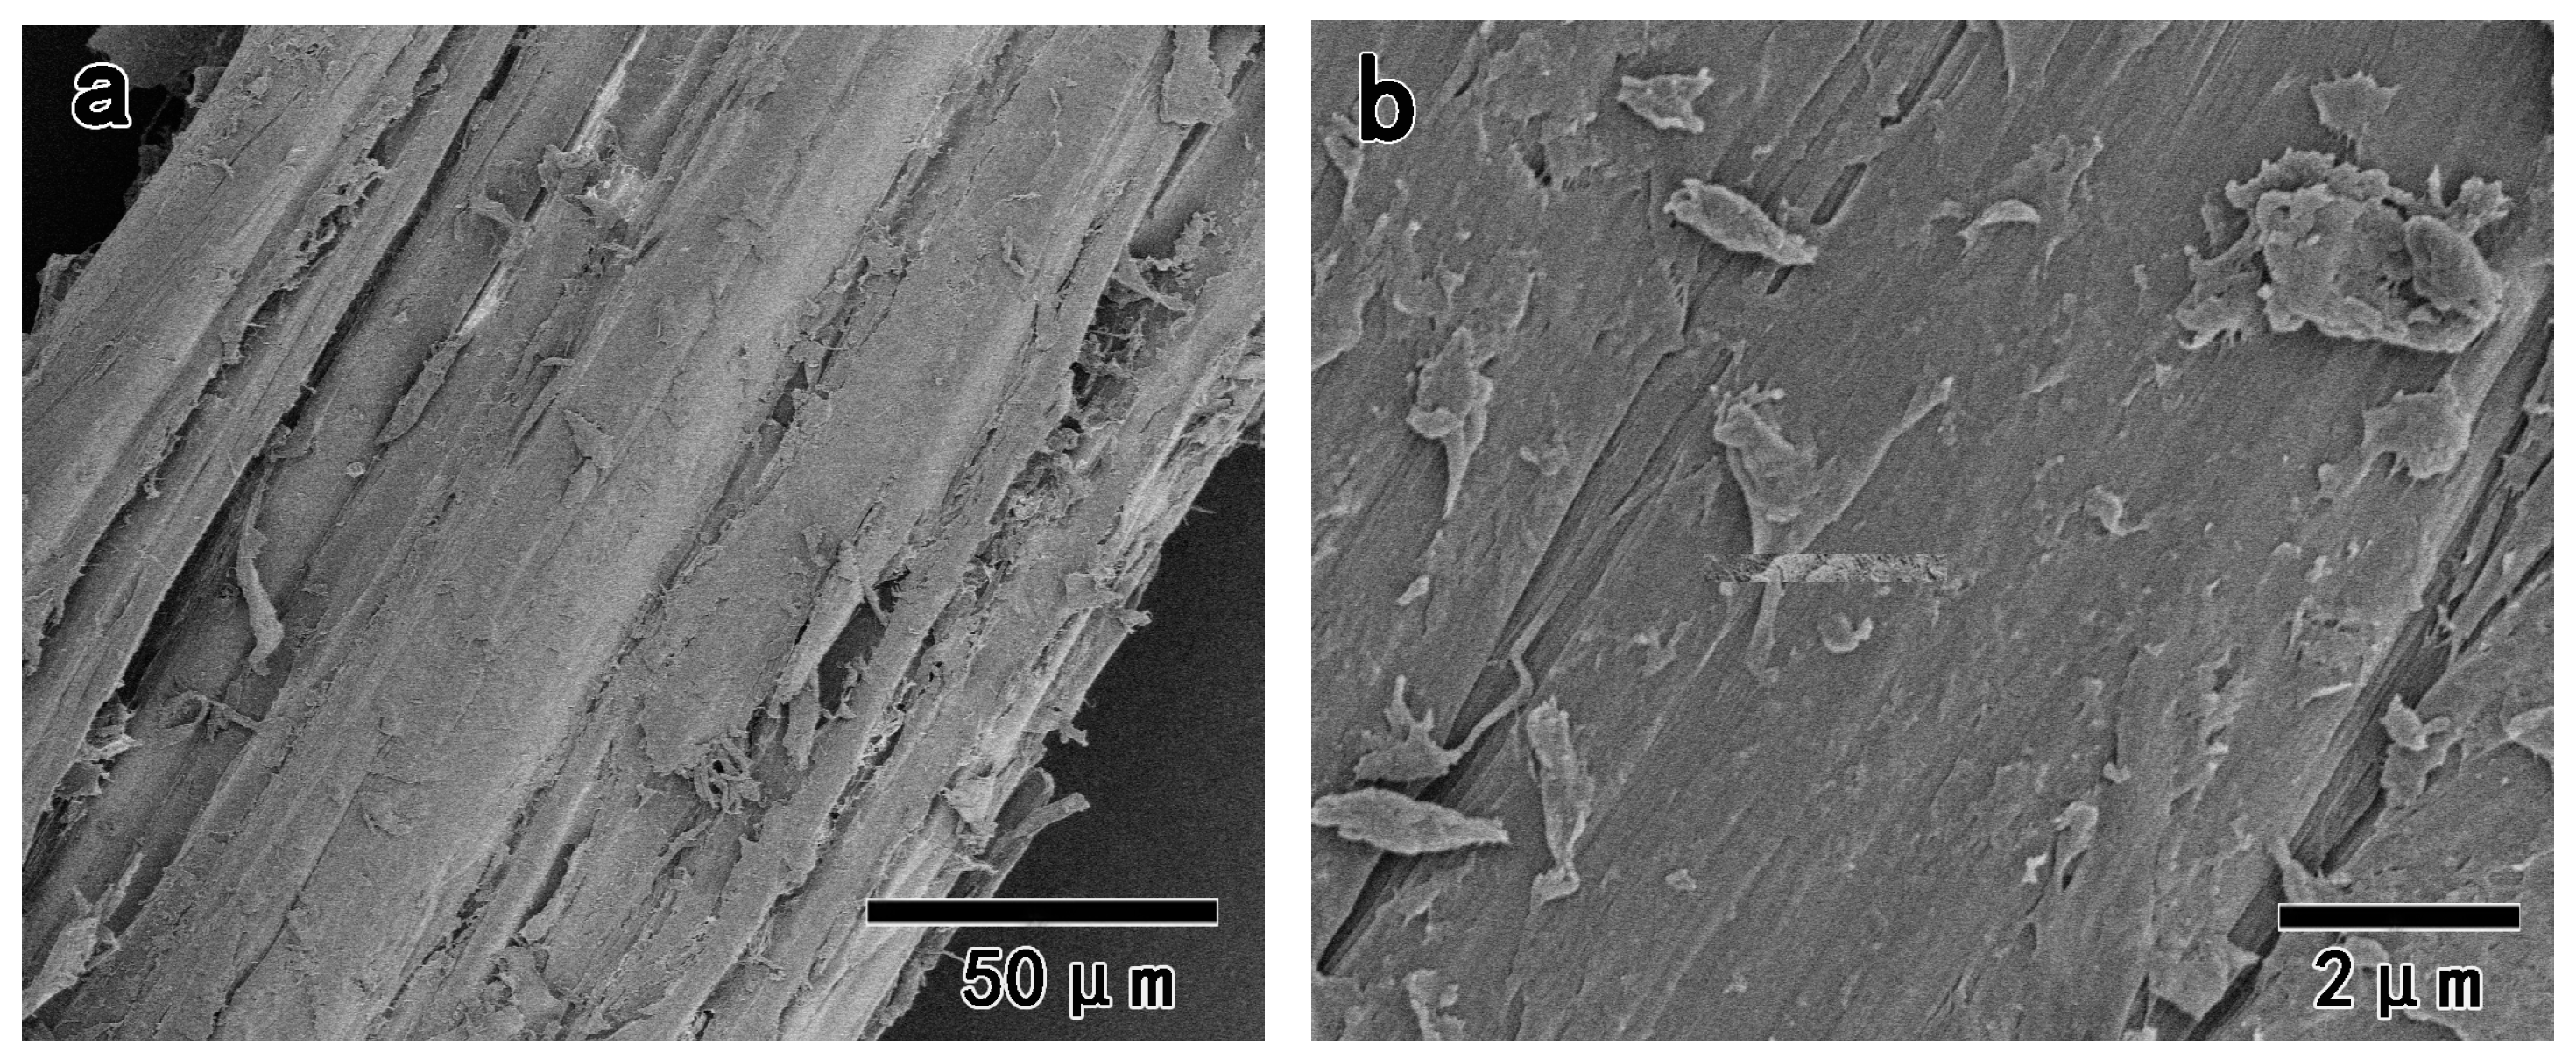
Figure 5 shows the FE-SEM images of the wood fiber after benzene and ethanol extraction, which showed a relatively smooth surface since the extracted wood was coated by lignin and hemicelluloses. After the removal of lignin by NaClO2 treatment, Na+ ions more easily penetrated into the cellulose chains during the subsequent alkali treatment. Figure 6 shows the purified pulps (S5k1, S1a4, and S2a3) after NaClO2/alkali/NaClO2 treatments. For S5k1, cellulose microfibril bundles were clearly observed on the surface of the purified pulps. The widths of the cellulose microfibril bundles were approximately 10–30 nm, which were calculated from FE-SEM images, as shown in Figure 6b, using ImageJ software [20]. This was consistent with the previous report, which said that in cell walls, van der Waals and intermolecular hydrogen bonds promote parallel stacking of multiple cellulose chains forming elementary fibrils that further aggregate into larger microfibrils (with a diameter of 5–50 nm) [1]. In comparison, the surface of S2a3 become slightly aggregated, which could be attributed to the strong alkali (17.5 wt % NaOH) treatment that may cause the interdigitation of the adjacent cellulose microfibrils in the cell wall [5,31]. The aggregation of S1a4, as shown in Figure 6e,f, surfaces was less noticeable than that of the S2a3, as shown in Figure 6c,d, because of the higher content of lignin in S1a4, which may prevent the interdigitation of cellulose microfibrils during the alkali treatment.
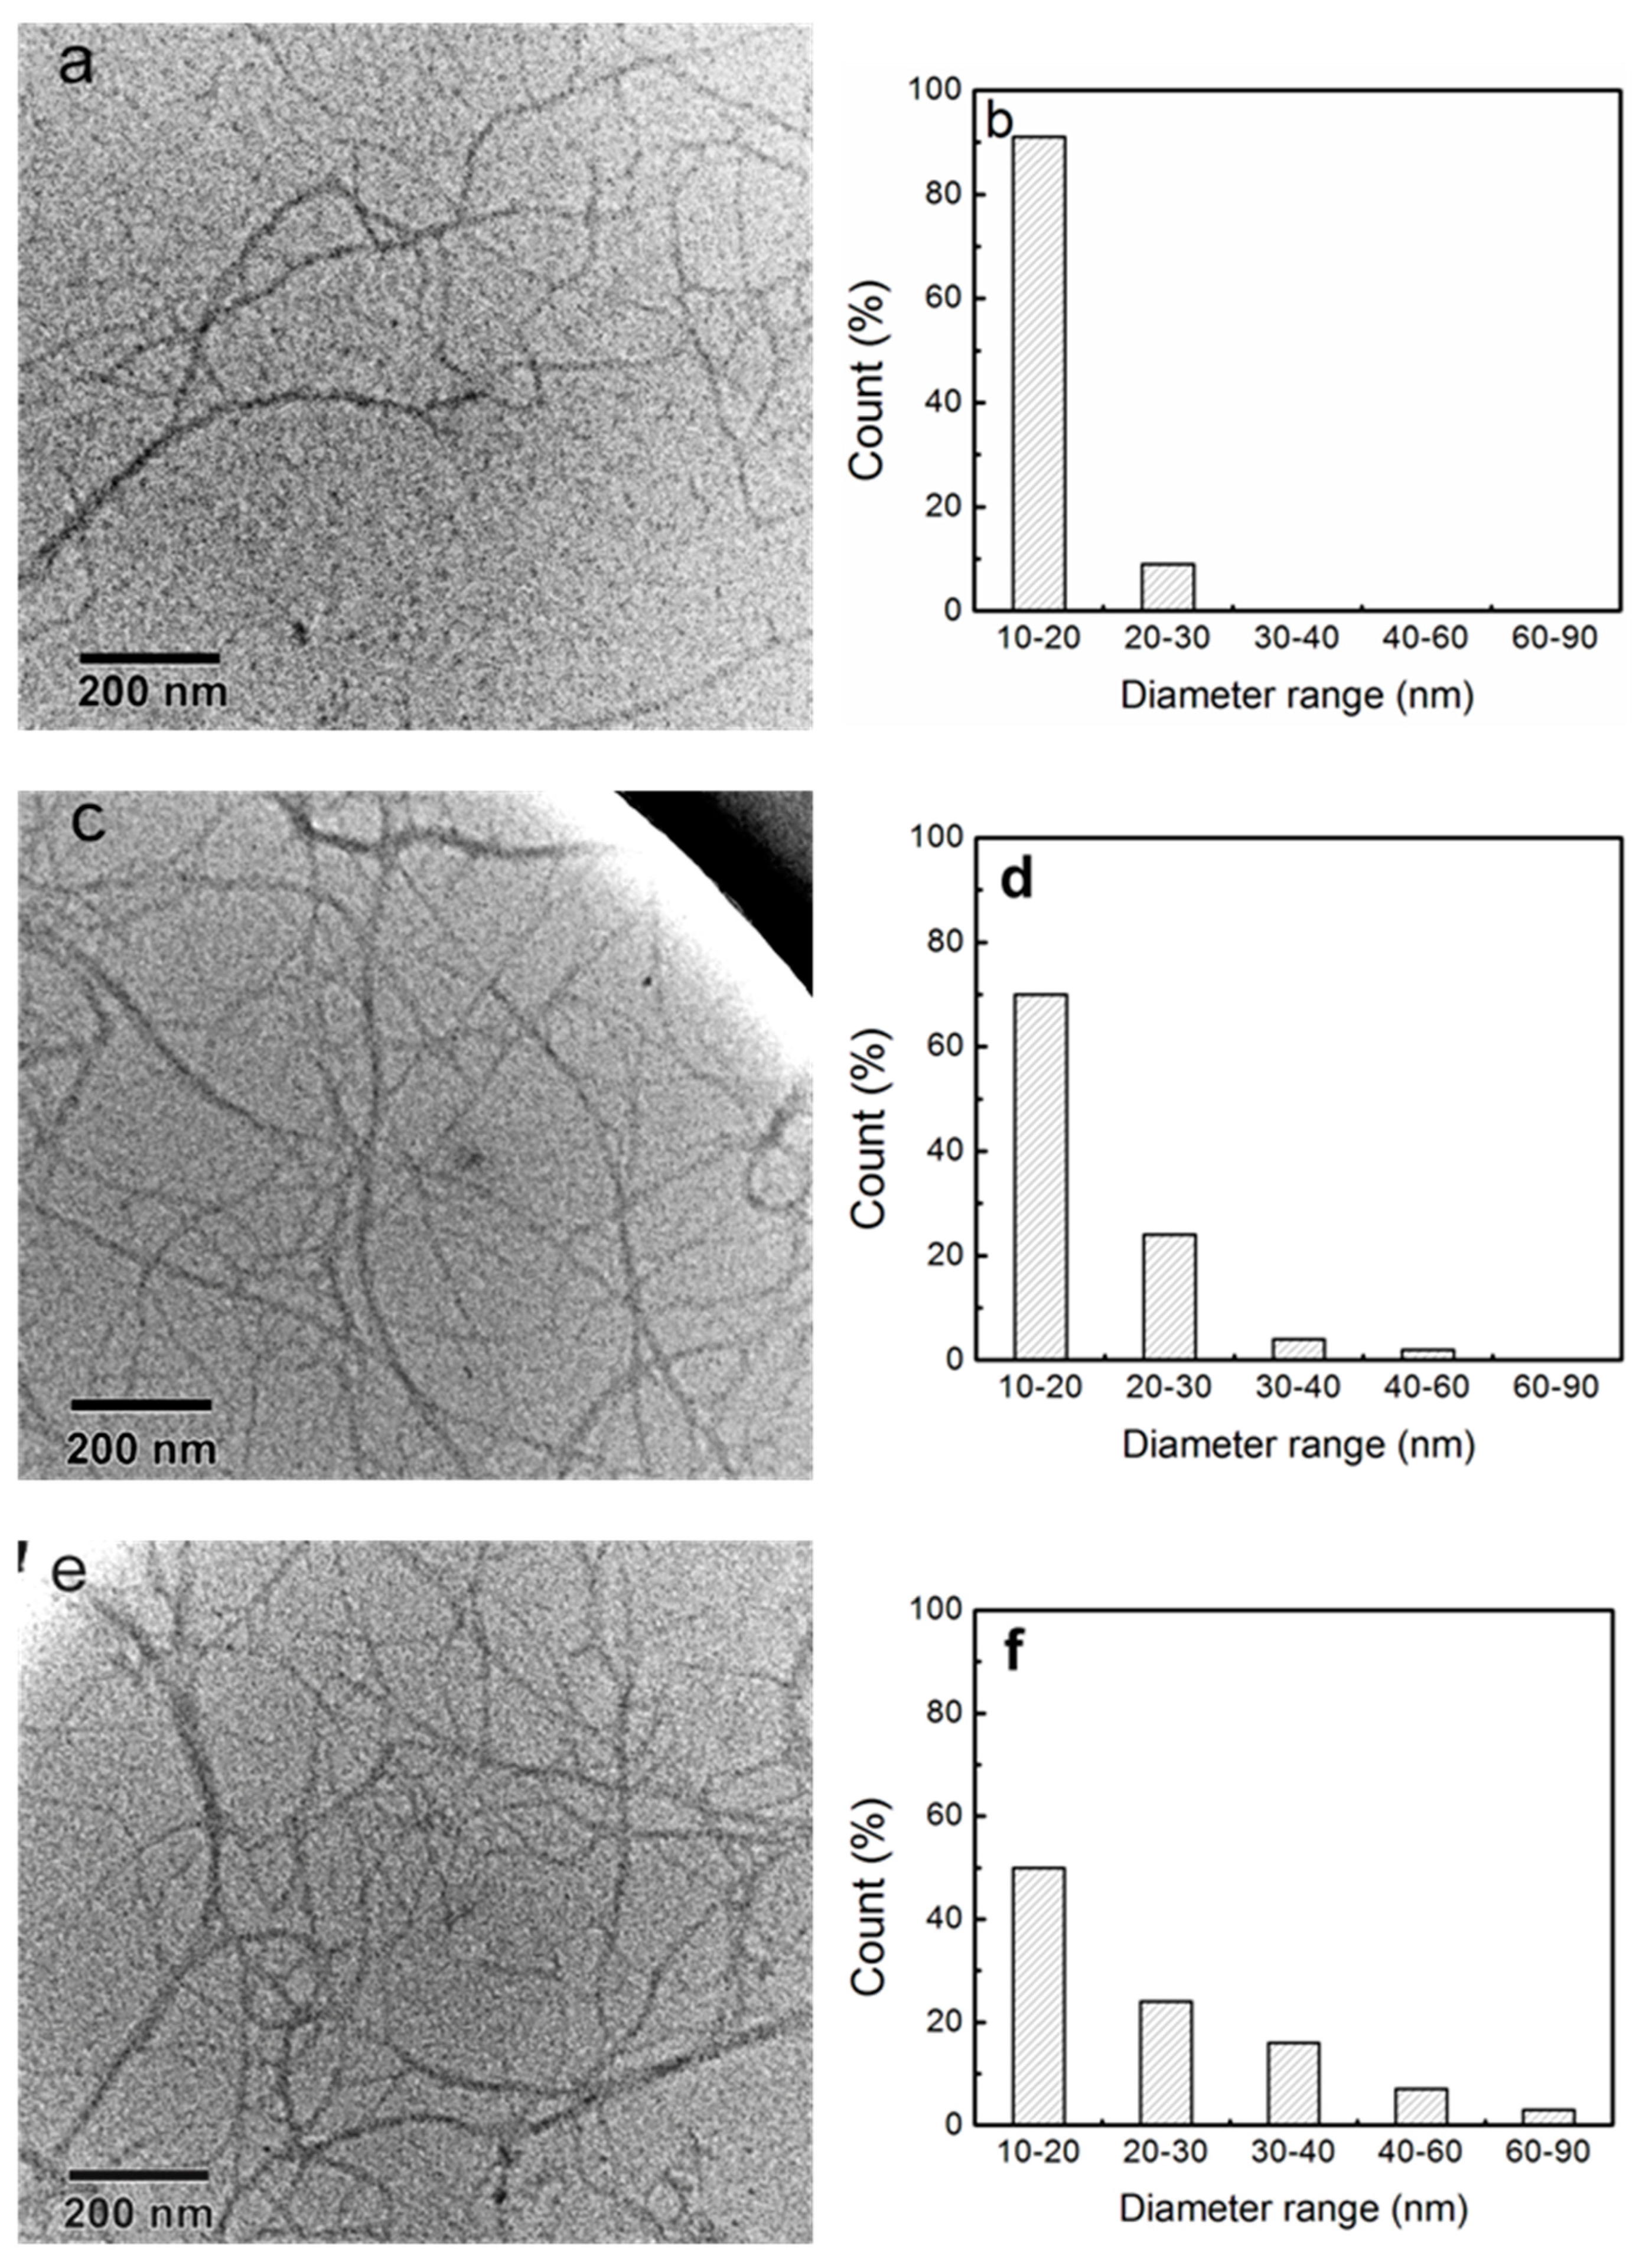
Figure 7 shows TEM images and diameter distributions of the fibrillated CNFs with different polymorphs after one mechanical grinding treatment. These three types of CNFs all exhibited high aspect ratios, and the lengths of the CNFs were several microns. CNF-I (N5k1) showed a uniform width of 10–30 nm, as shown in Figure 7a,b. Notably, CNF-I/II (N1a4), with a width of 10–60 nm, was successfully obtained, as shown in Figure 7c,d. CNF-II (N2a3), with a width of 10–90 nm, was obtained using a simple mechanical grinding treatment, as shown in Figure 7e,f. For S1a4 and S2a3, 17.5 wt % NaOH was used to mercerize the cellulose fibers, which may cause the interdigitation of the neighboring microfibrils, resulting in a larger width of CNFs after mechanical fibrillation. According to the chemical composition measurements, the remaining hemicellulose percentages of S1a4 and S2a3 were 16.9% and 10.6%, respectively. S1a4 showed a greater percentage of hemicelluloses, which may facilitate the nano-fibrillation of CNFs [32].
In previous studies, cellulose II nano-particles have been produced by other methods. Yue et al. [14] hydrolyzed mercerized cotton fibers with sulfuric acid hydrolysis and then high-pressure homogenization. The resulting rod-like cellulose II nanocrystals (CNC-II) were 76 ± 20 nm in length, and 14.2 ± 3.0 nm in width. Gong et al. [15] obtained CNC-II by treating mercerized cellulose using sulfuric acid hydrolysis, and the resulting CNC-II showed a rod-like shape with short lengths of 100–250 nm and widths of 5–15 nm. In the present study, the obtained three types of CNFs with cellulose II polymorph all exhibited a length of a few microns and widths of several tens of nanometers. These CNF-II, with a high aspect ratio, may have better reinforcing properties for composites than the rod-like CNCs.

3.5. Tensile Performance

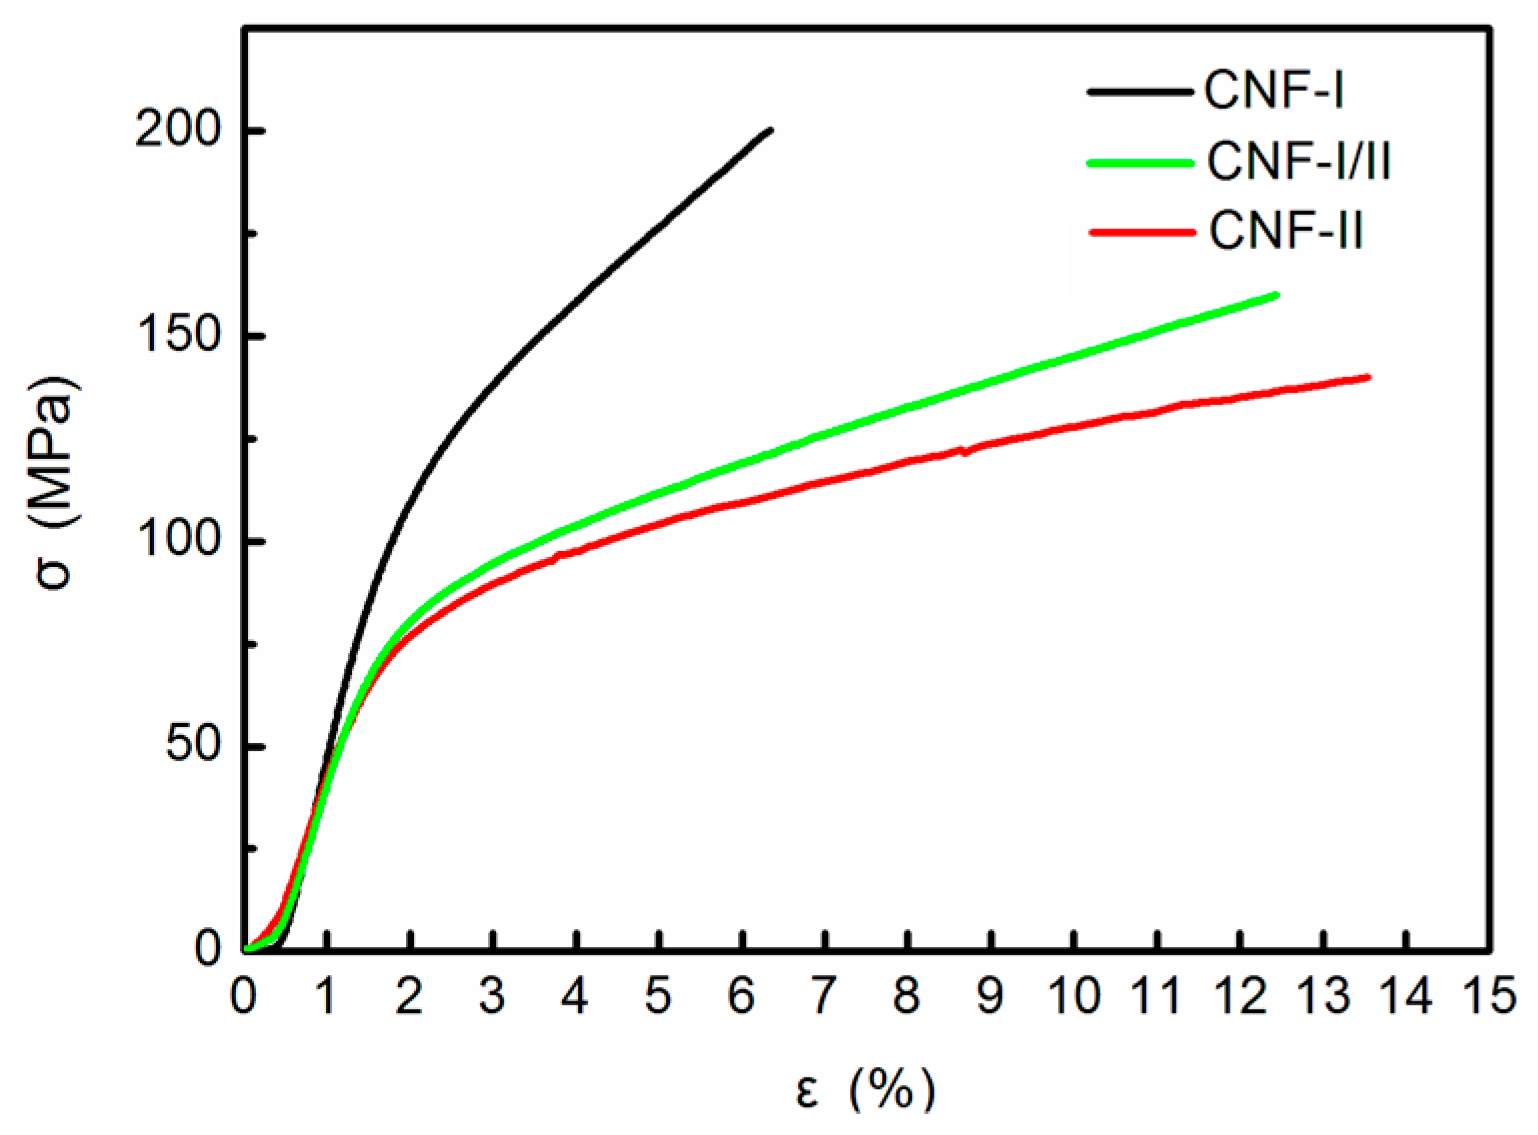
In the present study, CNF films with cellulose I, I/II, and II polymorphs were obtained, then their tensile performances were examined (the film thickness was approximately 40 μm). The densities of all CNF films were about 1.48 g/cm3. The CNF-I film was used as a control sample. Figure 8 shows the stress-strain curves of N5k1, N1a4, and N2a3 films with different polymorphs. Table 2 shows the average tensile strength, Young’s modulus, and fracture strain obtained from the initial stress-strain curves. The N5k1 (CNF-I) film showed a tensile strength of 202 MPa, a Young’s modulus of 9.5 GPa, and a fracture strain of 6.0%. The N1a4 and N2a3 films also showed high tensile strengths (CNF-I/II: 157 MPa; and CNF-II: 137 MPa). The Young’s moduli of the CNF-I/II and CNF-II films decreased after strong NaOH treatment as compared to that of the CNF-I film. Furthermore, the superiority of the fracture strain values of the CNF-I/II and CNF-II films is shown in the stress-strain curves. The fracture strains of the CNF-I/II (11.8%) and CNF-II (13.0%) films were clearly increased compared to that of the CNF-I film (6.0%). We calculated the fracture work of CNF films according to the stress-strain curves. It was found that the energy required for the fracture of CNF-I/II and CNF-II films is much larger than that of CNF-I films, which indicates that CNF-I/II and CNF-II films have better toughness than CNF-I films.
In previous studies, the Young’s moduli of ramie and curaua fibers treated with strong alkali decreased, while the strain at fracture increased compared with untreated fibers [33,34]. Our results were consistent with these findings with values measured on the superstructures of the nanofibers. This indicated that the high toughness of the CNF-I/II and CNF-II films was attributed to the crystalline structural changes in the nanofibers. The cellulose II crystal may have become softer after strong alkali treatment, and the amorphous components increased, resulting in a high toughness [18].
These results showed that the tensile performances were affected by the crystalline structural changes in the CNF films. The increase of the fracture strain of CNF-II may improve the mechanical performances of the nanocomposites, such as impact strength and fracture toughness, if the CNF-II are used as reinforcing materials.

3.6. Thermomechanical Analysis (TMA)

One of the advantages of CNFs is their extremely low thermal expansion. Sun et al. [35] reported that the CTE of the CNF/CNC films from wood pulps was 11.86–17.65 ppm/K. The CTE mismatches and large CTE values among various components may lead to the malfunction of electronic devices and a decrease of the mechanical properties of composites [36]. Thus, it is necessary to study the coefficient of thermal expansion (CTE) of the CNFs if they are used as reinforcing materials in composites or sustainable electronic applications.
In this study, the thermal expansion of CNF-I, CNF-I/II, and CNF-II films was studied and compared, and the results are shown in Table 1. N5k1, with the cellulose I polymorph, exhibited a much smaller thermal expansion (9.4 ppm/K) between 20 and 150 °C. On the other hand, CNF-I/II (N1a4) and CNF-II (N2a3) also presented small CTE values of 17.1 and 17.3 ppm/K, respectively. The CTE values slightly increased when the crystalline structure of CNFs was converted from cellulose I to cellulose II, which may be due to the increase in the amorphous region of cellulose resulting from the strong alkali (17.5 wt % NaOH) treatment.

3.7. Thermogravimetric Analysis (TGA)

It is important to study the thermal properties of CNFs for evaluating their applicability in the processing of bio-composites, in which the processing temperature of thermoplastic polymers is increased to more than 200 °C [25]. Figure 9 exhibits the TG and DTG curves of the CNF-I, CNF-I/II, and CNF-II films. All TG curves presented an initial slight decrease from 30 to 150 °C, attributed to a mass loss of the absorbed moisture or the residues of low molecular weight compounds from the isolation procedures. From 150 to 500 °C, the degradation process began in the cellulose, hemicelluloses, and the associated linked water [37]. Due to the low decomposition temperature of the remaining hemicelluloses and lignin, the samples began to degrade from approximately 210 °C. As shown in Figure 9, the decomposition process was mild before 250 °C. In the main decomposition region from 250 to 500 °C, cellulose decomposed due to the breakdown of the molecular structure. In Figure 9b, the DTG curves of the CNF-I and CNF-II films showed cellulose decomposition with the maximum thermal degradation occurring at 338 °C. For the CNF-I/II film, the maximum thermal degradation occurred at 331 °C. The higher degradation temperature of CNF-I and CNF-II was likely due to the greater α-cellulose content.
Yang et al. [38] analyzed the thermal properties of hemicelluloses and showed that the decomposition peak of hemicelluloses reached a maximum mass loss rate at 268 °C. In the DTG curves in Figure 9b, the CNF-I/II film showed a clear broadening or shoulder peak at 264 °C, which may have been due to the decomposition of hemicelluloses. For CNF-I and CNF-II films, the DTG curve showed a smaller shoulder peak at approximately 264 °C, which could have been due to the lower content of hemicelluloses. This likely resulted in improved thermal properties for CNF-I and CNF-II as the decomposition of hemicellulose begins at a much lower temperature [39] than that of cellulose [39].

3.8. Light Transmittance

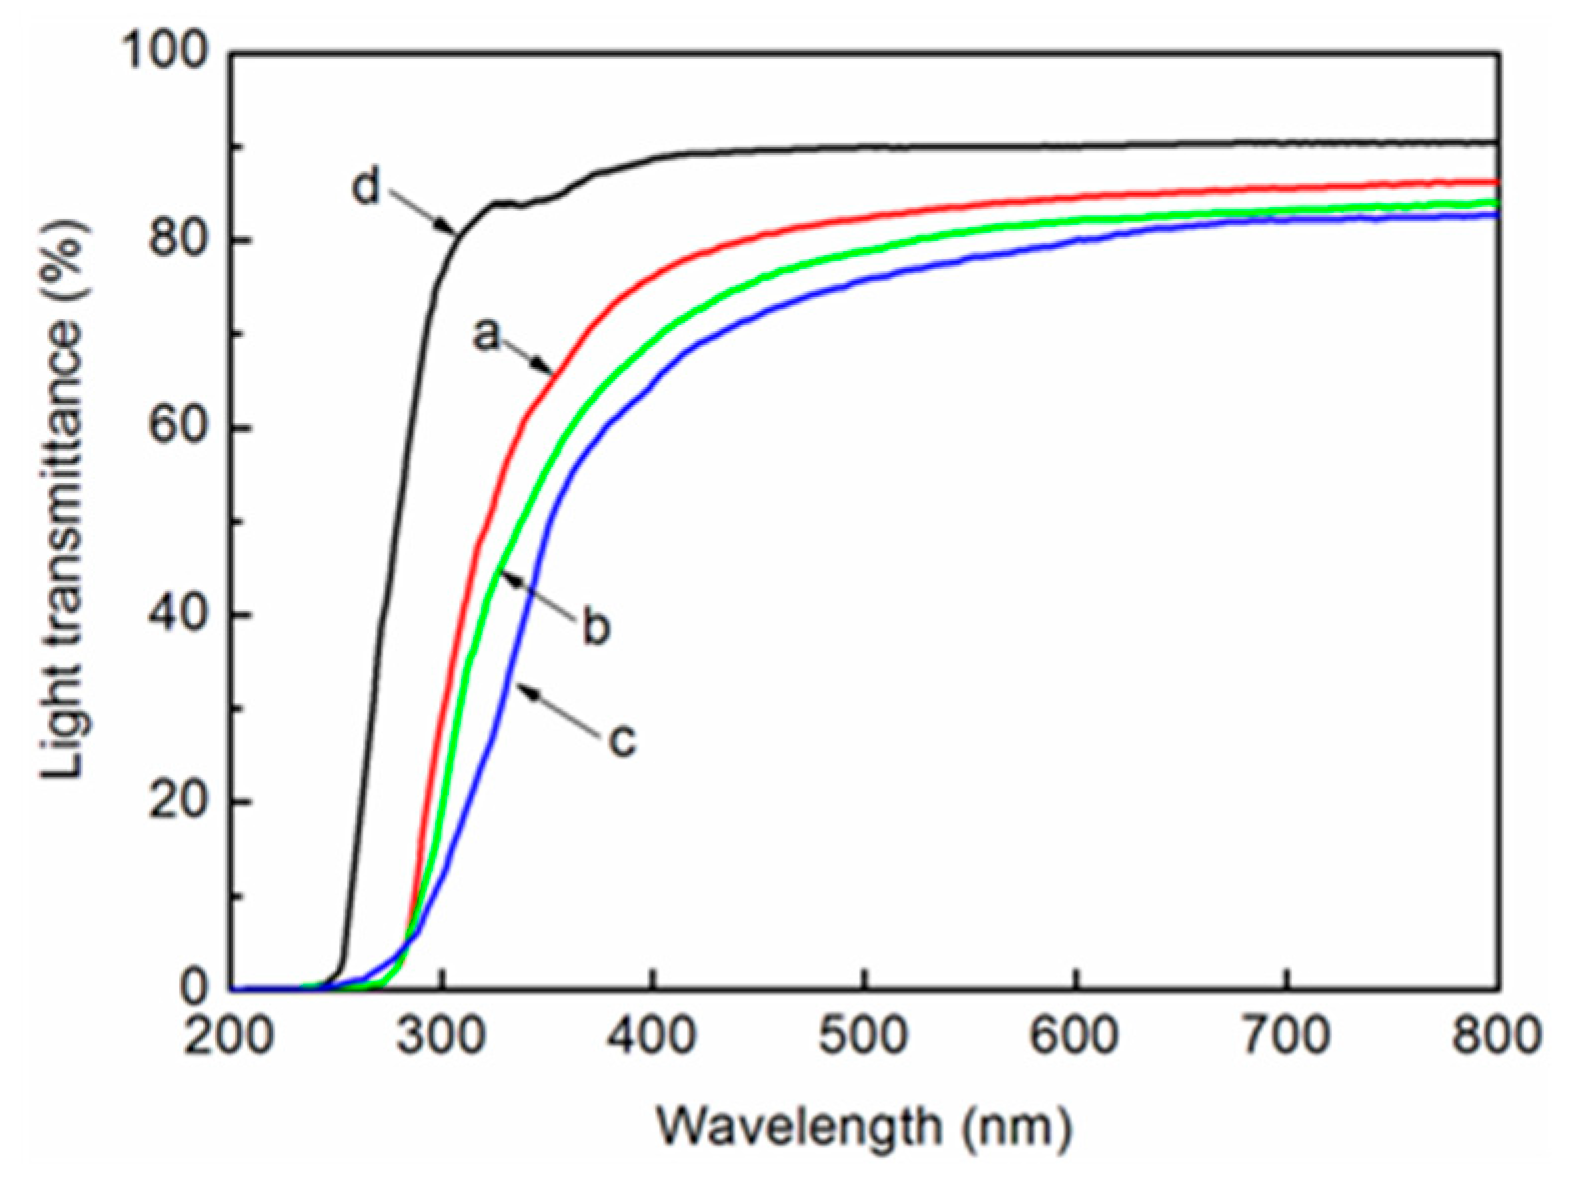
It was clarified that the light transmittances of the composites prepared with fibrillated pulp and acrylic resin show good agreement with the degree of nanofibrillation [32]. Hence, the regular light transmittance of the nanocomposite was evaluated as an indirect estimation of the fiber width distribution. We produced a nanocomposite with acrylic resin using CNF-I, CNF-I/II, and CNF-II as fillers, according to the method by Iwamoto et al. [32]. The light transmittances of the acrylic resin and the nanocomposites are shown in Figure 10.
The acrylic resin, as shown in Figure 10d, was used as a control sample and showed the highest light transmittance at a wavelength of 600 nm. The CNF-I, CNF-I/II, and CNF-II nanocomposites (thickness: 60 µm) displayed 84.7%, 82.6%, and 80.1% light transmission, respectively, at a wavelength of 600 nm, as shown in Figure 10a–c. The color of the developed film (for example: CNF-II film) was translucent white, as shown in the following image in Figure 11a. Figure 11b shows the nanocomposite made with acrylic resin using cellulose II nanofibers as a filler, which is transparent. This confirms that the CNFs obtained from wood powders in this study are uniformly nanofibrillated using the appropriate delignification technique and mechanical treatment.

4. Conclusions

CNFs with cellulose I, I/II, and II polymorphs were obtained by chemical purification and one mechanical grinding treatment. It resulted in a relatively high yield of approximately 80–85% after a simple grinding treatment, which showed less energy consumption compared to previous studies [17,18]. The obtained three types of CNFs have similar morphology with long lengths and a high aspect ratio. This comparative study on the characterization of CNF-I, CNF-I/II, and CNF-II provides a theoretical basis for the application of CNFs with different polymorphs. These three types of CNFs also have other advantageous properties, including light weight, high strength, fully bio-based, easily recyclable, and biodegradable properties, and are expected to be useful in the field of biomaterials, nanocomposites, barrier materials, electronic materials, super capacitors, and others. In addition, the increase of the fracture strain of CNF-II may improve the mechanical performance of the nanocomposites, such as impact strength and fracture toughness, if they are used as reinforcing materials.

Author Contributions

Conceptualization, H.W.; data curation, H.W., T.W., and X.W.; investigation, S.L., T.W., and X.C.; methodology, X.W.; supervision, D.L.; writing of original draft, H.W.

Acknowledgments

The authors gratefully acknowledge the financial support by National Natural Science Foundation of China (NSFC 31800488), Natural Science Foundation of Jiangsu Province (CN) (No. BK20150875), Innovation Fund for Young Scholars of Nanjing Forestry University (No. CX2017003), and the Starting Foundation of Nanjing forestry University (No. GXL001).

Conflicts of Interest

The authors declare no conflict of interest.

References

  1. Moon, R.J.; Martini, A.; Nairn, J.; Simonsen, J.; Youngblood, J. Cellulose nanomaterials review: Structure, properties and nanocomposites. Chem. Soc. Rev. 2011, 40, 3941–3994. [Google Scholar] [CrossRef] [PubMed]
  2. Ling, S.J.; Chen, W.; Fan, Y.M.; Zheng, K.; Jin, K.; Yu, H.P.; Buehler, M.J.; Kaplan, D.L. Biopolymer nanofibrils: Structure, modeling, preparation, and applications. Prog. Polym. Sci. 2018, 5, 1–56. [Google Scholar] [CrossRef]
  3. Jin, E.; Guo, J.G.; Yang, F.; Zhu, Y.Y.; Song, J.L.; Jin, Y.C.; Rojas, O.J. On the polymorphic and morphological changes of cellulose nanocrystals (CNC-I) upon mercerization and conversion to CNC-II. Carbohydr. Polym. 2016, 143, 327–335. [Google Scholar] [CrossRef] [PubMed]
  4. O’Sullivan, A.C. Cellulose: The structure slowly unravels. Cellulose 1997, 4, 173–207. [Google Scholar] [CrossRef]
  5. Okano, T.; Sarko, A. Mercerization of cellulose. II. Alkali-cellulose intermediates and a possible mercerization mechanism. J. Appl. Polym. Sci. 1985, 30, 325–332. [Google Scholar] [CrossRef]
  6. Yue, Y.Y.; Han, J.Q.; Han, G.P.; Zhang, Q.G.; French, A.D.; Wu, Q.L. Characterization of cellulose I/II hybrid fibers isolated from energycane bagasse during the delignification process: Morphology, crystallinity and percentage estimation. Carbohydr. Polym. 2015, 133, 438–447. [Google Scholar] [CrossRef] [PubMed]
  7. Muhd Julkapli, N.; Bagheri, S. Nanocellulose as a green and sustainable emerging material in energy applications: A review. Polym. Adv. Technol. 2017, 28, 1583–1594. [Google Scholar] [CrossRef]
  8. Nagarajan, S.; Skillen, N.C.; Irvine, J.T.S.; Lawton, L.A.; Robertson, P.K.J. Cellulose II as bioethanol feedstock and its advantages over native cellulose. Renew. Sustain. Energy Rev. 2017, 77, 182–192. [Google Scholar] [CrossRef] [Green Version]
  9. Serizawa, T.; Kato, M.; Okura, H.; Sawada, T.; Wada, M. Hydrolytic activities of artificial nanocellulose synthesized via phosphorylase-catalyzed enzymatic reactions. Polym. J. 2016, 48, 539–544. [Google Scholar] [CrossRef]
  10. Wu, Q.L.; Mei, C.T.; Han, J.Q.; Yue, Y.Y.; Xu, X.W. Preparation technology and industrialization status of nanocellulose. J. For. Eng. 2018, 3, 1–9. [Google Scholar]
  11. Siro, I.; Plackett, D. Microfibrillated cellulose and new nanocomposite materials: A review. Cellulose 2010, 17, 459–494. [Google Scholar] [CrossRef]
  12. Kargarzadeh, H.; Mariano, M.; Huang, J.; Lin, N.; Ahmad, I.; Dufresne, A.; Thomas, S. Recent developments on nanocellulose reinforced polymer nanocomposites: A review. Polymer 2017, 132, 368–393. [Google Scholar] [CrossRef]
  13. Abe, K.; Yano, H. Formation of hydrogels from cellulose nanofibers. Carbohydr. Polym. 2011, 85, 733–737. [Google Scholar] [CrossRef]
  14. Yue, Y.Y.; Zhou, C.J.; French, A.D.; Xia, G.; Han, G.P.; Wang, Q.W.; Wu, Q.L. Comparative properties of cellulose nano-crystals from native and mercerized cotton fibers. Cellulose 2012, 19, 1173–1187. [Google Scholar] [CrossRef]
  15. Gong, J.; Mo, L.H.; Li, J. A comparative study on the preparation and characterization of cellulose nanocrystals with various polymorphs. Carbohydr. Polym. 2018, 195, 18–28. [Google Scholar] [CrossRef]
  16. Abe, K.; Iwamoto, S.; Yano, H. Obtaining cellulose nanofibers with a uniform width of 15 nm from wood. Biomacromolecules 2007, 8, 3276–3278. [Google Scholar] [CrossRef]
  17. Sharma, S.; Nair, S.S.; Zhang, Z.; Ragauskas, A.J.; Deng, Y.L. Characterization of micro fibrillation process of cellulose and mercerized cellulose pulp. RSC Adv. 2015, 5, 63111–63122. [Google Scholar] [CrossRef]
  18. Wang, H.Y.; Li, D.G.; Yano, H.; Abe, K. Preparation of tough cellulose II nanofibers with high thermal stability from wood. Cellulose 2014, 21, 1505–1515. [Google Scholar] [CrossRef]
  19. Wang, H.Y.; Chen, C.C.; Fang, L.; Li, S.Y.; Chen, N.; Pang, J.W.; Li, D.G. Effect of delignification technique on the ease of fibrillation of cellulose II nanofibers from wood. Cellulose 2018, 25, 7003–7015. [Google Scholar] [CrossRef]
  20. Han, J.Q.; Zhou, C.J.; Wu, Y.Q.; Liu, F.Y.; Wu, Q.L. Self-assembling behavior of cellulose nanoparticles during freeze-drying: Effect of suspension concentration, particle size, crystal structure, and surface charge. Biomacromolecules 2013, 14, 1529–1540. [Google Scholar] [CrossRef]
  21. Stevanic, J.S.; Salme, L. Orientation of the wood polymers in the cell wall of spruce wood fibres. Holzforschung 2009, 63, 497–503. [Google Scholar] [CrossRef]
  22. Zhan, T.Y.; Jiang, J.L.; Lu, J.X.; Zhang, Y.L.; Chang, J.M. Influence of hygrothermal condition on dynamic viscoelasticity of chinese fir (cunninghamia lanceolata). Part 1: Moisture adsorption. Holzforschung 2018, 72, 567–578. [Google Scholar] [CrossRef]
  23. Rabetafika, H.N.; Bchir, B.; Blecker, C.; Paquot, M.; Wathelet, B. Comparative study of alkaline extraction process of hemicelluloses from pear pomace. Biomass Bioenergy 2014, 61, 254–264. [Google Scholar] [CrossRef]
  24. French, A.D. Idealized powder diffraction patterns for cellulose polymorphs. Cellulose 2014, 21, 885–896. [Google Scholar] [CrossRef]
  25. Chen, W.S.; Yu, H.P.; Liu, Y.X.; Hai, Y.F.; Zhang, M.X.; Chen, P. Isolation and characterization of cellulose nanofibers from four plant cellulose fibers using a chemical-ultrasonic process. Cellulose 2011, 18, 433–442. [Google Scholar] [CrossRef]
  26. Chen, W.S.; Yu, H.P.; Liu, Y.X.; Chen, P.; Zhang, M.X.; Hai, Y.F. Individualization of cellulose nanofibers from wood using high-intensity ultrasonication combined with chemical pretreatments. Carbohydr. Polym. 2011, 83, 1804–1811. [Google Scholar] [CrossRef]
  27. Sain, M.; Panthapulakkal, S. Bioprocess preparation of wheat straw fibers and their characterization. Ind. Crops Prod. 2006, 23, 1–8. [Google Scholar] [CrossRef]
  28. Sun, R.C.; Tomkinson, J.; Wang, Y.X.; Xiao, B. Physico-chemical and structural characterization of hemicelluloses from wheat straw by alkaline peroxideextraction. Polymer 2000, 41, 2647–2656. [Google Scholar] [CrossRef]
  29. Široký, J.; Blackburn, R.S.; Bechtold, T.; Taylor, J.; White, P. Attenuated total reflectance fourier-transform infrared spectroscopy analysis of crystallinity changes in lyocell following continuous treatment with sodium hydroxide. Cellulose 2009, 17, 103–115. [Google Scholar] [CrossRef]
  30. Horikawa, Y.; Konakahara, N.; Imai, T.; Kentaro, A.; Kobayashi, Y.; Sugiyama, J. The structural changes in crystalline cellulose and effects on enzymatic digestibility. Polym. Degrad. Stab. 2013, 98, 2351–2356. [Google Scholar] [CrossRef] [Green Version]
  31. Revol, J.F.; Goring, D.A.I. On the mechanism of the mercerization of cellulose in wood. J. Appl. Polym. Sci. 1981, 26, 1275–1282. [Google Scholar] [CrossRef]
  32. Iwamoto, S.; Abe, K.; Yano, H. The effect of hemicelluloses on wood pulp nanofibrillation and nanofiber network characteristics. Biomacromolecules 2008, 9, 1022–1026. [Google Scholar] [CrossRef] [PubMed]
  33. Goda, K.; Sreekala, M.S.; Gomes, A.; Kaji, T.; Ohgi, J. Improvement of plant based natural fibers for toughening green composites—Effect of load application during mercerization of ramie fibers. Compos. Part A Appl. Sci. Manuf. 2006, 37, 2213–2220. [Google Scholar] [CrossRef]
  34. Ishikawa, A.; Okano, T.; Sugiyama, J. Fine structure and tensile properties of ramie fibres in the crystalline form of cellulose I, II, III and IV. Polymer 1997, 38, 463–468. [Google Scholar] [CrossRef]
  35. Sun, X.X.; Wu, Q.L.; Zhang, X.Q.; Ren, S.X.; Lei, T.Z.; Li, W.C.; Xu, G.Y.; Zhang, Q.G. Nanocellulose films with combined cellulose nanofibers and nanocrystals: Tailored thermal, optical and mechanical properties. Cellulose 2017, 25, 1103–1115. [Google Scholar] [CrossRef]
  36. Diaz, J.A.; Wu, X.; Martini, A.; Youngblood, J.P.; Moon, R.J. Thermal expansion of self-organized and shear-oriented cellulose nanocrystal films. Biomacromolecules 2013, 14, 2900–2908. [Google Scholar] [CrossRef] [PubMed]
  37. Kim, H.J.; Eom, Y.G. Thermogravimetric analysis of rice husk flour for a new raw material of lignocellulosic fiber-thermoplastic polymer composites. Mokchae Konghak 2001, 29, 59–67. [Google Scholar]
  38. Yang, H.P.; Yan, R.; Chen, H.P.; Lee, D.H.; Zheng, C.G. Characteristics of hemicellulose, cellulose and lignin pyrolysis. Fuel 2007, 86, 1781–1788. [Google Scholar] [CrossRef]
  39. Kabir, M.M.; Wang, H.; Lau, K.T.; Cardona, F. Effects of chemical treatments on hemp fibre structure. Appl. Surf. Sci. 2013, 276, 13–23. [Google Scholar] [CrossRef]
Figure 1. The procedure for the preparation of three types of cellulose nanofibers (CNFs) with different chemical treatments.
Polymers 11 00153 g001
Figure 2. XRD patterns of the samples: (a) wood fibers of the original wood, S1, S2; (b) purified pulps, S5k1, S1a4, and S2a3; and (c) CNFs, N5k1, N1a4, and N2a3.
Polymers 11 00153 g002
Figure 3. FTIR spectra of the samples: original wood, S5k1, S1a4, and S2a3.
Polymers 11 00153 g003
Figure 4. FTIR spectra of the fibrillated CNFs: N5k1, N1a4, and N2a3.
Polymers 11 00153 g004
Figure 5. Field emission scanning electron microscopy (FE-SEM) images of the extracted wood fiber: (a) 600× magnification; (b) 10,000× magnification.
Polymers 11 00153 g005
Figure 6. FE-SEM images of the purified pulps: (a,b) S5k1; (c,d) S1a4; and (e,f) S2a3.
Polymers 11 00153 g006
Figure 7. TEM images and diameter distributions of the CNFs: (a,b) CNF-I; (c,d) CNF-I/II; and (e,f) CNF-II.
Polymers 11 00153 g007
Figure 8. Tensile stress-strain curves of CNF-I, CNF-I/II, and CNF-II films.
Polymers 11 00153 g008
Figure 9. TG (a) and DTG (b) curves of CNF-I, CNF-I/II, and CNF-II films.
Polymers 11 00153 g009
Figure 10. Regular light transmittances of the nanocomposites made with fibrillated (a) CNF-I, (b) CNF-I/II, (c) CNF-II, and (d) acrylic resin.
Polymers 11 00153 g010
Figure 11. (a) Image of the CNF-II film; (b) image of the CNF-II/acrylic resin composite film.
Polymers 11 00153 g011
Table 1. Chemical composition of the samples at different stages.
Sampleα-Cellulose (%)Lignin (%)Hemicelluloses (%)
Extracted wood45.9 (1.8 a)25.5 (1.7 a)28.1 (2.1 a)
S150.2 (1.7 a)17.8 (1.4 a)29.2 (1.5 a)
S252.6 (1.8 a)13.0 (1.2 a)30.4 (1.8 a)
S564.5 (2.1 a)4.7 (0.8 a)28.3 (1.9 a)
S5k184.5 (1.2 a)1.2 (0.2 a)11.8 (2.2 a)
S1a476.3 (2.5 a)3.1 (0.7 a)16.7 (2.2 a)
S2a383.6 (2.3 a)2.7 (0.6 a)10.9 (1.6 a)
a The standard deviation value of five samples.
Table 2. Average tensile properties of CNFs with different polymorphs.
SamplePolymorphCTE (ppm/K)Tensile Strength (MPa)Young’s Modulus (GPa)Fracture Strain (%)
N5k1CNF-I9.4202 (11 a)9.5 (0.7 a)6.0 (0.7 a)
N1a4CNF-I/II17.1157 (7 a)6.8 (0.6 a)11.8 (1.4 a)
N2a3CNF-II17.3137 (6 a)6.0 (0.5 a)13.0 (1.1 a)
a The standard deviation value of ten samples. CTE: coefficient of thermal expansion.