A Study on the Modified Arrhenius Equation Using the Oxygen Permeation Block Model of Crosslink Structure


Abstract
1. Introduction
2. Evaluation of Tensile Properties of Aged Specimen
2.1. Tensile Tests
2.2. Results of the Tensile Test
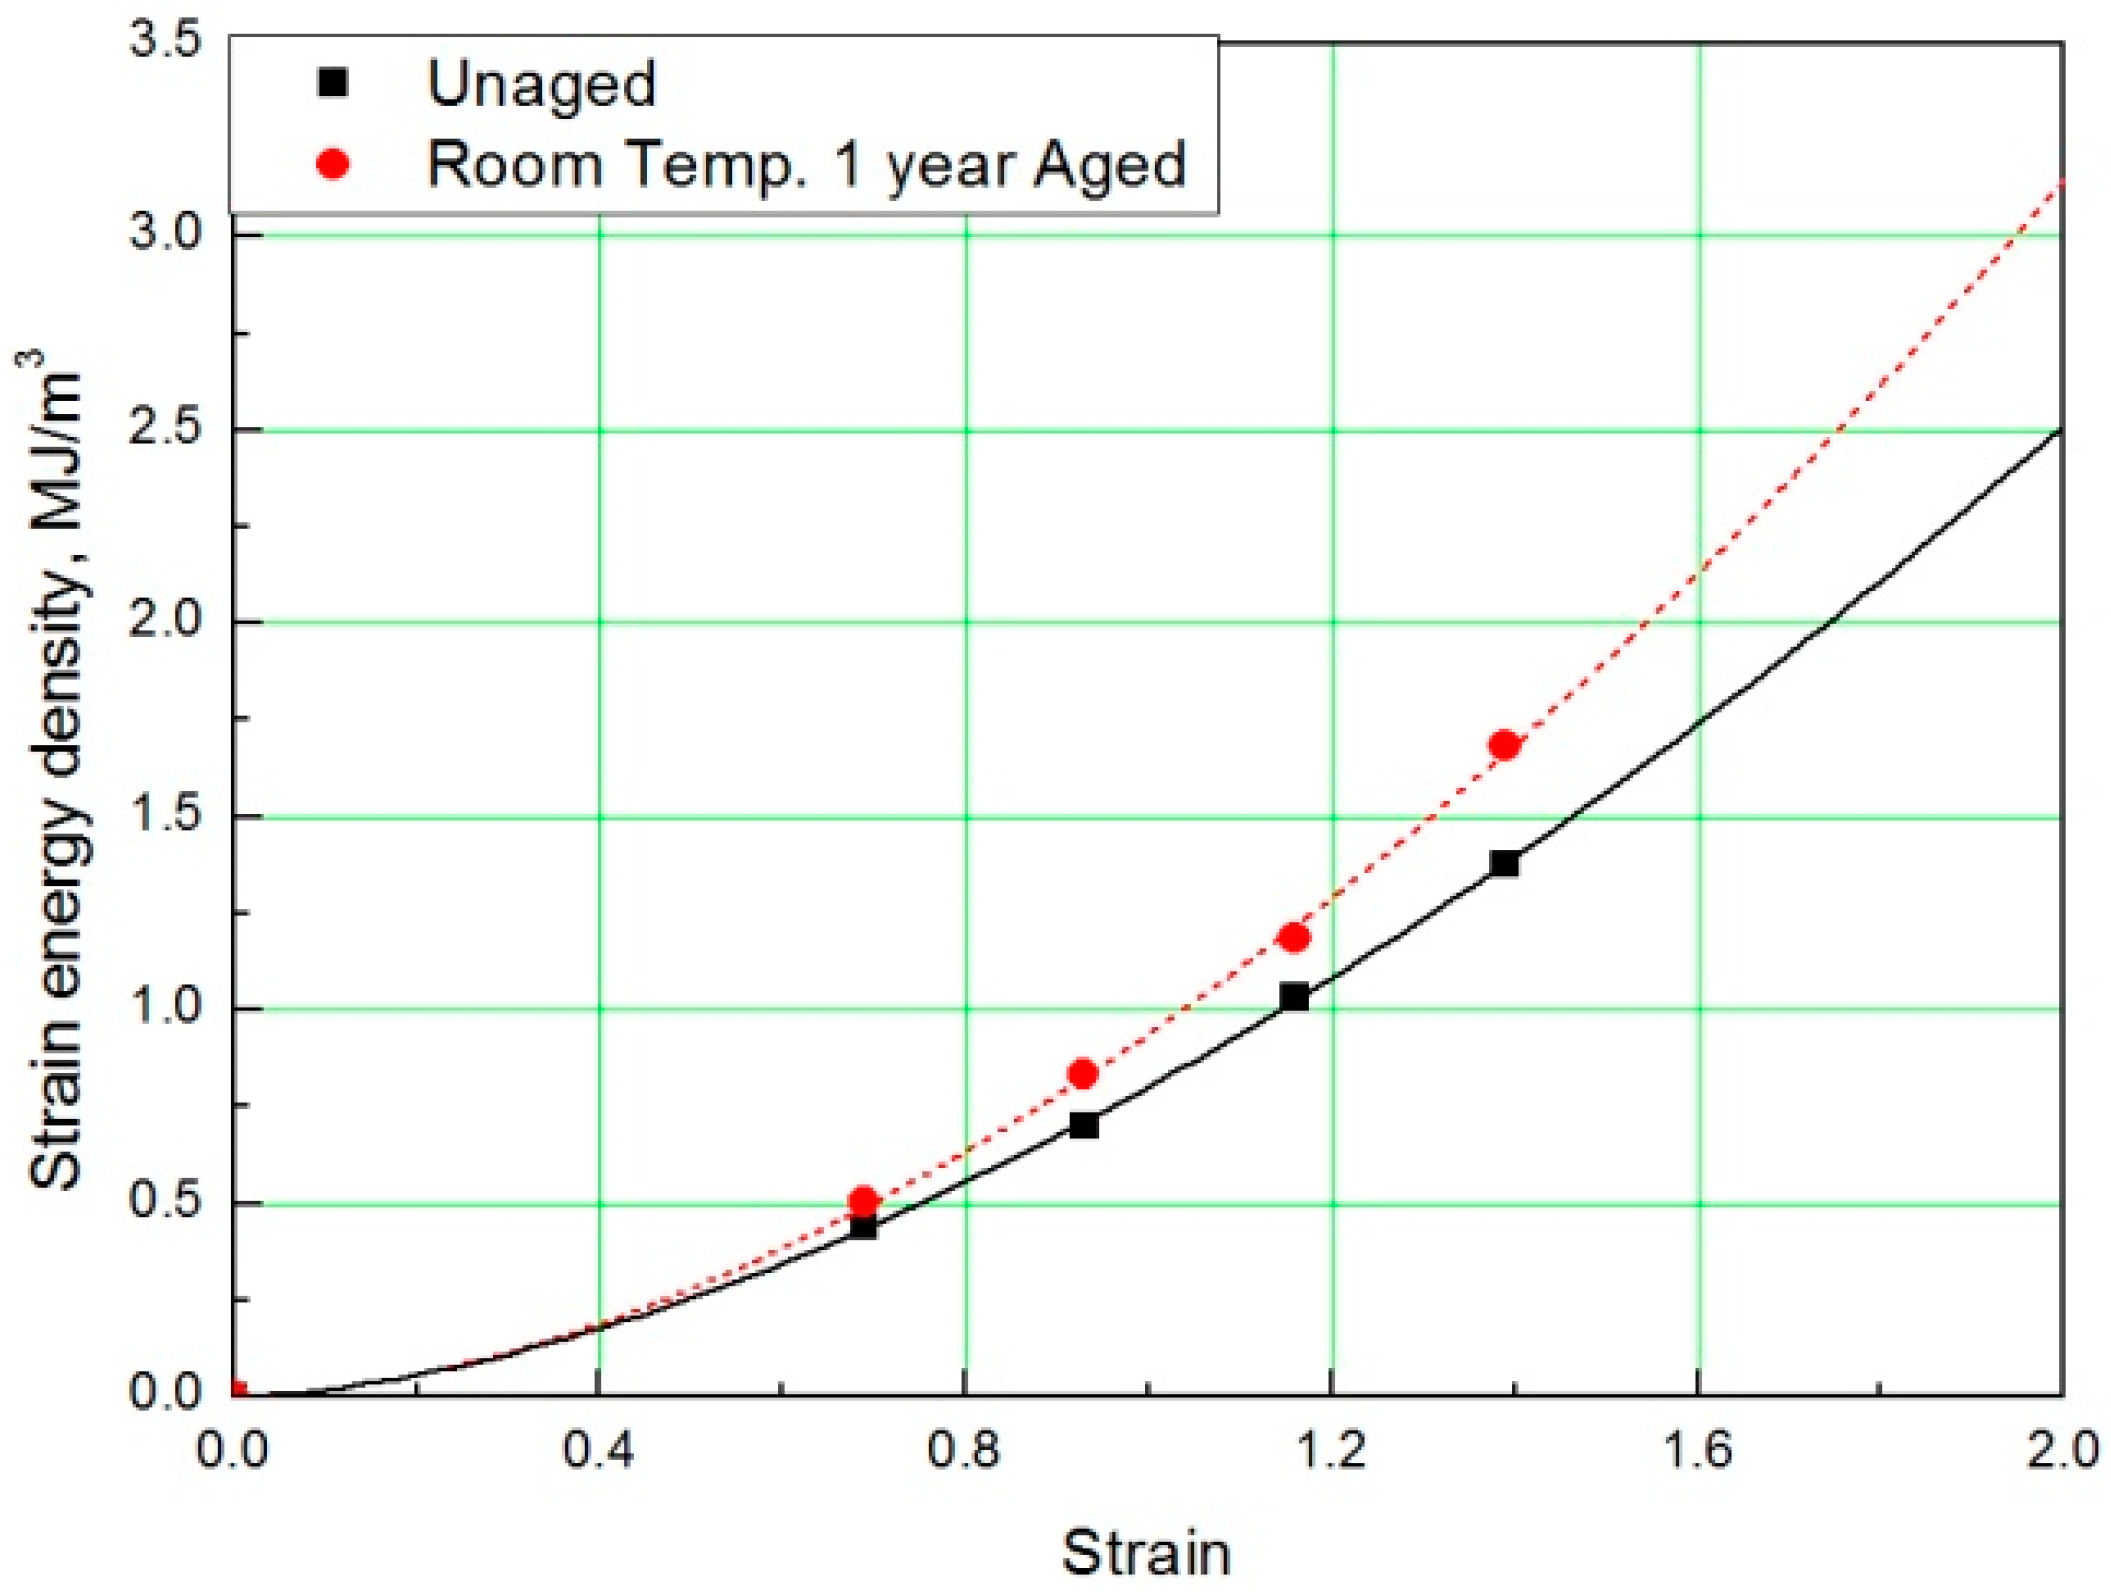
2.3. Derivation of SED-strain relationship
3. Application of Modified Arrhenius Equation
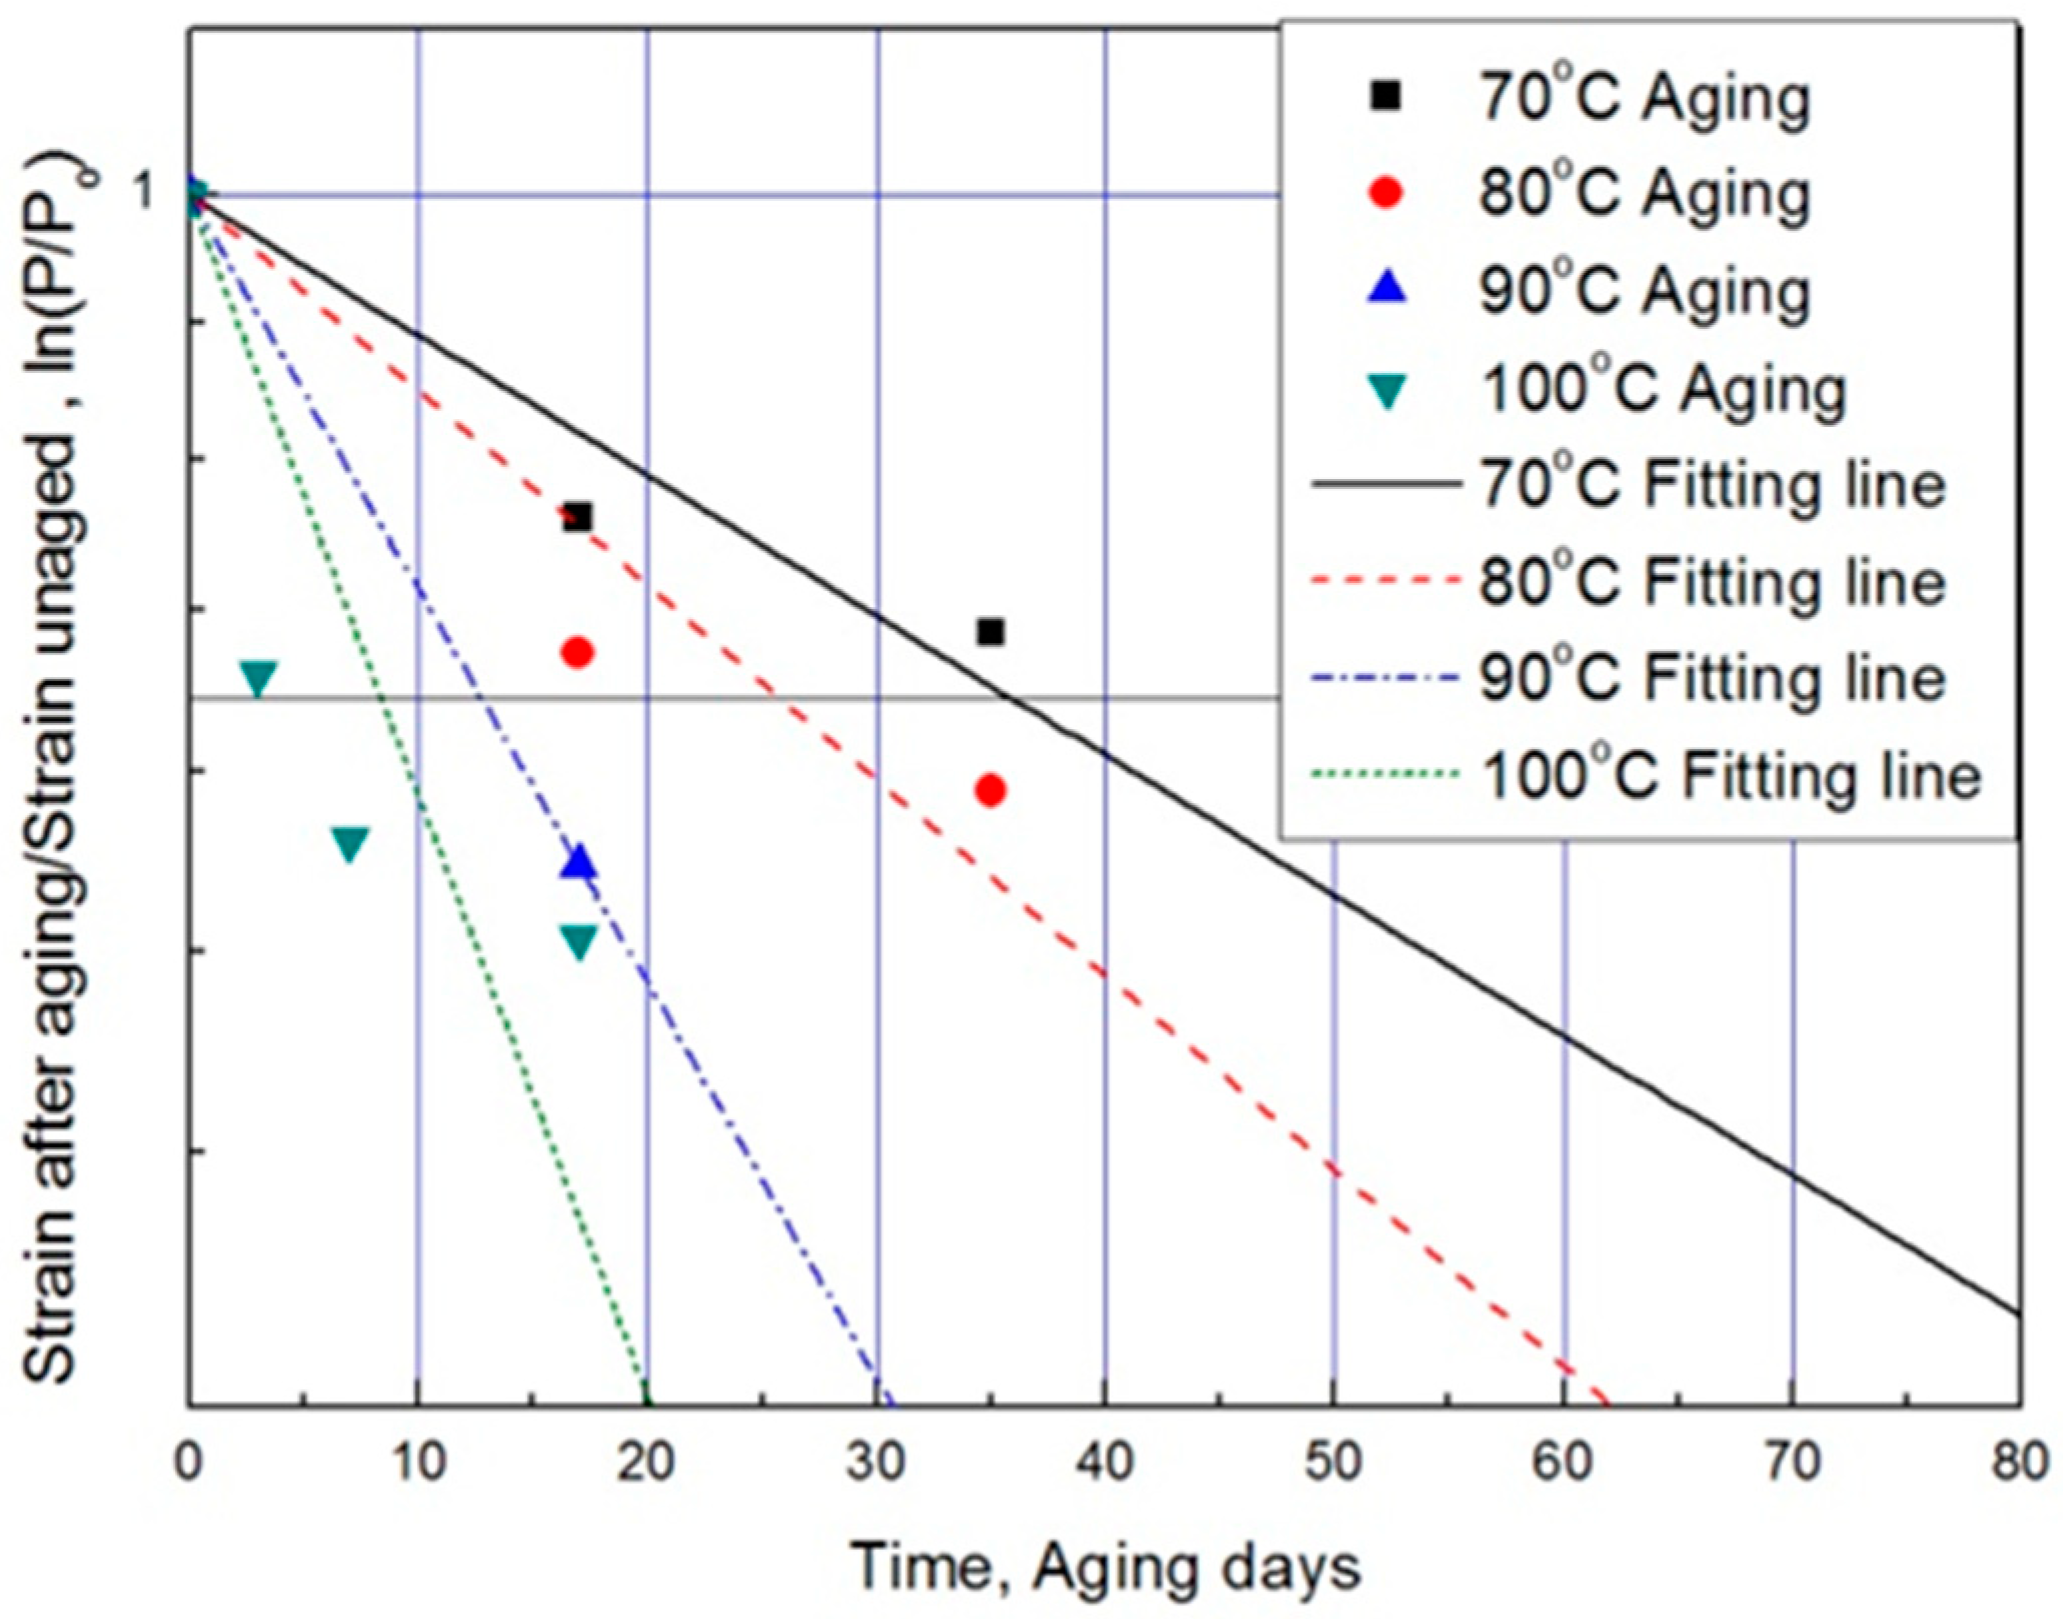
3.1. General Arrhenius Equation
3.2. Oxygen Permeation Block Model
3.3. Modified Arrhenius Equation
3.4. Verification and Application of Modified Arrhenius Equation
4. Conclusions
- 1
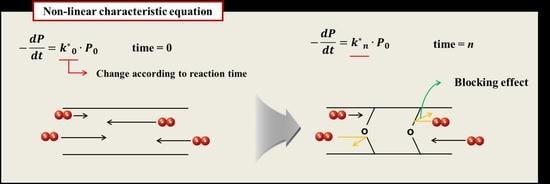
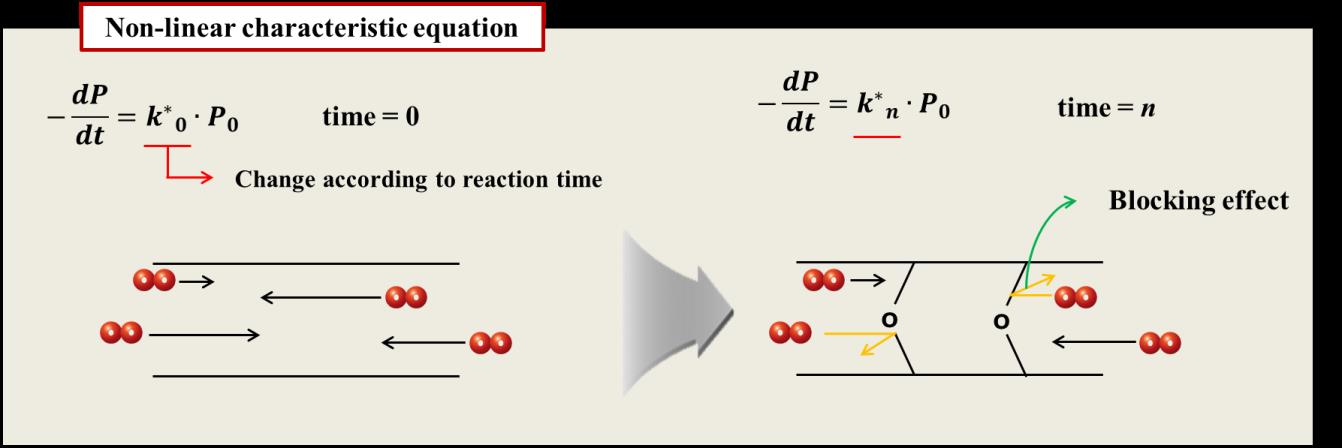
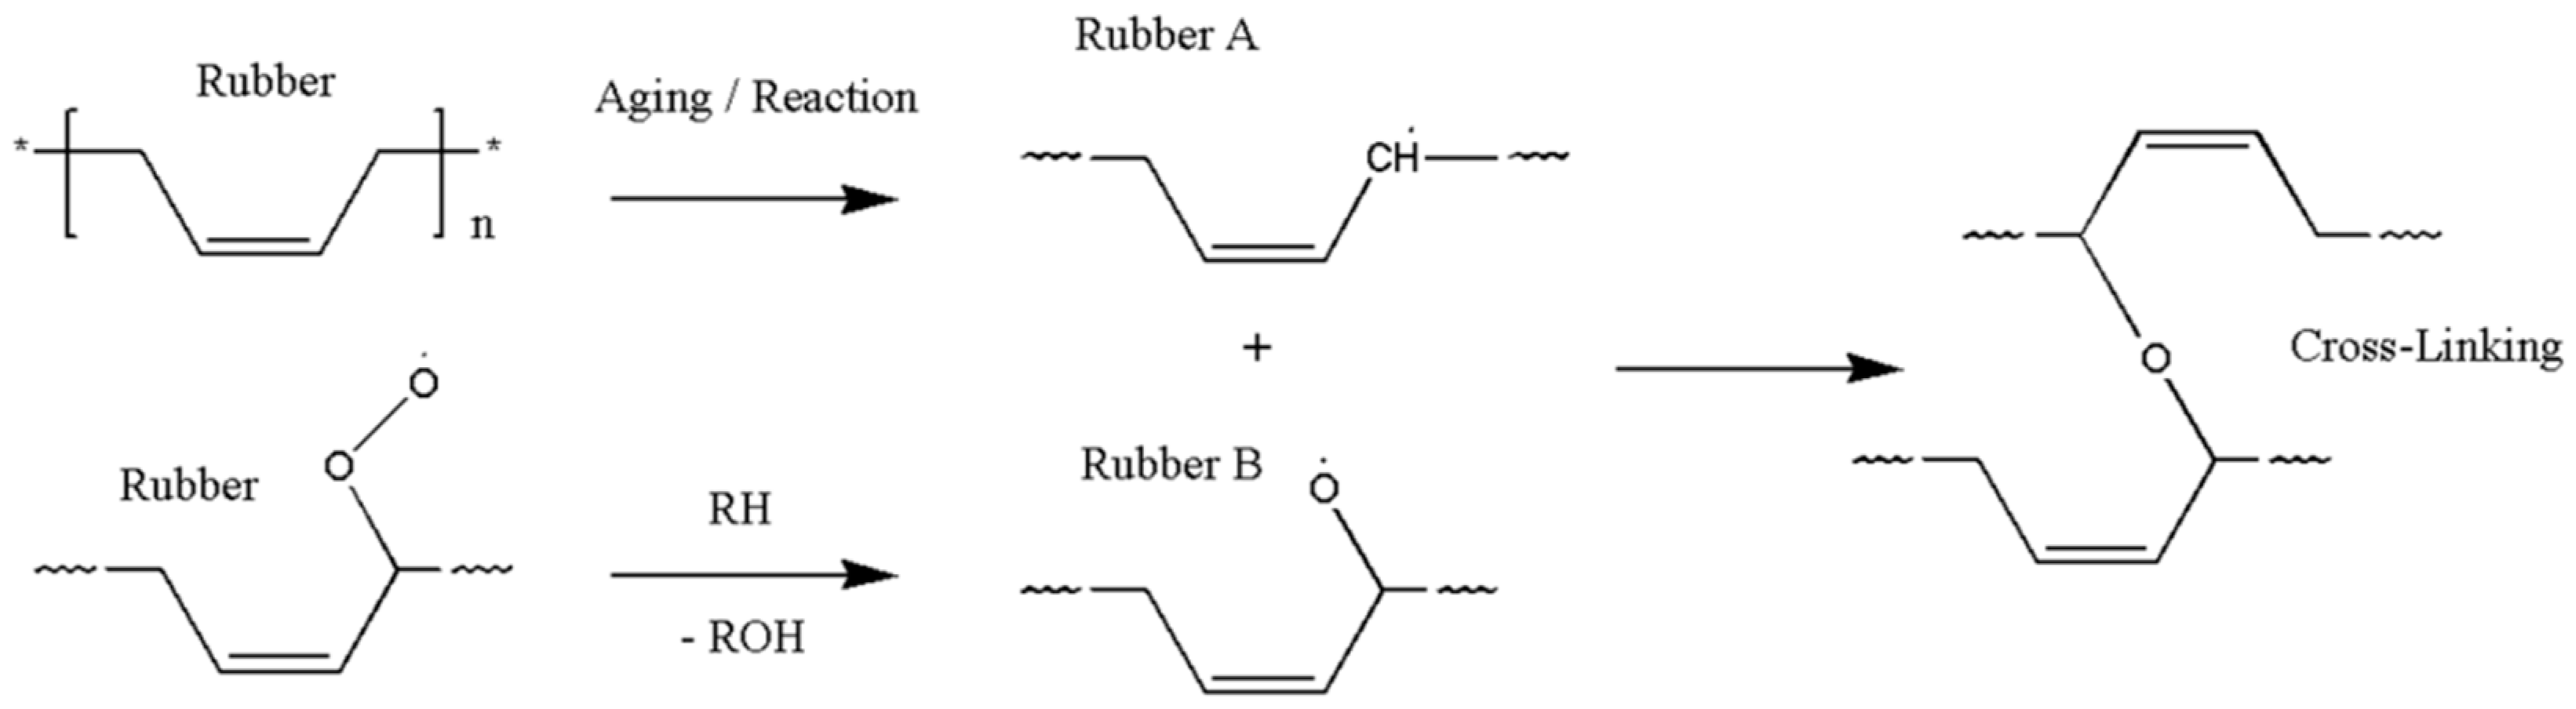
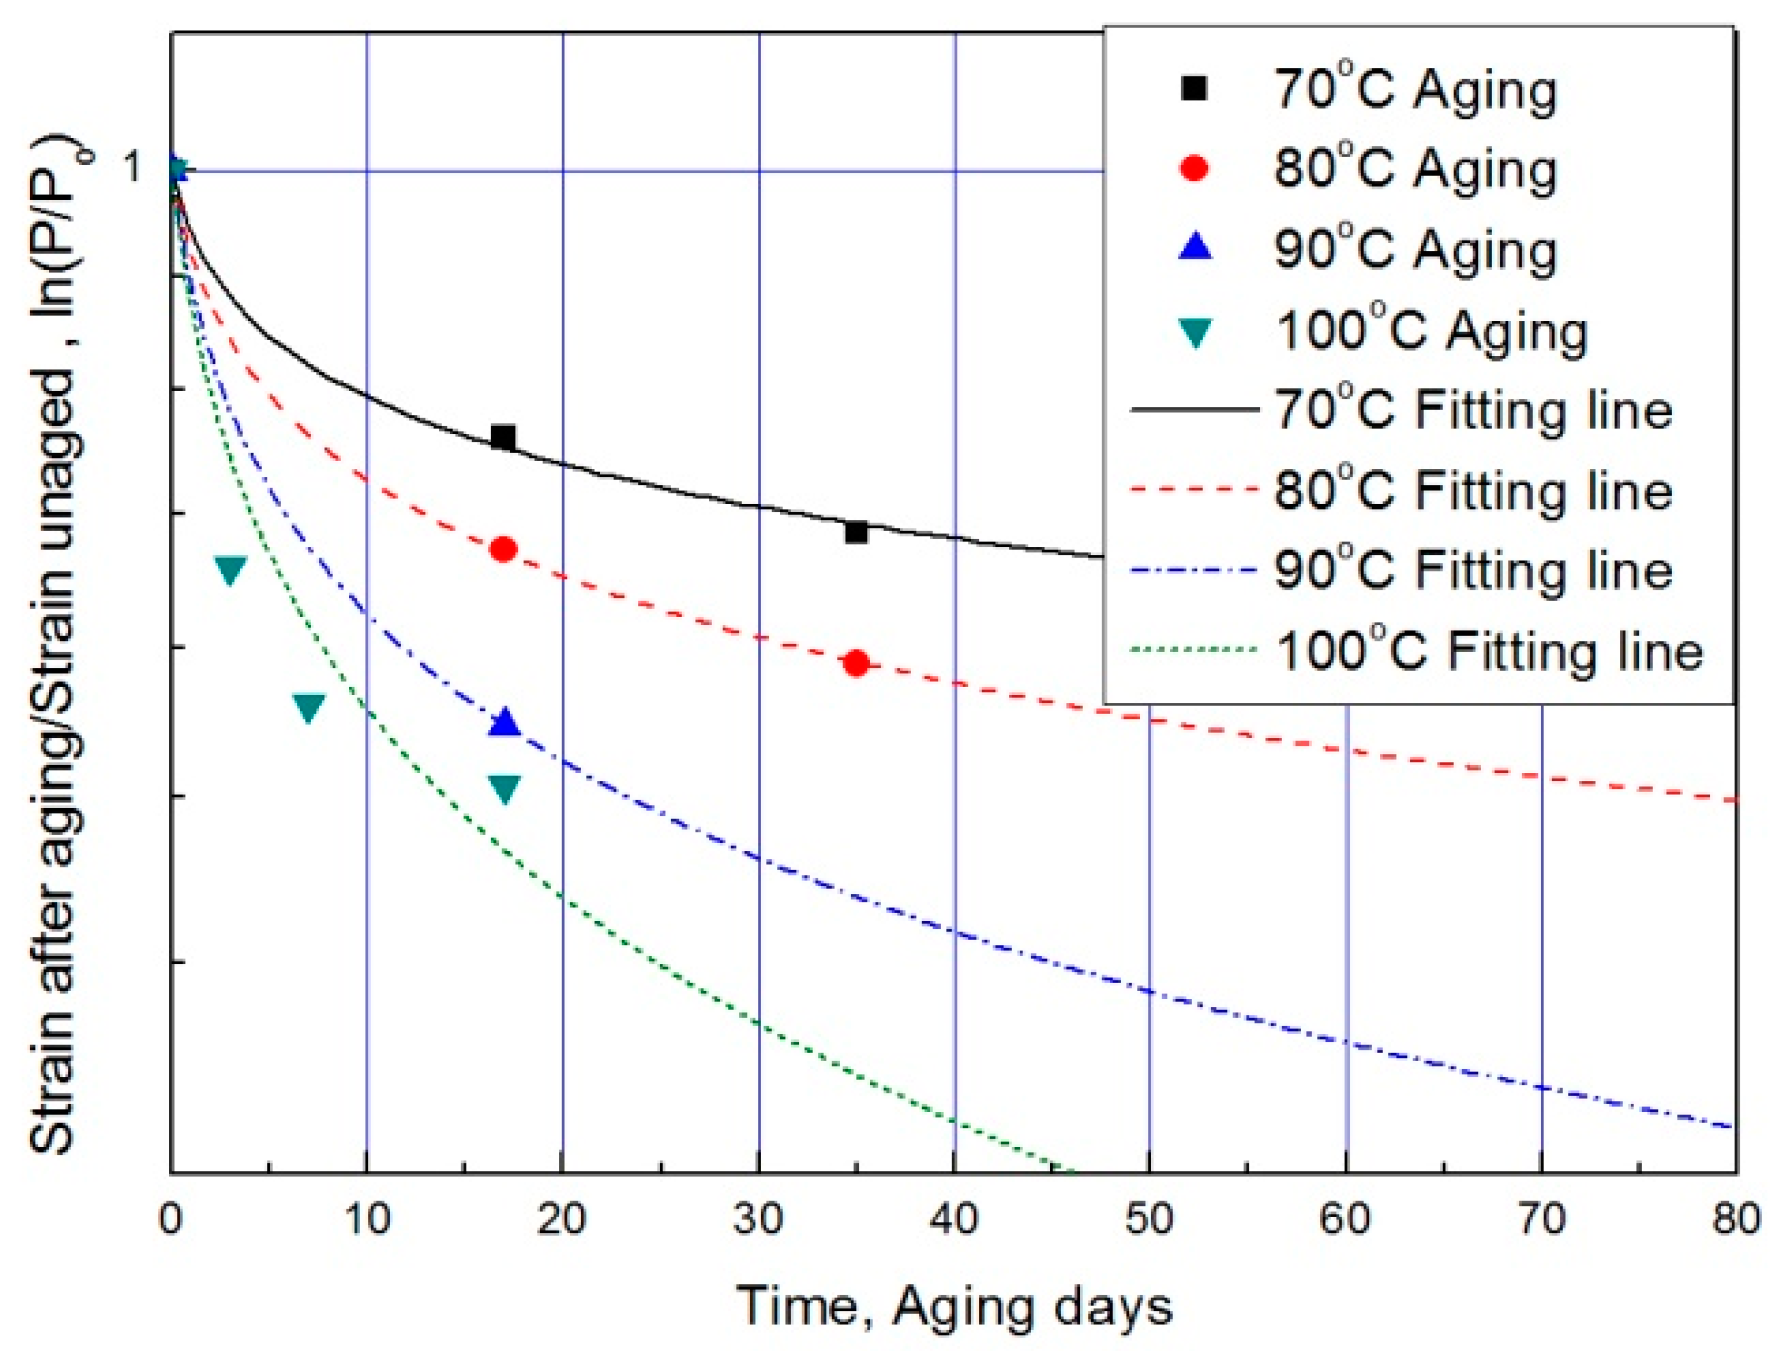
- In a general characteristic equation, the properties decreased linearly in proportion to reaction rate constant and time. However, in most cases, the reaction rate of the characteristic value decreased as the aging time increased. The reason that the reaction rate of the polymer decreased as the aging progressed was because the probability of the rubber reacting with oxygen was reduced. In the case of rubber molecules, the crosslinking structure increased by aging interfered with the permeation of oxygen, and the reaction of the molecules was inhibited over time. Therefore, we formulated a relationship where the reaction rate constant was inversely proportional to time based on the experimental results. The modified characteristic equation was proposed as a function of time, and the modified Arrhenius equation was derived by substituting the time function for the characteristic equation.
- 2
- In the case of the general Arrhenius equation, the resulting average deviation between the calculated and experimental values was 42% or more. However, in the case of a modified characteristic equation as a function of time, we observed that the average deviation in the experimental and calculated value decreased considerably to within 17%. Consequently, comparisons of the nine experimental values obtained with different degradation conditions with the predicted values indicated that the accuracy of the modified Arrhenius equation was relatively high, with an average error of 3%. Thus, using a modified Arrhenius equation derived from an oxygen permeation block model could predict the aging behavior of rubber materials accurately.
- 3
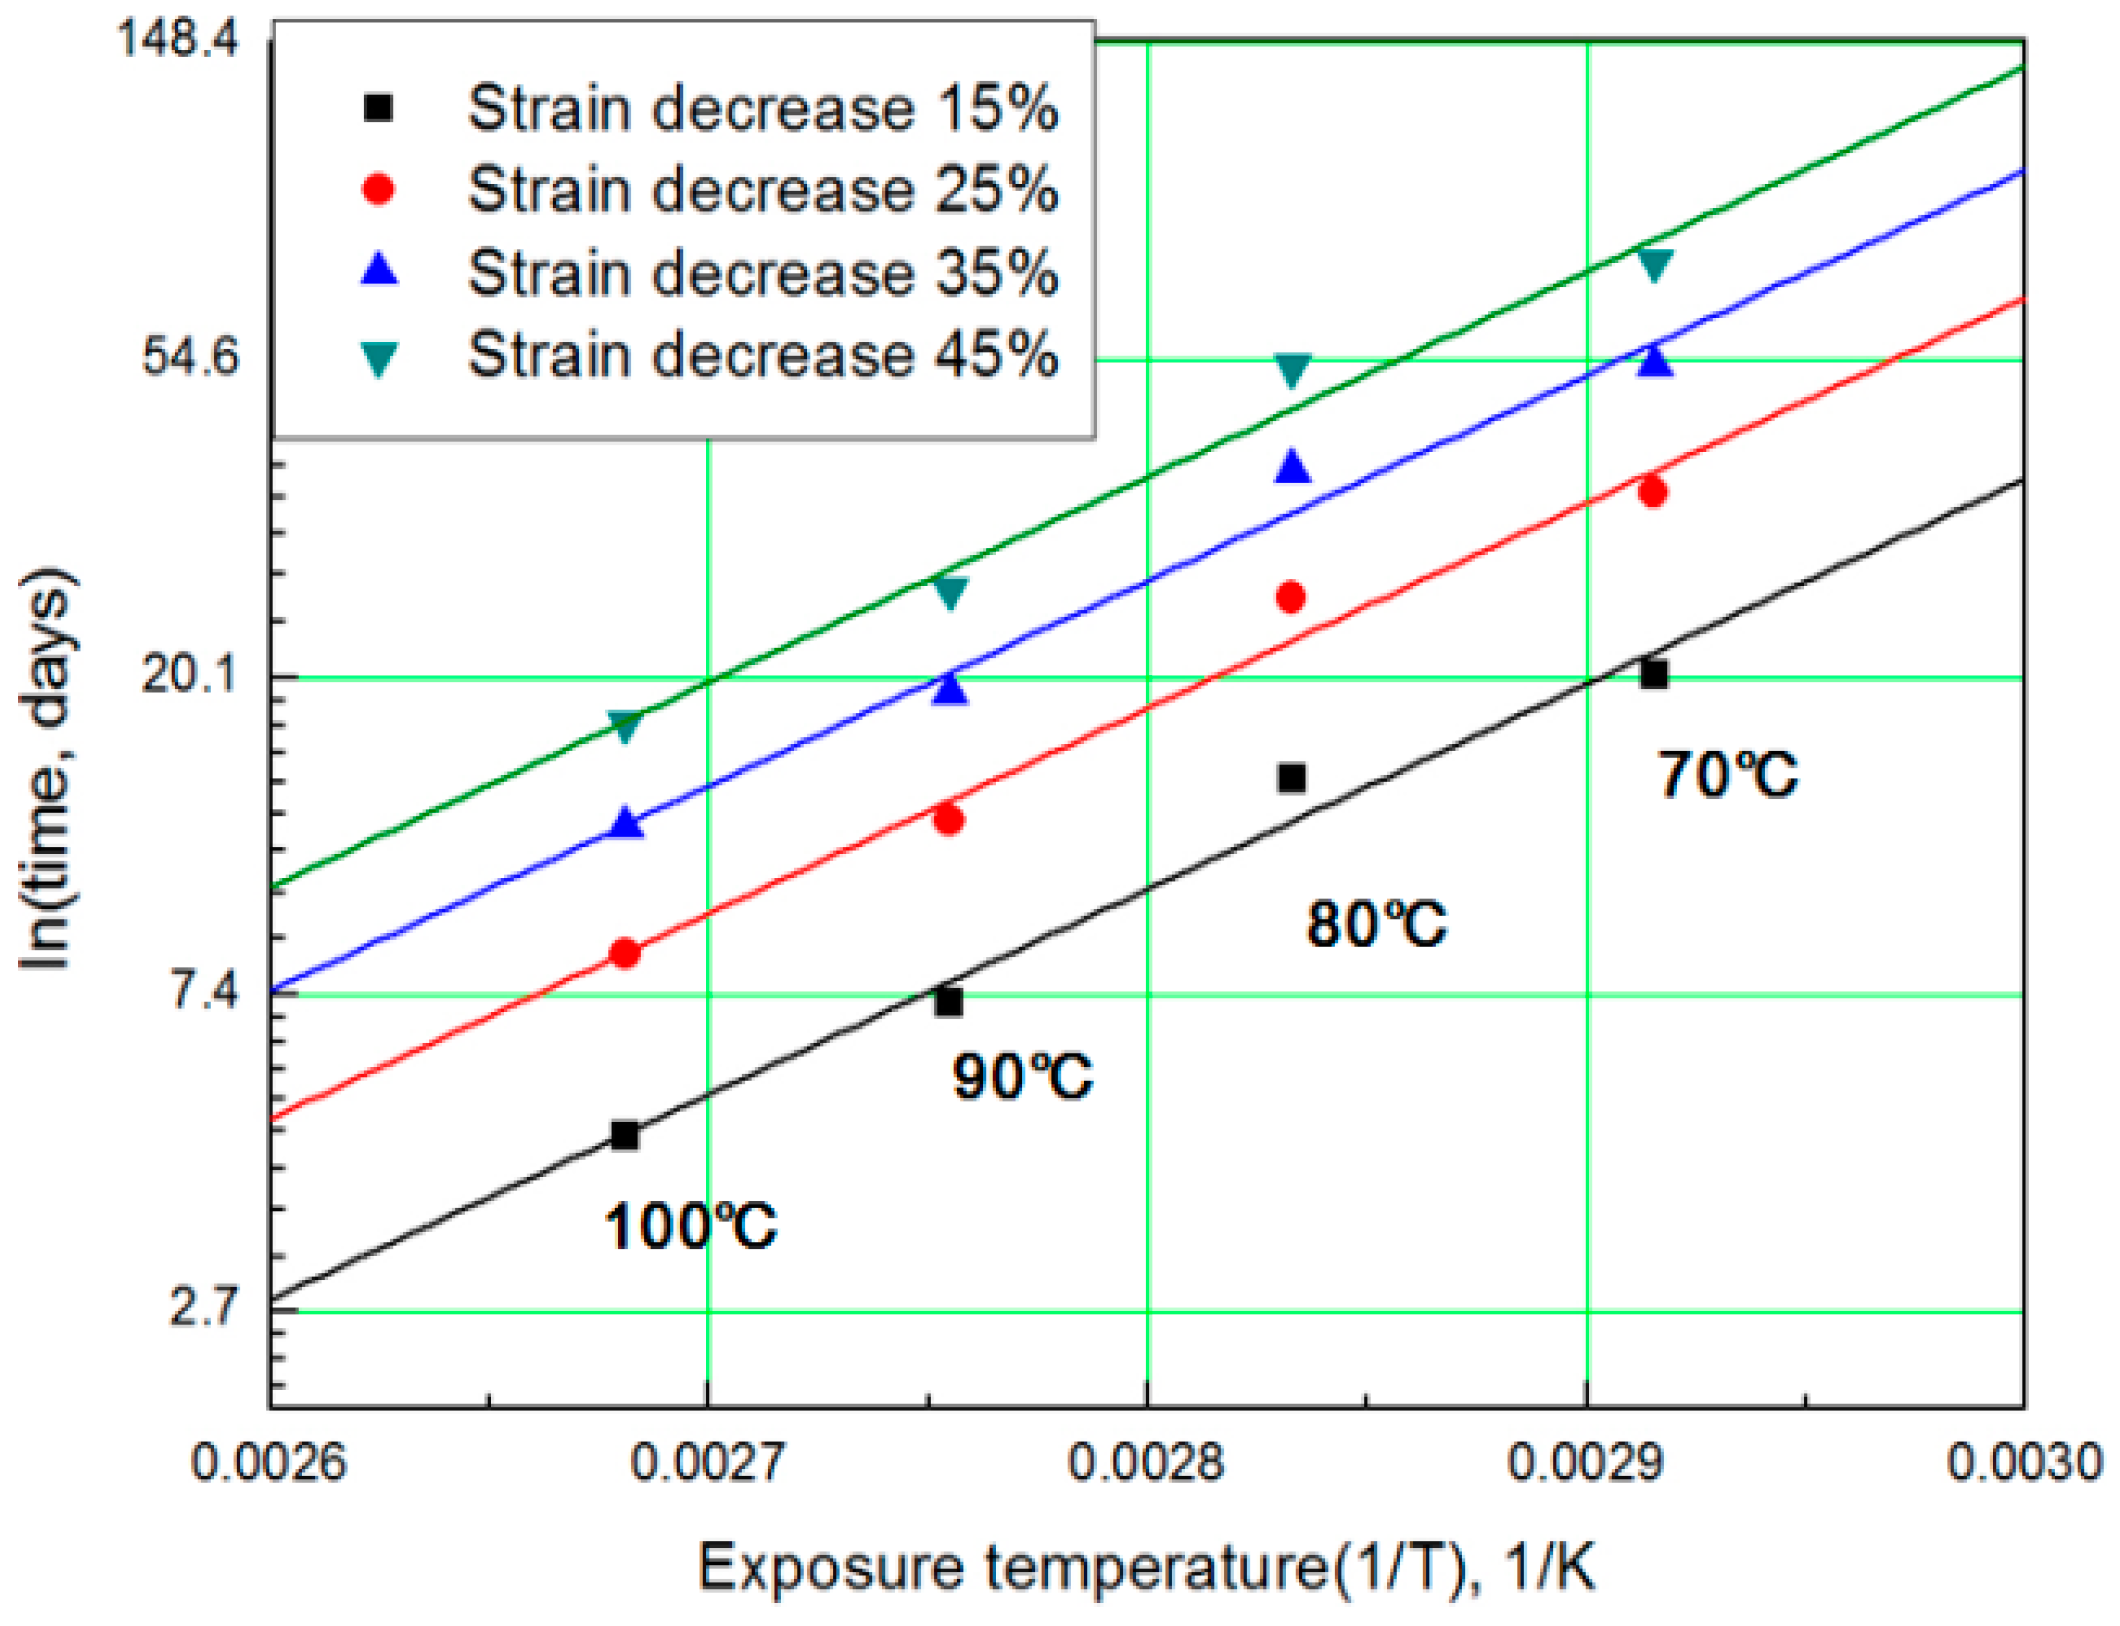
- By applying the modified Arrhenius equation, we derived the relationship between short-term high-temperature aging and long-term low-temperature aging, and suggested a method for predicting the degradation rate of rubber composites under all aging conditions. Therefore, it was possible to accurately predict changes in the characteristics of the rubber composites by performing the acceleration test, and the energy absorption rate and stability that changed with degradation rate could be considered quickly in the design stage.
Author Contributions
Funding
Acknowledgments
Conflicts of Interest
References
- Institute of Machinery and Materials. Development of Integrated Design System for Mechanical Rubber Components; Institute of Machinery and Materials: Daejeon, Korea, 2004; M1-9911-00-0014. [Google Scholar]
- Lee, T.K.; Kim, B.S. Vibration Analysis of Automobile Tire Due to Road Impact. J. Acoust. Soc. Korea 2003, 22, 505–5111. [Google Scholar]
- Hamza, S.S. Effect of Aging and Carbon Black on the Mechanical Properties of EPDM Rubber. Polym. Test. 1998, 17, 131–137. [Google Scholar] [CrossRef]
- Rattanasoma, N.; Poonsuk, A.; Makmoon, T. Effect of curing system on the mechanical properties and heat aging resistance of natural rubber/tire tread reclaimed rubber blends. Polym. Test. 2005, 24, 728–732. [Google Scholar] [CrossRef]
- Moon, B.W.; Kim, Y.S.; Jun, N.G.; Koo, J.M.; Seok, C.S.; Hong, U.S.; Oh, M.K.; Kim, S.R. A study on the Fatigue Characteristics and Life Prediction of the Tire Sidewall Rubber. Trans. Korean Soc. Mech. Eng. A 2017, 41, 629–634. [Google Scholar]
- Morrell, P.R.; Patel, M.; Skinner, A.R. Accelerated thermal ageing studies on nitrile rubber O-rings. Polym. Test. 2002, 22, 651–656. [Google Scholar] [CrossRef]
- Gillen, K.T.; Celina, M.; Keenan, M.R. Methods for Prediction More Confident Lifetimes of Seals in Air Environments. Rubber Chem. Technol. 2000, 73, 265–283. [Google Scholar] [CrossRef]
- Bystritskaya, E.V.; Monakhova, T.V.; Ivanov, V.B. TGA application for optimizing the accelerated aging conditions and predictions of thermal aging of rubber. Polym. Test. 2013, 32, 197–201. [Google Scholar] [CrossRef]
- Kim, W.S.; Woo, C.S.; Cho, S.J.; Kim, W.D. Prediction of Useful Life by Heat Aging of Motor Fan Isolating Rubber. Elastom. Compos. 2002, 37, 107–114. [Google Scholar]
- Han, S.W.; Kwak, S.B.; Choi, N.S. Accelerated Life Prediction of Ethylene-Propylene Diene Monomer Rubber Subjected to Combined Degradation. Trans. Korean Soc. Mech. Eng. A 2014, 38, 505–511. [Google Scholar] [CrossRef]
- American Society for Testing and Materials. Standard Test Methods for Vulcanized Rubber and Thermoplastic Elastomers; ASTM D412; ASTM International: West Conshohocken, PA, USA, 2015. [Google Scholar]
- Lee, D.W.; Kim, S.R.; Sung, K.D.; Park, J.S.; Lee, T.W.; Huh, S.C. A study on the fatigue life prediction of tire belt-layers using probabilistic method. J. Mech. Sci. Technol. 2013, 27, 673–678. [Google Scholar] [CrossRef]
- Mars, W.V.; Fatemi, A. A Literature Survey on Fatigue Analysis Approaches for Rubber. Int. J. Fatigue 2002, 24, 949–961. [Google Scholar] [CrossRef]
- Moon, B.W.; Lee, J.M.; Park, S.; Seok, C.S. Study on the Aging Behavior of Natural Rubber/Butadiene Rubber (NR/BR) Blends Using a Parallel Spring Model. Polymers 2018, 10, 658. [Google Scholar] [CrossRef]
- Mullins, L. Softening of Rubber by Deformation. Rubber Chem. Technol. 1969, 42, 339–362. [Google Scholar] [CrossRef]
- American Society for Testing and Materials. Standard Test Method for Rubber Property-Extension Cycling Fatigue; ASTM D4482; ASTM International: West Conshohocken, PA, USA, 2011. [Google Scholar]
- Gillen, K.T.; Celina, M.; Clough, R.L. Wise Extrapolation of accelerated aging data e Arrhenius or erroneous? Trends Polym. Sci. 1997, 5, 250–257. [Google Scholar]
- International Organization for Standardization. Rubber, Vulcanized or Thermoplastic Estimation of Life-Time and Maximum Temperature of Use; ISO11346; ISO: Geneva, Switzerland, 2014. [Google Scholar]
- Yu, G.S.; Lee, N.-R.; Yeo, Y.-H.; Lee, B.-C. Accelerated Life Prediction of the Rubber for Combat Boots. J. Korea Acad.-Ind. Coop. Soc. 2015, 16, 8637–8642. [Google Scholar]
- Deuri, A.S.; Bhowmick, A.K. Aging of EPDM rubber. Appl. Polym. 1987, 34, 2205–2222. [Google Scholar] [CrossRef]
- Gillen, K.T.; Celina, M.; Bernstein, R. Validation of improved methods for predicting long-term elastomeric seal lifetimes from compression stress-relaxation and oxygen consumption techniques. Polym. Degrad. Stab. 2003, 82, 25–35. [Google Scholar] [CrossRef]
- Budrugeac, P. Thermal lifetime evaluation of polymeric materials exhibiting a compensation effect and dependence of activation energy on the degree of conversion. Polym. Degrad. Stab. 1995, 50, 241–246. [Google Scholar] [CrossRef]
- Gillen, K.T.; Bernstein, R.; Derzon, D.K. Evidence of non-Arrhenius behaviour from laboratory aging and 24-year field aging of polychloroprene rubber materials. Polym. Degrad. Stab. 2005, 87, 57–67. [Google Scholar] [CrossRef]
- Brown, R.P. Practical Guide to the Assessment of the Useful Life of Rubbers; Shawbury Rapra Technol. Limited. iSmithers Rapra Publishing: Shawbury, UK, 2001. [Google Scholar]
- Celina, M.; Gillen, K.T.; Assink, R.A. Accelerated aging and lifetime prediction: Review of non-Arrhenius behaviour due to two competing processes. Polym. Degrad. Stab. 2005, 90, 395–404. [Google Scholar] [CrossRef]
- Bernstein, R.; Derzon, D.K.; Gillen, K.T. Nylon 6.6 accelerated aging studies: Thermal-oxidative degradation and its interaction with hydrolysis. Polym. Degrad. Stab. 2005, 88, 480–488. [Google Scholar] [CrossRef]
- Rincon-Rubio, L.M.; Colin, X.; Audouin, L.; Verdu, J.A. theoretical model for the diffusion-limited thermal oxidation of elastomers at medium temperatures. Rubber Chem. Technol. 2003, 76, 460–482. [Google Scholar] [CrossRef]
- Celina, M.; Wise, J.; Ottesen, D.K.; Gillen, K.T.; Clough, R.L. Correlation of chemical and mechanical property changes during oxidative degradation of neoprene. Polym. Degrad. Stab. 2000, 68, 171–184. [Google Scholar] [CrossRef]
- Li, D.; Zhu, S.; Hamielec, A.E. E.s.r. study on permeation of oxygen in crosslinked polymers. Polymer 1993, 34, 1383–1387. [Google Scholar] [CrossRef]
- George, S.C.; Thomas, S. Transport phenomena through polymeric systems. Prog. Polym. Sci. 2000, 26, 985–1017. [Google Scholar] [CrossRef]
- Razur, R.J. Activation energy of poly(isobutylene) under thermo-oxidative conditions from 40 to 100 °C. Polym. Degrad. Stab. 2014, 104, 57–61. [Google Scholar]
- Le Saux, V.; Le Gac, P.Y.; Marco, Y.; Cal-loch, S. Limits in the validity of Arrhenius pre-dictions for field ageing of a silica filled polychloroprene in a marine environment. Polym. Degrad. Stab. 2014, 99, 254–261. [Google Scholar] [CrossRef]


| Degradation Condition | |||||
|---|---|---|---|---|---|
| Aging temp. (°C) | 23 | 70 | 80 | 90 | 100 |
| Aging time (Day) | - | 17, 35 | 17, 35 | 17 | 3, 7, 17 |
| Aging (°C, day) | Coefficient Number, a | Exponential Term, b |
|---|---|---|
| Unaged | 0.802 | 1.647 |
| 70, 17 | 1.088 | 1.685 |
| 70, 35 | 1.238 | 1.835 |
| 80, 17 | 1.244 | 1.706 |
| 80, 35 | 1.462 | 1.836 |
| 90, 17 | 1.530 | 1.709 |
| 100, 3 | 1.289 | 1.816 |
| 100, 7 | 1.515 | 1.764 |
| 100, 17 | 1.639 | 1.700 |
| Aging (°C) | 70 | 80 | 90 | 100 |
|---|---|---|---|---|
| Reaction rate constant (k) | 0.00801 | 0.01115 | 0.02253 | 0.03430 |
| Property (P/P0) | Equivalent Degradation Conditions | |
|---|---|---|
| T (°C) | Days | |
| 0.75 | 23 | 786 |
| 70 | 39 | |
| 80 | 23 | |
| 90 | 13 | |
| 100 | 9 | |
| Aging (°C) | 70 | 80 | 90 | 100 |
|---|---|---|---|---|
| Reaction rate constant (k*) | 0.060 | 0.080 | 0.110 | 0.135 |
| Aging Condition | Normalized Property Value | Error | ||
|---|---|---|---|---|
| T (°C) | Days | Experimental | Predicted | |
| 70 | 17 | 0.832 | 0.824 | 1.0% |
| 70 | 35 | 0.779 | 0.779 | 0% |
| 80 | 17 | 0.770 | 0.773 | 0.4% |
| 80 | 35 | 0.711 | 0.719 | 1.1% |
| 90 | 17 | 0.682 | 0.699 | 2.5% |
| 100 | 3 | 0.761 | 0.802 | 5.4% |
| 100 | 7 | 0.691 | 0.695 | 0.6% |
| 100 | 17 | 0.654 | 0.582 | 11.0% |
| 17 (Room) | 365 | 0.907 | 0.859 | 5.3% |
| The Equivalent Degradation Conversion Table | |||||
|---|---|---|---|---|---|
| T (°C) | 17 | 40 | 60 | 80 | 100 |
| Day | 365 | 65 | 17.5 | 5.4 | 1.9 |
© 2019 by the authors. Licensee MDPI, Basel, Switzerland. This article is an open access article distributed under the terms and conditions of the Creative Commons Attribution (CC BY) license (http://creativecommons.org/licenses/by/4.0/).
Share and Cite
Moon, B.; Jun, N.; Park, S.; Seok, C.-S.; Hong, U.S. A Study on the Modified Arrhenius Equation Using the Oxygen Permeation Block Model of Crosslink Structure. Polymers 2019, 11, 136. https://doi.org/10.3390/polym11010136
Moon B, Jun N, Park S, Seok C-S, Hong US. A Study on the Modified Arrhenius Equation Using the Oxygen Permeation Block Model of Crosslink Structure. Polymers. 2019; 11(1):136. https://doi.org/10.3390/polym11010136
Chicago/Turabian StyleMoon, Byungwoo, Namgyu Jun, Soo Park, Chang-Sung Seok, and Ui Seok Hong. 2019. "A Study on the Modified Arrhenius Equation Using the Oxygen Permeation Block Model of Crosslink Structure" Polymers 11, no. 1: 136. https://doi.org/10.3390/polym11010136
APA StyleMoon, B., Jun, N., Park, S., Seok, C.-S., & Hong, U. S. (2019). A Study on the Modified Arrhenius Equation Using the Oxygen Permeation Block Model of Crosslink Structure. Polymers, 11(1), 136. https://doi.org/10.3390/polym11010136