Conformational Transitions of Polymer Chains in Solutions Characterized by Fluorescence Resonance Energy Transfer

Abstract

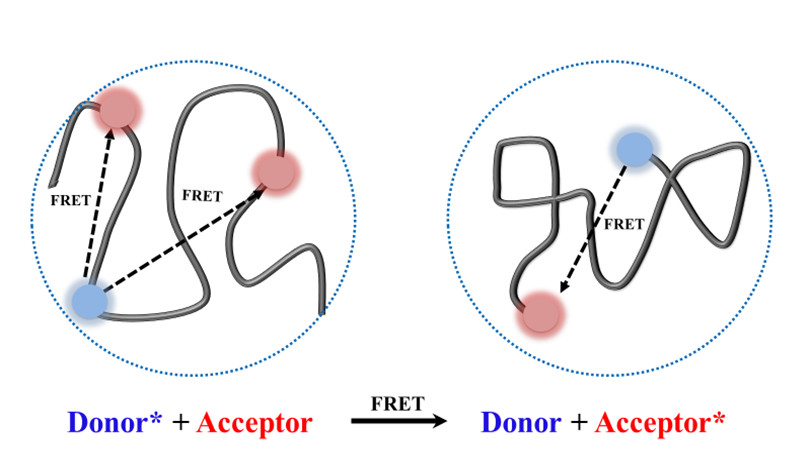
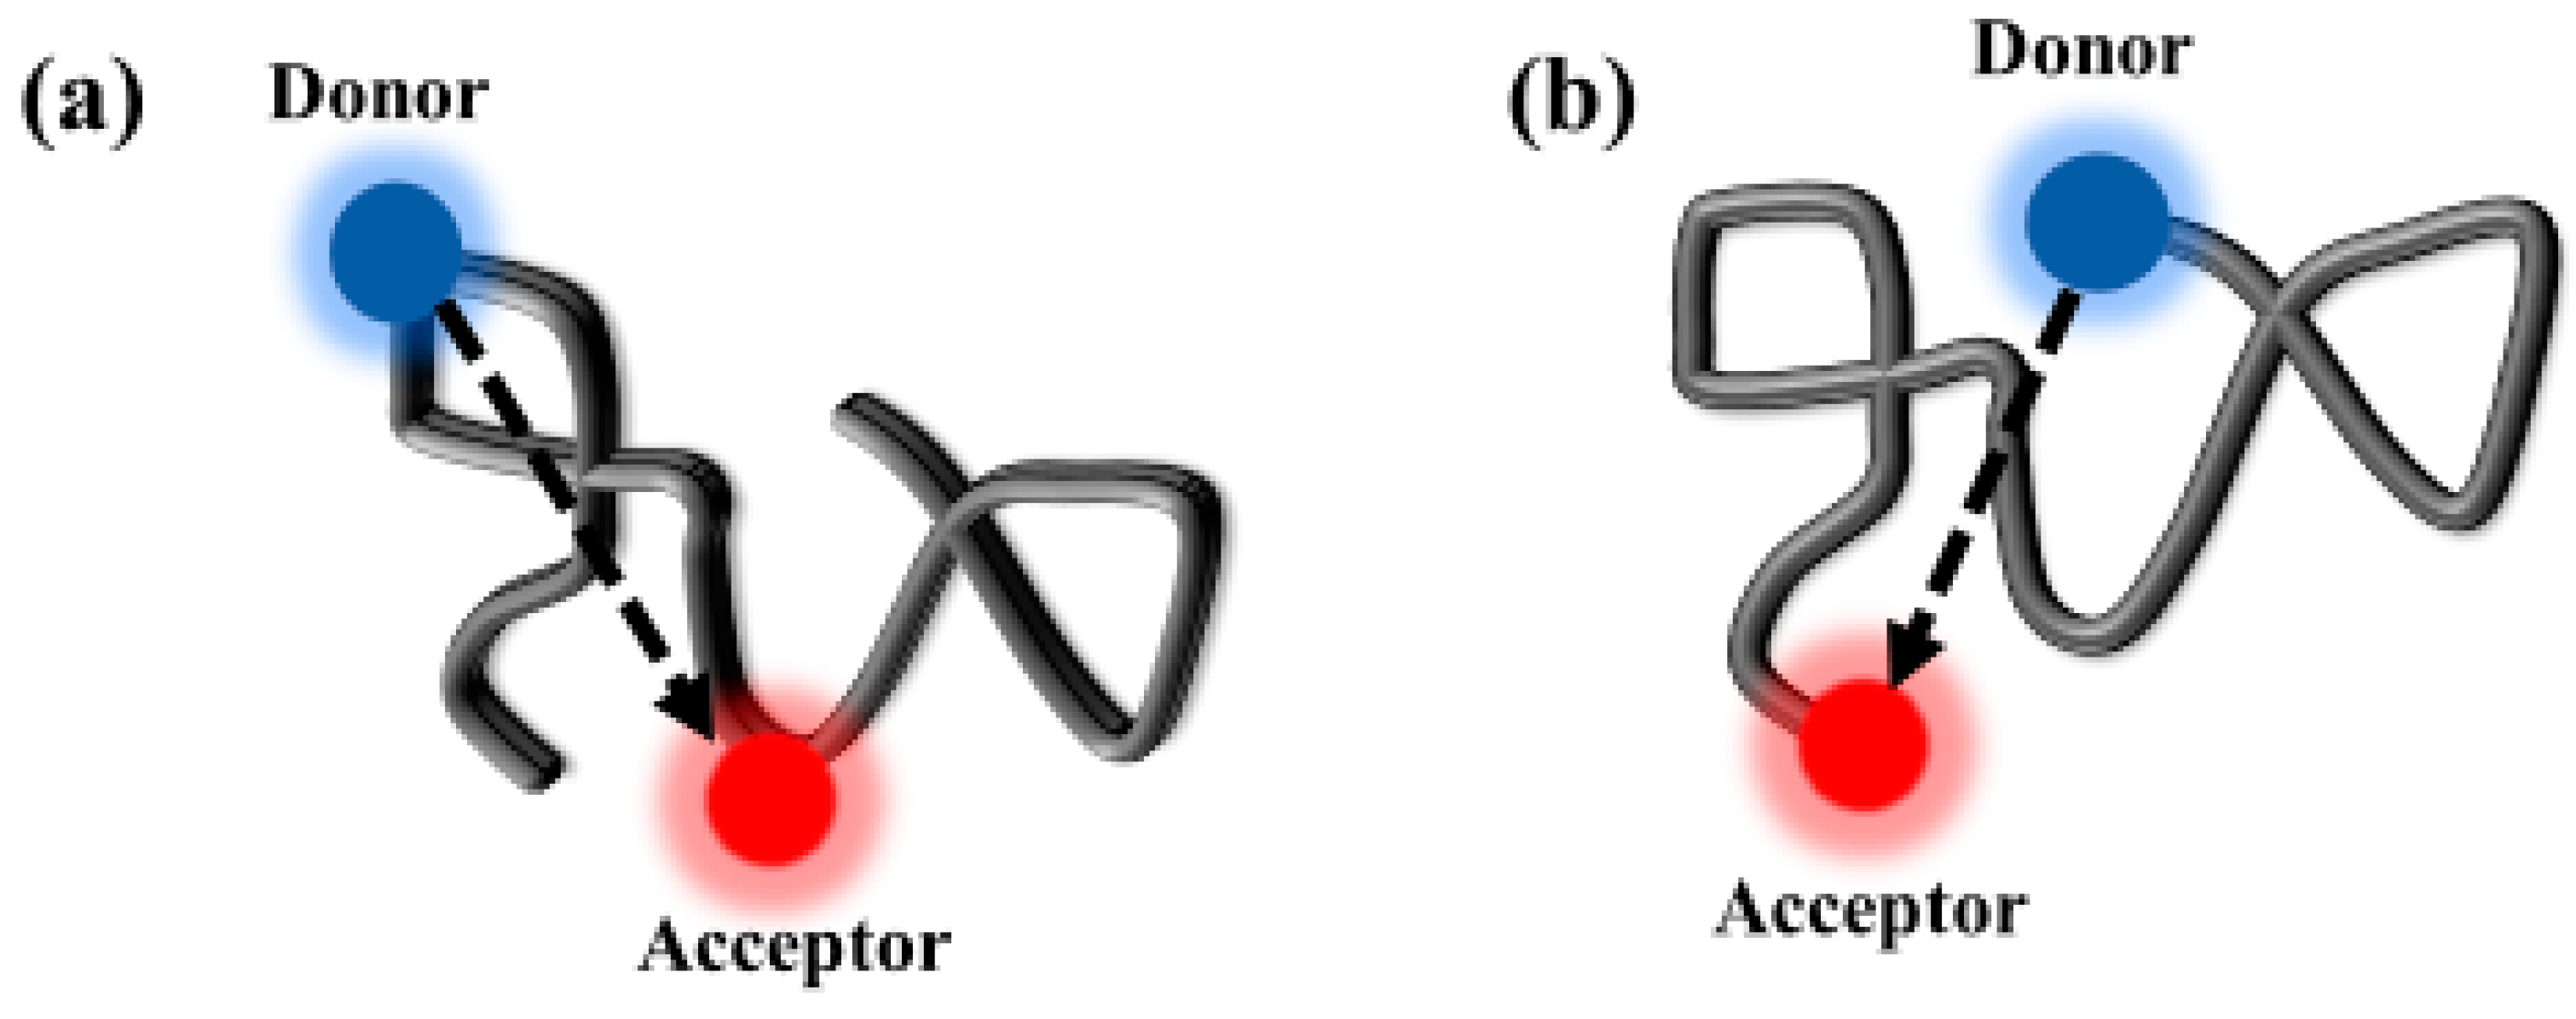
1. Introduction
2. Materials and Methods
2.1. Materials
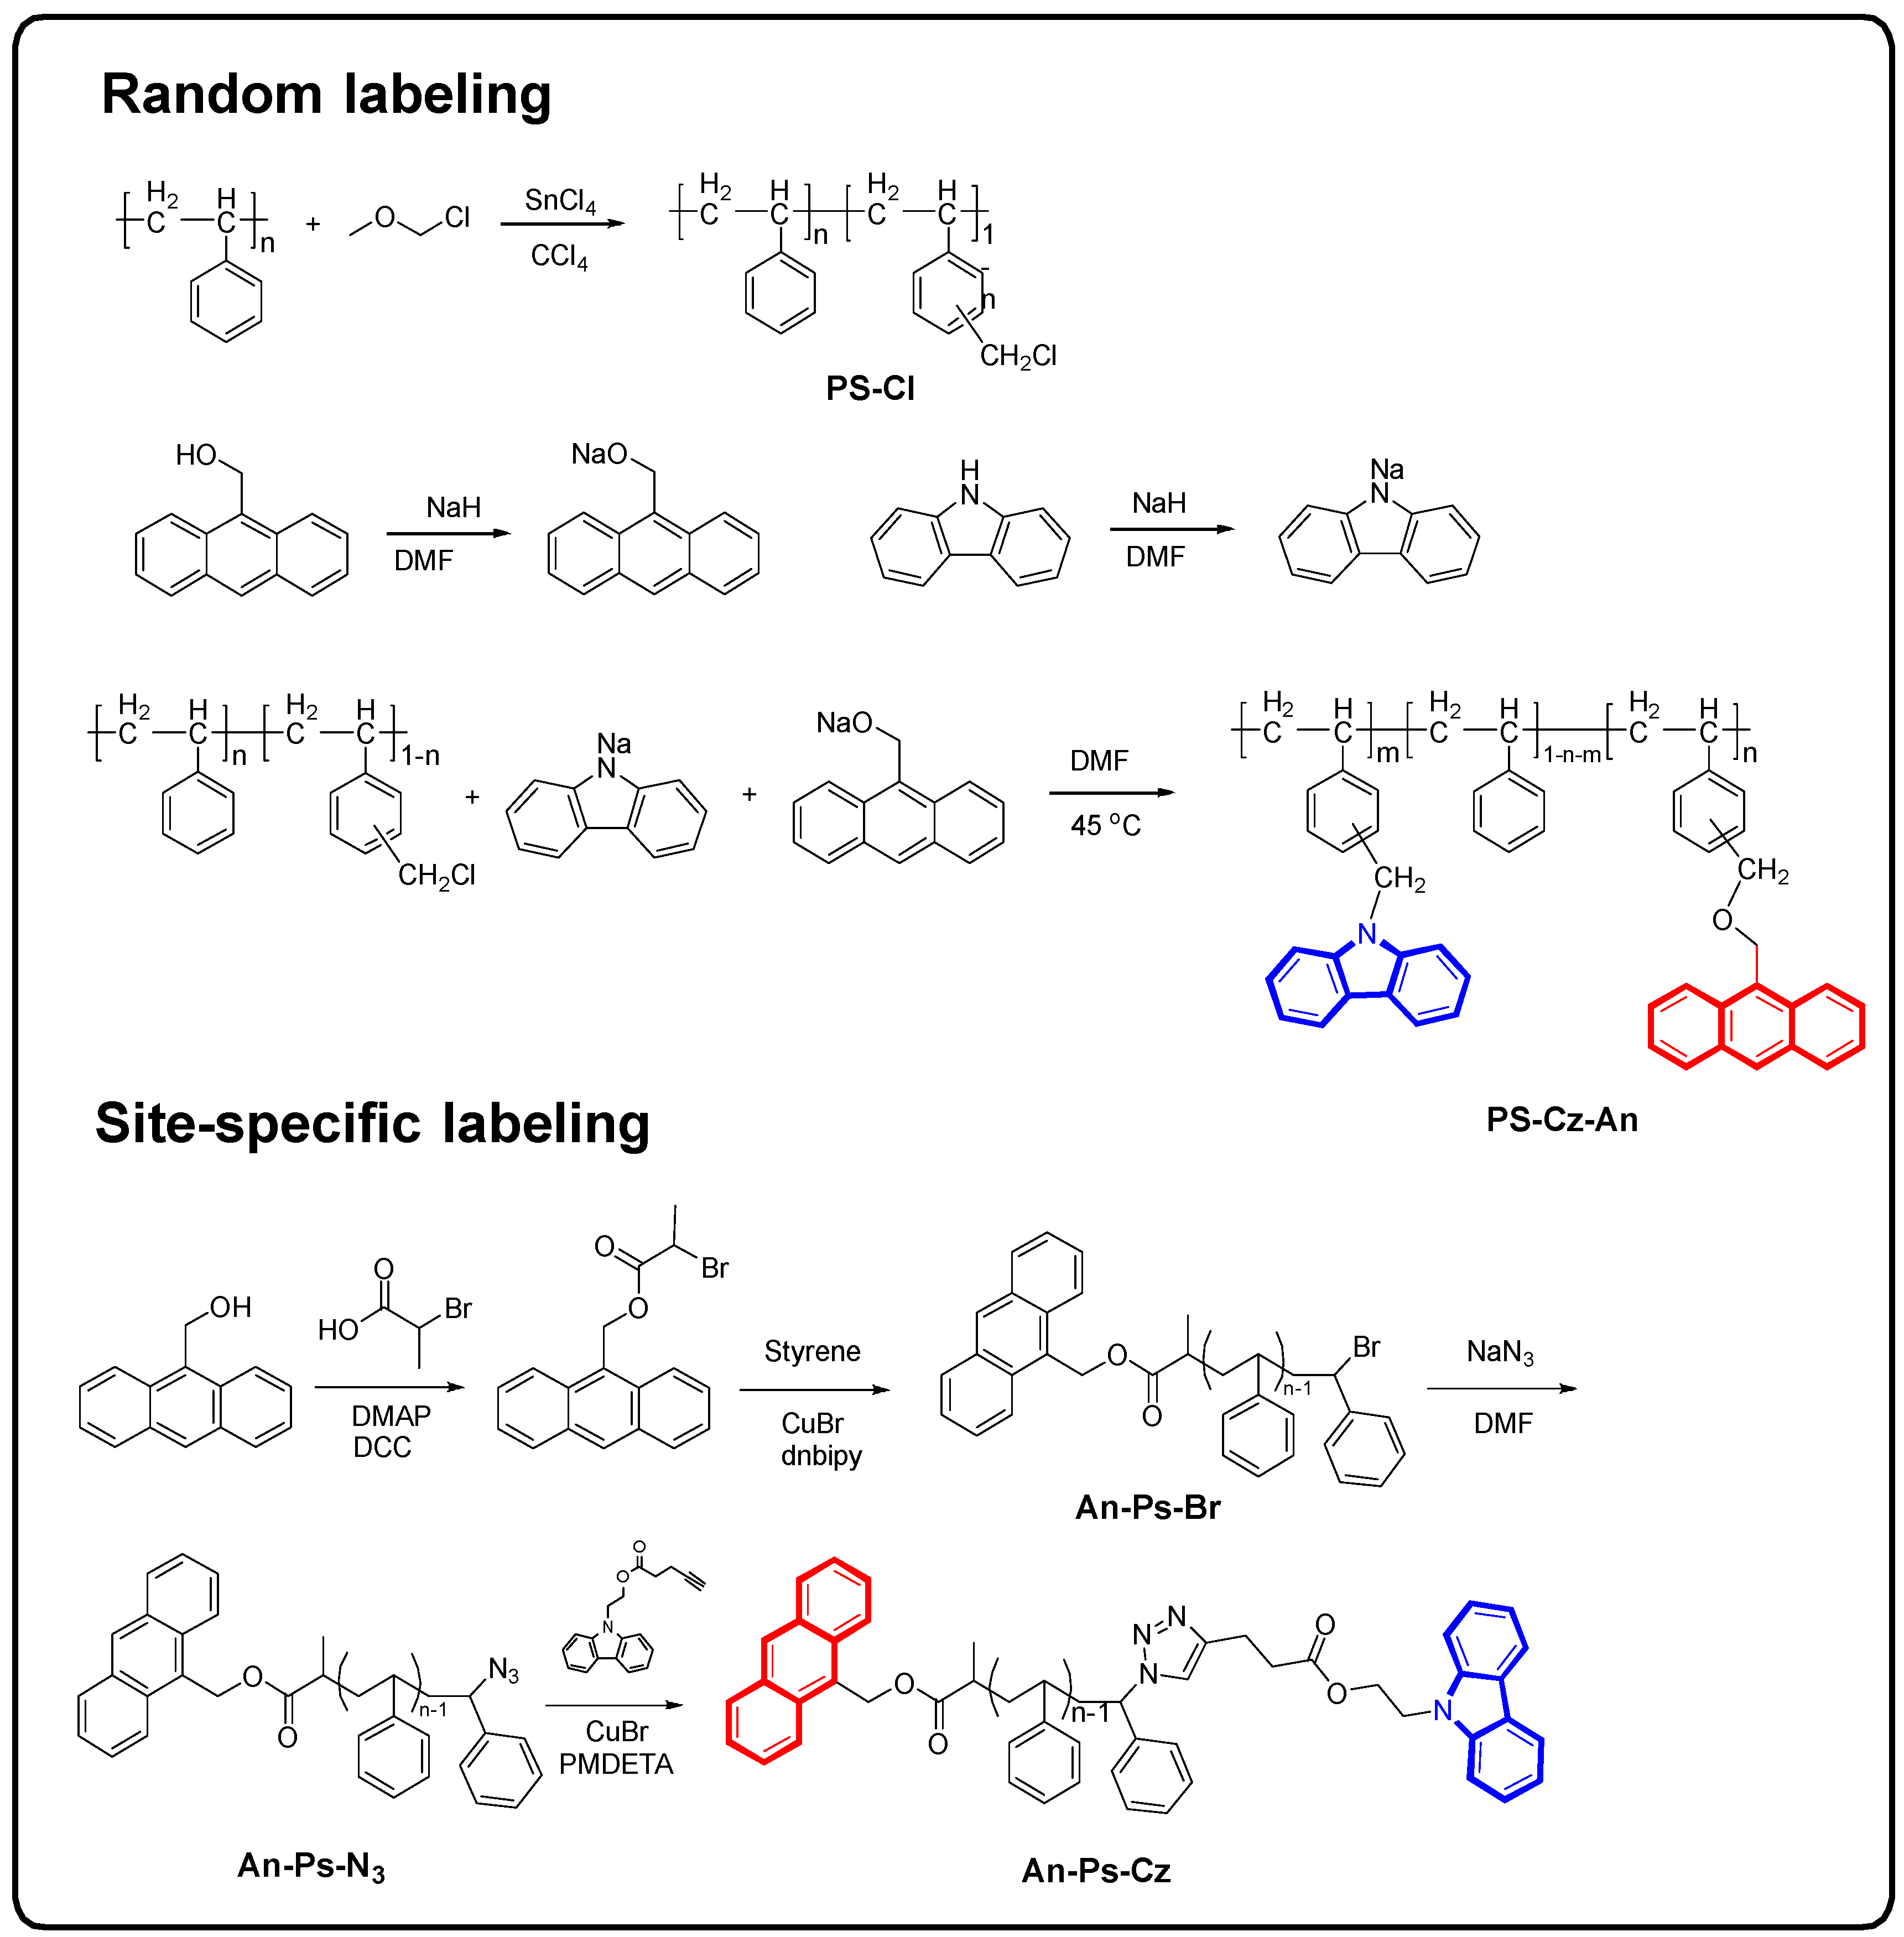
2.2. Samples Synthesis
2.3. Measurement
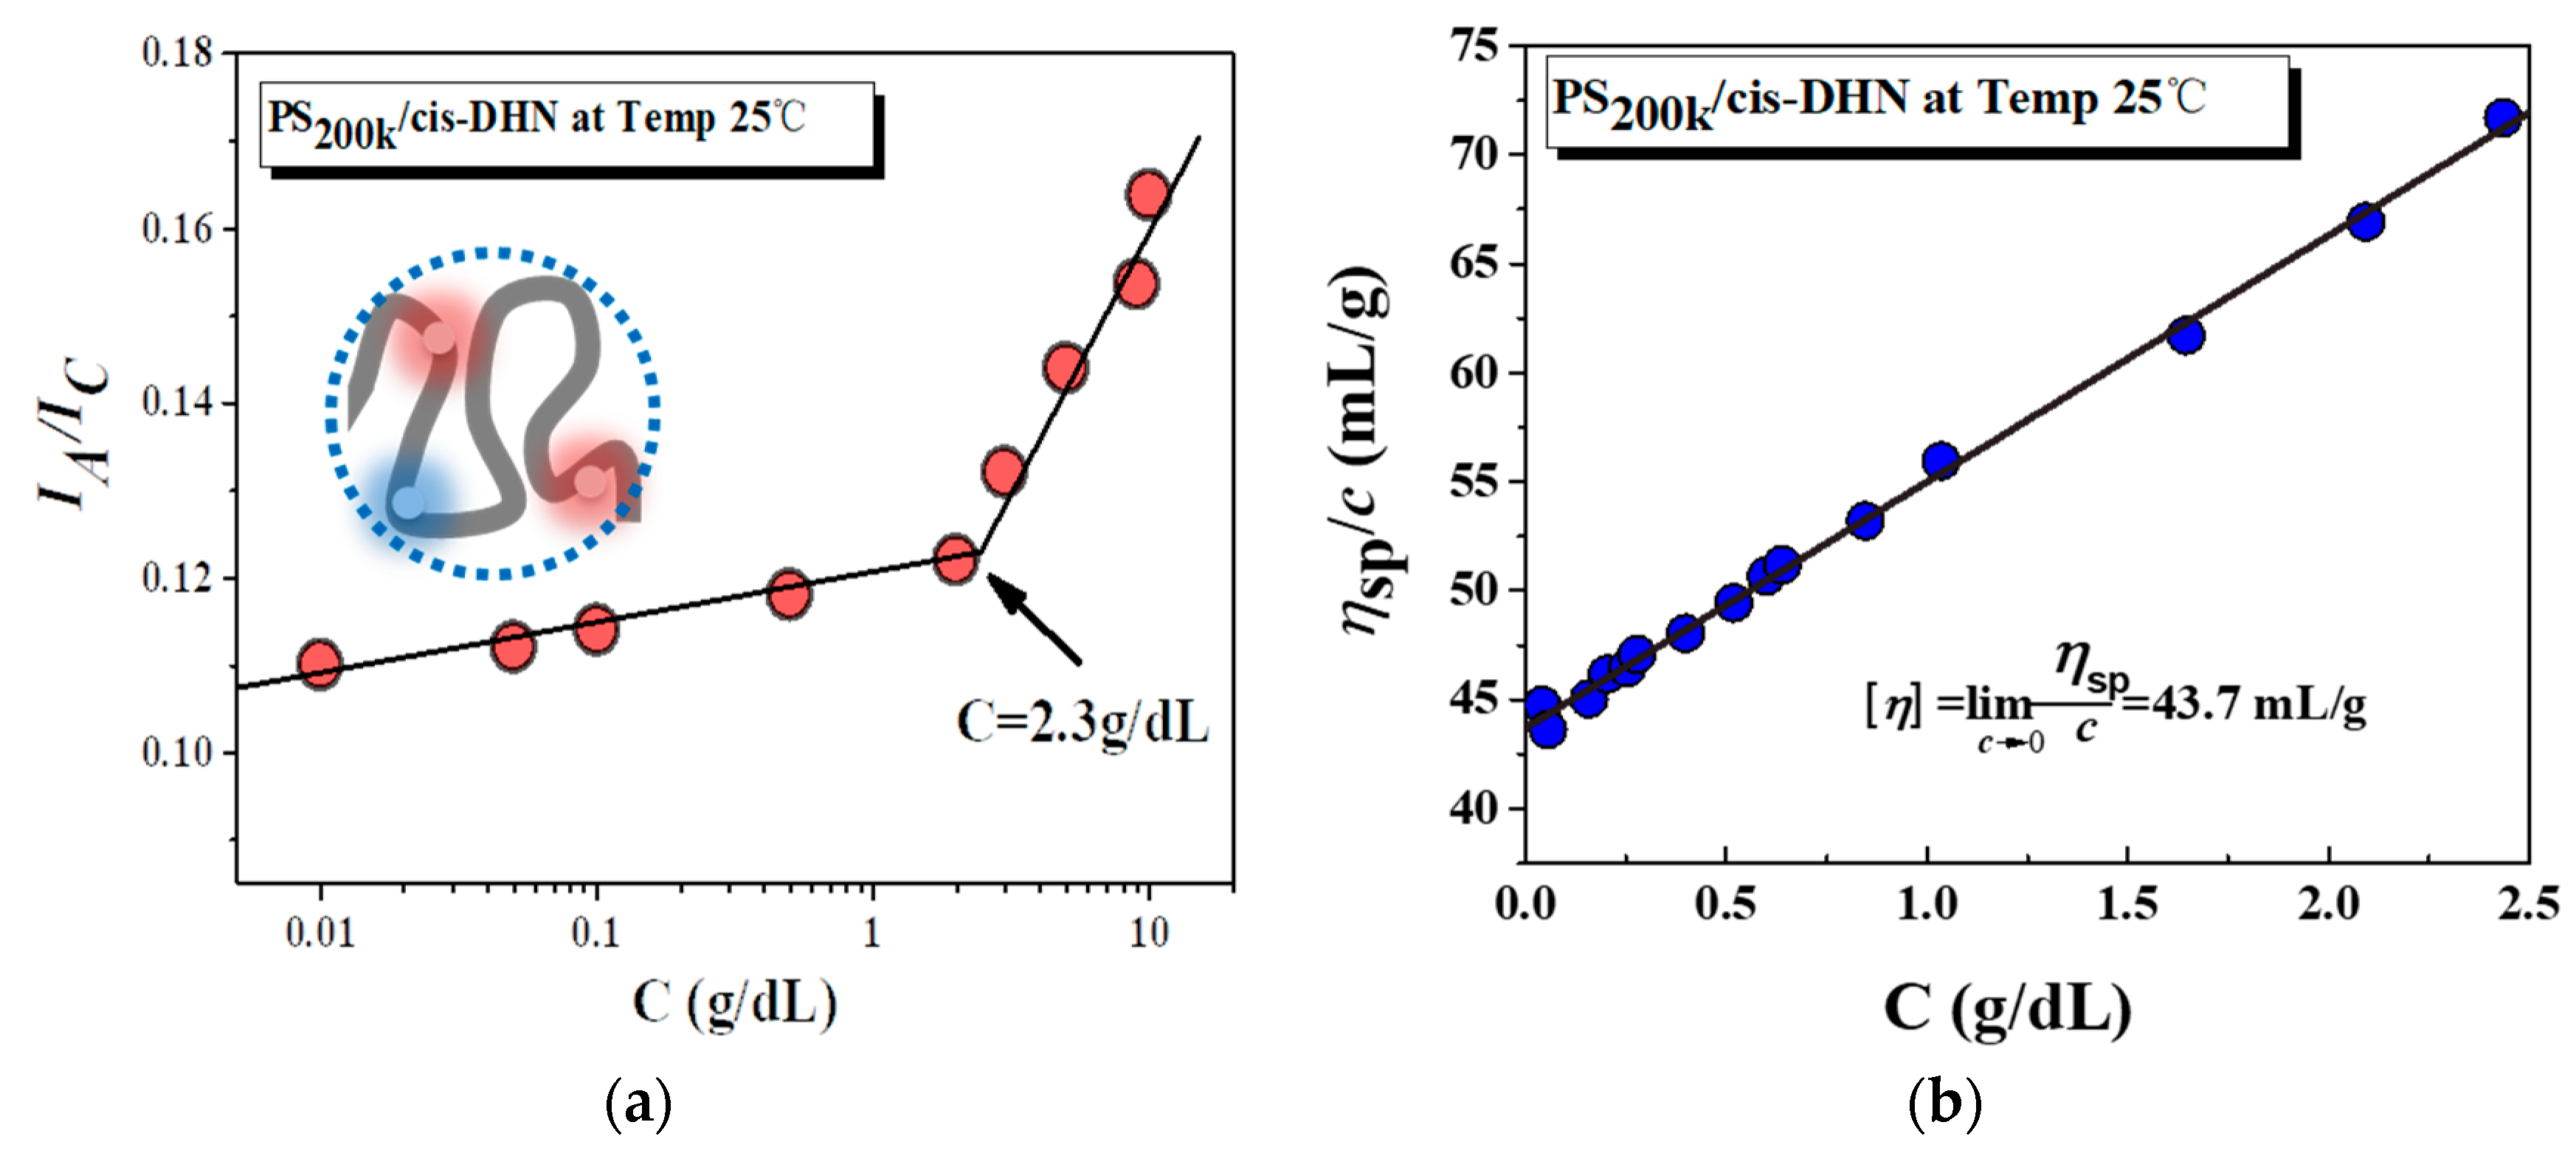
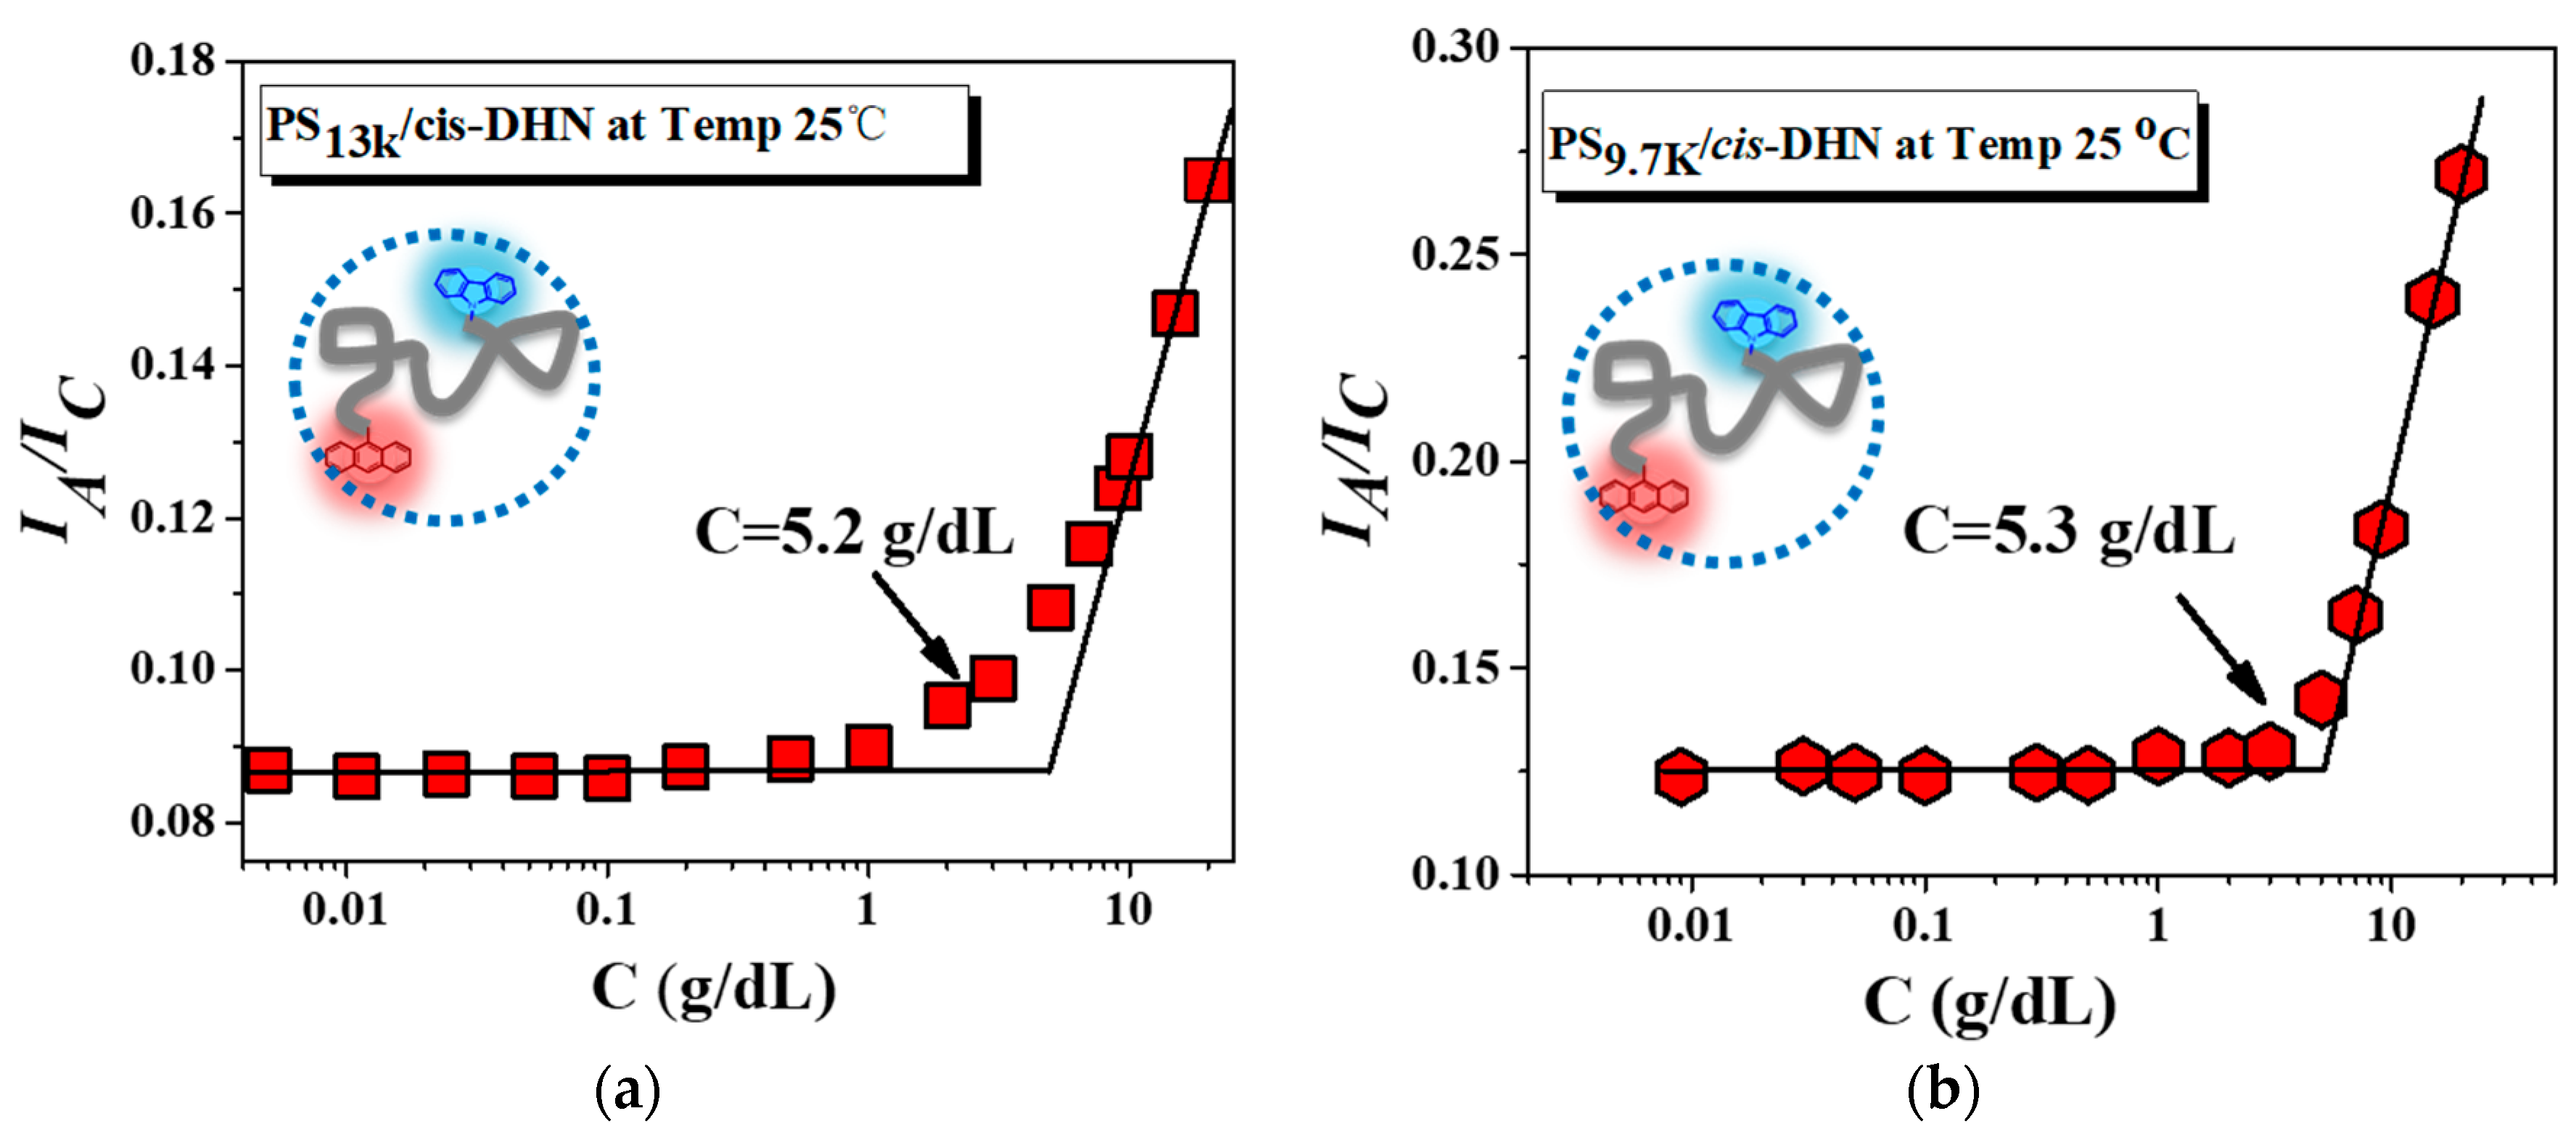
3. Results and Discussion
4. Conclusions
Author Contributions
Funding
Conflicts of Interest
References
- De Gennes, P.G. Scaling Concepts in Polymer Physics; Cornell University Press: Ithaca, NY, USA, 1979. [Google Scholar]
- Ying, Q.C.; Chu, B. Overlap concentration of macromolecules in solution. Macromolecules 1987, 20, 362–366. [Google Scholar] [CrossRef]
- Torkelson, J.M.; Gilbert, S.R. Determination of interpenetration of polystyrene in solution and film by energy-transfer techniques. Macromolecules 1987, 20, 1860–1865. [Google Scholar] [CrossRef]
- Tao, F.; Han, J.; Gu, Q.; Teng, C.; Zou, D.; Zhou, D.; Xue, G. Single and multichain association of polystyrene in solvents with various molecular sizes. Macromolecules 2008, 41, 9890–9895. [Google Scholar] [CrossRef]
- Daoud, M.; Jannink, G. Temperature-concentration diagram of polymer-solutions. J. Phys. 1976, 37, 973–979. [Google Scholar] [CrossRef]
- Gmachowski, L. Chain contraction at the critical overlap concentration. Polymer 2006, 47, 6257–6262. [Google Scholar] [CrossRef]
- Tassieri, M. Dynamics of semiflexible polymer solutions in the tightly entangled concentration regime. Macromolecules 2017, 50, 5611–5618. [Google Scholar] [CrossRef]
- Wang, Z.G. 50th anniversary perspective: Polymer conformation—A pedagogical review. Macromolecules 2017, 50, 9073–9114. [Google Scholar] [CrossRef]
- Russo, P.S. Dynamic light-scattering from ternary solutions of semiflexible polymers. Macromolecules 1985, 18, 2733–2738. [Google Scholar] [CrossRef]
- Liverpool, T.B.; Maggs, A.C. Dynamic scattering from semiflexible polymers. Macromolecules 2001, 34, 6064–6073. [Google Scholar] [CrossRef]
- Daoud, M.; Cotton, J.P.; Farnoux, B.; Jannink, G.; Sarma, G.; Benoit, H.; Duplessix, R.; Picot, C.; Gennes, P.G.D. Solutions of flexible polymers—Neutron experiments and interpretation. Macromolecules 1975, 8, 804–818. [Google Scholar] [CrossRef]
- Cotton, J.P.; Nierlich, M.; Boue, F.; Daoud, M.; Farnoux, B.; Jannink, G.; Duplessix, R.; Picot, C. Experimental-determination of temperature-concentration diagram of flexible polymer-solutions by neutron-scattering. J. Chem. Phys. 1976, 65, 1101–1108. [Google Scholar] [CrossRef]
- Cotton, J.P.; Jannink, G.; Farnoux, B. Neutron-diffraction in dilute and semidilute polymer-solutions. J. Chem. Phys. 1972, 57, 290–294. [Google Scholar] [CrossRef]
- Melnichenko, Y.B.; Wignall, G.D. Dimensions of polymer chains in critical semidilute solutions. Phys. Rev. Lett. 1997, 78, 686–688. [Google Scholar] [CrossRef]
- Williams, C.E.; Nierlich, M.; Cotton, J.P.; Jannink, G.; Boue, F.; Daoud, M.; Farnoux, B.; Picot, C.; Degennes, P.G.; Rinaudo, M.; et al. Polyelectrolyte solutions—Intrachain and interchain correlations observed by sans. J. Polym. Sci. Part C Polym. Lett. 1979, 17, 379–384. [Google Scholar] [CrossRef]
- Okana, K.; Wada, E.; Kurita, K.; Fukuro, H. Small-angle X-ray scattering by polymer solutions at intermediate concentrations. J. Appl. Crystallogr. 1978, 11, 507–510. [Google Scholar] [CrossRef]
- Ise, N.; Okubo, T.; Yamamoto, K.; Matsuoka, H.; Kawai, H.; Hashimoto, T.; Fujimura, M. Ordered structure in dilute-solutions of poly-l-lysine as studied by small-angle X-ray-scattering. J. Chem. Phys. 1983, 78, 541–545. [Google Scholar] [CrossRef]
- Yekta, A.; Xu, B.; Duhamel, J.; Adiwidjaja, H.; Winnik, M.A. Fluorescence studies of associating polymers in water—Determination of the chain-end aggregation number and a model for the association process. Macromolecules 1995, 28, 956–966. [Google Scholar] [CrossRef]
- Duhamel, J. Polymer chain dynamics in solution probed with a fluorescence blob model. Acc. Chem. Res. 2006, 39, 953–960. [Google Scholar] [CrossRef] [PubMed]
- Duhamel, J. Global analysis of fluorescence decays to probe the internal dynamics of fluorescent ly labeled macromolecules. Langmuir 2014, 30, 2307–2324. [Google Scholar] [CrossRef] [PubMed]
- Duhamel, J. Internal dynamics of dendritic molecules probed by pyrene excimer formation. Polymers 2012, 4, 211–239. [Google Scholar] [CrossRef]
- Renyuan, Q.; Ti, C.; Shangxian, C.; Fenglian, B. Excimer Studies of Polymer Solutions Over the Entire Concentration Range. Sci. Sin. Chim. 1983, 13, 1080. [Google Scholar]
- Torkelson, J.M.; Lipsky, S.; Tirrell, M.; Tirrell, D.A. Fluorescence and absorbance of polystyrene in dilute and semidilute solutions. Macromolecules 1983, 16, 326–330. [Google Scholar] [CrossRef]
- Chen, J.; Sha, Y.; Gao, S.; Teng, C.; Wang, X.; Zhou, D.; Li, L.; Chen, W.; Xue, G. Associated inter- and intrachain conformational transitions in polystyrene solutions. J. Polym. Sci. Part B Polym. Phys. 2017, 55, 1373–1379. [Google Scholar] [CrossRef]
- Chan, N.Y.; Chen, M.; Hao, X.-T.; Smith, T.A.; Dunstan, D.E. Polymer compression in shear flow. J. Phys. Chem. Lett. 2010, 1, 1912–1916. [Google Scholar] [CrossRef]
- Farhangi, S.; Duhamel, J. Long range polymer chain dynamics studied by fluorescence quenching. Macromolecules 2016, 49, 6149–6162. [Google Scholar] [CrossRef]
- Zaragozagalán, G.; Fowler, M.; Rein, R.; Solladié, N.; Duhamel, J.; Rivera, E. Fluorescence resonance energy transfer in partially and fully labeled pyrene dendronized porphyrins studied with model free analysis. J. Phys. Chem. C 2014, 118, 8280–8294. [Google Scholar] [CrossRef]
- Förster, T. Intermolecular energy transference and fluorescence. Ann. Physik 1948, 2, 55–75. [Google Scholar]
- Stryer, L. Fluorescence energy-transfer as a spectroscopic ruler. Annu. Rev. Biochem. 1978, 47, 819–846. [Google Scholar] [CrossRef] [PubMed]
- Sha, Y.; Qi, D.; Luo, S.; Sun, X.; Wang, X.; Xue, G.; Zhou, D. Synthesis of site-specific dye-labeled polymer via atom transfer radical polymerization (atrp) for quantitative characterization of the well-defined interchain distance. Macromol. Rapid Commun. 2016, 38, 1600568. [Google Scholar] [CrossRef] [PubMed]
- Sha, Y.; Xu, Y.; Qi, D.; Wan, Y.; Li, L.; Li, H.; Wang, X.; Xue, G.; Zhou, D. Synthesis of heterotelechelic alpha,omega-dye-labeled polymer and energy transfer between the chain ends. Macromolecules 2016, 49, 8274–8281. [Google Scholar] [CrossRef]
- Sha, Y.; Zhu, Q.; Wan, Y.; Li, L.; Wang, X.; Xue, G.; Zhou, D. Synthesis of polymer with defined fluorescent end groups via reversible addition fragmentation transfer polymerization for characterizing the conformations of polymer chains in solutions. J. Polym. Sci. Part A Polym. Chem. 2016, 54, 2413–2420. [Google Scholar] [CrossRef]
- Liu, C.Y.; Morawetz, H. Kinetics of the unfolding of collapsed polystyrene chains above the glass-transition temperature. Macromolecules 1988, 21, 515–518. [Google Scholar] [CrossRef]
- Jachowicz, J.; Morawetz, H. Characterization of polymer-chain interpenetration in solution by fluorescence after freeze-drying. Macromolecules 1982, 15, 828–831. [Google Scholar] [CrossRef]
- Chen, J.; Li, L.L.; Zhou, D.S.; Wang, X.L.; Xue, G. Effect of geometric curvature on vitrification behavior for polymer nanotubes confined in anodic aluminum oxide templates. Phys. Rev. E 2015, 92, 8. [Google Scholar] [CrossRef] [PubMed]
- Sha, Y.; Li, L.; Wang, X.; Wan, Y.; Yu, J.; Xue, G.; Zhou, D. Growth of polymer nanorods with different core-shell dynamics via capillary force in nanopores. Macromolecules 2014, 47, 8722–8728. [Google Scholar] [CrossRef]
- Shiah, T.Y.J.; Morawetz, H. New fluorescence technique for characterizing polymer self-diffusion. Macromolecules 1984, 17, 792–794. [Google Scholar] [CrossRef]
- Dhinojwala, A.; Torkelson, J.M. A reconsideration of the measurement of polymer interdiffusion by fluorescence nonradiative energy transfer. Macromolecules 1994, 27, 4817–4824. [Google Scholar] [CrossRef]
- Nagata, I.; Morawetz, H. Study of the association of anionic and cationic polymers by nonradiative energy transfer. Macromolecules 1981, 14, 2973–2979. [Google Scholar] [CrossRef]
- Wang, J.S.; Matyjaszewski, K. Controlled living radical polymerization—Atom-transfer radical polymerization in the presence of transition-metal complexes. J. Am. Chem. Soc. 1995, 117, 5614–5615. [Google Scholar] [CrossRef]
- Kolb, H.C.; Finn, M.G.; Sharpless, K.B. Click chemistry: Diverse chemical function from a few good reactions. Angew. Chem. Int. Ed. 2001, 40, 2004–2021. [Google Scholar] [CrossRef]
- Amrani, F.; Hung, J.M.; Morawetz, H. Studies of polymer compatibility by nonradiative energy-transfer. Macromolecules 1980, 13, 649–653. [Google Scholar] [CrossRef]
- Nishihara, T.; Kaneko, M. The dependence of excimer formation of polystyrene solutions on solvent and concentration. Macromol. Chem. Phys. 1969, 124, 84–90. [Google Scholar] [CrossRef]
- Graessley, W.W. Polymer chain dimensions and the dependence of viscoelastic properties on concentration, molecular weight and solvent power. Polymer 1980, 21, 258–262. [Google Scholar] [CrossRef]
- Wilemski, G.; Fixman, M. Diffusion-controlled intrachain reactions of polymers. 1. Theory. J. Chem. Phys. 1974, 60, 866–877. [Google Scholar] [CrossRef]
- Wilemski, G.; Fixman, M. Diffusion-controlled intrachain reactions of polymers. 2. Results for a pair of terminal reactive groups. J. Chem. Phys. 1974, 60, 878–890. [Google Scholar] [CrossRef]
- Weissberg, S.G.; Simha, R.; Rothman, S. Viscosity of dilute and moderately concentrated polymer solutions. J. Res. Natl. Bureau Stand. 1951, 47, 298–314. [Google Scholar] [CrossRef]
- Berlman, I.B. Handbook of Fluorescence Spectra of Aromatic Molecules, 2nd ed.; Academic Press: New York, NY, USA, 1971. [Google Scholar]
- Jacob, M.H.; Dsouza, R.N.; Ghosh, I.; Norouzy, A.; Schwarzlose, T.; Nau, W.M. Diffusion-enhanced forster resonance energy transfer and the effects of external quenchers and the donor quantum yield. J. Phys. Chem. B 2013, 117, 185–198. [Google Scholar] [CrossRef] [PubMed]
- Makarov, D.E.; Plaxco, K.W. Measuring distances within unfolded biopolymers using fluorescence resonance energy transfer: The effect of polymer chain dynamics on the observed fluorescence resonance energy transfer efficiency. J. Chem. Phys. 2009, 131, 08B611. [Google Scholar] [CrossRef] [PubMed]


| Polymer | Mn | PDI | Mol % of Cz | Mol % of An |
|---|---|---|---|---|
| PS | 2.05 × 10⁵ | 1.05 | / | / |
| PS-An-Cz | 2.05 × 10⁵ | 1.05 | 0.0214 | 0.114 |
| PS | 12,500 | 1.09 | / | / |
| An-PS-Cz | 13,300 | 1.10 | 0.573 | 0.515 |
| PS | 9800 | 1.10 | / | / |
| An-PS-Cz | 9700 | 1.09 | 0.622 | 0.300 |
© 2018 by the authors. Licensee MDPI, Basel, Switzerland. This article is an open access article distributed under the terms and conditions of the Creative Commons Attribution (CC BY) license (http://creativecommons.org/licenses/by/4.0/).
Share and Cite
Qin, L.; Li, L.; Sha, Y.; Wang, Z.; Zhou, D.; Chen, W.; Xue, G. Conformational Transitions of Polymer Chains in Solutions Characterized by Fluorescence Resonance Energy Transfer. Polymers 2018, 10, 1007. https://doi.org/10.3390/polym10091007
Qin L, Li L, Sha Y, Wang Z, Zhou D, Chen W, Xue G. Conformational Transitions of Polymer Chains in Solutions Characterized by Fluorescence Resonance Energy Transfer. Polymers. 2018; 10(9):1007. https://doi.org/10.3390/polym10091007
Chicago/Turabian StyleQin, Linlin, Linling Li, Ye Sha, Ziyu Wang, Dongshan Zhou, Wei Chen, and Gi Xue. 2018. "Conformational Transitions of Polymer Chains in Solutions Characterized by Fluorescence Resonance Energy Transfer" Polymers 10, no. 9: 1007. https://doi.org/10.3390/polym10091007
APA StyleQin, L., Li, L., Sha, Y., Wang, Z., Zhou, D., Chen, W., & Xue, G. (2018). Conformational Transitions of Polymer Chains in Solutions Characterized by Fluorescence Resonance Energy Transfer. Polymers, 10(9), 1007. https://doi.org/10.3390/polym10091007