Article

Rubber-Filler Interactions in Polyisoprene Filled with In Situ Generated Silica: A Solid State NMR Study

by
Silvia Borsacchi
1,
Umayal Priyadharsini Sudhakaran
2,
Lucia Calucci
1,
Francesca Martini
2,
Elisa Carignani
2,
Massimo Messori
3 and
Marco Geppi
2,*
1
Italian National Council for Research—Institute for the Chemistry of OrganoMetallic Compounds, CNR-ICCOM, via G. Moruzzi 1, 56124 Pisa, Italy
2
Department of Chemistry and Industrial Chemistry, University of Pisa, via G. Moruzzi 13, 56124 Pisa, Italy
3
Department of Engineering “Enzo Ferrari”, University of Modena and Reggio Emilia, via P. Vivarelli 10/1, 41125 Modena, Italy
*
Author to whom correspondence should be addressed.
Polymers 2018, 10(8), 822; https://doi.org/10.3390/polym10080822
Submission received: 30 June 2018 / Revised: 21 July 2018 / Accepted: 23 July 2018 / Published: 25 July 2018
(This article belongs to the Special Issue NMR in Polymer Science)

Abstract

:
In this paper we used high- and low-resolution solid state Nuclear Magnetic Resonance (NMR) techniques to investigate a series of polyisoprene samples filled with silica generated in situ from tetraethoxysilane by sol-gel process. In particular, 1H spin-lattice and spin-spin relaxation times allowed us to get insights into the dynamic properties of both the polymer bulk and the bound rubber, and to obtain a comparative estimate of the amount of bound rubber in samples prepared with different compositions and sol-gel reaction times. In all samples, three fractions with different mobility could be distinguished by 1H T2 and ascribed to loosely bound rubber, polymer bulk, and free chain ends. The amount of bound rubber was found to be dependent on sample preparation, and it resulted maximum in the sample showing the best dispersion of silica domains in the rubber matrix. The interpretation of the loosely bound rubber in terms of “glassy” behaviour was discussed, also on the basis of 1H T1 and T1ρ data.

Graphical Abstract

1. Introduction

The use of inorganic fillers is a well consolidated practice for conferring and/or improving the most various technologically relevant properties, such as mechanical, optical, thermal, etc., to polymeric materials [1]. In the field of rubbers, and especially in the tyre industry, silica has been increasingly used as filler thanks to the good results obtained, especially in tread compounds, in terms of increased traction, lower rolling resistance (and thus lower vehicle fuel consumption), and good abrasion resistance [2,3,4]. In spite of the scientific progress achieved and of an extensive practical use, it is still quite difficult to precisely define the composition-process-performance relation in filler-polymer, and in particular in silica-rubber composites. It is commonly accepted that a crucial role is played by the complex balance between filler-filler and filler-polymer interfacial interactions, and, in particular, that a good dispersion of the filler in the organic matrix is a necessary condition for a well-performing composite [5]. Preparation methods are usually designed and tuned for optimizing the dispersion of the filler in the rubber. In the case of silica-rubber composites, the hydrophilic character of silica, poorly compatible with the hydrophobic rubber, and the tendency to silica-silica aggregation are obstacles to be overcome. There are three main approaches to the preparation of silica-rubber composites: (1) direct mixing of preformed silica and rubber in the melt state under strong shearing forces; (2) in situ polymerization, in solution, of the rubber in the presence of silica; (3) in situ generation of silica in the presence of rubber, often in emulsion, by sol-gel process [6]. The third method, also exploited for preparing the materials investigated in this work, has recently gained attention for the good results obtained with several polymers. Silica is obtained from the hydrolysis and condensation of alkoxysilanes, often tetraethoxysilane (TEOS), occurring under mild conditions. One of the attractive characteristics of this approach is that the amount and morphology of silica could potentially be controlled by suitably tuning the reaction conditions of the sol-gel process, such as type and amount of precursor and catalyst, reaction time, and temperature [7,8]. Moreover silane coupling agents, often used for improving the interfacial interactions between filler and rubber, can be easily introduced.
In a previous work by some of us we investigated the interrelation between preparation conditions, structure, and mechanical reinforcement in a series of vulcanized composites of isoprene rubber (IR) and silica generated in situ via sol-gel from TEOS [9]. In particular, three different initial TEOS contents were considered and for each of them the sol-gel reaction was stopped at different times, before proceeding with the vulcanization. By combining 29Si solid state Nuclear Magnetic Resonance (NMR), Scanning Electron Microscopy (SEM), swelling experiments, and uniaxial tensile tests, it was found that all the three factors (i.e., TEOS content, duration of the sol-gel process, and addition of the coupling agent) strongly affect structure, formation kinetics, morphology, and dispersion of silica particles in the rubber, as well as the mechanical properties of the final composites.
1H low-resolution solid state NMR has been widely used to characterize polymer-filler composites [6,10,11,12,13,14,15,16,17,18,19,20,21]. In particular, spin-spin relaxation times (T2) are usually exploited to investigate polymer-filler interactions and the formation of bound rubber, while spin-lattice relaxation times in the laboratory (T1) and the rotating (T1ρ) frame can give insights into polymer motions (typically segmental motions above Tg) occurring in the MHz and kHz regimes, respectively. On the other hand, 13C high-resolution solid state NMR can be very precious in characterizing the structure of the polymer, for what concerns monomeric sequences, conformational properties as well as chain packing [22].
In this work, we focused on the characterization of the polymeric fraction in this wide set of composite samples by exploiting 13C and 1H solid state NMR techniques. We mainly aimed at comparing the dynamic behaviour of the polymer and the amount of formed bound rubber (i.e., the fraction of polymer present at the interface with the silica experiencing stiffening at a molecular level) in differently prepared composites. The preparation conditions of the sample were found to not substantially affect the dynamics of the polymeric bulk in the MHz and kHz frequency regimes, involving chain segmental reorientations, and, in part, cooperative motions. On the other hand, the amount of bound rubber was found to depend on the preparation conditions, resulting maximum in a sample which was found by SEM to exhibit the best dispersion of silica particles. The bound rubber identified in all the composite samples resulted to be “loosely bound” to the silica surface. This was discussed in terms of its possible behaviour as a “glassy layer”: our results support the hypothesis that the bound rubber is characterized by a remarkable increase of the anisotropy of the segmental chain motions, but not by a reduction of their characteristic frequencies.

2. Materials and Methods

2.1. Samples Preparation

All reagents and solvents were purchased from Sigma-Aldrich (Milan, Italy) and used without further purification. The Isoprene Rubber (IR) polymer had a 97% content of cis units, a viscosity-average molecular mass of 2.3 × 10⁶ g/mol, a glass transition temperature of 206 K, and a density of 0.91 g/cm3. Silica/isoprene rubber composites were prepared following the procedure described in Reference [9]. Briefly, IR polymer was dissolved in toluene at the refluxing temperature. Tetraethoxysilane, H2O, and ethanol (1:4:4 molar ratios), dibutyltin laurate (catalyst for the sol-gel process, 2 wt % relative to TEOS), and dicumyl peroxide (vulcanizing agent, 1 wt % relative to TEOS) were added after cooling at room temperature. The sol-gel conversion of TEOS to silica was let to proceed by heating the mixtures at 80 °C, under magnetic stirring, for different times. After chosen reaction times, all volatile reagents/products were evaporated and samples were vulcanized at 150 °C for 20 min under 150 bar pressure. The obtained and analysed samples are coded as IRV_x_y, where IRV stands for vulcanized IR, x is the nominal silica content (in phr) expected in the case of full TEOS hydrolysis and condensation and y the sol-gel reaction time in minutes. The actual silica content and the degree of conversion of TEOS to silica, as well as SEM micrographs of the investigated materials, are reported in Reference [9]. The swollen sample (IRV_30_180sw) was prepared by immersing IRV_30_180 in toluene-d8, which was daily replaced with a fresh one, for 96 h.

2.2. Solid State NMR

13C spectra and 1H spin-lattice relaxation times in the laboratory (T1) and in the rotating (T1ρ) frame were recorded using a two-channel Varian Infinity Plus 400 spectrometer (Palo Alto, CA, USA), operating at 400.03 and 100.55 MHz for hydrogen-1 and carbon-13 nuclei, respectively, equipped with a 7.5 mm CP-MAS (Cross Polarization-Magic Angle Spinning) probehead. 13C spectra were recorded under MAS (3–4 kHz frequency) and High Power Decoupling (HPD) from 1H nuclei, exploiting both Direct Excitation (DE) and CP pulse sequences. The DE-MAS spectra were recorded with a recycle delay of 2 s. For CP-MAS spectra, a contact time of 10 ms and a recycle delay of 3.5 s were used. In both the experiments, 22,000 transients were accumulated. TMS and hexamethylbenzene were used as primary and secondary chemical shift references, respectively. All the experiments were carried out at room temperature using air as spinning gas. 1H T1 and T1ρ were measured in static conditions at room temperature. T1 was obtained by applying the saturation recovery pulse sequence, with variable recovery delay ranging from 0.001 to 5 s. T1ρ was measured by exploiting the variable spin-lock time pulse sequence, with a spin-lock time varying between 0.1 and 50 ms, a spin-lock field of 35 kHz, and a recycle delay of 3.5 s.
1H spin-spin relaxation times T2s were obtained by combining solid echo (SE) and Hahn echo (HE) experiments carried out in low-resolution conditions, at room temperature, on a Varian XL-100 (Palo Alto, CA, USA) interfaced with a Stelar DS-NMR (Mede, Italy) acquisition system, equipped with a 5 mm probehead, working at a 1H Larmor frequency of 25 MHz. The 1H 90° pulse duration was 4 μs and a recycle delay of 0.1 s was used. In the case of SE, the delay between the 90° pulses was 14 μs and 1000 transients were recorded. For HE, variable echo delays (τ) ranging from 50 μs to 25 ms were used and 500 transients accumulated. For each sample a “reconstructed“ Free Induction Decay (FID) was obtained by matching the points of the FID recorded with SE from 100 to 160 μs with those of the decay curve (magnetization intensity vs. 2τ) obtained from HE in the same time interval. The reconstructed FIDs were analysed with an in-house package developed within the Mathematica [23] environment.

3. Results

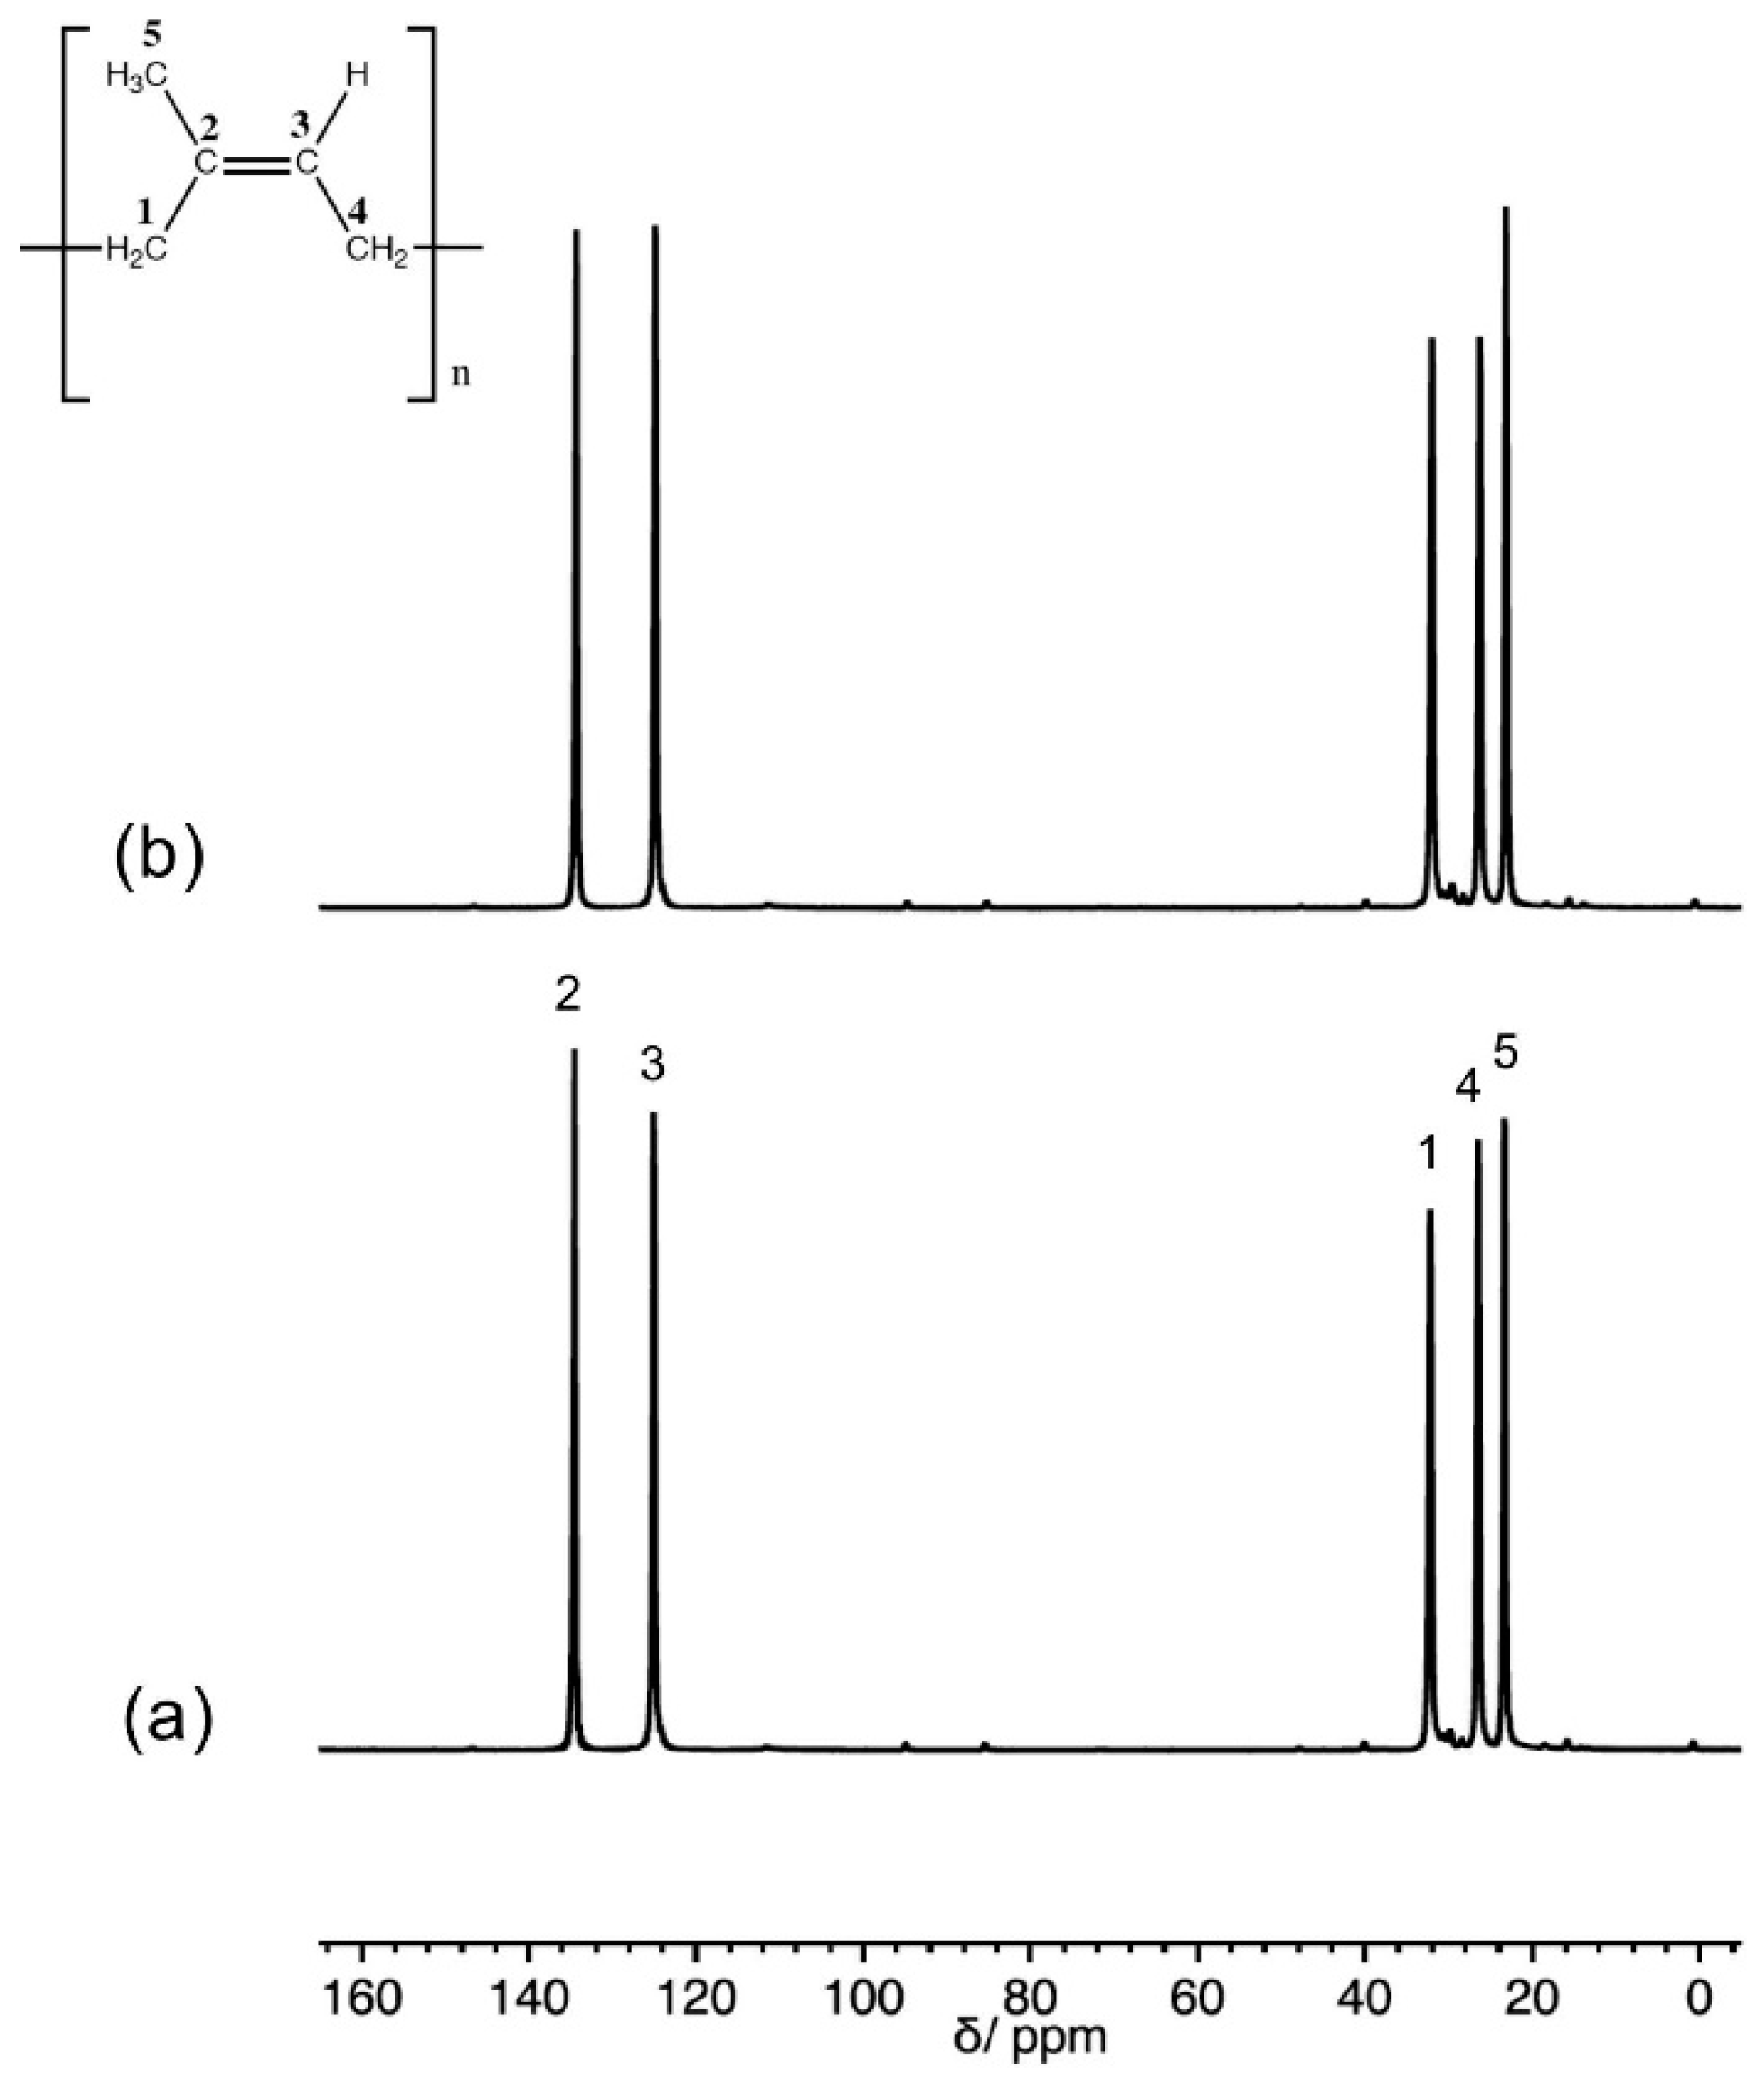
3.1. 13C Solid State NMR Spectra

Figure 1 shows the 13C Solid State NMR spectra of pristine IRV polymer and of one polymer/filler composite (IRV_30_180). The 13C spectra reported in Figure 1 were recorded using the DE-MAS pulse sequence and a short recycle delay between consecutive transients, conditions that favour the signals of 13C nuclei with short spin-lattice relaxation times T1s, usually associated with a high degree of mobility. In all samples at room temperature (about 90 degrees above Tg) the polymer was in a very mobile rubber phase. Indeed all expected carbon signals typical of 1,4-cis-polyisoprene were observed, with a very good signal to noise ratio. Very weak signals ascribable to monomeric units in trans configuration could be observed at about 15, 28, 40, and 124 ppm. On the other hand, neither in DE nor in CP-MAS spectra (not shown) could signals ascribable to ethoxy groups of TEOS be observed, indicating a complete hydrolisation of these groups.

3.2. 1H Spin-Lattice Relaxation Times T1 and T

In order to compare the effects of the presence and the amount of silica on the dynamic behaviour of the polymer, we measured 1H T1 and T1ρ on the composites obtained with the longest sol-gel reaction time (Table 1). On the basis of the silica/polymer weight ratio and of the silica condensation degree previously determined [9], from 95% to 98% of the 1H nuclei belong to IRV, and therefore the T1 and T1ρ values can be safely considered to arise from such nuclei. The spin-lattice relaxation in the laboratory frame resulted to be mono-exponential, thus a single T1 value was measured, indicating that the polymeric fraction was homogeneous on an approximately 10 nm spatial scale in all samples [24]. Moreover, all samples showed a substantially identical T1, suggesting that the fast (MHz regime) interconformational polymer chain motions were not sensitive to the presence of the silica filler. On the other hand, a bi-exponential spin-lattice relaxation in the rotating frame was observed for all samples. A multi-exponential T1ρ decay has been already reported [25] for monophasic amorphous polymers above Tg, and in order to obtain dynamic information, it is useful to calculate the inverse of the population weighted rate average (PWRA), defined as:
PWRA = 1 100 i w i T 1 ρ , i
where the sum runs over the number of exponentials, and the i-th exponential has a percentual weight wi, and a relaxation time T1ρ,i [26]. The 1/PWRA measured for the IRV_xx_180 samples were very similar, and also similar to that of IRV, indicating that the dynamic processes of the polymer with characteristic frequency in the regime of kHz were, like those in the MHz regime, substantially unaffected by the presence of the filler.

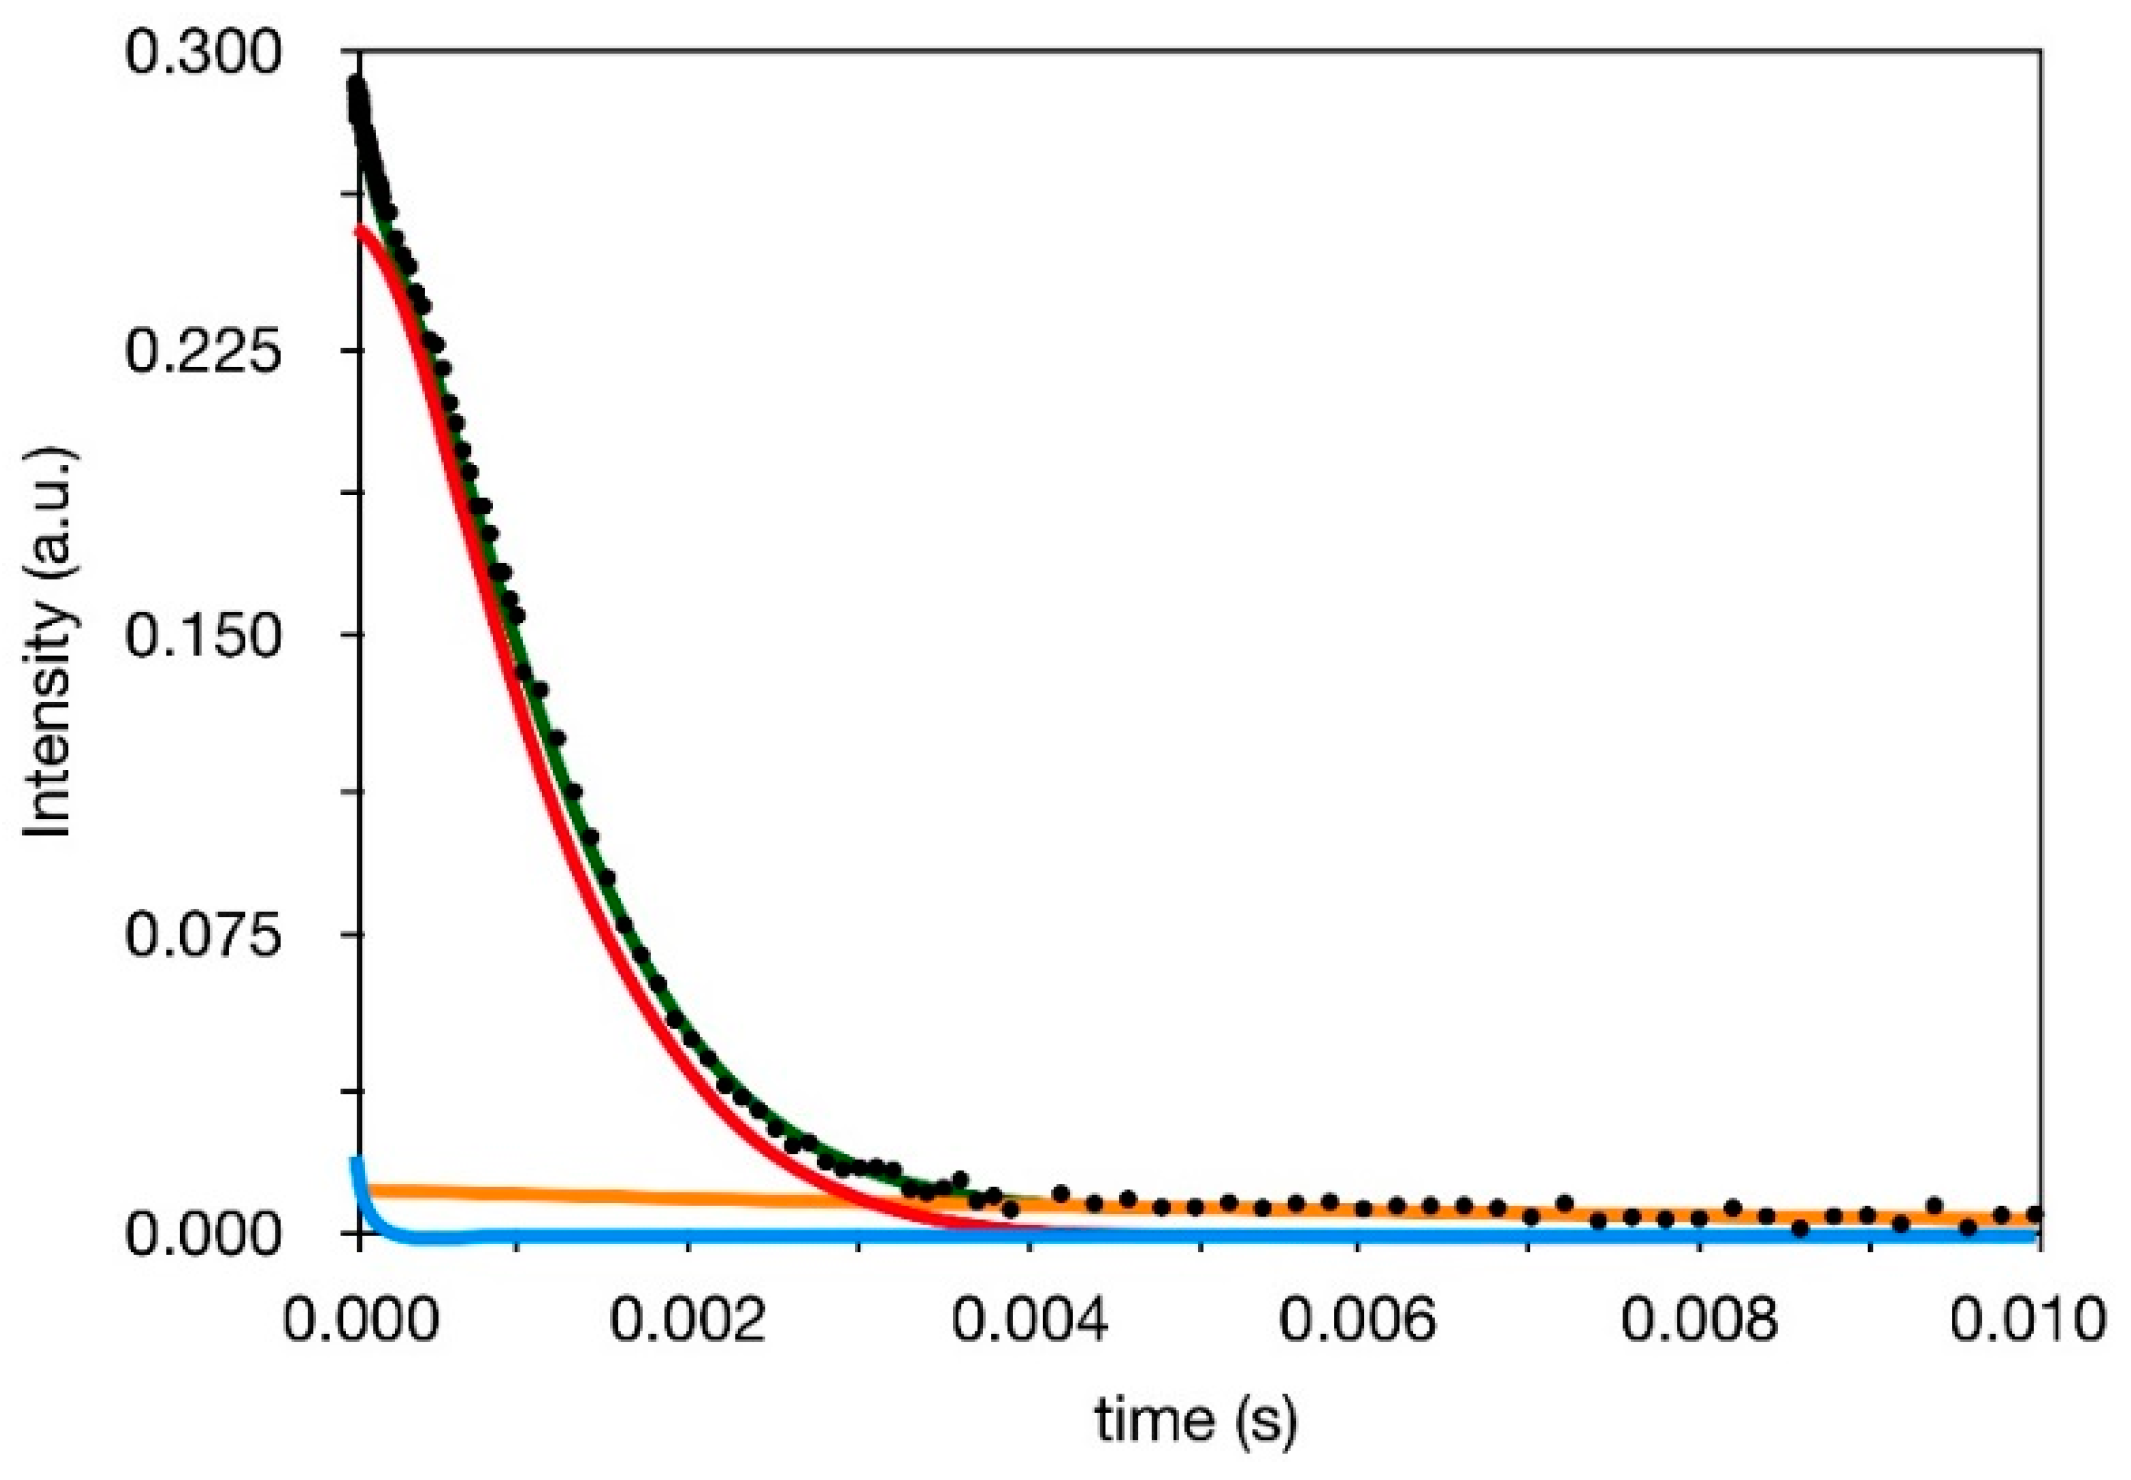
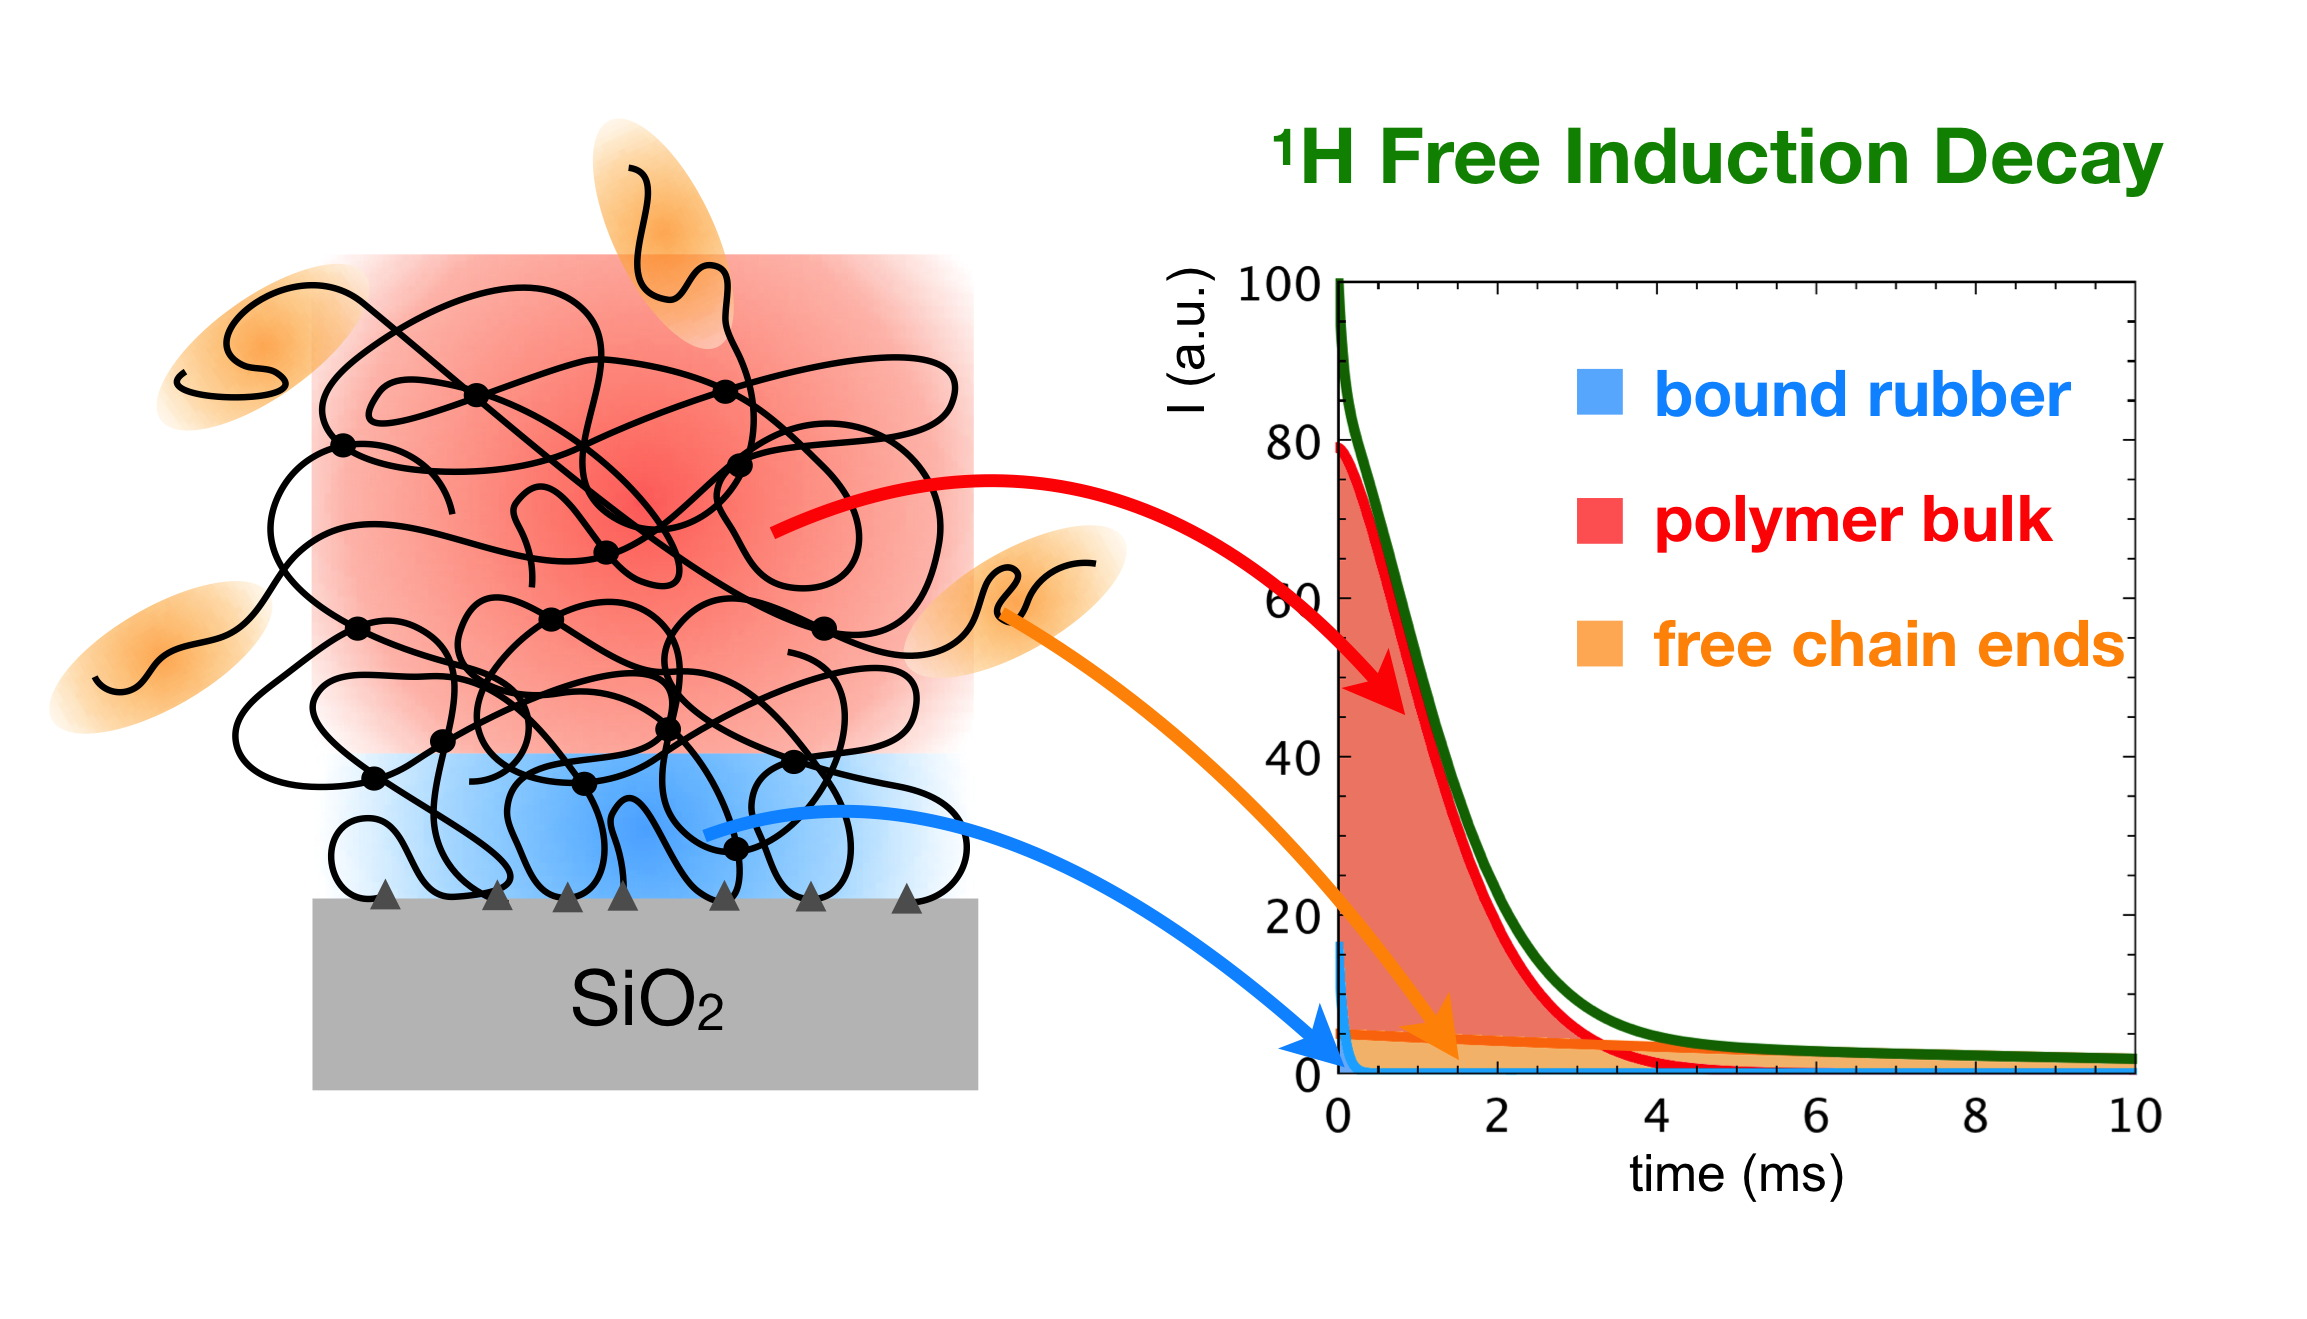
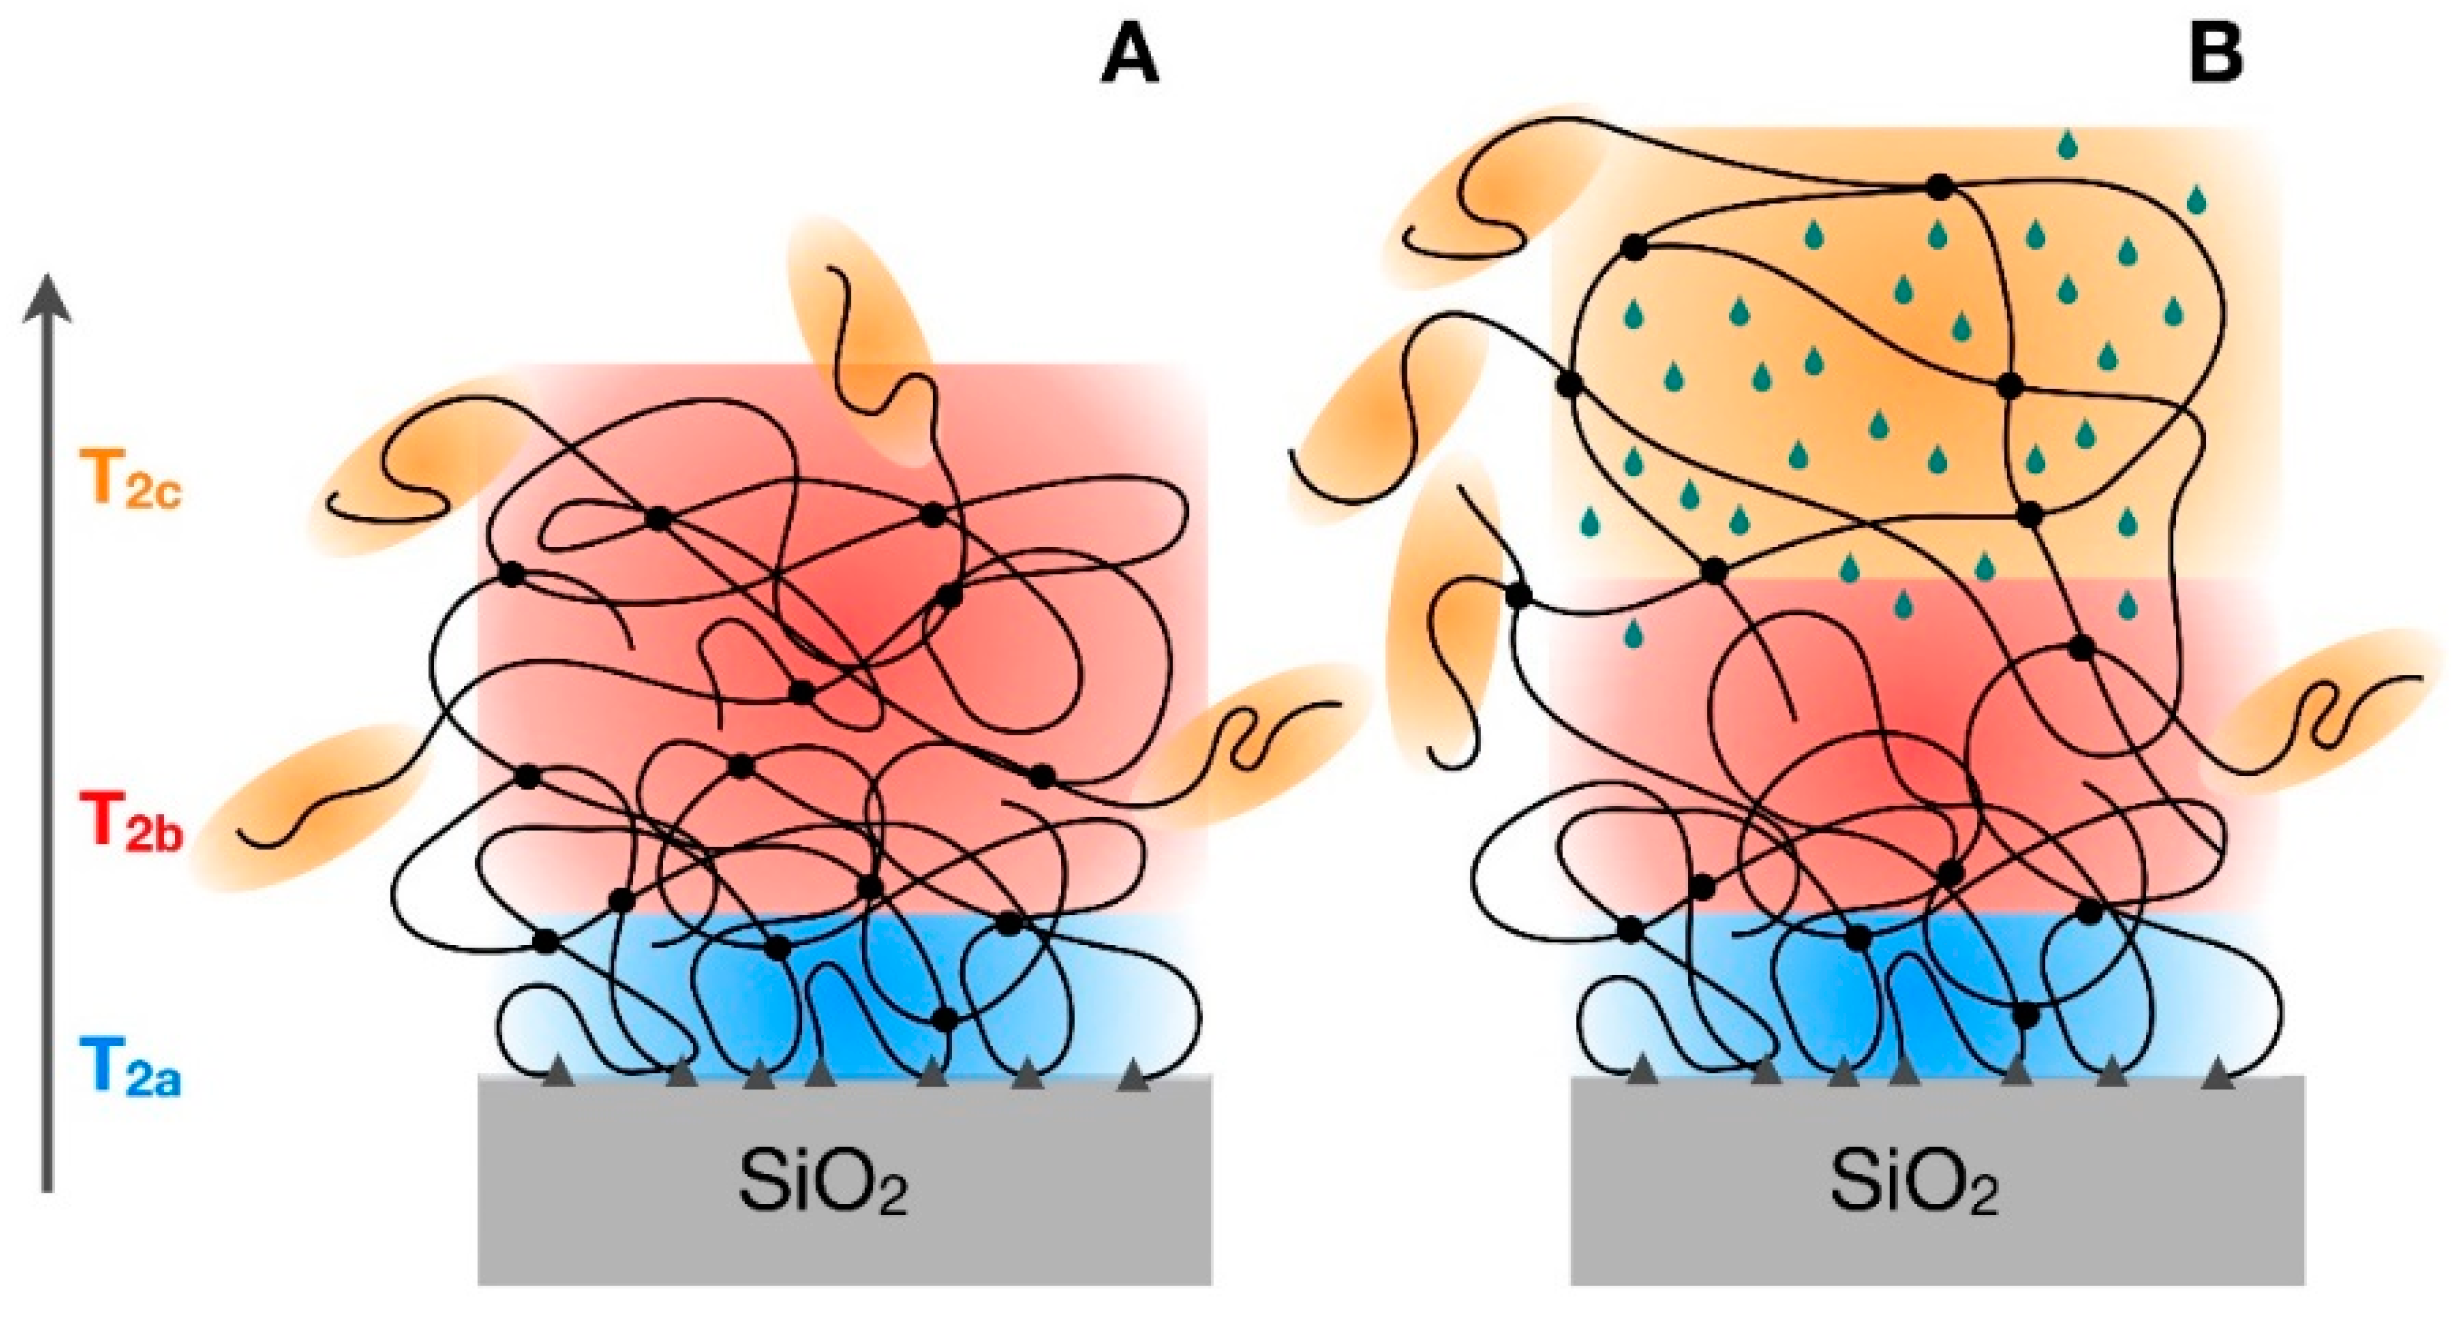
3.3. 1H Spin-Spin Relaxation Times T2

In order to get insights into the presence of polymeric fractions with different mobility, and in particular to try to detect and characterize the bound rubber, we measured 1H spin-spin relaxation times T2 on the whole set of samples available. In Figure 2, as an example, the proton FID of IRV_50_60, reconstructed as described in the Experimental section from the SE and HE experiments, is shown together with its fitting. In all cases the reconstructed FID could be well fitted with the following linear combination of two exponential and one Weibullian functions:
M ( t ) = M a ( 0 ) ( exp ( t / T 2 a ) ) + M b ( 0 ) ( exp ( ( t / T 2 b ) α ) + M c ( 0 ) ( exp ( t / T 2 c ) )
T2i is the T2 of the i-th relaxation component, Mi (0) is the amplitude of the same component, which, suitably normalized, represents the percentage of 1H nuclei associated with T2i. α is the shape parameter of the Weibullian component (ranging from 1 to 2, limit values corresponding to exponential and Gaussian functions, respectively).
A first series of fits carried out on the reconstructed FIDs without any constraint showed almost equal values of T2a, T2c, and α for all samples. Therefore, in order to reduce the correlation among fitting parameters, and to facilitate a physically meaningful interpretation of the results, we fixed T2a, T2c, and α at their best-fitting values of 70 μs, 10 ms, and 1.5, respectively. The remaining best-fitting parameters so obtained are reported in Table 2, where, in particular, it can be observed that T2b always assumes very similar values between 1.3 and 1.7 ms in all samples, apart from the swollen one. The three different T2 values identify three polymeric fractions characterized by clearly different dynamic properties [27]. The “b” fraction, with a relatively long T2 of about 1.5 ms, is the most abundant and it can be surely identified with the bulk of the rubber; the use of a Weibullian function to describe this component was necessary to take phenomenologically into account the distribution of mobility situations present in the bulk, as often reported in the literature [28,29,30]. On the other hand, the small fraction of protons characterized by the longest T2 of 10 ms (“c” component) can be safely ascribed to the free chain ends of the polymer, experiencing a larger mobility. The most interesting proton fraction is that with the shortest T2 of 70 μs (“a” component). These protons clearly belong to polymer chains experiencing a much more restricted mobility with respect to the polymer bulk, which in principle can be identified with both physical entanglements occurring in the polymer bulk and bound rubber that is the polymer fraction closely interacting with the inorganic filler. Pristine IRV shows a very small amount (2%) of protons in restricted mobility, fully ascribable to physical entanglements, suggesting that most of the protons contributing to the “a” component in the other samples belong to the bound rubber. This is further confirmed by the analysis of IRV_30_180 swollen in deuterated solvent (Table 2). In the presence of solvent, the weight of the “a” component remains similar to that of IRV_30_180, in agreement with the scarce permeability of the bound rubber, while the polymer bulk is largely swollen and the chain mobility strongly increased, as shown by the increase of T2b and the weight transfer from “b” to “c” component. This situation is sketched in Figure 3.
The trends of wa (%) with sol-gel reaction times for the series of samples with different nominal content of silica are shown in Figure 4. By looking at the values at time zero, the slightly larger wa found in IRV_30_0 with respect to IRV_50_0 and IRV_70_0 corresponds to a previously found higher TEOS conversion degree (36% vs. 19 and 20%), and suggests a better silica dispersion in IRV_30 already at the early reaction times. From 0 to 30 min wa of IRV_50 and IRV_70 increases and then remains almost constant, in qualitative agreement with the trends of silica contents. On the contrary, in the case of IRV_30 a large increase of wa is observed from 60 to 180 min of sol-gel reaction time, which corresponds to its maximum increase of silica content. The peculiarly high value of wa in IRV_30_180, indicating that this sample has the highest amount of bound rubber, suggests that this combination of initial TEOS content and sol-gel reaction time particularly favours the formation of bound rubber. A further confirmation of this can be obtained by looking at the intensity of the 29Si CP-MAS spectra reported in our previous paper [9]. Considering that all the samples have very similar silica condensation degrees, and assuming that the 29Si magnetization is mainly built by transfer of the magnetization of silanol protons, the total signal intensity of the spectrum should be in principle roughly proportional to the actual silica content. However, Simonutti et al., [15] have proposed that the 29Si signal intensity of CP-MAS spectra of IR-silica composites is also affected by magnetization transfer from protons of the bound rubber. Indeed, in the spectrum of IRV_30_180, the ratio between the total integral of the spectrum and the actual silica content largely exceeds that of the other samples, in agreement with both the contribution to the 29Si CP spectrum from bound rubber protons and with the biggest amount of bound rubber present in this sample. Noticeably, this result agrees with SEM images [9], which highlighted that IRV_30_180 has the best dispersion of small silica aggregates in the rubber matrix.
Although the weights of the different components reported above have been used only for obtaining comparative results, it is worthy to stress that the experimental method here employed (basically SE acquired with an echo delay of 14 μs) can bring to biased results, and in particular, to an underestimate of the weights of the most rigid fractions. To overcome this problem, when quantitative results are strictly necessary, two main approaches can be applied, consisting either in the extrapolation to zero of the weights obtained by SE as a function of the echo delay or in the use of the magic sandwich echo (MSE) technique. Both these methods were applied to a representative sample and they agreed in finding an underestimation of about 20% for the wa values here determined.

4. Discussion

The value of 70 μs found for the T2 of protons belonging to the bound rubber deserves a deeper discussion. In the literature, values ranging from 10–20 μs (characteristic of very rigid solid domains) to hundreds of μs were reported for 1H T2 associated to the bound rubber. These results have been often interpreted in terms of “bond strength” of the rubber bound to the filler. Values of T2 of the order of 10–20 μs have been associated to “tightly bound rubber” (i.e., chains experiencing a very restricted overall mobility), as distinguished from “loosely bound rubber”, experiencing a larger degree of mobility and associated to 1H T2 values of the order of several tens/hundreds of μs [11,31]. In the frame of this approach, our experimental data indicate the presence of loosely bound rubber only. On the other hand, the mobility of the bound rubber, as detected by 1H T2, has been also discussed in comparison with the mobility of the pure polymer. Roughly speaking, the bound rubber can be seen as a “glassy layer” (i.e., a temperature shift of the relaxation curves can be hypothesized so to bring the T2 measured for the bound rubber to coincide with the T2 measured for the pure polymer at a lower temperature) [20,32,33,34,35]. In the case of loosely bound rubber, the effective temperature of the bound rubber would coincide with the NMR Tg of the pure polymer, where T2 steeply increases with increasing temperature and segmental motions with characteristic frequencies of the order of tens of kHz take place. However, different papers, often based on data arising from different experimental techniques, described the behaviour of this “glassy layer” in a somehow divergent way [10]. We try here to give a small contribution to this discussion, by simultaneously interpreting T2 and T1/T1ρ data. If bound rubber really behaved as the polymer at its NMR Tg, this would also imply the temperature shift of T1 and T1ρ curves; then the presence of segmental motions in the kHz regime should favour spin-lattice relaxation in the rotating frame (decreasing 1H T1ρ values) and disfavour spin-lattice relaxation in the laboratory frame (increasing 1H T1 values). In our case, this is not experimentally observed even in IRV_30_180, where the maximum amount of bound rubber is present. Therefore, we support the hypothesis, in agreement with Golitsyn et al. [10], that the segmental motions in the loosely bound rubber preserve similar characteristic frequencies as those of the polymeric bulk much above Tg (not affecting T1 and T1ρ). At the same time, because of the interactions with the filler surface, these motions preserve a strictly local character, showing a larger anisotropy, and therefore bringing to a significant increase of the residual homonuclear dipolar coupling and to a corresponding decrease of T2.

Author Contributions

Conceptualization, S.B., U.P.S., M.M. and M.G.; Methodology, S.B. and M.G.; Software, E.C., F.M. and M.G.; Validation, S.B., L.C. and M.G.; Formal Analysis, U.P.S. and S.B.; Investigation, S.B., F.M. E.C. and L.C.; Resources, M.G. and M.M.; Data Curation, S.B. and U.P.S.; Writing-Original Draft Preparation, M.G. and S.B.; Writing-Review & Editing, M.G. and S.B.; Visualization, M.G., U.P.S. and S.B.; Supervision, M.G. and S.B.; Project Administration, M.G. and M.M.; Funding Acquisition, M.G. and M.M.

Funding

This research received no external funding.

Conflicts of Interest

The authors declare no conflict of interest.

References and Note

  1. Kumar, S.K.; Benicewicz, B.C.; Vaia, R.A.; Winey, K.I. 50th Anniversary perspective: Are polymer nanocomposites practical for applications? Macromolecules 2017, 50, 714–731. [Google Scholar] [CrossRef]
  2. Mouri, H.; Akutagawa, K. Improved tire wet traction through the use of mineral fillers. Rubber Chem. Technol. 1999, 72, 960–968. [Google Scholar] [CrossRef]
  3. Mallakpour, S.; Naghdi, M. Polymer/SiO2 nanocomposites: Production and applications. Prog. Mater. Sci. 2018, 97, 409–447. [Google Scholar] [CrossRef]
  4. He, F.; Yuan, T.; Li, C.; Sun, L.; Liao, S. Interfacial interactions and properties of natural rubber–silica composites with liquid natural rubber as a compatibilizer and prepared by a wet-compounding method. J. Appl. Polym. Sci. 2018, 135, 46457. [Google Scholar] [CrossRef]
  5. Yatsuyanagi, F.; Suzuki, N.; Ito, M.; Kaidou, H. Effects of secondary structure of fillers on the mechanical properties of silica filled rubber systems. Polymer 2001, 42, 9523–9529. [Google Scholar] [CrossRef]
  6. Vaikuntam, S.R.; Stöckelhuber, K.W.; Bhagavatheswaran, E.S.; Wießner, S.; Scheler, U.; Saalwächter, K.; Formanek, P.; Heinrich, G.; Das, A. Entrapped styrene butadiene polymer chains by sol–gel-derived silica nanoparticles with hierarchical raspberry structures. J. Phys. Chem. B 2018, 122, 2010–2022. [Google Scholar] [CrossRef] [PubMed]
  7. Messori, M. In situ synthesis of rubber nanocomposites. Adv. Struct. Mater. 2011, 9, 57–85. [Google Scholar]
  8. Morselli, D.; Bondioli, F.; Luyt, A.S.; Mokhothu, T.H.; Messori, M. Preparation and characterization of EPDM Rubber Modified with in situ generated silica. J. Appl. Polym. Sci. 2013, 128, 2525–2532. [Google Scholar] [CrossRef]
  9. Bignotti, F.; Borsacchi, S.; de Santis, R.; Geppi, M.; Messori, M.; Sudhakaran, U.P. Interrelation between preparation conditions, structure, and mechanical reinforcement in isoprene rubber filled with in situ generated silica. J. Appl. Polym. Sci. 2012, 125, E398–E412. [Google Scholar] [CrossRef]
  10. Golitsyn, Y.; Schneider, G.J.; Saalwächter, K. Reduced-mobility layers with high internal mobility in poly(ethylene oxide)-silica nanocomposites. J. Chem. Phys. 2017, 146, 203303. [Google Scholar] [CrossRef] [PubMed]
  11. O’Brien, J.; Cashell, E.; Wardell, G.E.; McBrierty, V.J. An NMR investigation of the interaction between carbon black and cis-polybutadiene. Macromolecules 1976, 9, 653–660. [Google Scholar] [CrossRef]
  12. Mujtaba, A.; Keller, M.; Ilisch, S.; Radusch, H.-J.; Beiner, M.; Thurn-Albrecht, T.; Saalwächter, K. Detection of surface-immobilized components and their role in viscoelastic reinforcement of rubber–silica nanocomposites. ACS Macro Lett. 2014, 3, 481–485. [Google Scholar] [CrossRef]
  13. Pérez-Aparicio, R.; Schiewek, M.; Valentín, J.L.; Schneider, H.; Long, D.R.; Saphiannikova, M.; Sotta, P.; Saalwächter, K.; Ott, M. Local chain deformation and overstrain in reinforced elastomers: An NMR study. Macromolecules 2013, 46, 5549–5560. [Google Scholar] [CrossRef]
  14. Tadiello, L.; D’Arienzo, M.; Di Credico, B.; Hanel, T.; Matejka, L.; Mauri, M.; Morazzoni, F.; Simonutti, R.; Spirkova, M.; Scotti, R. The filler–rubber interface in styrene butadiene nanocomposites with anisotropic silica particles: Morphology and dynamic properties. Soft Matter 2015, 11, 4022–4033. [Google Scholar] [CrossRef] [PubMed]
  15. Simonutti, R.; Comotti, A.; Negroni, F.; Sozzani, P. 13C and 29Si solid-state NMR of rubber-silica composite materials. Chem. Mater. 1999, 11, 822–828. [Google Scholar] [CrossRef]
  16. Redaelli, M.; D’Arienzo, M.; Brus, J.; Di Credico, B.; Geppi, M.; Giannini, L.; Matejka, L.; Martini, F.; Panattoni, F.; Spirkova, M.; et al. On the key role of SiO2@POSS hybrid filler in tailoring networking and interfaces in rubber nanocomposites. Polym. Test. 2018, 65, 429–439. [Google Scholar] [CrossRef]
  17. Borsacchi, S.; Geppi, M.; Veracini, C.A.; Fallani, F.; Ricci, L.; Ruggeri, G. Improving compatibility in LDPE–silica dispersions by photo-grafting reaction. Preparation and solid state NMR investigation. J. Mater. Chem. 2006, 16, 4581–4591. [Google Scholar] [CrossRef]
  18. Litvinov, V.M.; Orza, R.A.; Klüppel, M.; van Duin, M.; Magusin, P.C.M.M. Rubber-filler interactions and network structure in relation to stress-strain behavior of vulcanized, carbon black filled EPDM. Macromolecules 2011, 44, 4887–4900. [Google Scholar] [CrossRef]
  19. Wang, M.; Bertmer, M.; Demco, D.E.; Blümich, B.; Litvinov, V.M.; Barthel, H. Indication of heterogeneity in chain-segment order of a PDMS layer grafted onto a silica surface by 1H multiple-quantum NMR. Macromolecules 2003, 36, 4411–4413. [Google Scholar] [CrossRef]
  20. Litvinov, V.M.; Barthel, H.; Weis, J. Structure of a PDMS layer grafted onto a silica surface studied by means of DSC and solid-state NMR. Macromolecules 2002, 35, 4356–4364. [Google Scholar] [CrossRef]
  21. ten Brinke, J.W.; Litvinov, V.M.; Wijnhoven, J.E.G.J.; Noordermeer, J.W.M. Interactions of Stöber silica with natural rubber under the influence of coupling agents, studied by 1H NMR T2 relaxation analysis. Macromolecules 2002, 35, 10026–10037. [Google Scholar] [CrossRef]
  22. Geppi, M.; Borsacchi, S.; Mollica, G.; Veracini, C.A. Applications of solid-state NMR to the study of organic/inorganic multicomponent materials. Appl. Spectrosc. Rev. 2009, 44, 1–89. [Google Scholar] [CrossRef]
  23. Mathematica, Version 11.1.0.0, 2017; Trademark of Wolfram Research Inc.: Champaign, IL, USA, 2018.
  24. McBrierty, V.J.; Packer, K.J. Nuclear Magnetic Resonance in Solid Polymers; Cambridge University Press: Cambridge, UK, 1993. [Google Scholar]
  25. Geppi, M.; Harris, R.K.; Kenwright, A.M.; Say, B.J. A method for analysing proton NMR relaxation data from motionally heterogeneous polymer systems. Solid State Nucl. Magn. Reson. 1998, 12, 15–20. [Google Scholar] [CrossRef]
  26. Kenwright, A.M.; Say, B.J. Analysis of spin-diffusion measurements by iterative optimisation of numerical models. Solid State Nucl. Magn. Reson. 1996, 7, 85–93. [Google Scholar] [CrossRef]
  27. Actually, a small amount of protons—From 2 to 5% (see Section 3.2) is also present in silica in silanol groups, the T2 value of which cannot be selectively determined in composites. On the basis of previous 1H FID analysis of silica, however, we expect that most of silanols contribute to the Weibullian function. In any case, due to their small amount, as in the case of T1 and T1ρ, their contribution to reconstructed FIDs was neglected.
  28. Kristiansen, P.E.; Hansen, E.W.; Pedersen, B. Phase distribution during isothermal crystallization of polyethylene probed by solid-state proton NMR free induction decay. J. Phys. Chem. B 1999, 103, 3552–3558. [Google Scholar] [CrossRef]
  29. Borsacchi, S.; Paderni, K.; Messori, M.; Toselli, M.; Pilati, F.; Geppi, M. Insights into shape-memory poly(ε-caprolactone) materials by solid-state NMR. Macromolecules 2014, 47, 3544–3552. [Google Scholar] [CrossRef]
  30. Litvinov, V.M.; Steeman, P.A. EPDM-carbon black Interactions and the reinforcement mechanisms, as studied by low-resolution 1H NMR. Macromolecules 1999, 32, 8476–8490. [Google Scholar] [CrossRef]
  31. Ou, Y.-C.; Yu, Z.-Z.; Vidal, A.; Donnet, J.B. Effects of alkylation of silicas on interfacial interaction and molecular motions between silicas and rubbers. J. Appl. Polym. Sci. 2012, 125, E398–E412. [Google Scholar] [CrossRef]
  32. Berriot, J.; Lequeux, F.; Monnerie, L.; Montes, H.; Long, D.; Sotta, P. Filler-elastomer interaction in model filled rubbers, a 1H NMR study. J. Non-Cryst. Sol. 2002, 307–310, 719–724. [Google Scholar] [CrossRef]
  33. Berriot, J.; Montes, H.; Lequeux, F.; Long, D.; Sotta, P. Evidence for the shift of the glass transition near the particles in silica-filled elastomers. Macromolecules 2002, 35, 9756–9762. [Google Scholar] [CrossRef]
  34. Papon, A.; Saalwächter, K.; Schäler, K.; Guy, L.; Lequeux, F.; Montes, H. Low-field NMR investigations of nanocomposites: Polymer dynamics and network effects. Macromolecules 2011, 44, 913–922. [Google Scholar] [CrossRef]
  35. Kim, S.Y.; Meyer, H.W.; Saalwächter, K.; Zukoski, C. Polymer dynamics in PEG-silica nanocomposites: Effects of polymer molecular weight, temperature and solvent dilution. Macromolecules 2012, 45, 4225–4237. [Google Scholar] [CrossRef]
Figure 1. 13C DE-MAS spectra of IRV (a) and IRV_30_180 (b).
Polymers 10 00822 g001
Figure 2. Example of fit of a reconstructed 1H FID: experimental data (black points), total fitting function (green line), exponential function with T2 = 70 μs (blue line), Weibullian function (red line), and exponential function with T2 = 10 ms (orange line).
Polymers 10 00822 g002
Figure 3. Sketch of the different regions of the polymer in the unswollen (A) and swollen (B) states, as detected by 1H FID analysis. Blue, red, and orange colours refer to the “a”, “b”, and “c” components of the FID.
Polymers 10 00822 g003
Figure 4. wa (%) vs. sol-gel reaction time for the samples IRV_x prepared at different nominal silica content x, as obtained by analysis of reconstructed 1H FID’s.
Polymers 10 00822 g004
Table 1. 1H T1 and T1ρ values of the indicated samples, measured at a Larmor frequency of 400.03 MHz. In the case of T1ρ, both the population weighted rate average (PWRA) (Equation (1)) and the values of the two components of the detected bi-exponential relaxation with their weight percentages are reported. Errors of about ±10 and 1 ms were estimated for T1 and 1/PWRA, respectively.
SampleT1 (s)T1ρ,1 (ms)w1T1ρ,2 (ms)w21/PWRA (ms)
IRV0.674.51513.28510
IRV_30_1800.653.41413.2869
IRV_50_1800.663.31513.0859
IRV_70_1800.654.51914.28110
Table 2. Results of the fitting of the transverse magnetization decay curves, reconstructed from SE and HE experiments as described in the text, by the function reported in equation 2: T2a and T2c were kept fixed at the values of 70 μs and 10 ms, respectively. wi (%) = 100*Mi(0)/M(0) with i = a, b, or c. The values of the actual silica content for the different samples are also reported. Errors of about ±1% and 0.05 ms could be estimated for wi (%) and T2b, respectively.
SampleSilica Content (phr) bwa (%)T2b (ms)wb (%)wc (%)
IRV021.33917
IRV_30_010.981.72848
IRV_30_3016.181.72866
IRV_30_6017.971.52876
IRV_30_18023.9161.56795
IRV_50_09.651.41887
IRV_50_3034.571.35903
IRV_50_6039.071.34894
IRV_50_18043.071.36876
IRV_70_014.351.35869
IRV_70_3048.281.44902
IRV_70_6049.771.35876
IRV_70_18049.581.38884
IRV_30_180sw a23.9212.24633
a This sample was swollen in toluene-d5 as described in the Experimental section. b Actual silica content as determined from thermogravimetric measurements (data taken from Reference [9]).

