Effects of Fatty Acid Anhydride on the Structure and Thermal Properties of Cellulose-g-Polyoxyethylene (2) Hexadecyl Ether

Abstract
:
1. Introduction
2. Experimental
2.1. Materials
2.2. Cellulose Esterification
2.3. Preparation of Prepolymer
2.4. Preparation of Cellulose-Based Copolymers
2.5. Characterization
2.5.1. FTIR
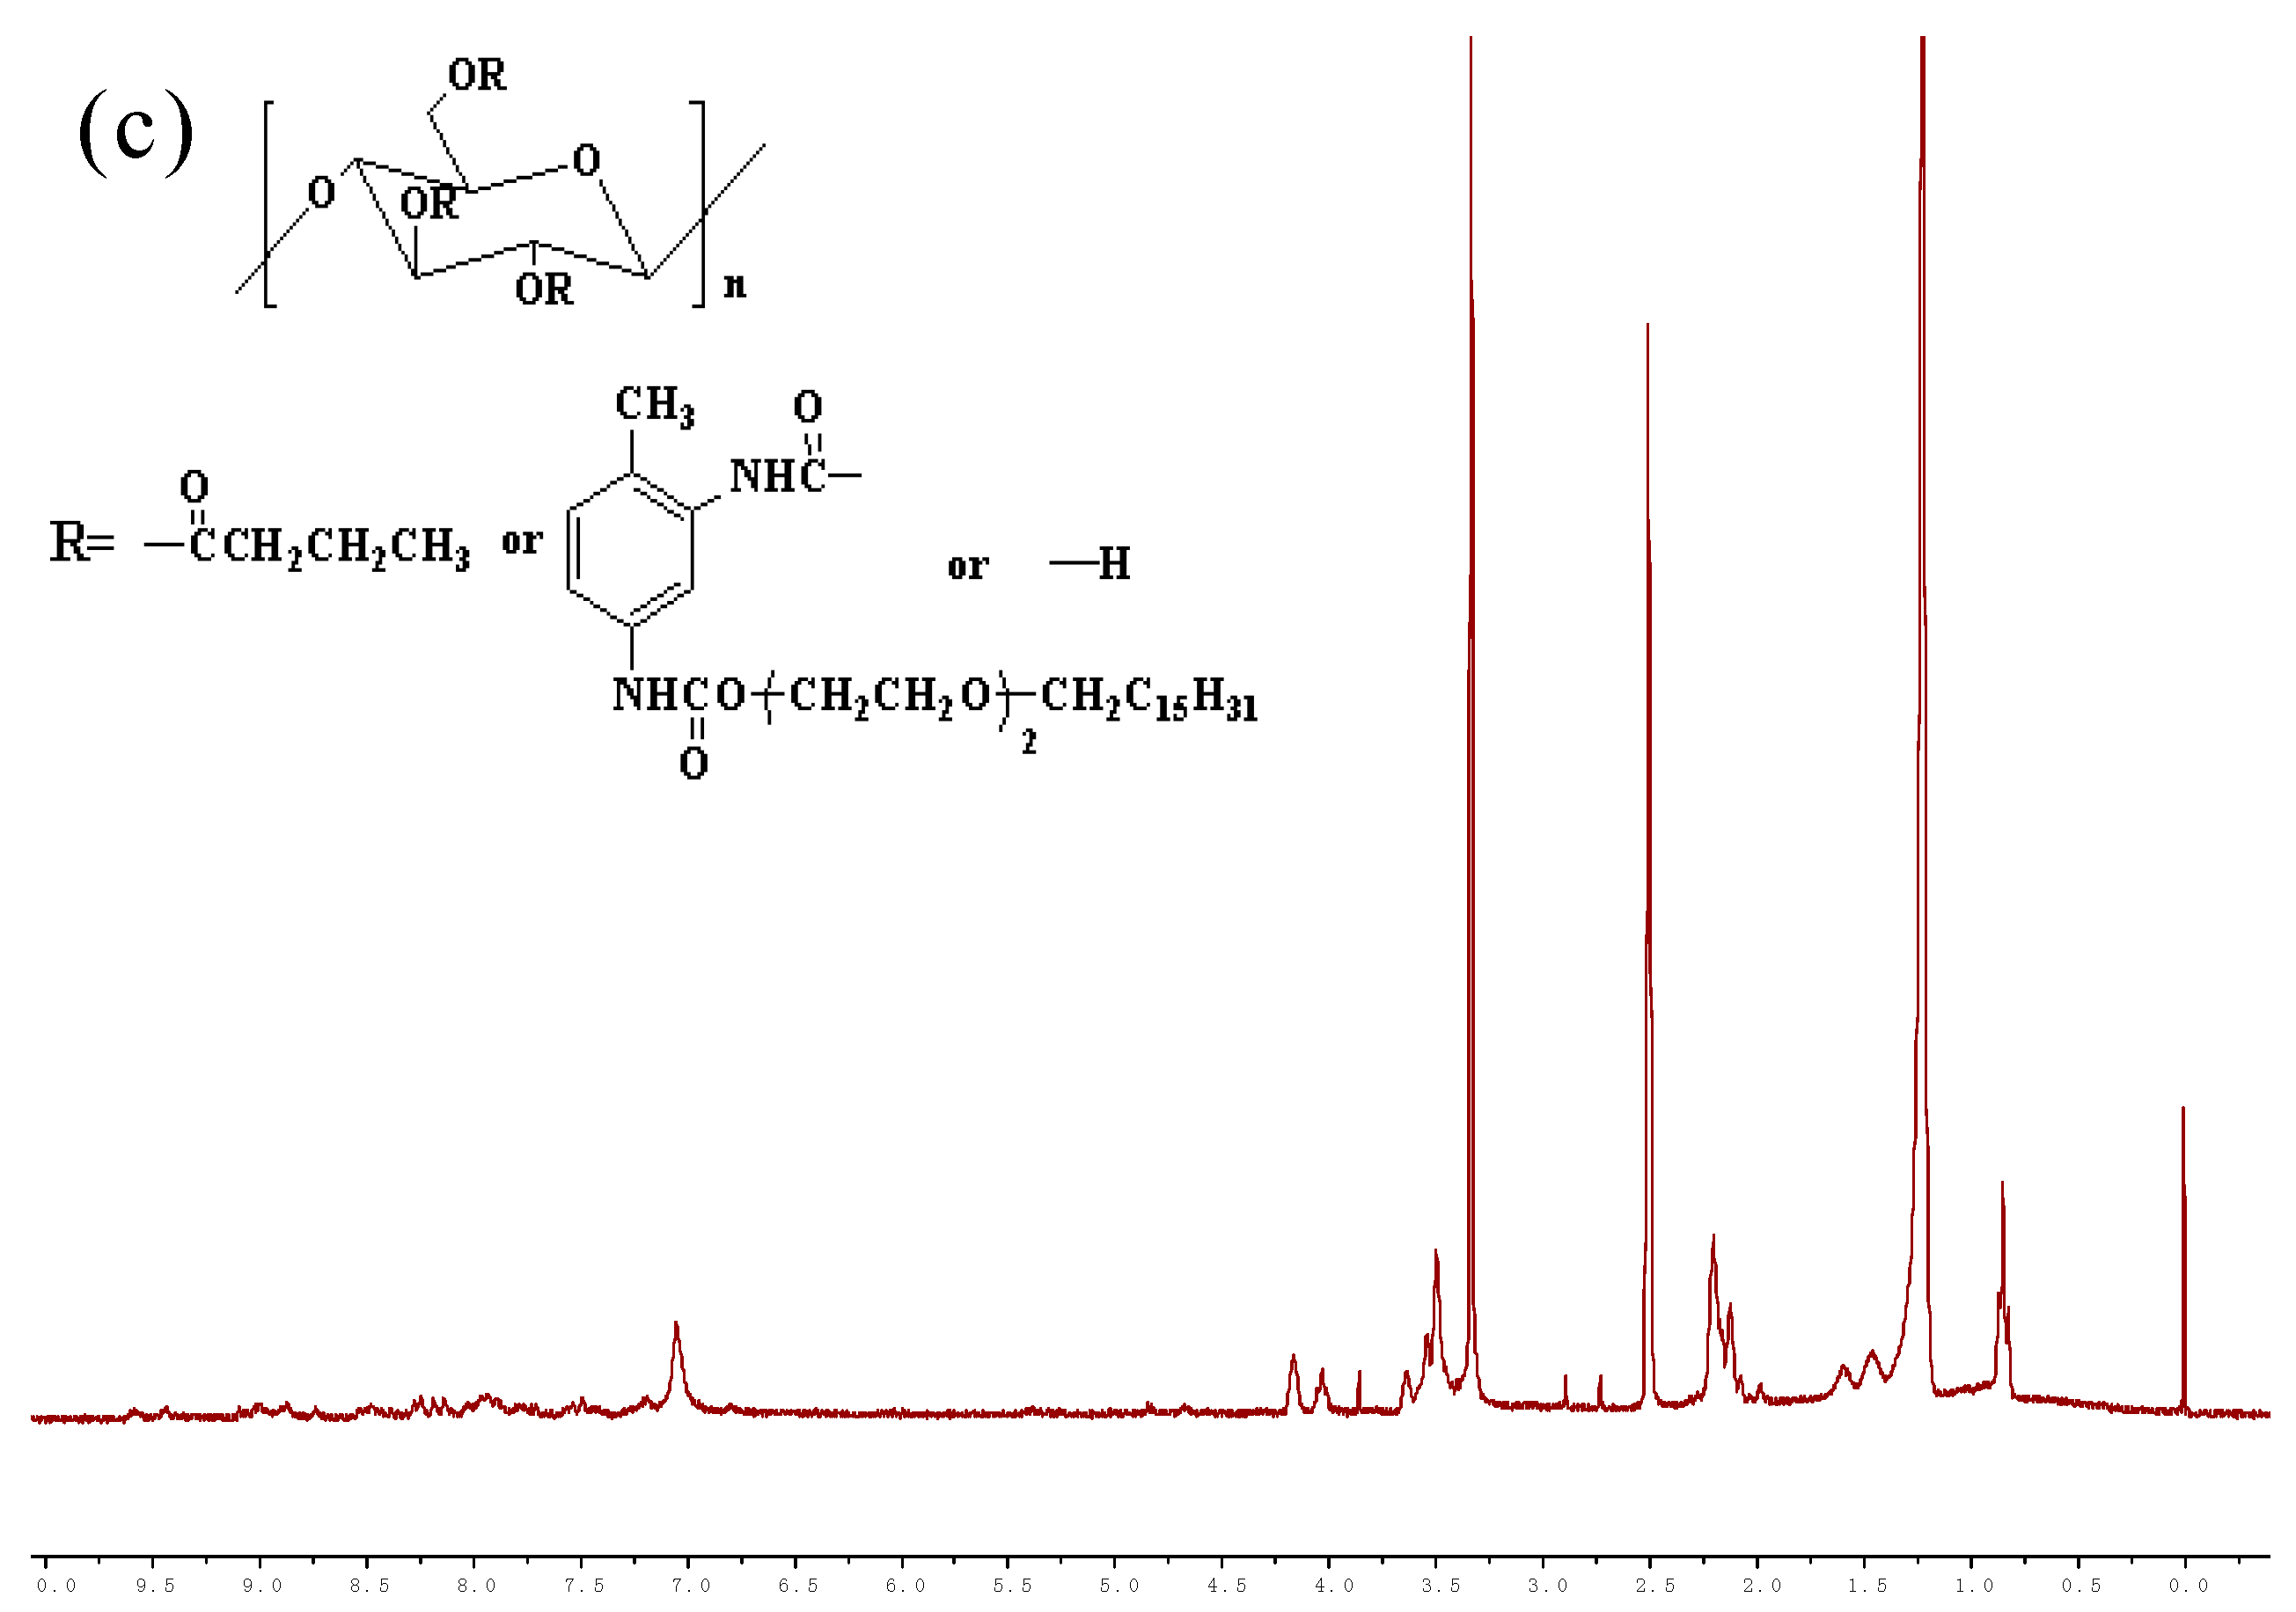
2.5.2. 1H-NMR
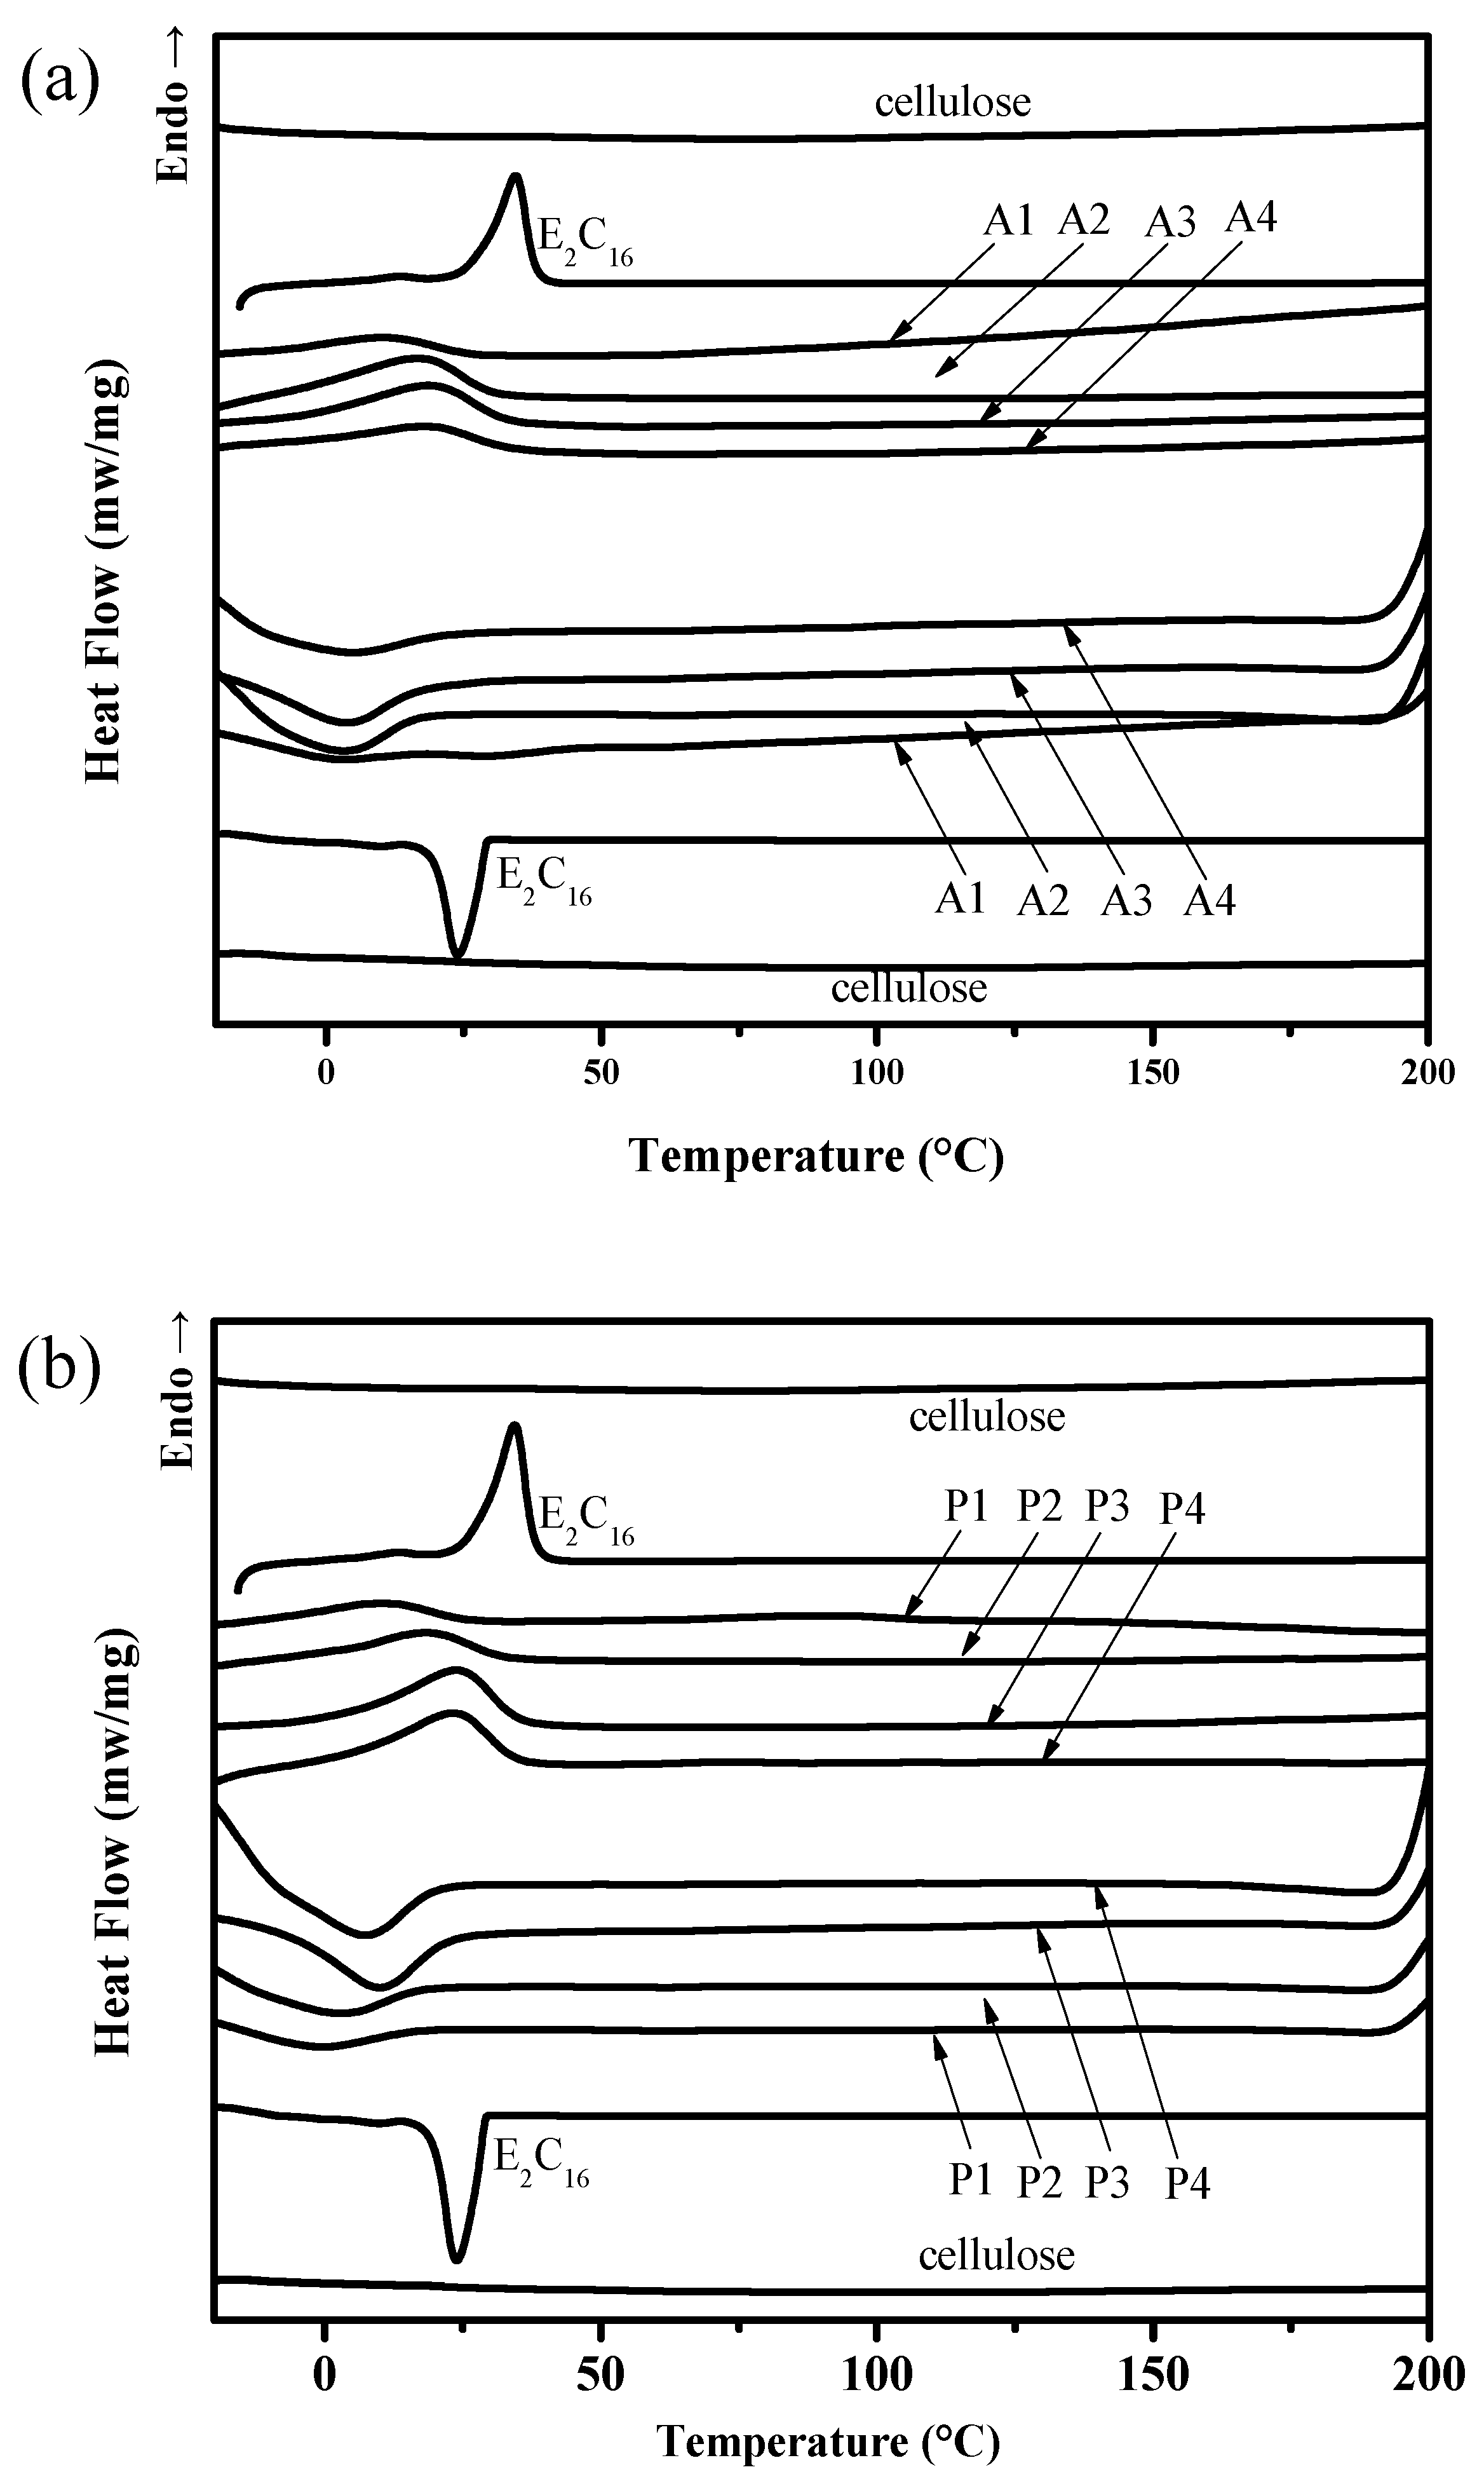
2.5.3. DSC
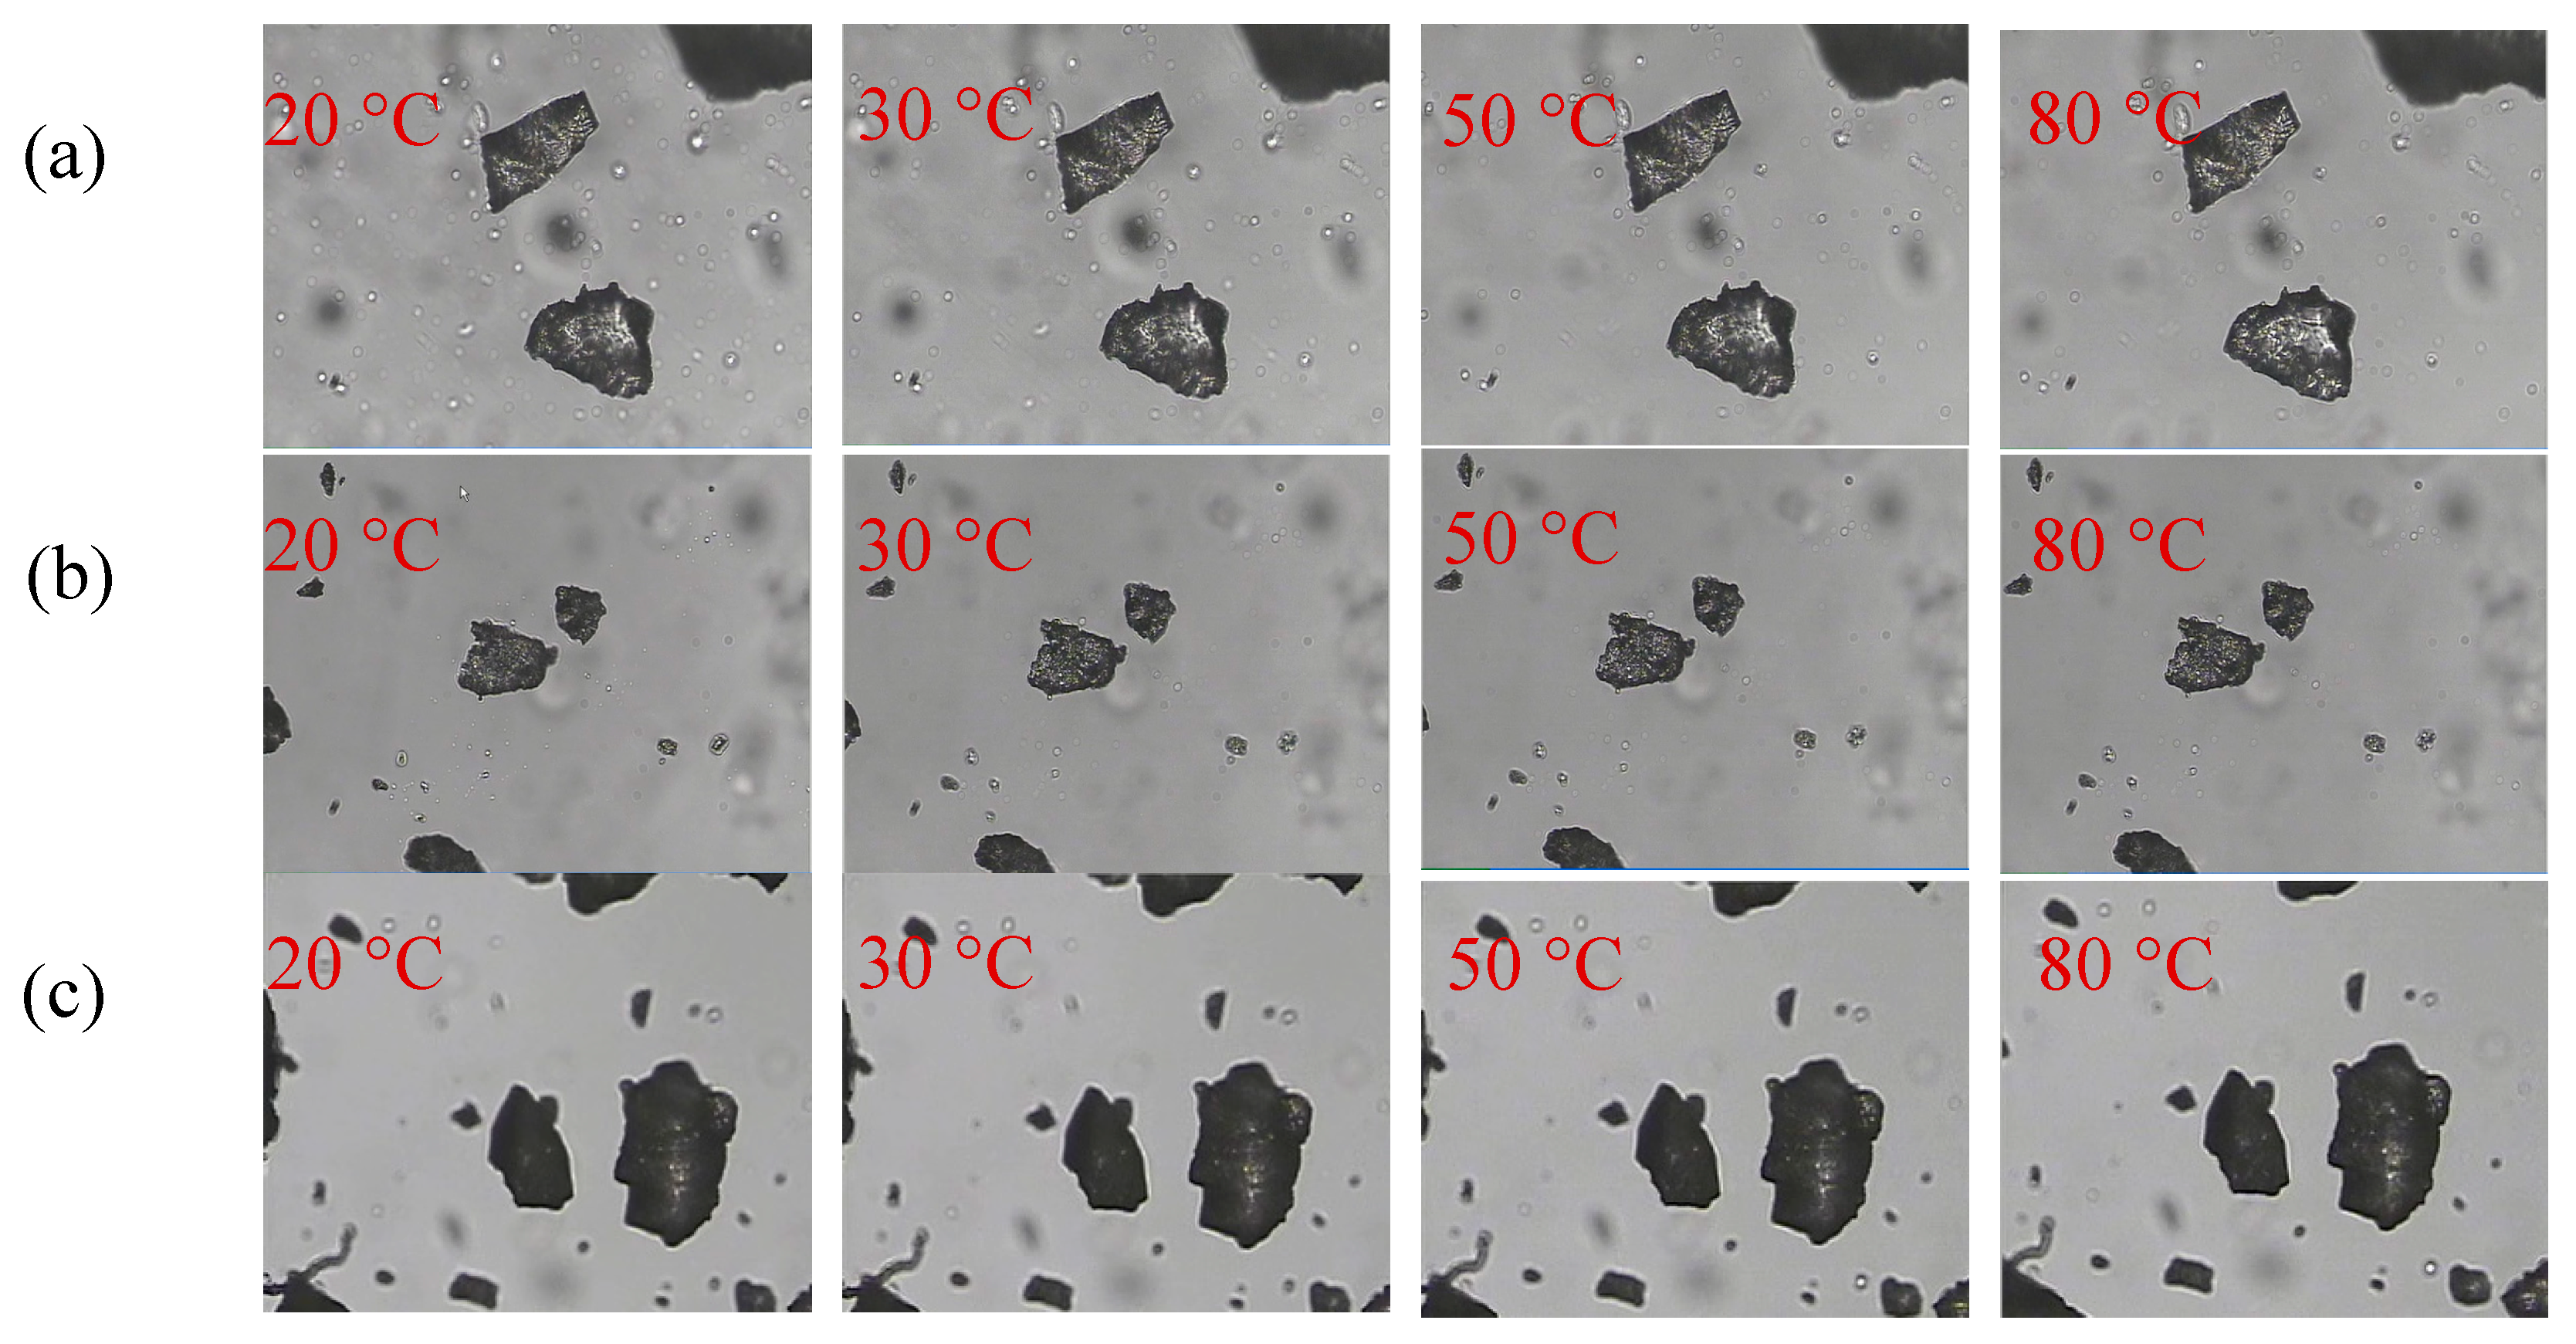
2.5.4. POM
2.5.5. TG
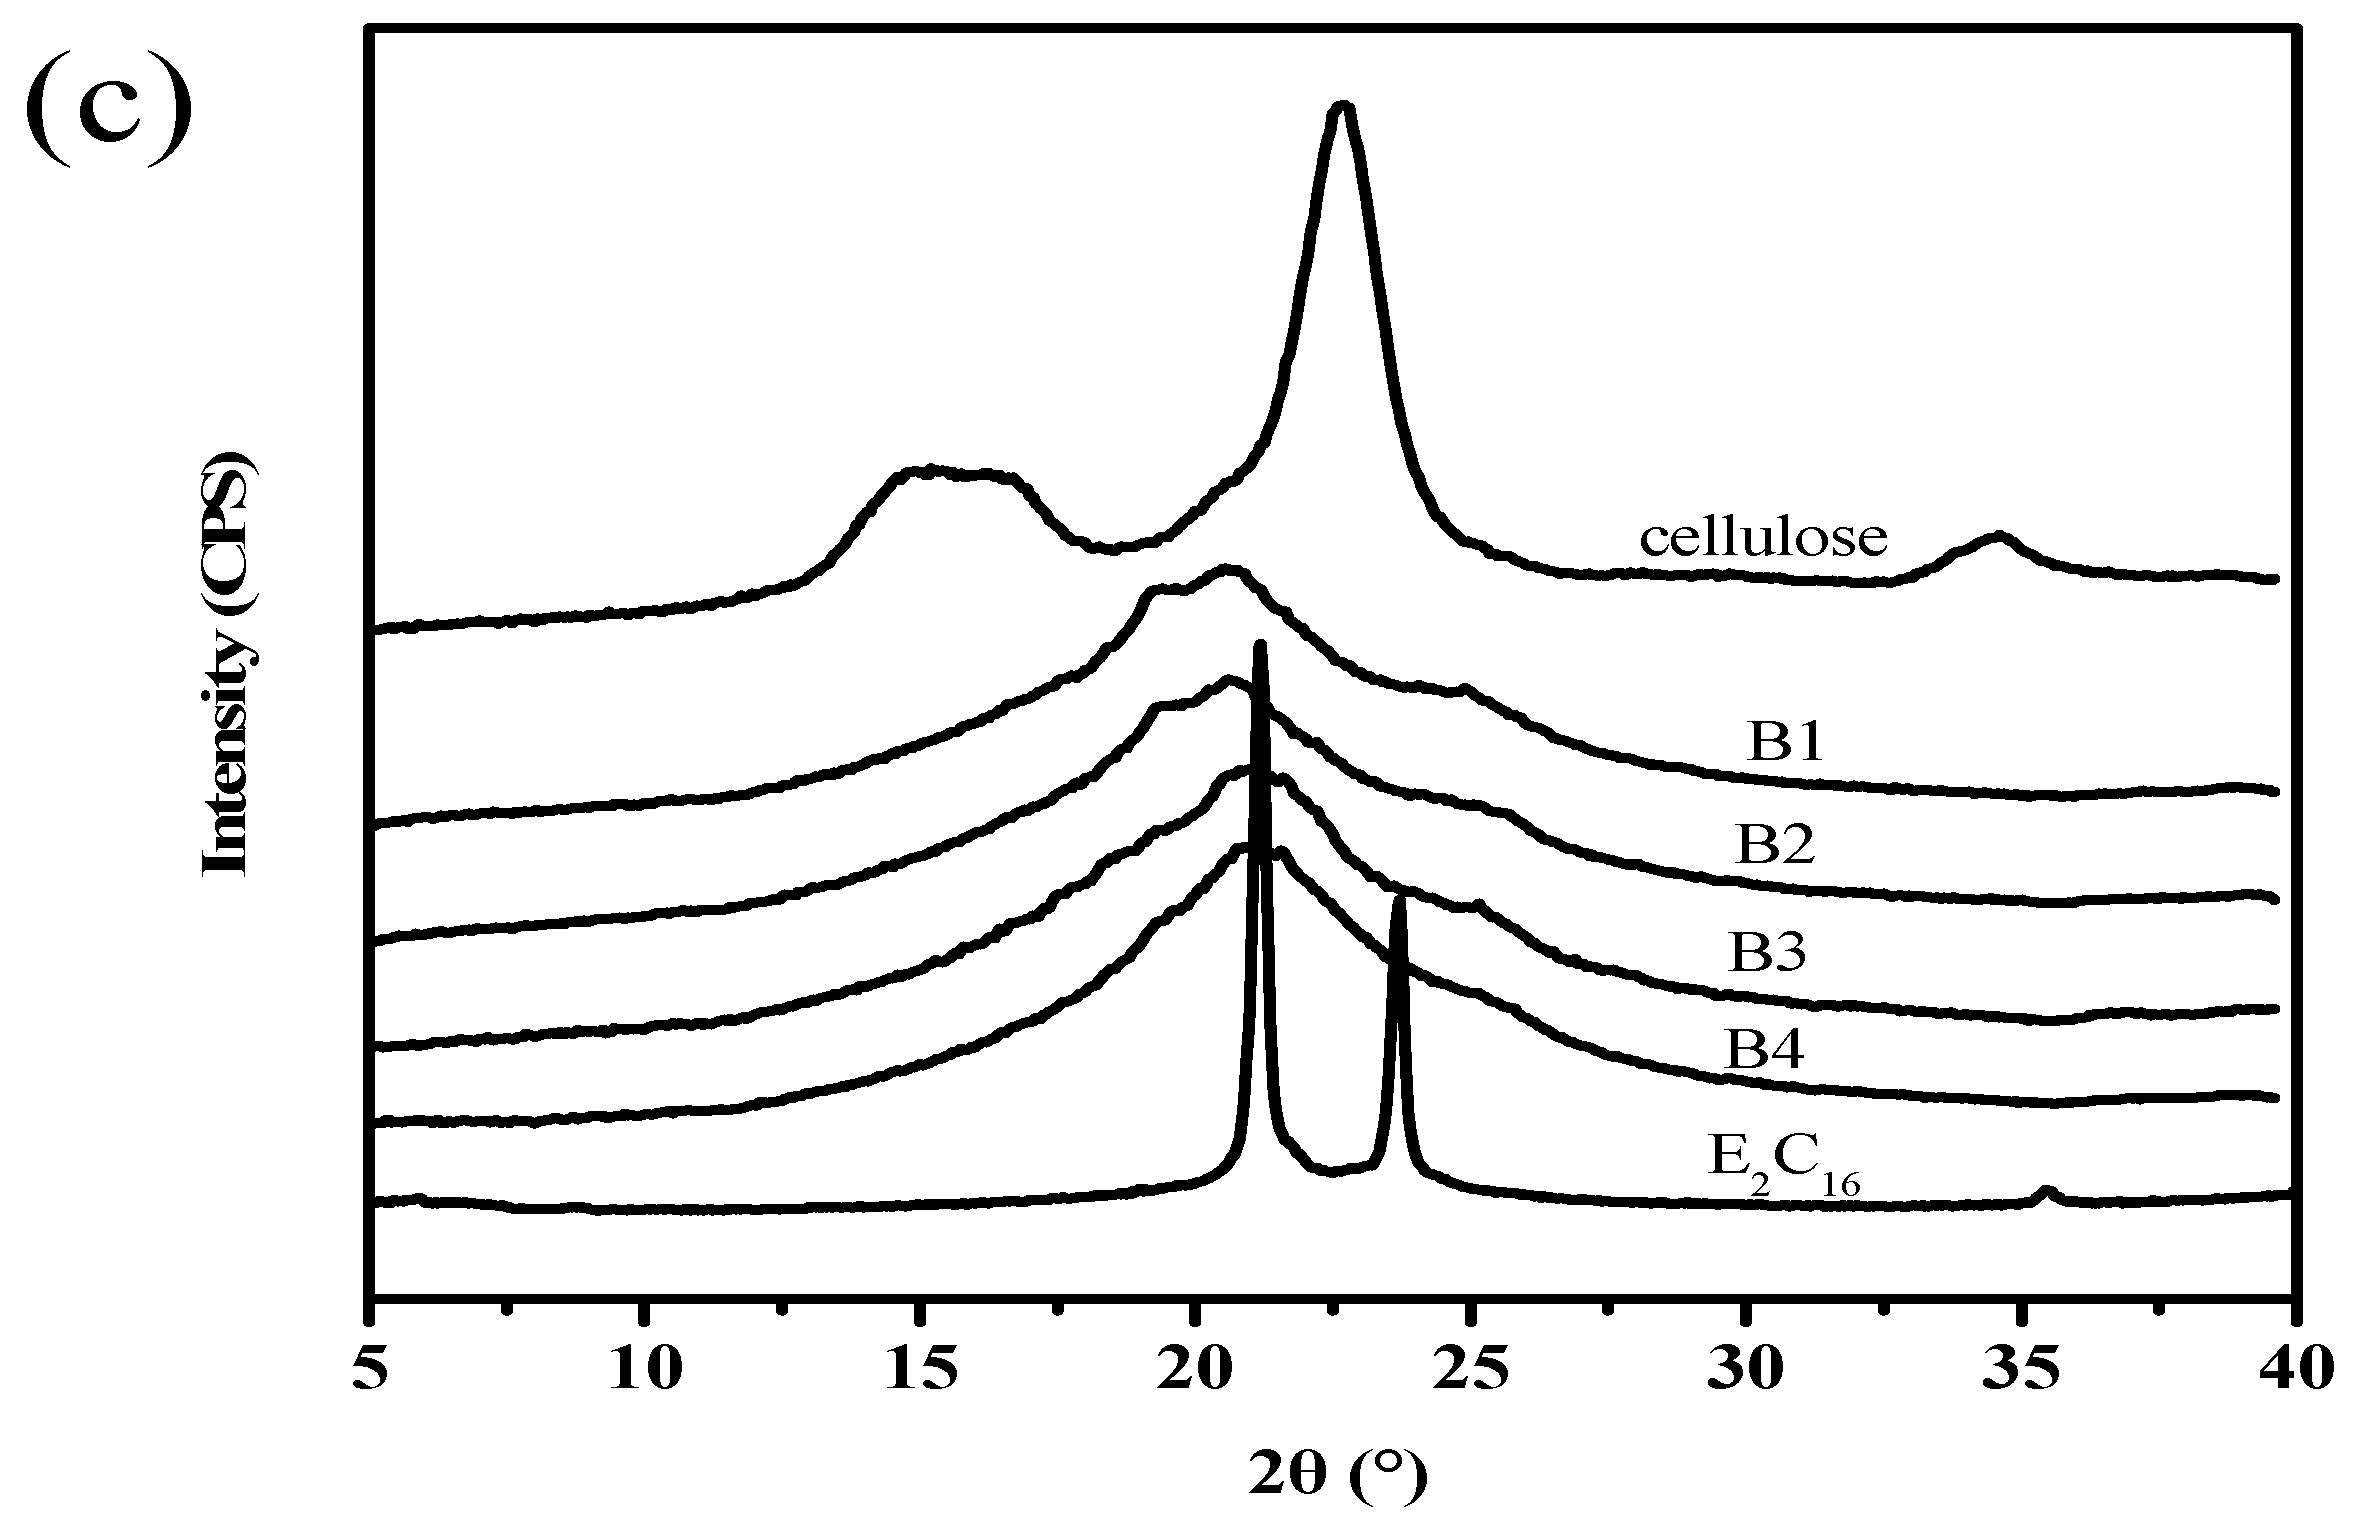
2.5.6. WAXD
3. Results and Discussion
3.1. FTIR
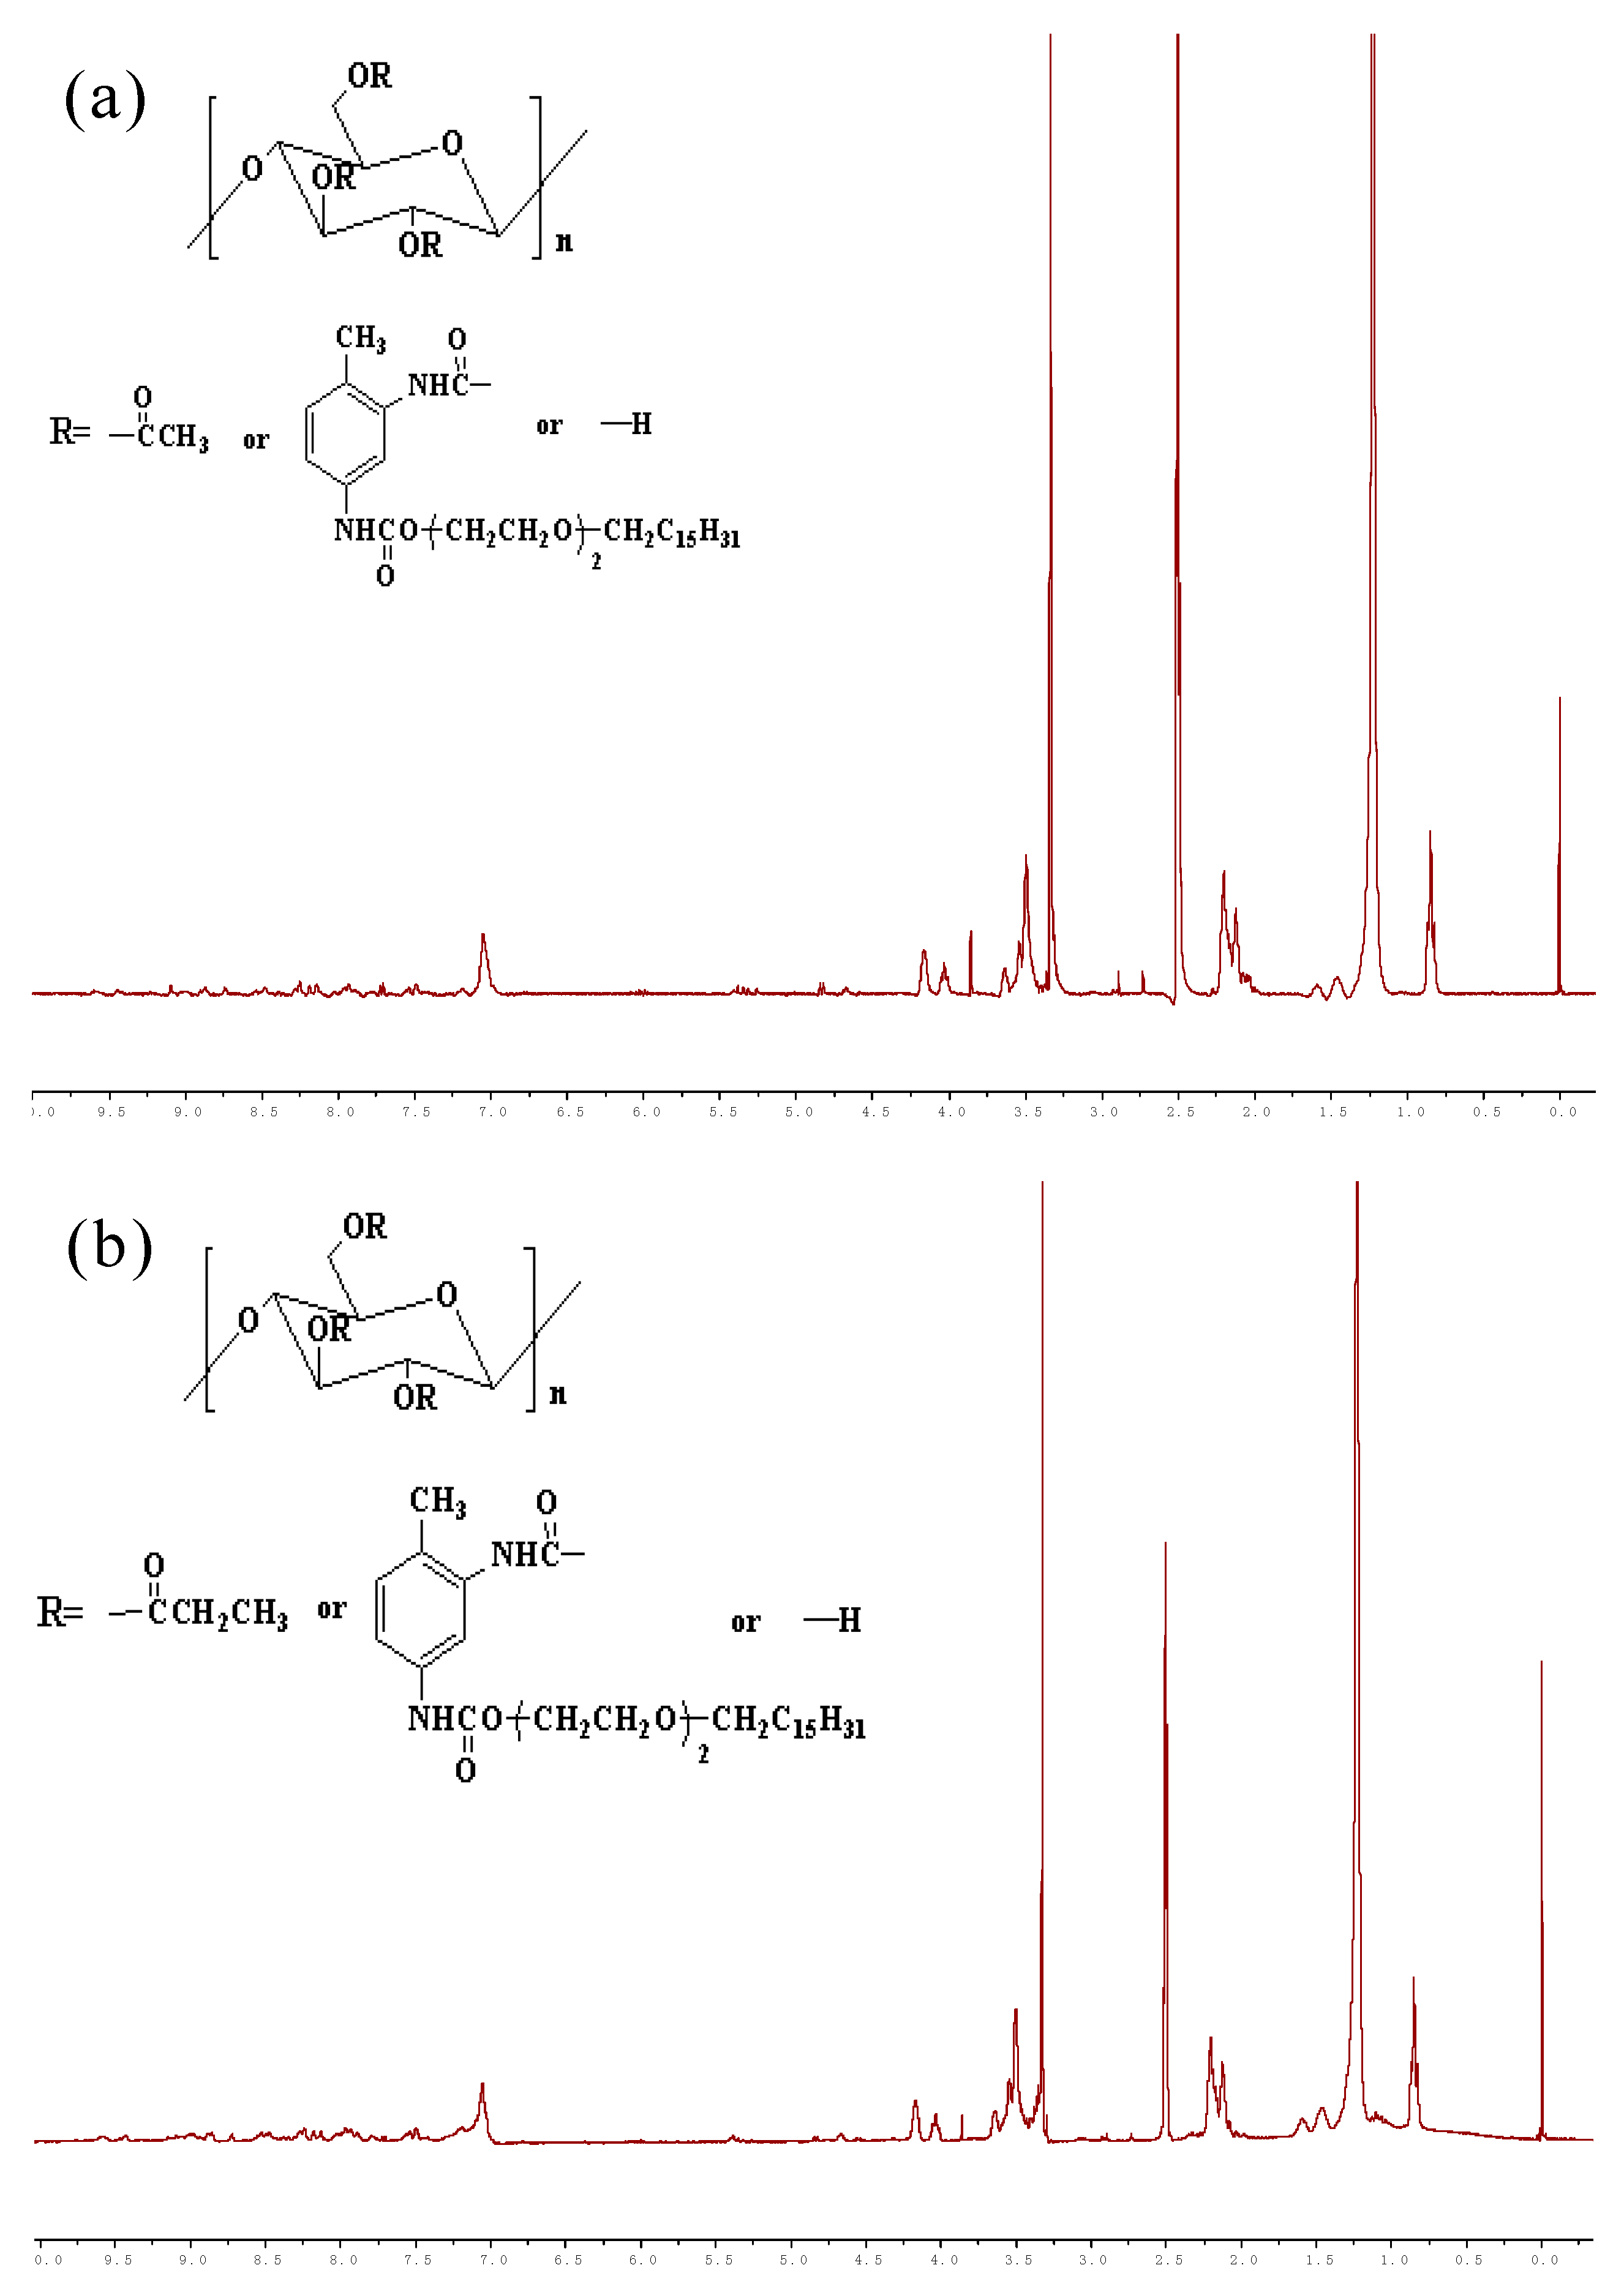
3.2. 1H-NMR
3.3. DSC
3.4. POM
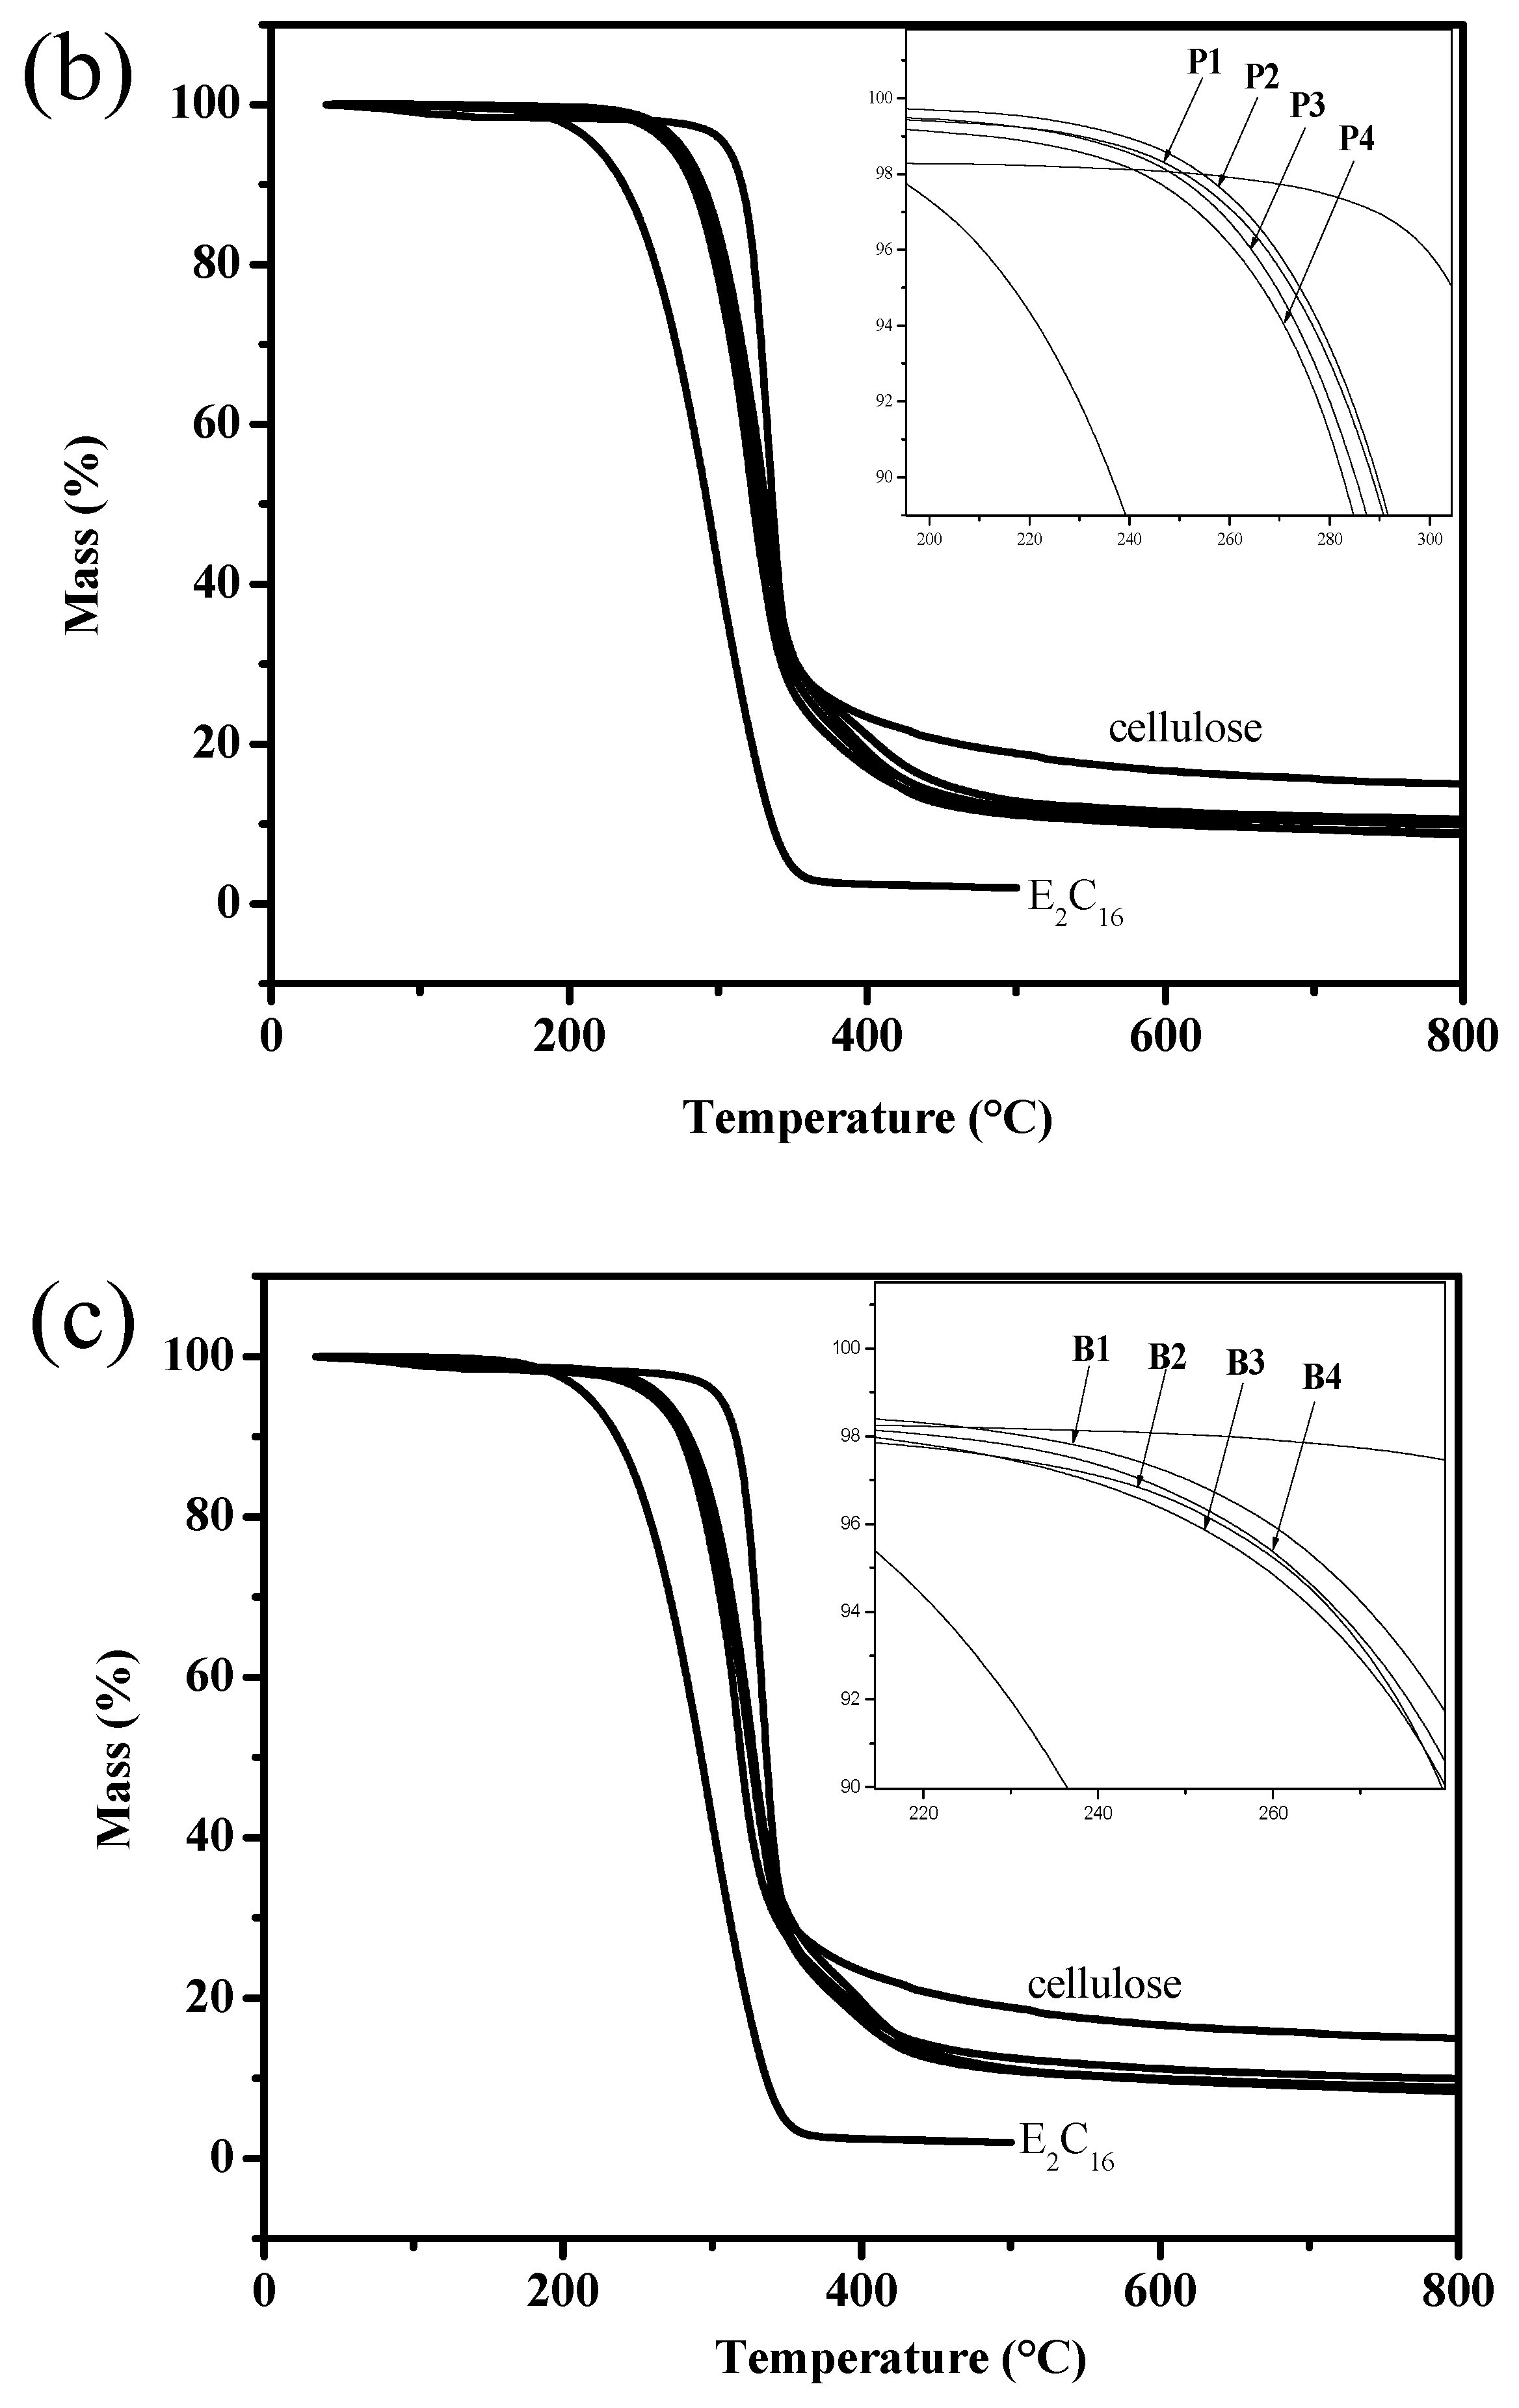
3.5. TGA
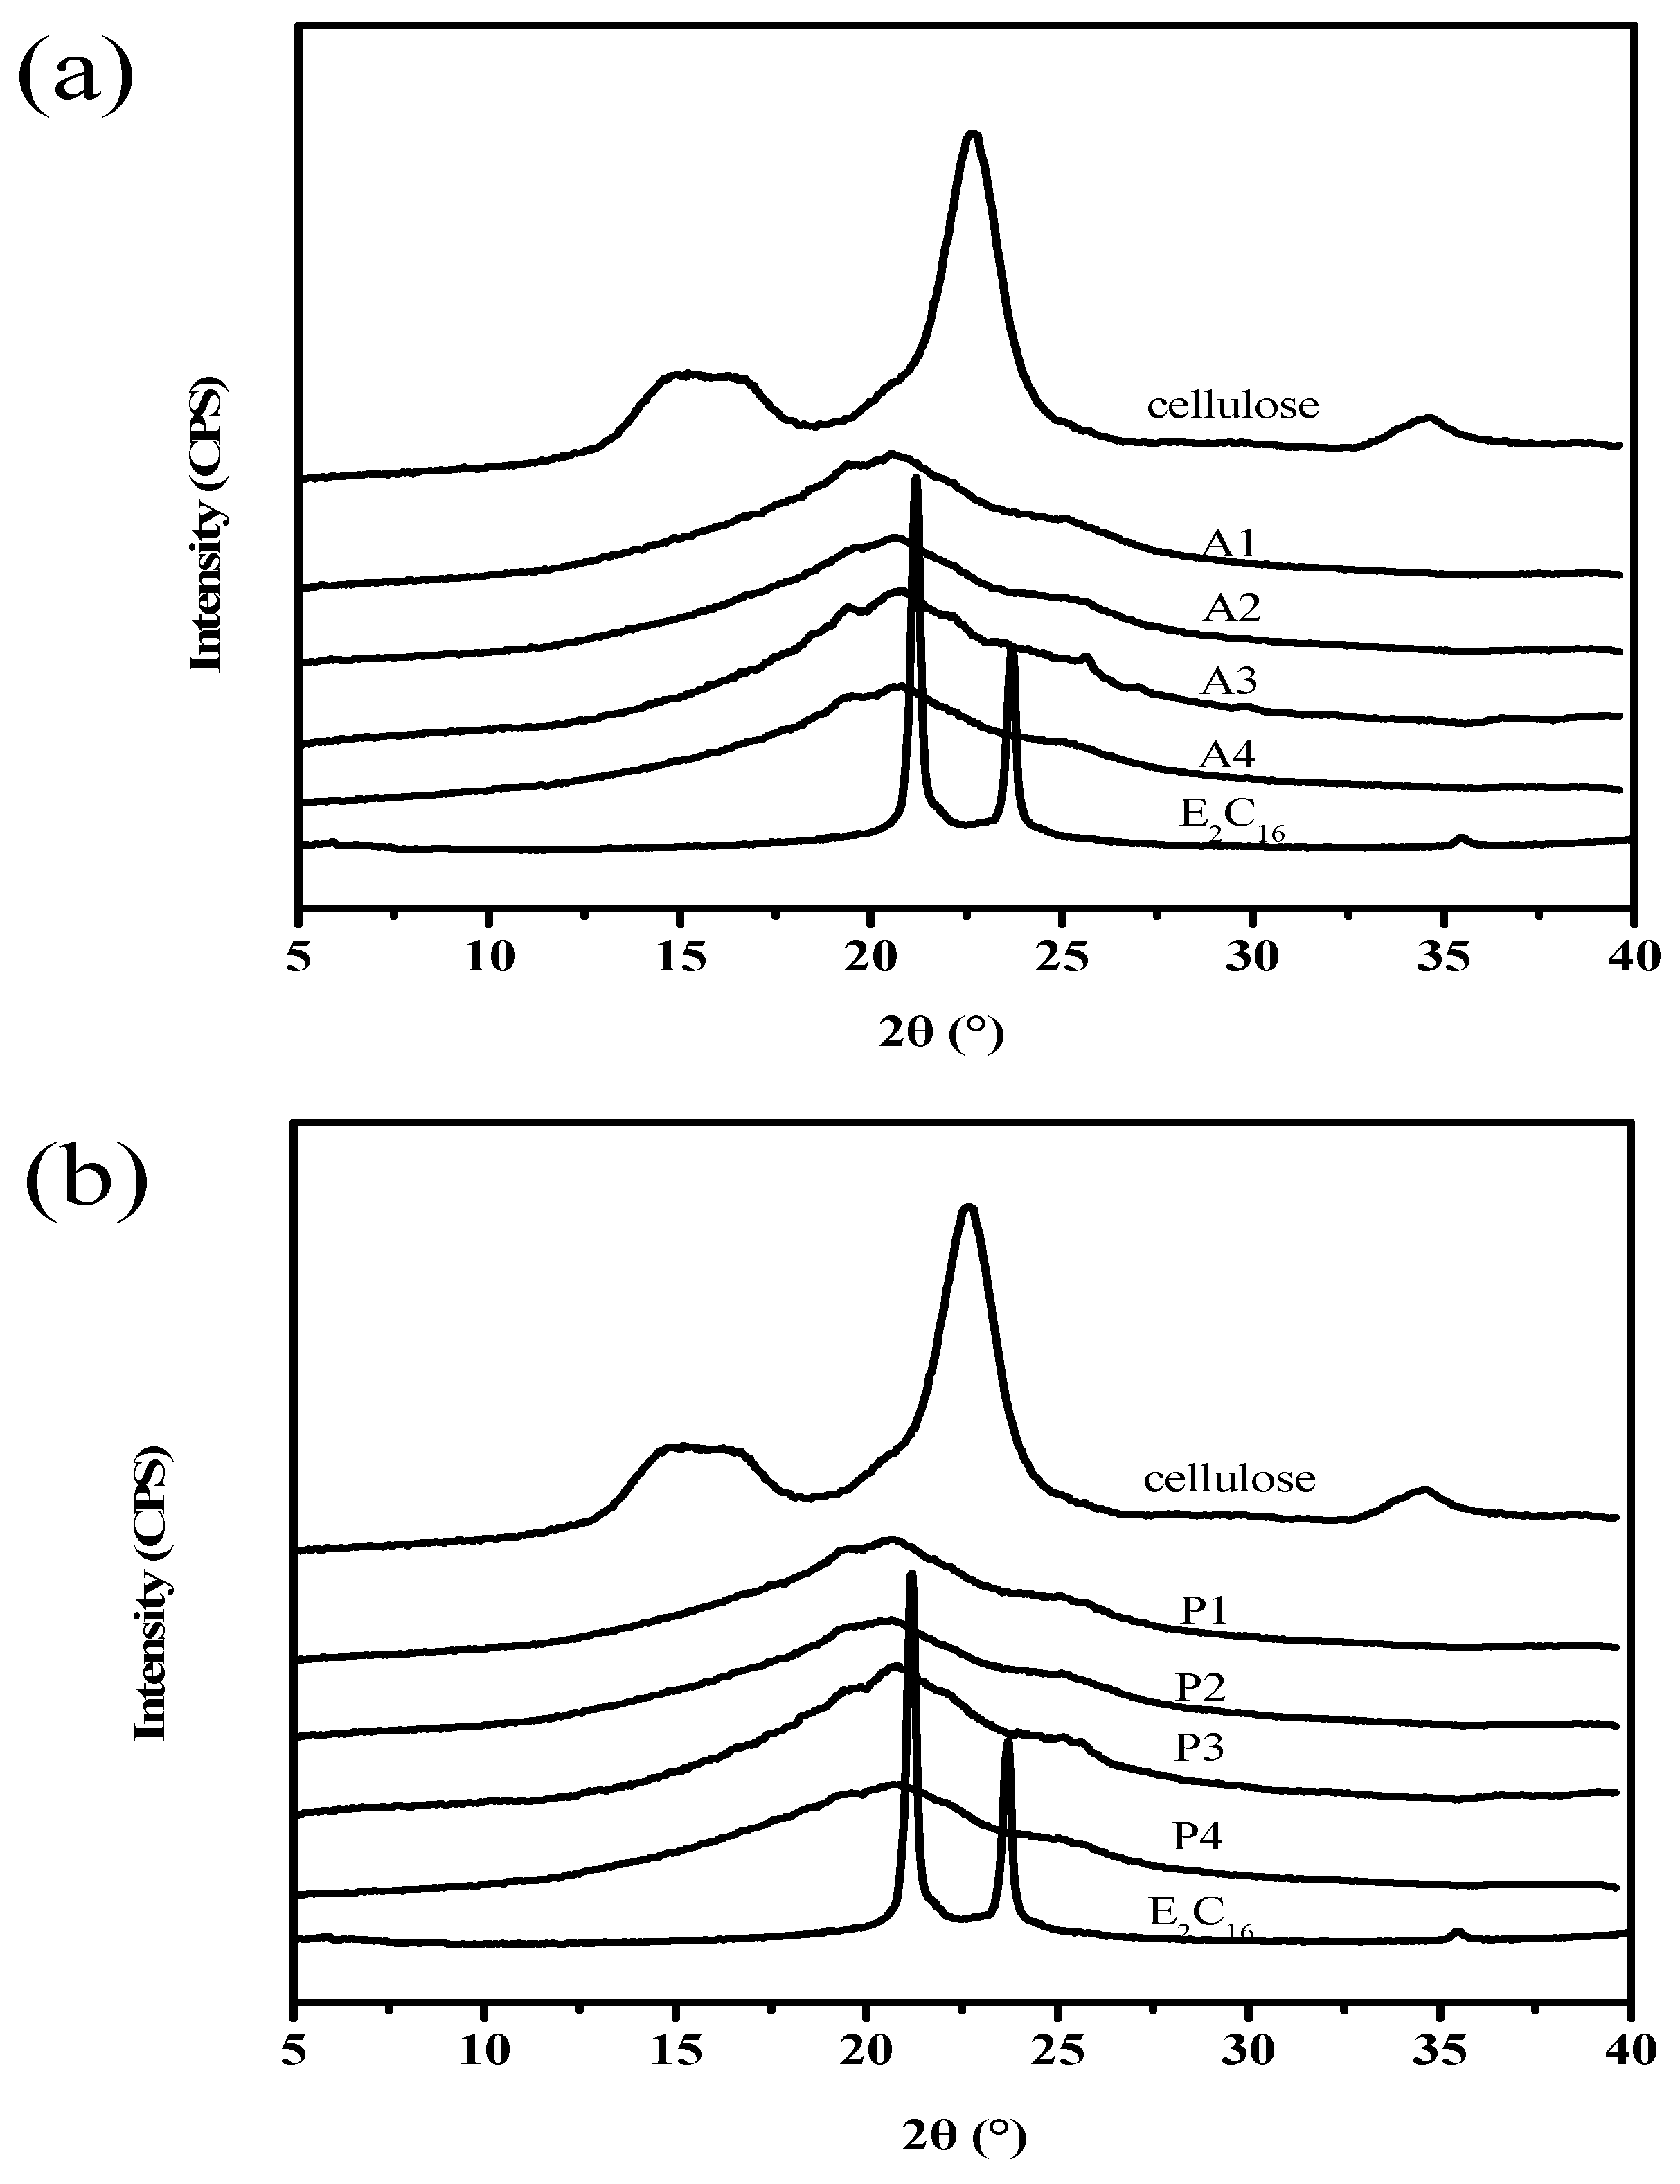
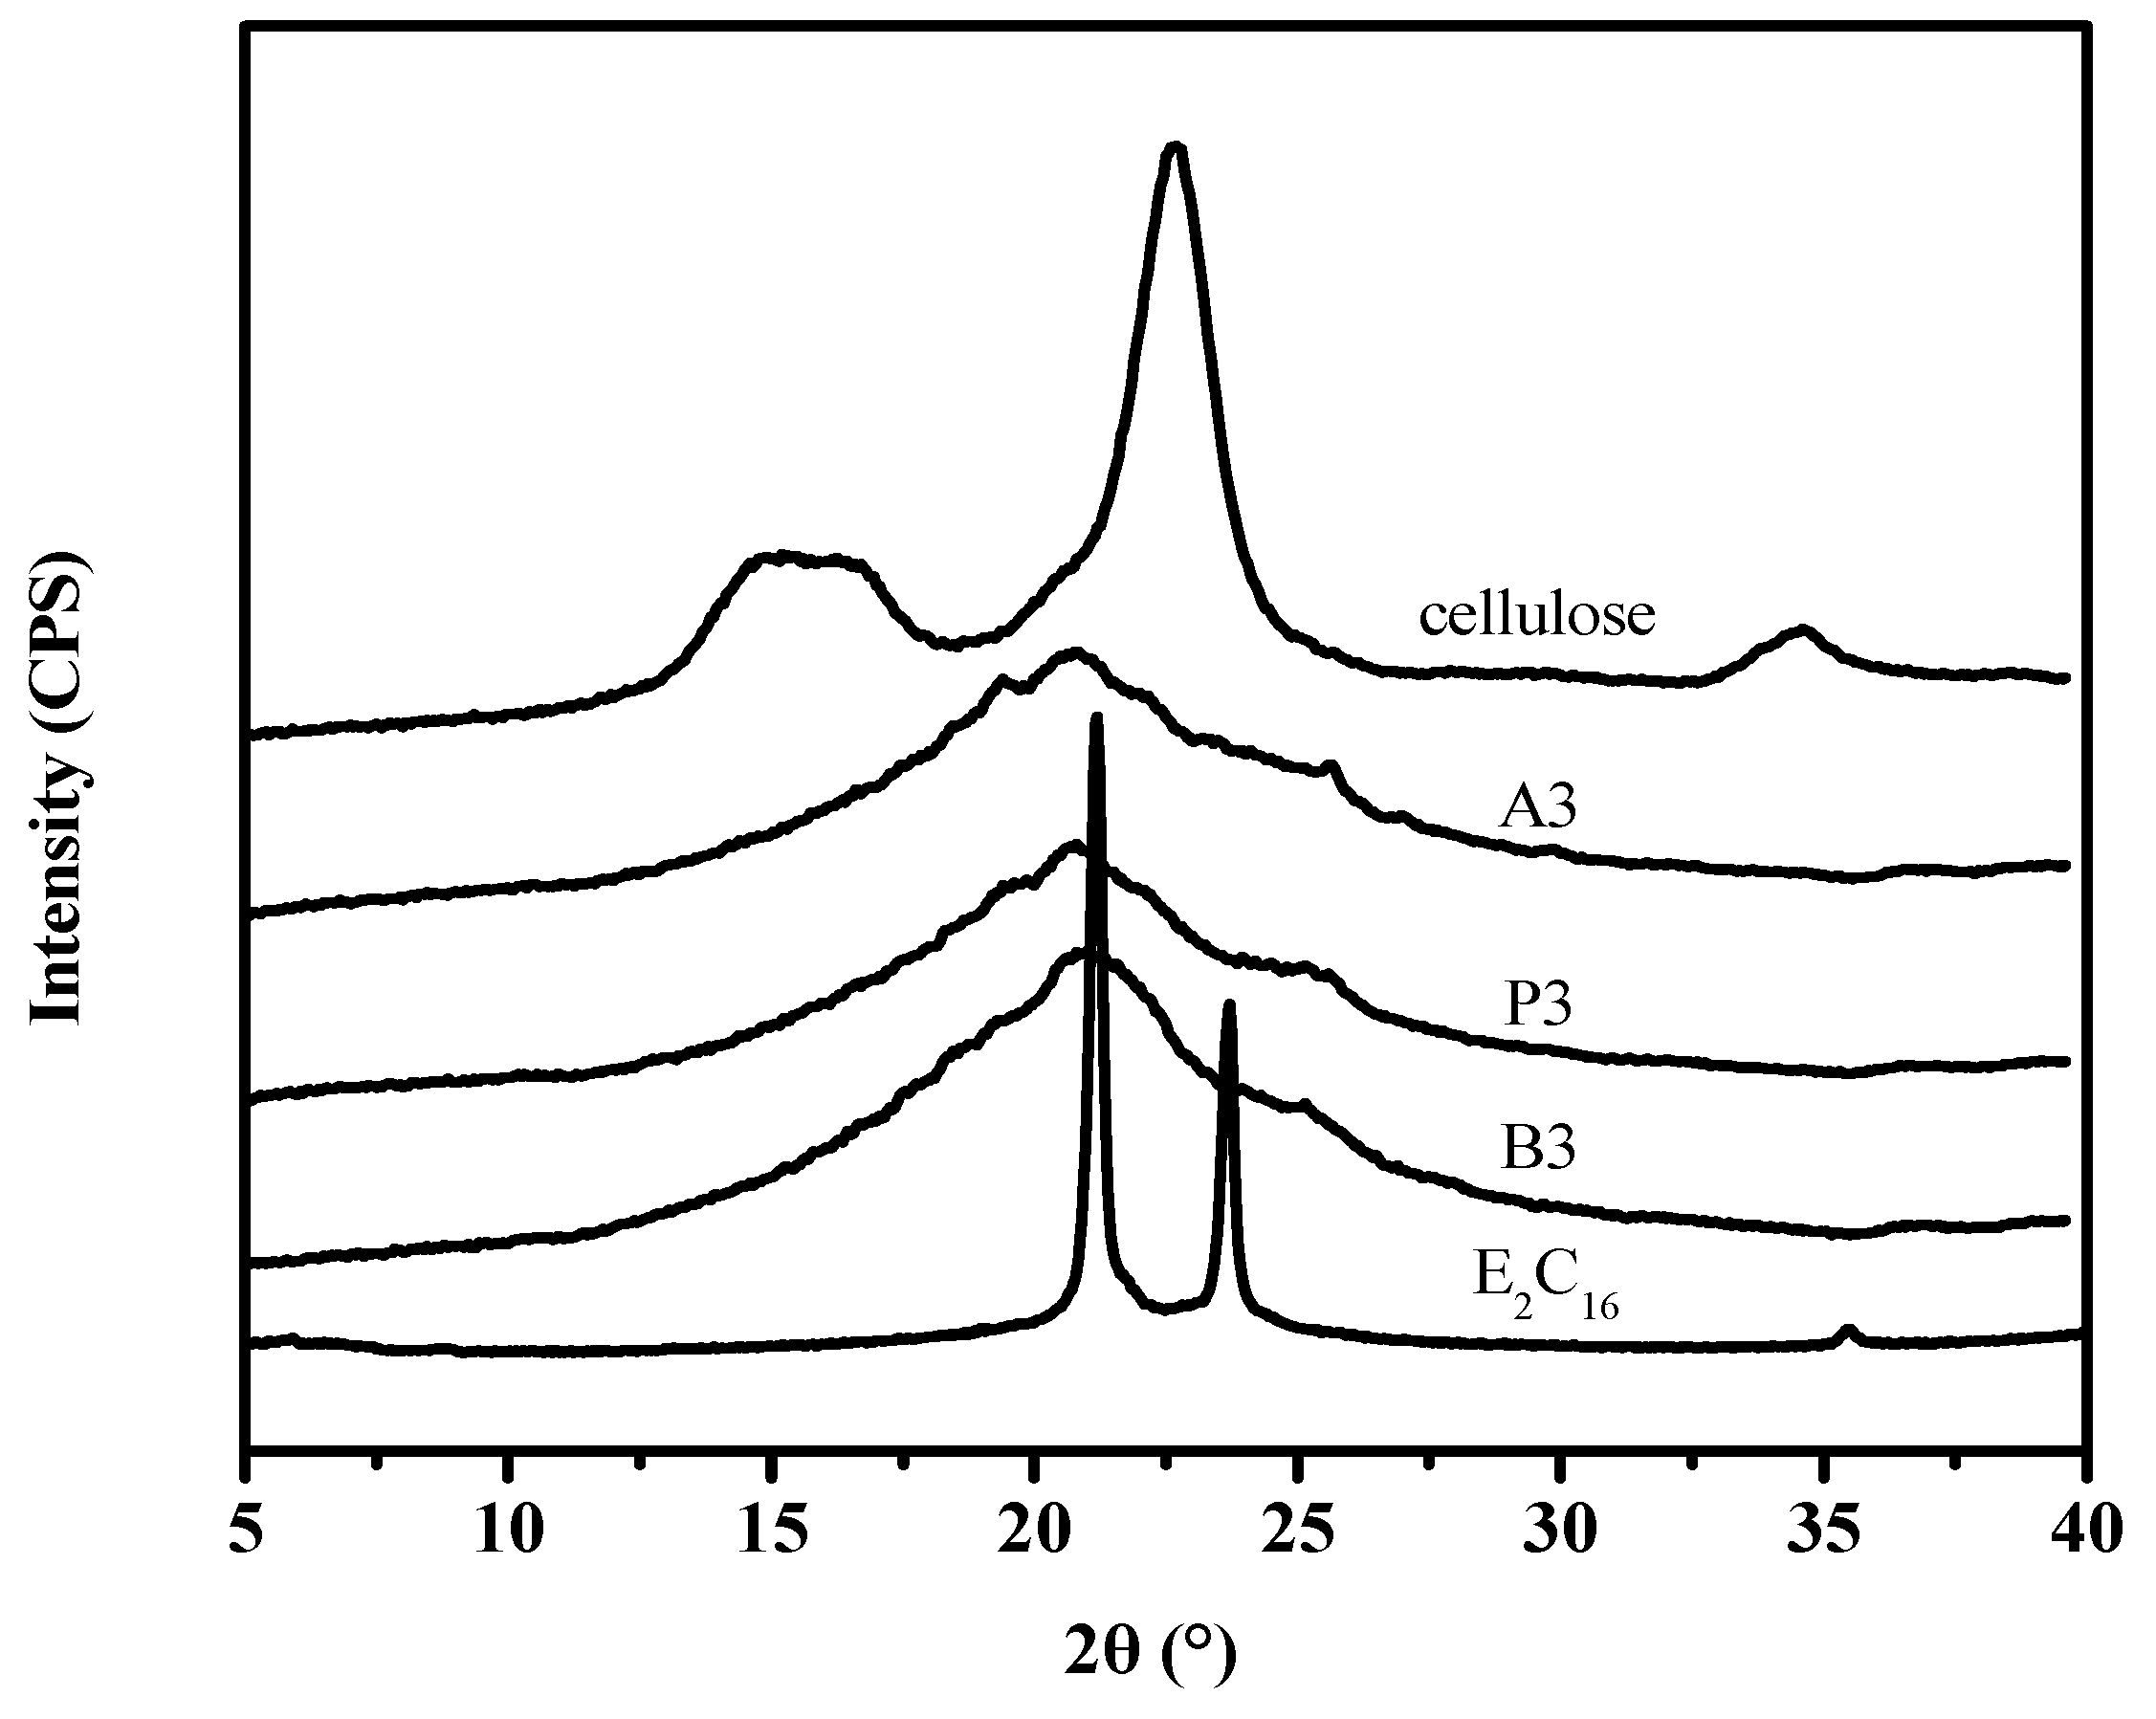
3.6. WAXD
4. Conclusions
Author Contributions
Acknowledgments
Conflicts of Interest
References
- Isik, M.; Sardon, H.; Mecerreyes, D. Ionic Liquids and Cellulose: Dissolution, Chemical Modification and Preparation of New Cellulosic Materials. Int. J. Mol. Sci. 2014, 15, 11922–11940. [Google Scholar] [CrossRef] [PubMed]
- Zhang, Y.; Li, H.F.; Li, X.D.; Gibril, M.E.; Han, K.Q. Green chemical preparation of cellulose/high performance elastomer blend fibers by melt-spinning method. J. Polym. Res. 2013, 20, 171. [Google Scholar] [CrossRef]
- Zhang, Y.; Li, H.F.; Li, X.D.; Gibril, M.E.; Yu, M.H. Chemical modification of cellulose by in situ reactive extrusion in ionic liquid. Carbohyd. Polym. 2014, 99, 126–131. [Google Scholar] [CrossRef] [PubMed]
- Barthel, S.; Heinze, T. Acylation and carbanilation of cellulose in ionic liquids. Green Chem. 2006, 8, 301–306. [Google Scholar] [CrossRef]
- Gyorgy, S.; Attila, D.; Szilvia, K. Molecular structure and properties of cellulose acetate chemically modified with caprolactone. Eur. Polym. J. 2008, 44, 357–365. [Google Scholar]
- Labafzadeh, S.R.; Vyavaharkar, K.; Kavakka, J.S. Amination thiolation of chloroacetyl cellulose through reactive dissolution in N,N-dimethylformamide. Carbohyd. Polym. 2015, 116, 60–66. [Google Scholar] [CrossRef] [PubMed]
- Saleh, H.; Yvonne, A.; Mikael, S. All-cellulose nanocomposite fibers produced by melt spinning cellulose acetate butyrate and cellulose nanocrystals. Cellulose 2014, 21, 2665–2678. [Google Scholar]
- Teramoto, Y.; Nishio, Y. Cellulose diacetate-graft-poly(lactic acid)s: Synthesis of wide-ranging compositions and their thermal and mechanical properties. Polymer 2003, 44, 2071–2079. [Google Scholar] [CrossRef]
- Yan, C.; Zhang, J.M.; Lv, Y.X. Thermoplastic Cellulose-graft-poly(l-lactide) copolymers homogeneously synthesized in an lonic liquid with 4-dimethylamininopyridine catalyst. Biomacromolecules 2009, 10, 2013–2018. [Google Scholar] [CrossRef] [PubMed]
- Qian, Y.Q.; Han, N.; Bo, Y.W.; Tan, L.L.; Zhang, L.F.; Zhang, X.X. Homogeneous synthesis of cellulose acrylate-g-poly (n-alkyl acrylate) solid–solid phase change materials via free radical polymerization. Carbohydr. Polym. 2018, 193, 129–136. [Google Scholar] [CrossRef]
- Vaca-Garcia, C.; Gozzelino, G.; Glasser, W.G.; Borredon, M.E. Dynamic mechanical thermal analysis transitions of partially and fully substituted cellulose fatty esters. J. Polym. Sci. Polym. Phys. 2003, 41, 281–288. [Google Scholar] [CrossRef]
- Xiao, P.; Zhang, J.M.; Feng, Y.; Wu, J.; He, J.S.; Zhang, J. Synthesis, characterization and properties of novel cellulose derivatives containing phosphorus: Cellulose diphenyl phosphate and its mixed esters. Cellulose 2014, 21, 2369–2378. [Google Scholar] [CrossRef]
- Luan, Y.H.; Wu, J.; Zhan, M.S.; Zhang, J.M.; Zhang, J.; He, J.S. “One pot” homogeneous synthesis of thermoplastic cellulose acetate-graft-poly(l-lactide) copolymers from unmodified cellulose. Cellulose 2013, 20, 327–337. [Google Scholar] [CrossRef]
- Li, Y.; Wu, M.; Liu, R.G.; Huang, Y. Cellulose-based solid–solid phase change materials synthesized in ionic liquid. Sol. Energy Mater. Sol. Cells 2009, 93, 1321–1328. [Google Scholar] [CrossRef]
- Luan, Y.H.; Zhang, J.M.; Zhan, M.S.; Wu, J.; Zhang, J.; He, J.S. Highly efficient propionylation and butyralation of cellulose in an ionic liquid catalyzed by 4-dimethylminopyridine. Carbohyd. Polym. 2013, 92, 307–311. [Google Scholar] [CrossRef] [PubMed]
- Han, N.; Li, Z.N.; Zhang, X.X.; Yu, W.Y.; Chen, X.Y.; Wang, D.; Li, J.B. Synthesis and Characterization of Cellulose-g-Polyoxyethylene (2) Hexadecyl Ether Solid-Solid Phase Change Materials. Cellulose 2016, 23, 1663–1674. [Google Scholar] [CrossRef]
- Mohamed, J.; Nasko, T.; Ivo, H. Biobased and sustainable alternative route to long-chain cellulose esters. Biomacromolecules 2017, 18, 498–504. [Google Scholar]
- Zhang, Z.L.; Zhang, X.X.; Shi, H.F.; Li, W.; Meng, J.Y. Poly(diethylene glycol hexadecyl ether acrylate)(PC16E2AA) and poly(acrylonitrile-co-vinylidene chloride)/PC16E2AA sheath/core thermo-regulated sub-microfibers. Text. Res. J. 2016, 86, 493–501. [Google Scholar] [CrossRef]
- Zhang, H.; Wu, J.; Zhang, J.; He, J.S. 1-Allyl-3-methylimidazolium Chloride Room Temperature Ionic Liquid: A New and Powerful Nonderivatizing Solvent for Cellulose. Macromolecules 2005, 38, 8272–8277. [Google Scholar] [CrossRef]


| Sample No. | CA:AGU (mol:mol) | CP:AGU (mol:mol) | CB:AGU (mol:mol) | Pyridine:AGU (mol:mol) | E2C16:AGU (mol:mol) |
|---|---|---|---|---|---|
| S-B | - | - | - | 2.5:1 | 4:1 |
| A1 | 0.5:1 | - | - | 2.5:1 | 4:1 |
| A2 | 1.0:1 | - | - | 2.5:1 | 4:1 |
| A3 | 1.5:1 | - | - | 2.5:1 | 4:1 |
| A4 | 2.0:1 | - | - | 2.5:1 | 4:1 |
| P1 | - | 0.5:1 | - | 2.5:1 | 4:1 |
| P2 | - | 1.0:1 | - | 2.5:1 | 4:1 |
| P3 | - | 1.5:1 | - | 2.5:1 | 4:1 |
| P4 | - | 2.0:1 | - | 2.5:1 | 4:1 |
| B1 | - | - | 0.5:1 | 2.5:1 | 4:1 |
| B2 | - | - | 1.0:1 | 2.5:1 | 4:1 |
| B3 | - | - | 1.5:1 | 2.5:1 | 4:1 |
| B4 | - | - | 2.0:1 | 2.5:1 | 4:1 |
| Sample No. | AA:AGU (mol:mol) | PA:AGU (mol:mol) | BA:AGU (mol:mol) | E2C16:AGU (mol:mol) | DS1a | DS2b |
|---|---|---|---|---|---|---|
| S-B | - | - | - | 4:1 | - | 1.01 |
| A1 | 0.5:1 | - | - | 4:1 | 0.35 | 0.59 |
| A2 | 1.0:1 | - | - | 4:1 | 0.58 | 0.75 |
| A3 | 1.5:1 | - | - | 4:1 | 0.75 | 0.86 |
| A4 | 2.0:1 | - | - | 4:1 | 1.09 | 0.52 |
| P1 | - | 0.5:1 | - | 4:1 | 0.36 | 0.62 |
| P2 | - | 1.0:1 | - | 4:1 | 0.55 | 0.80 |
| P3 | - | 1.5:1 | - | 4:1 | 0.79 | 0.97 |
| P4 | - | 2.0:1 | - | 4:1 | 1.00 | 0.88 |
| B1 | - | - | 0.5:1 | 4:1 | 0.35 | 0.79 |
| B2 | - | - | 1.0:1 | 4:1 | 0.54 | 0.93 |
| B3 | - | - | 1.5:1 | 4:1 | 0.75 | 1.02 |
| B4 | - | - | 2.0:1 | 4:1 | 1.04 | 0.91 |
| Sample No. | DS1 | DS2 | a (wt %) | Heating | Cooling | |||||
|---|---|---|---|---|---|---|---|---|---|---|
| Tmo b (°C) | Tmp c (°C) | ΔHm (J/g) | ΔHm* d (J/g) | Tco e (°C) | Tcp f (°C) | ΔHc (J/g) | ||||
| E2C16 | - | - | 100 | 27.6 | 34.4 | 104 | 104 | 29.2 | 23.9 | 95 |
| A1 | 0.35 | 0.59 | 41 | 5.4 | 10.4 | 13 | 43 | 15.3 | -0.6 | 13 |
| A2 | 0.58 | 0.75 | 44 | 6.3 | 16.5 | 16 | 46 | 16.8 | 2.8 | 15 |
| A3 | 0.75 | 0.86 | 45 | 8.0 | 18.6 | 17 | 47 | 17.6 | 3.5 | 20 |
| A4 | 1.09 | 0.52 | 36 | 4.5 | 9.8 | 11 | 38 | 15.0 | -1.0 | 12 |
| P1 | 0.36 | 0.62 | 41 | 2.8 | 11.7 | 12 | 43 | 12.8 | 0.7 | 13 |
| P2 | 0.55 | 0.80 | 44 | 9.7 | 18.3 | 18 | 46 | 14.1 | 2.7 | 17 |
| P3 | 0.79 | 0.97 | 46 | 13.7 | 23.9 | 27 | 48 | 20.8 | 9.8 | 28 |
| P4 | 1.00 | 0.88 | 44 | 13.2 | 23.2 | 21 | 46 | 19.4 | 7.2 | 21 |
| B1 | 0.35 | 0.79 | 45 | 5.8 | 14.0 | 16 | 46 | 18.9 | 3.3 | 17 |
| B2 | 0.54 | 0.93 | 46 | 11.0 | 21.7 | 24 | 48 | 21.4 | 9.3 | 24 |
| B3 | 0.75 | 1.02 | 46 | 14.2 | 26.1 | 32 | 48 | 23.3 | 11.1 | 30 |
| B4 | 1.04 | 0.91 | 43 | 13.7 | 25.0 | 24 | 45 | 21.0 | 9.5 | 23 |
| Sample No. | DS1 | DS2 | Tdo (°C) | Tdp (°C) | Mass Loss (%) |
|---|---|---|---|---|---|
| Cellulose | - | - | 319 | 335 | 85.4 |
| E2C16 | - | - | 246 | 295 | 98.0 |
| A1 | 0.35 | 0.59 | 294 | 331 | 92.0 |
| A2 | 0.58 | 0.75 | 295 | 328 | 89.9 |
| A3 | 0.75 | 0.86 | 295 | 324 | 91.3 |
| A4 | 1.09 | 0.52 | 296 | 325 | 90.8 |
| P1 | 0.36 | 0.62 | 296 | 333 | 90.1 |
| P2 | 0.55 | 0.80 | 295 | 330 | 89.4 |
| P3 | 0.79 | 0.97 | 294 | 325 | 91.4 |
| P4 | 1.00 | 0.88 | 288 | 321 | 91.2 |
| B1 | 0.35 | 0.79 | 296 | 329 | 91.2 |
| B2 | 0.54 | 0.93 | 289 | 317 | 90.1 |
| B3 | 0.75 | 1.02 | 293 | 328 | 91.7 |
| B4 | 1.04 | 0.91 | 290 | 326 | 91.1 |
© 2018 by the authors. Licensee MDPI, Basel, Switzerland. This article is an open access article distributed under the terms and conditions of the Creative Commons Attribution (CC BY) license (http://creativecommons.org/licenses/by/4.0/).
Share and Cite
Yu, W.; Han, N.; Qian, Y.; Zhang, X.; Li, W. Effects of Fatty Acid Anhydride on the Structure and Thermal Properties of Cellulose-g-Polyoxyethylene (2) Hexadecyl Ether. Polymers 2018, 10, 498. https://doi.org/10.3390/polym10050498
Yu W, Han N, Qian Y, Zhang X, Li W. Effects of Fatty Acid Anhydride on the Structure and Thermal Properties of Cellulose-g-Polyoxyethylene (2) Hexadecyl Ether. Polymers. 2018; 10(5):498. https://doi.org/10.3390/polym10050498
Chicago/Turabian StyleYu, Wanyong, Na Han, Yongqiang Qian, Xingxiang Zhang, and Wei Li. 2018. "Effects of Fatty Acid Anhydride on the Structure and Thermal Properties of Cellulose-g-Polyoxyethylene (2) Hexadecyl Ether" Polymers 10, no. 5: 498. https://doi.org/10.3390/polym10050498
APA StyleYu, W., Han, N., Qian, Y., Zhang, X., & Li, W. (2018). Effects of Fatty Acid Anhydride on the Structure and Thermal Properties of Cellulose-g-Polyoxyethylene (2) Hexadecyl Ether. Polymers, 10(5), 498. https://doi.org/10.3390/polym10050498