3.1. Synthesis of MIPs
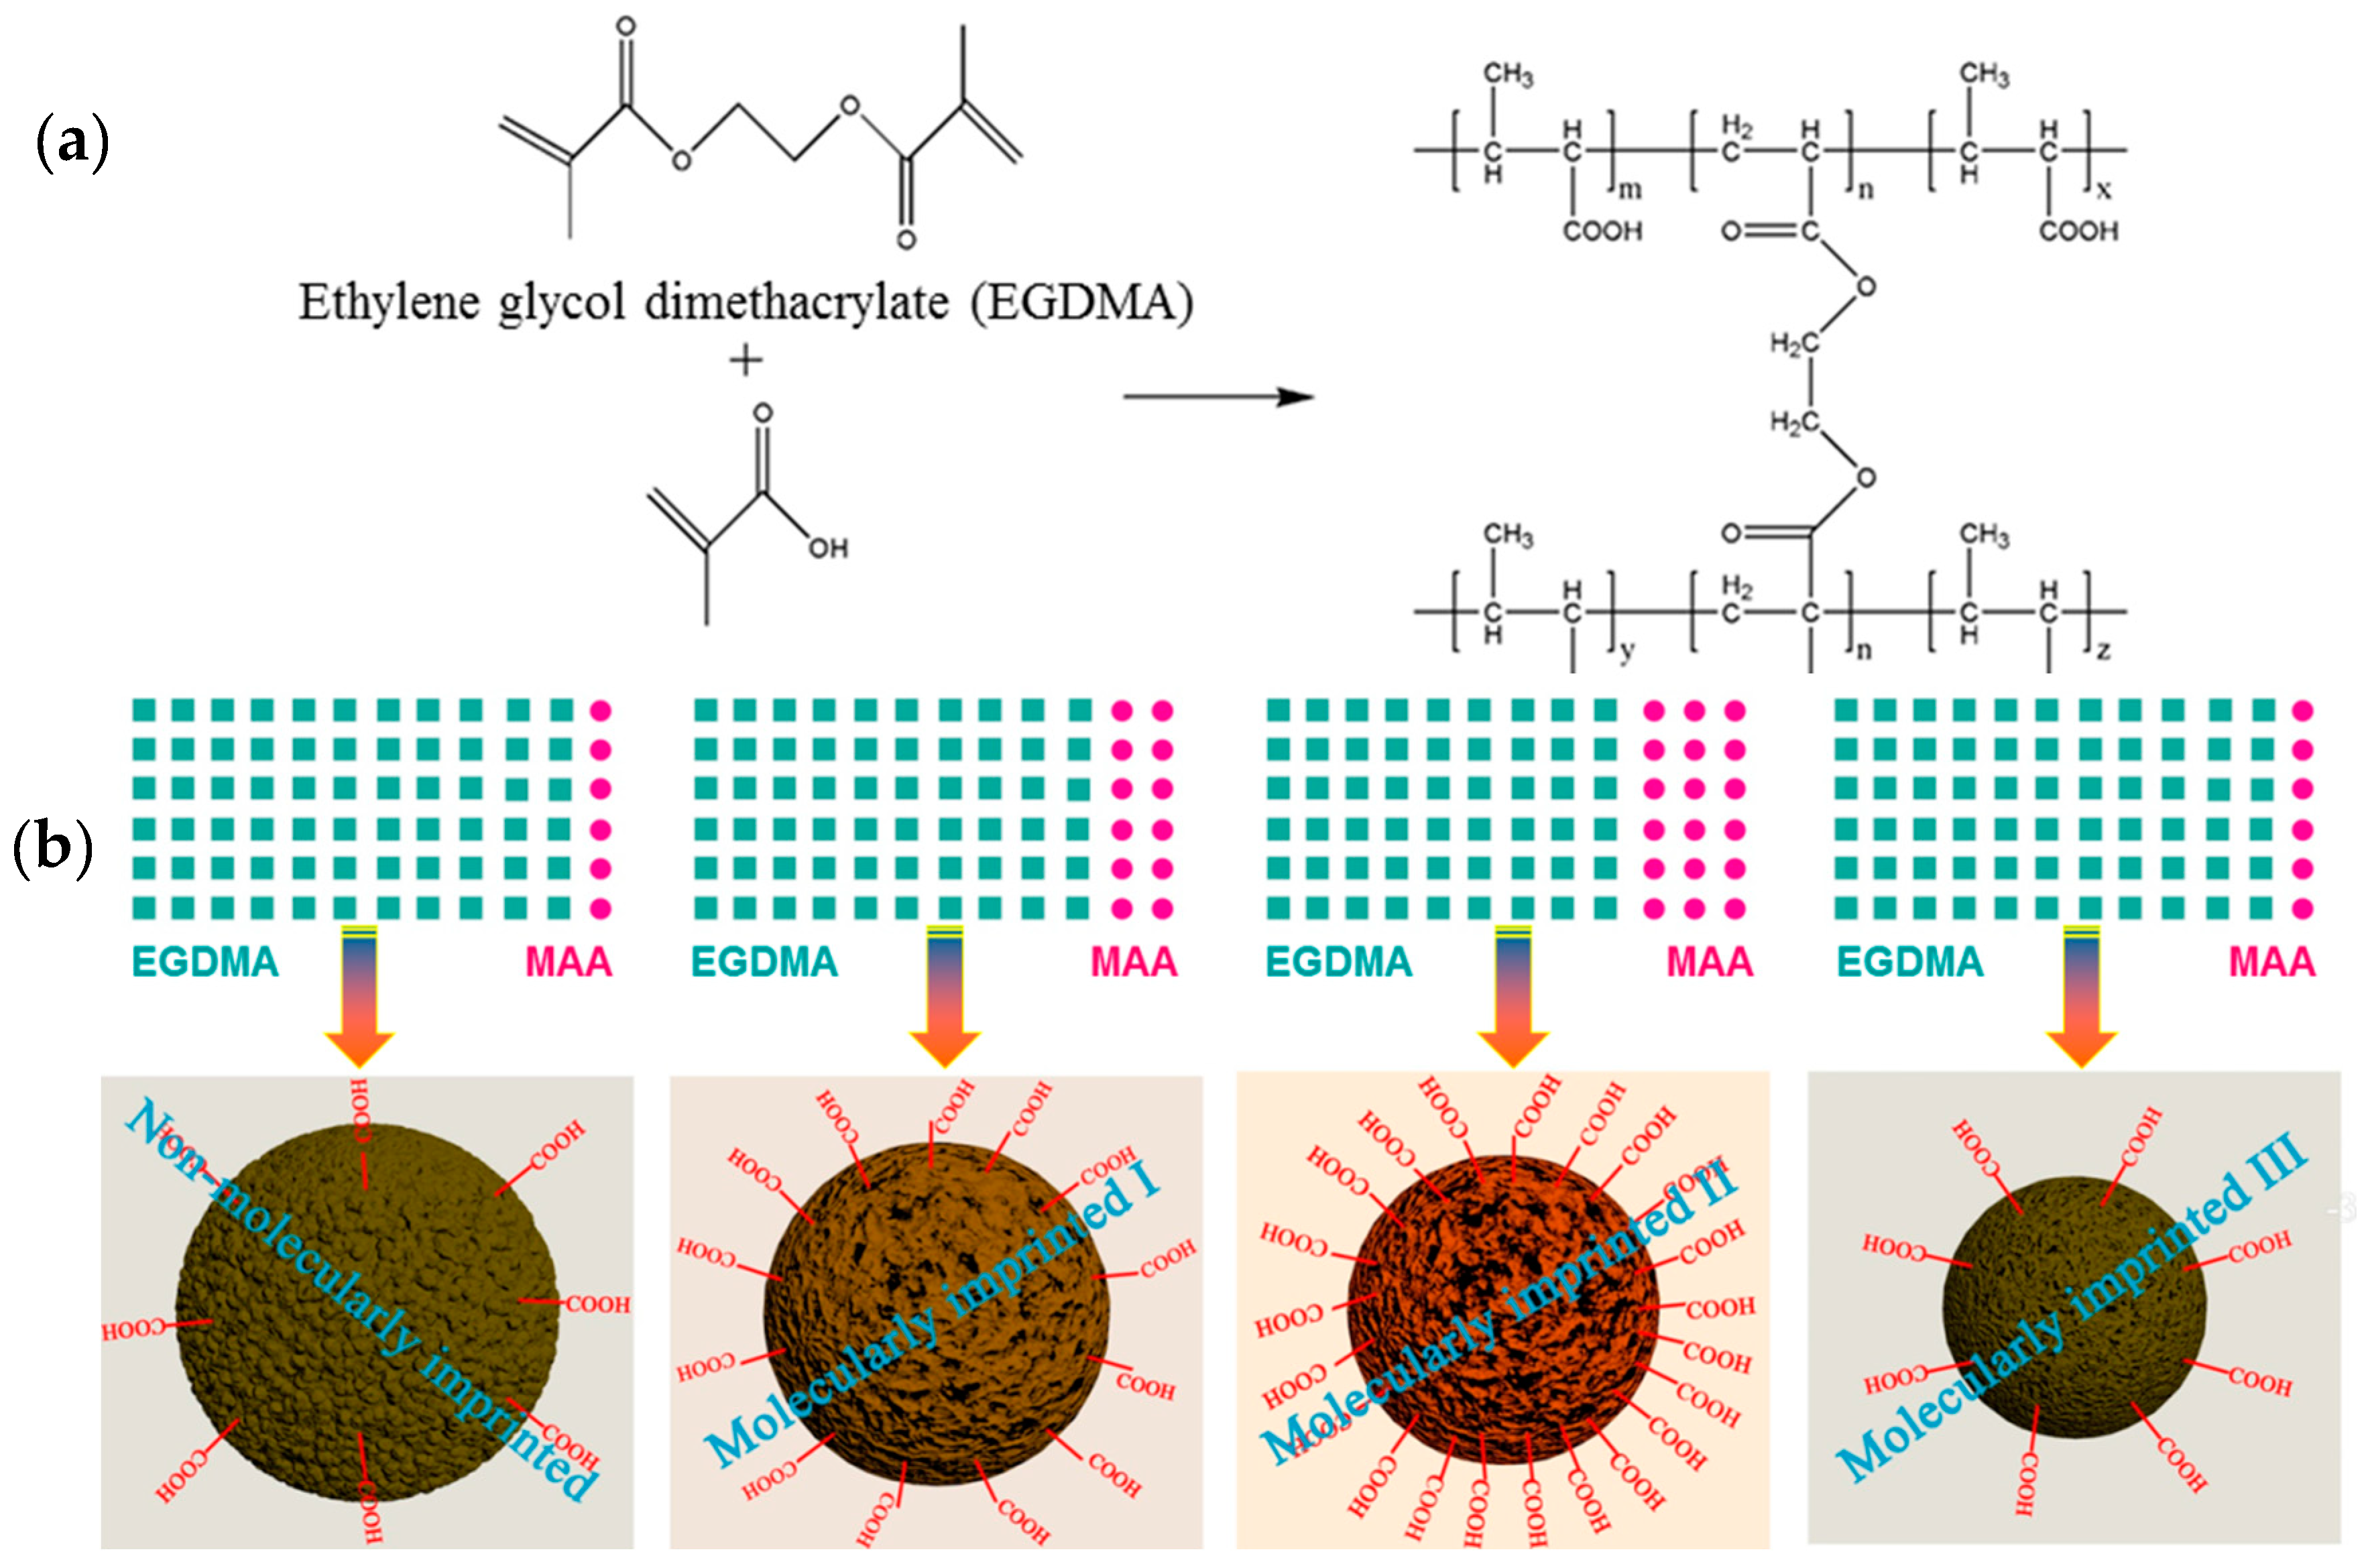
The molecular structures and schematic diagrams showing the main reaction are presented in
Figure 1a,b. The free radical polymerization of MAA and EGDMA was triggered by the initiator AIBN, leading to the formation of a polymer with a cross-linked network structure which facilitated the adsorption and immobilization of the MG molecules. The molecular imprinting with MG as the template and the subsequent adsorption of MG could then be readily achieved. In addition, ion pairs could be formed between the ionized carboxyl groups of the MAA (i.e., carboxylate) and cationic MG molecules, thus facilitating ionic bonding interactions.
During the synthesis of the MIPs, the addition ratio of the functional monomers to the cross-linking agent played a significant role, as it can directly affect the structure and surface properties of the resulting MIPs (
Figure 1b).
Table 1 summarizes the experimental observations obtained for various microspheres, as synthesized by the emulsion polymerization of the functional monomer and cross-linking agent at different addition ratios. The samples listed in
Table 1 (progressing from top to bottom) were synthesized with increasing amounts of MAA. The samples (denoted as
a and
b) were prepared at the EGDMA:MAA addition ratios of 100:0 and 97:3, respectively. The Pickering emulsions at these two ratios exhibited a low stability since the formed emulsion system underwent demulsification reactions under heating conditions. The demulsification caused the formation of a highly cross-linked bulk polymer, rather than the desired polymer microspheres (
Figure S2, Supplementary Materials). In contrast, polymer microspheres could be formed in the cases of the other samples including NIPs, MIPs-1, MIPs-2, and MIPs-3 after Pickering emulsion polymerization had proceeded for 16 h. The yields of these emulsion polymerizations are presented in
Table 1, along with the average diameters calculated for these prepared polymer microspheres. It was apparent that the produced microspheres were synthesized in a quantitative manner, revealing the success of the polymerization of MAA and EGDMA. It is also noteworthy that the yield of the microspheres was reduced when greater amounts of MAA was added, likely due to ineffective polymerization when the monomer MAA accounted for a too high percentage.
3.2. Characterization of the Synthesized MIPs
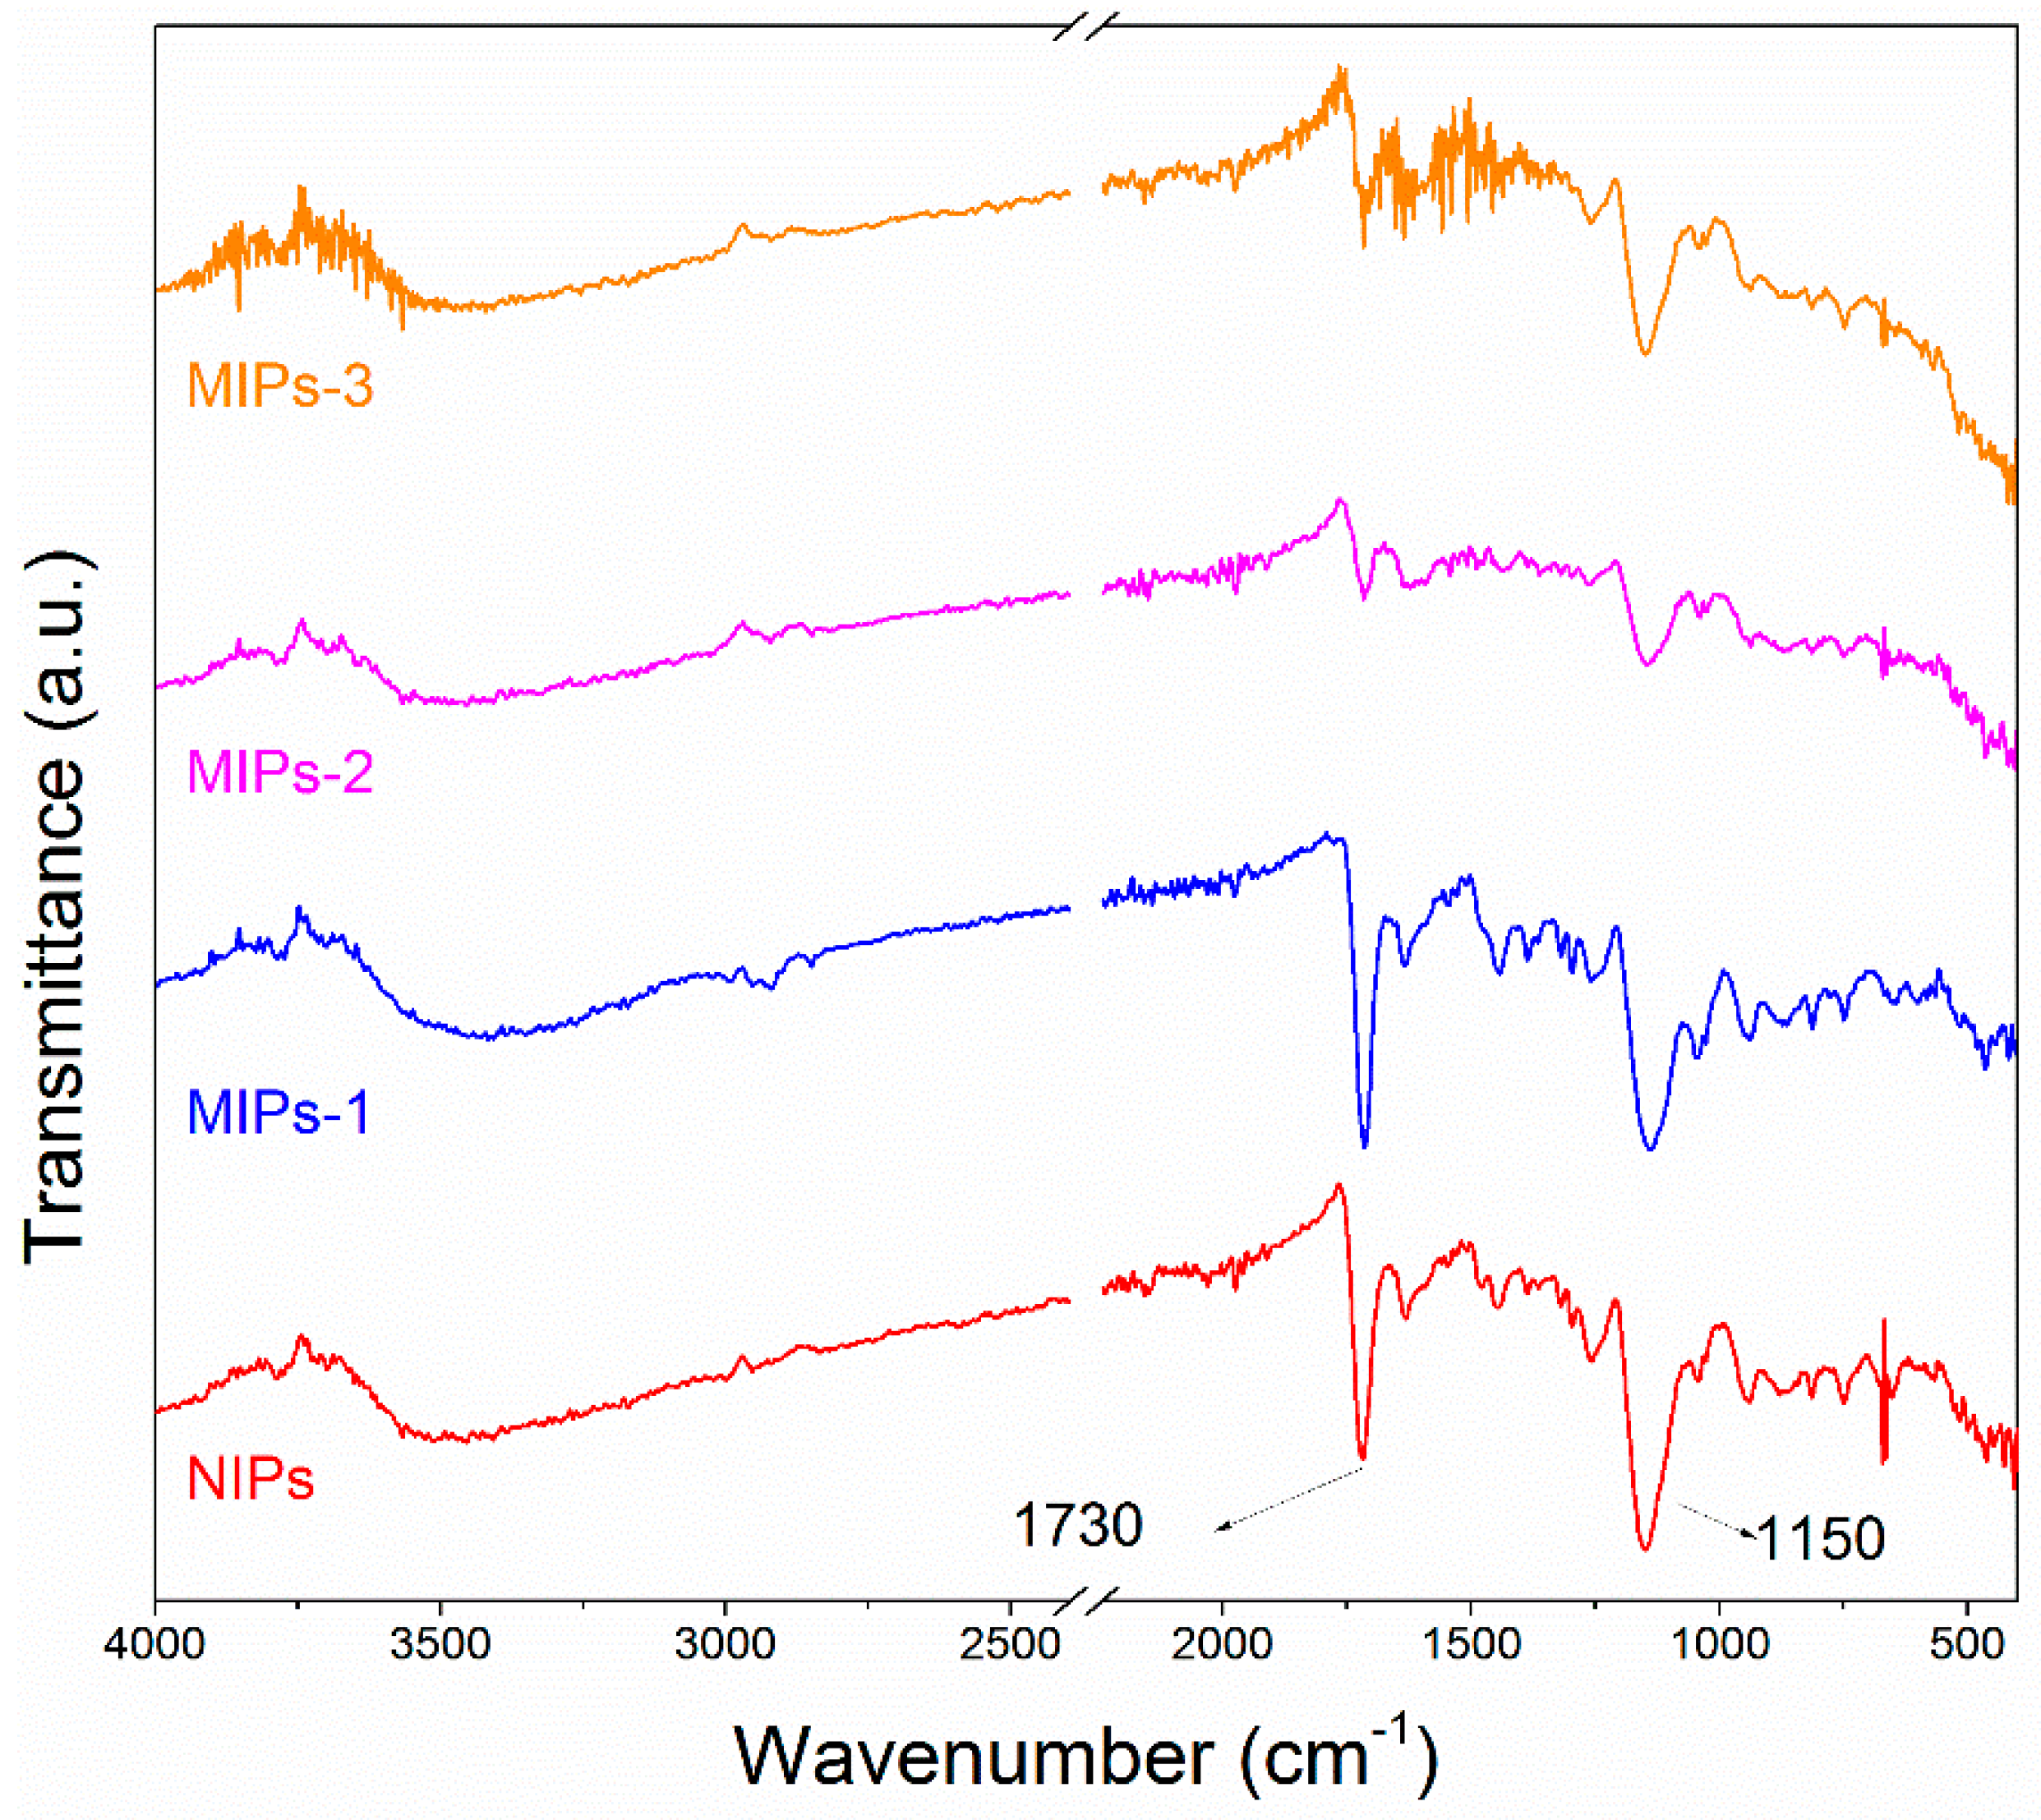
The FTIR spectra of the synthesized MIPs-1, MIPs-2 and MIPs-3, as well as the control sample NIPs, are provided in
Figure 2. The absorption at 1730 cm
−1 can be assigned to the stretching vibration of the carboxyl moieties of the MAA, while the absorption at 1150 cm
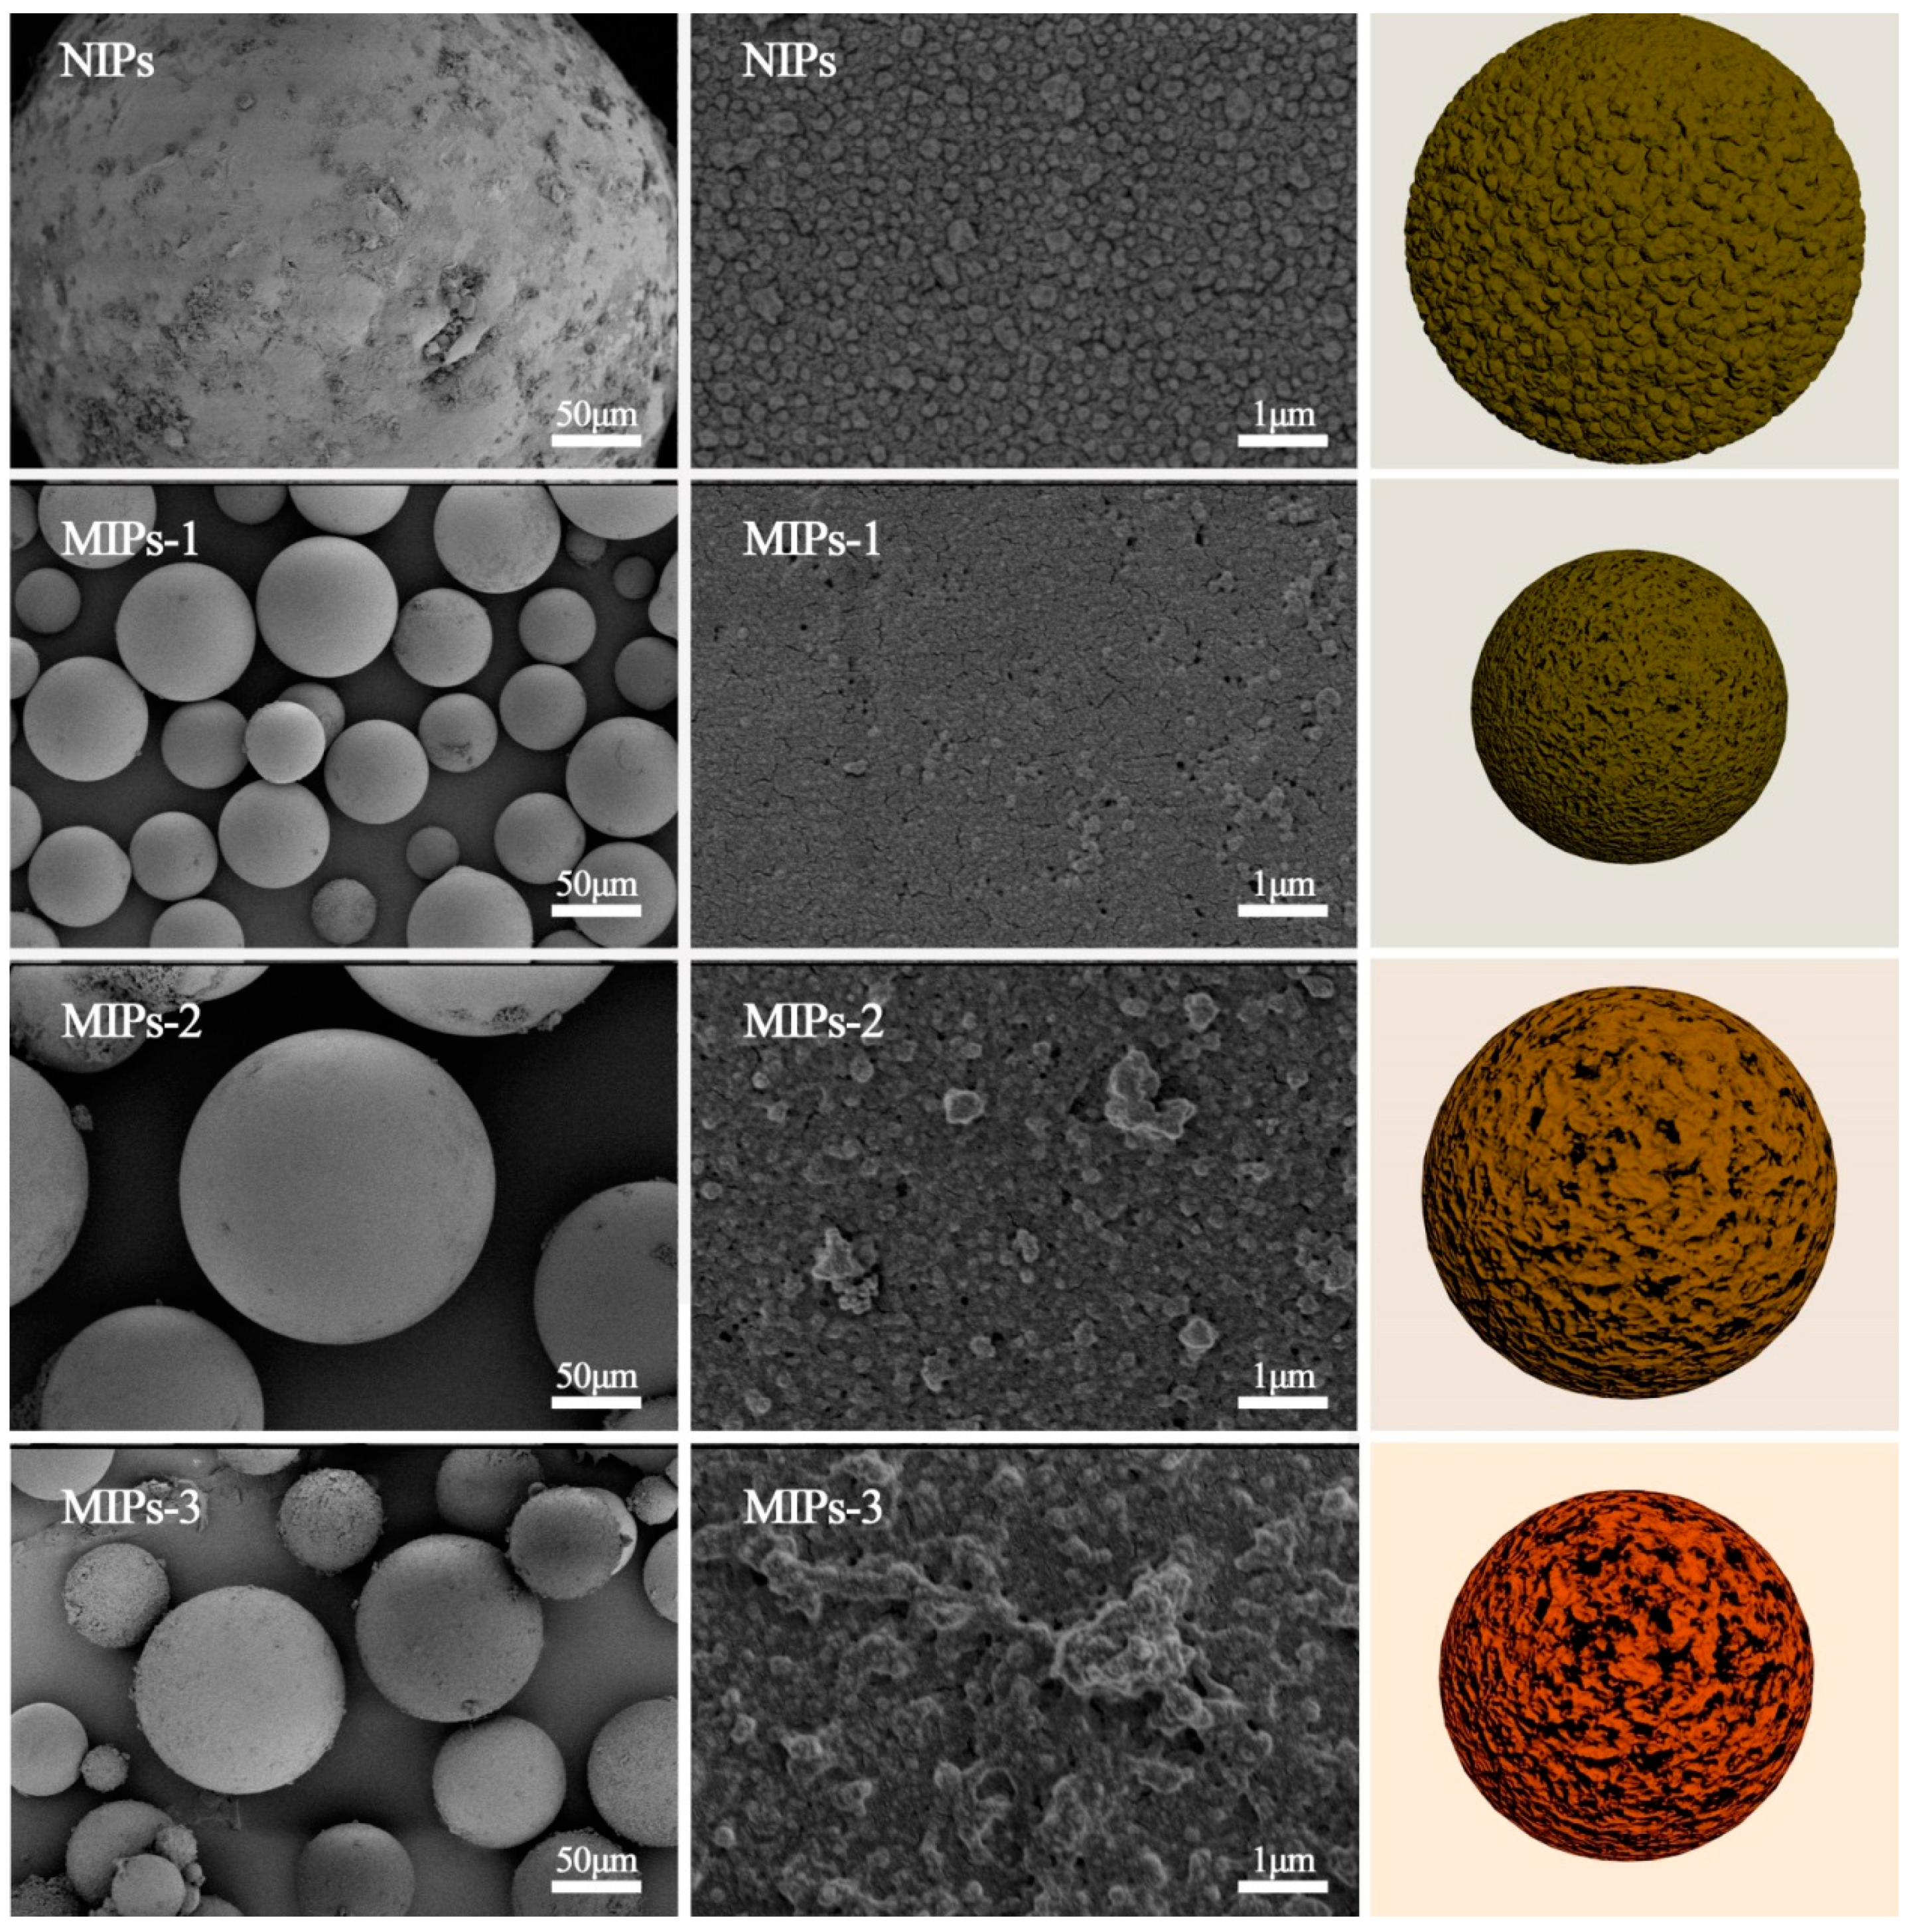
−1 corresponds to the stretching vibration of the C–O–C group present in the formed polymer. It can be noted that all of the prepared samples exhibit nearly identical absorption characteristics, except for the FTIR absorption assigned to the carboxyl functionalities, thus revealing that they had similar structural compositions with a difference in the concentration of carboxyl groups. SEM observations of these samples are shown in
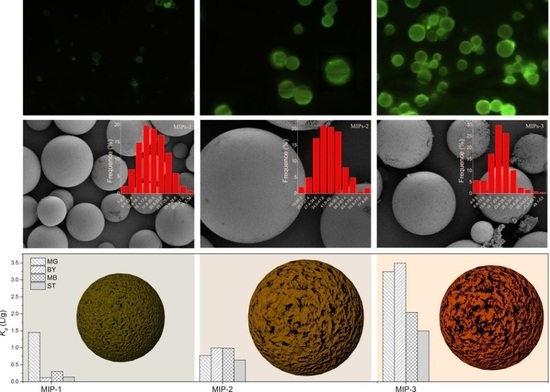
Figure 3, along with their schematic depictions. All of the prepared MIPs exhibited a regular spherical shape. The synthetic conditions exerted a significant impact on the surface morphology and porous structure of the resulting polymer microspheres. Cracks and pores with different sizes were observed on the surfaces of the four types of as-prepared polymer microspheres, among which MIPs-1 exhibited more uniform cracks with smaller dimensions. This is most likely to endow MIPs-1 with the best adsorption selectivity for MG. In comparison to the bulk polymerization processes that require ball milling and grinding, Pickering emulsion polymerization has obvious advantages. For example, the spherical surface of the polymer microspheres as synthesized by Pickering emulsion polymerization facilitates the homogeneous distribution of molecular imprinting sites on the surfaces of the MIPs. Without the need for destructive processes such as ball milling, the specific adsorption sites can also be better protected during the Pickering emulsion polymerization process.
Particle diameter distribution histograms of the various synthesized microspheres are illustrated in
Figure S3 (Supplementary Materials), and the calculated average diameters of the prepared MIPs are presented in
Table 1. The prepared MIPs exhibit a particle diameter range of 19–44 μm. Meanwhile, the sample NIPs that were prepared in the absence of molecular imprinting exhibited a particle diameter (>100 μm) that was obviously larger than that of its molecularly imprinted counterpart MIPs-1 (153 μm vs. 19 μm, see
Table 1). This reveals that the template MG molecules played a significant role in stabilizing the emulsion droplets, leading to the formation of more uniform polymer microspheres with a smaller diameter.
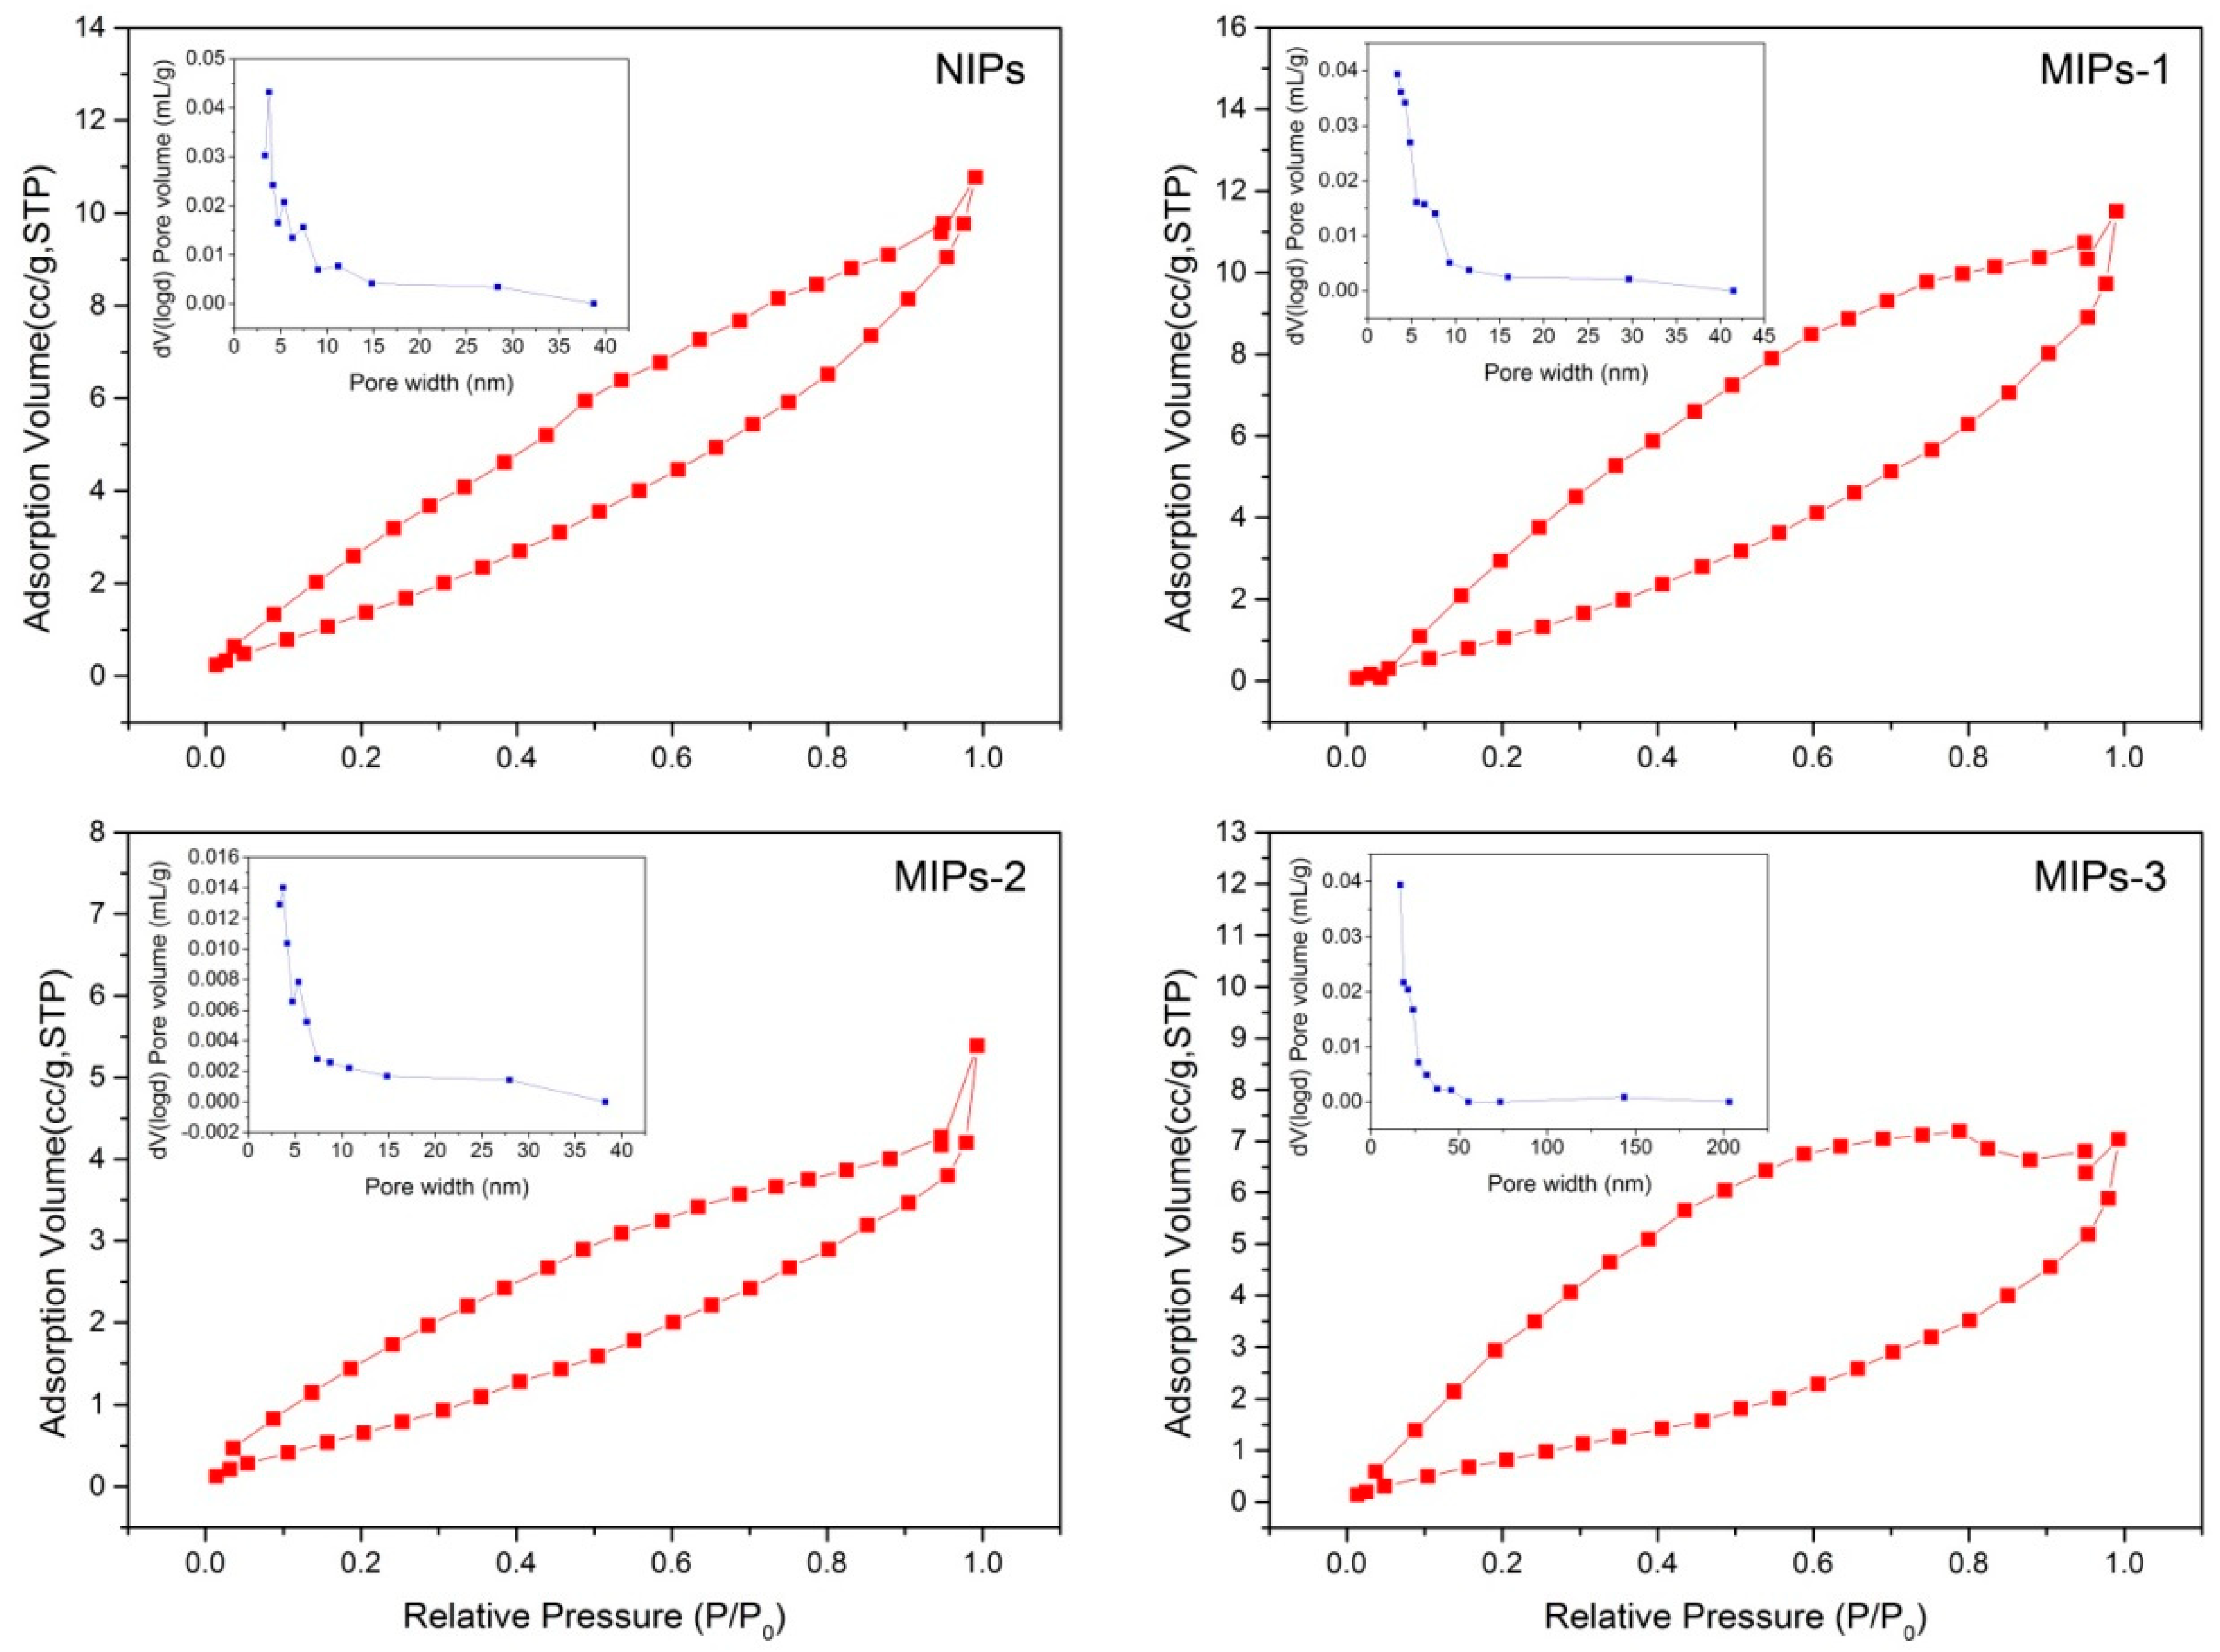
Figure 4 displays the nitrogen adsorption–desorption isotherms as well as the corresponding pore size distribution lines, and the specific results are summarized in
Table S1 (Supplementary Materials). Hysteresis phenomena could be observed for all the prepared polymer microspheres (e.g., the adsorption and desorption lines are not overlapped), as a result of the capillary condensation on the porous surfaces of the polymer microspheres. The prepared MIPs-1, MIPs-2, and NIPs samples showed a smaller average pore size ranging from 5 to 50 nm, as compared to the sample MIPs-3 with a mean pore size ranging from 20 to 200 nm, which was consistent with the results obtained via SEM characterization.
Considering that the MAA:EGDMA feed ratio plays a pivotal role in determining the carboxyl functionality content on the surfaces of the MIPs, which is closely related to the adsorption performance, a systematic study on the surface functionalities was conducted, and the results are shown in
Figure 5.
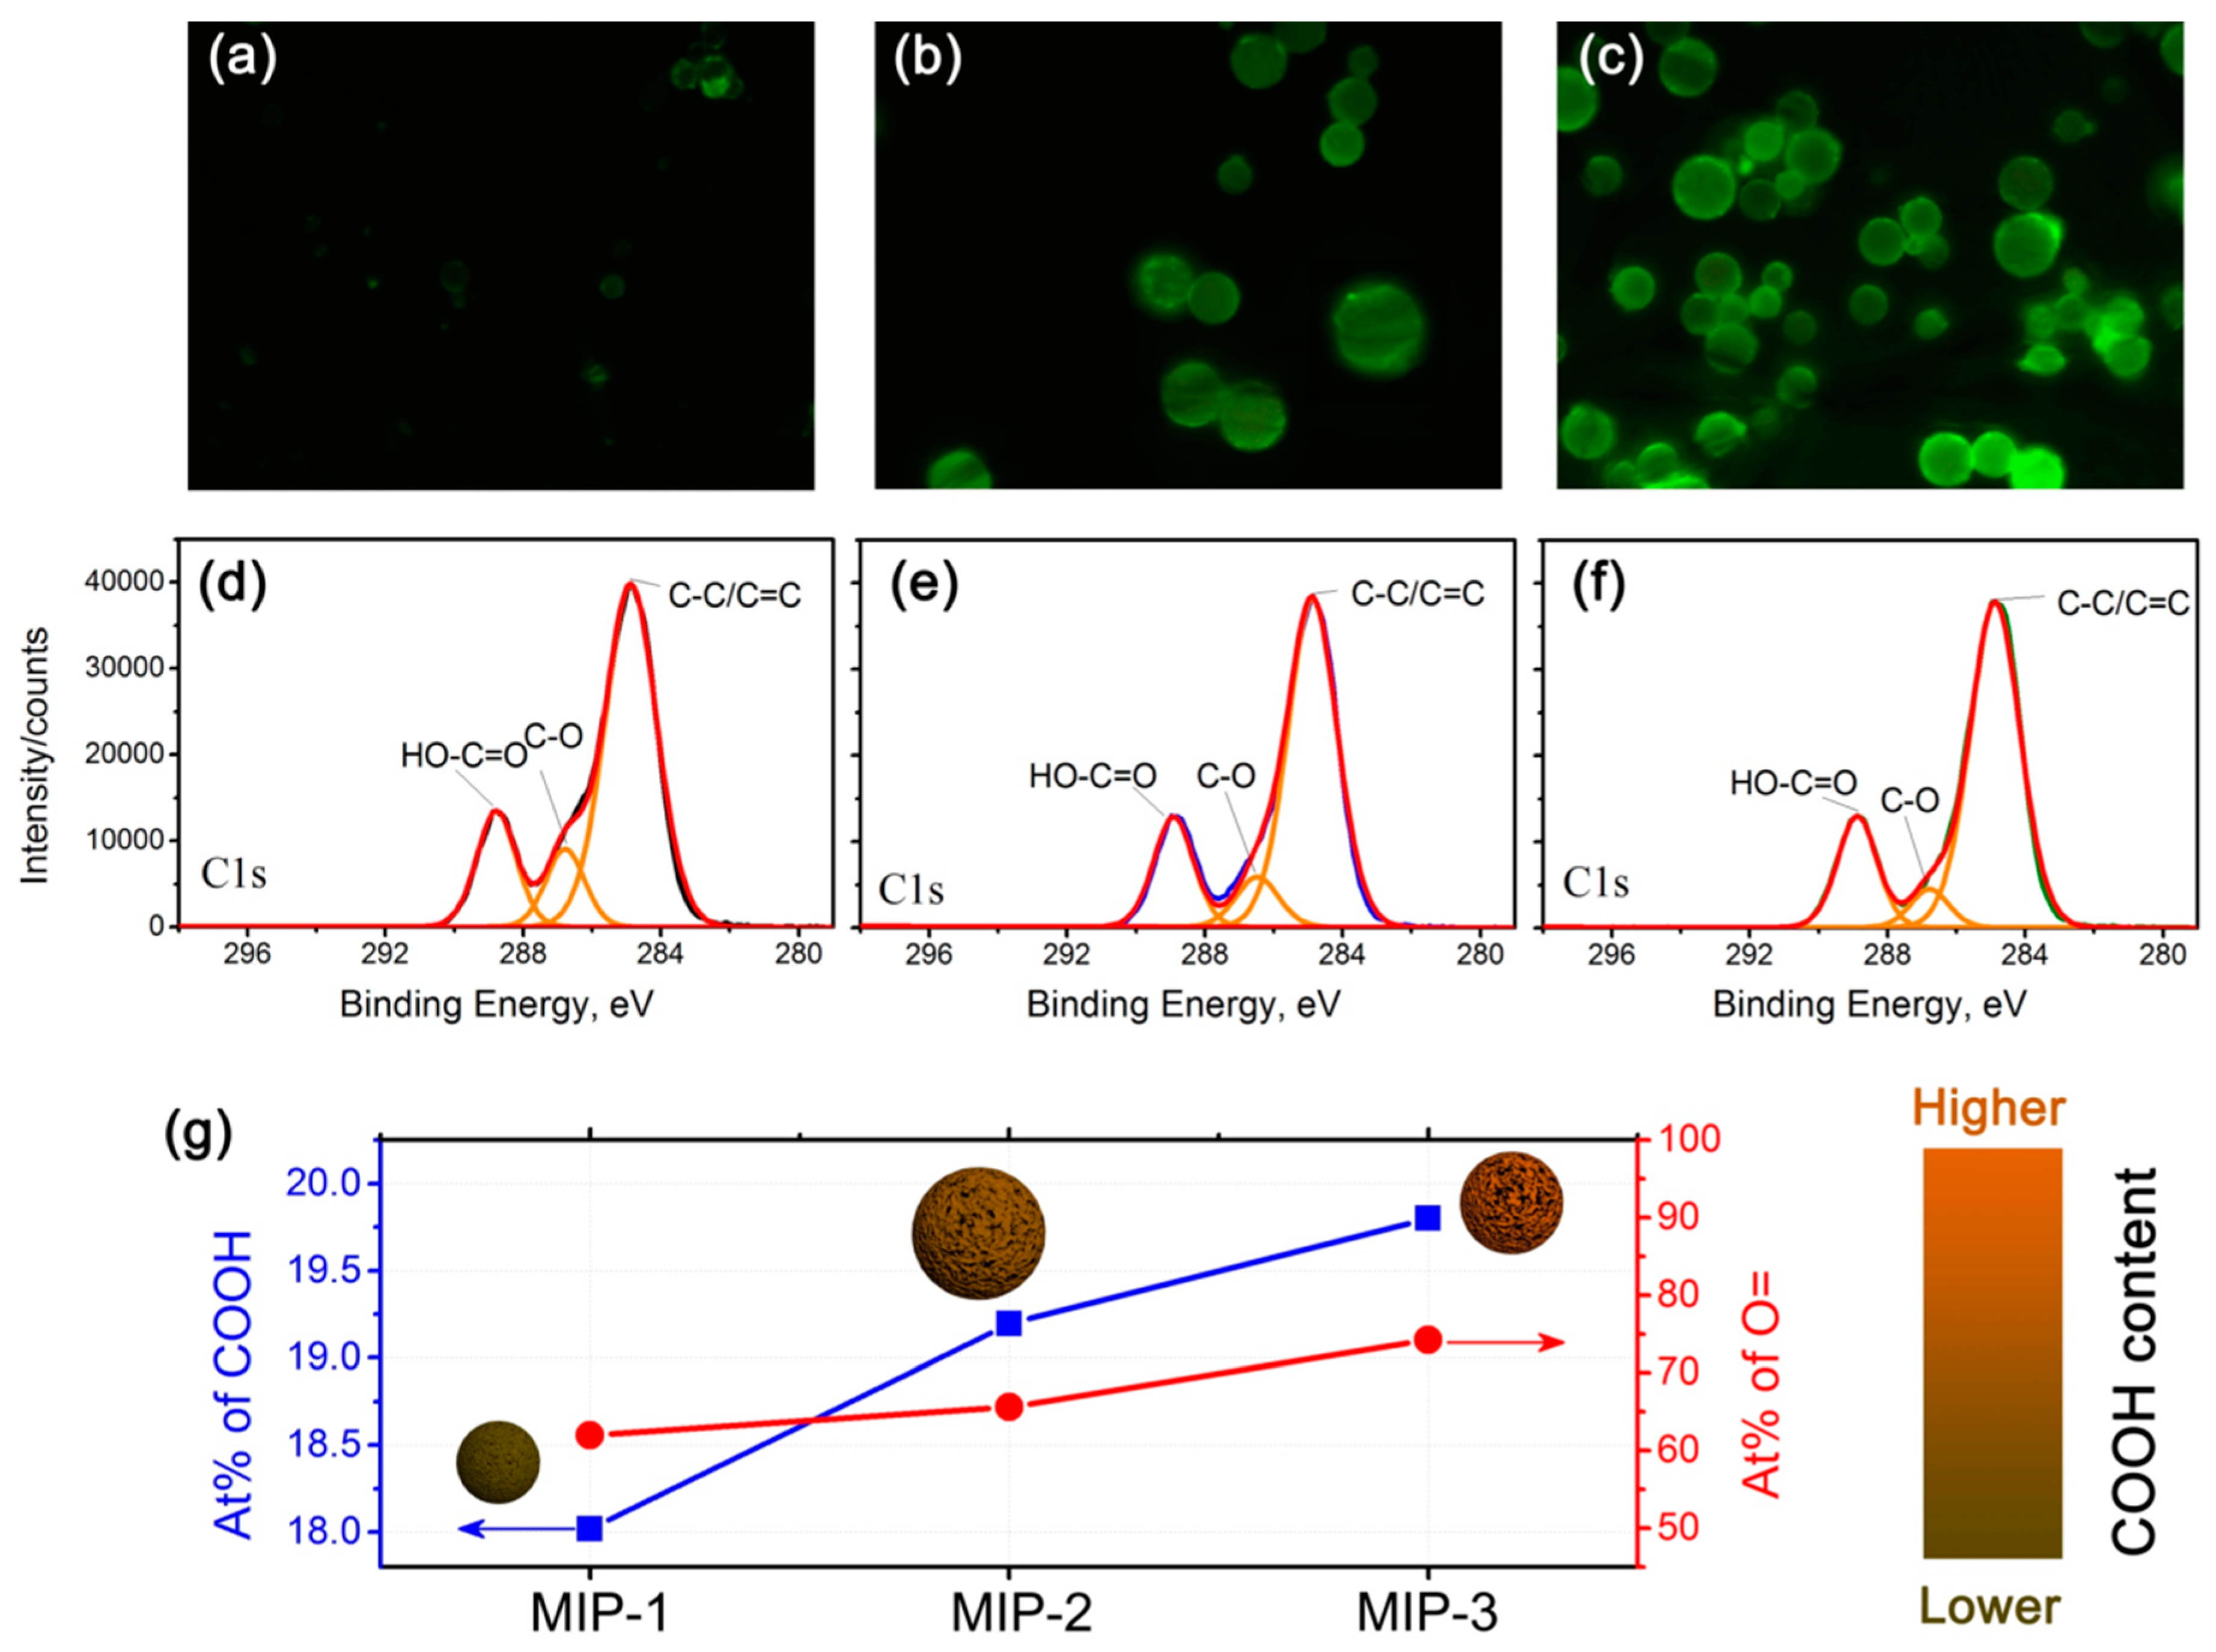
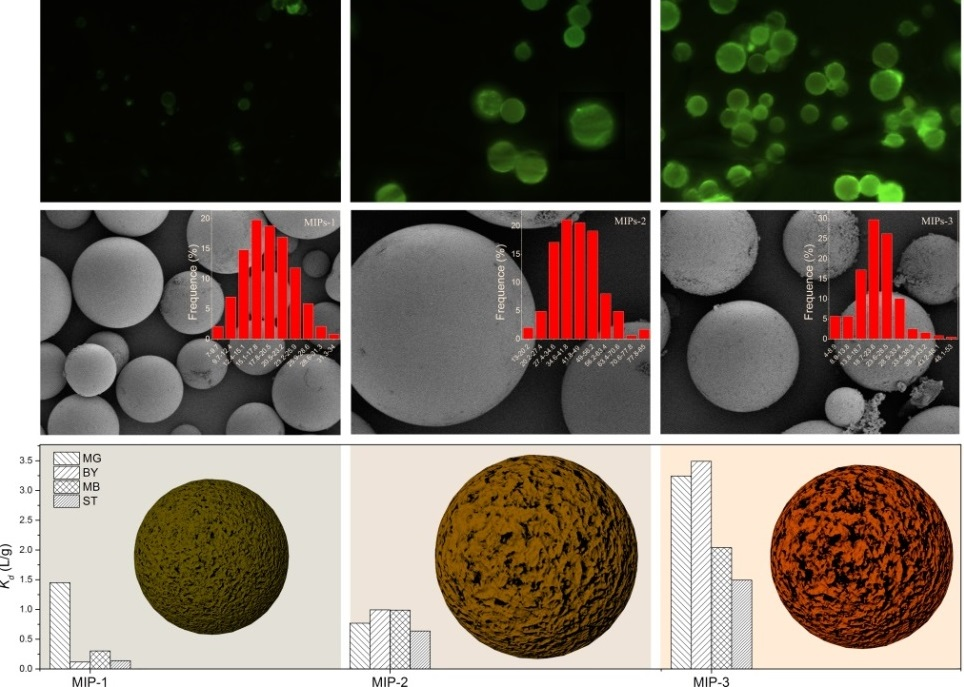
Figure 5a–c shows the fluorescence microscope images of the acriflavine-labeled MIPs-1, MIPs-2, and MIPs-3, respectively. The fluorescence intensity becomes lowered in a progression from MIPs-1 to MIPs-3, revealing that the density of carboxyl groups is gradually increased. The higher is the density of carboxyl groups, the larger is the number of acriflavine molecules that have been successfully incorporated onto the surfaces of the microspheres as labels, implying that a higher fluorescence intensity can be observed. To further validate the increased concentration of carboxyl groups (progressing from MIPs-1, MIPs-2 to MIPs-3), high-resolution C1s XPS core-level spectra are further provided in
Figure 5d–f, respectively, and the corresponding O1s XPS core-level spectra are presented in
Figure S4 (Supplementary Materials). Indeed, the signal intensities corresponding to surface carboxyl groups are increased as one progresses from MIPs-1 to MIPs-3, with calculated atomic percentages of approximately 18%, 19.2% and 19.8%, respectively (
Figure 5g). Although MIPs-1 possesses the lowest atomic percentage of the surface carboxyl groups, it has the highest specific surface area and the largest total pore volume (
Figure 4 and
Table S1 (Supplementary Materials)), likely resulting from its small particle diameter.
To prepare high-performance MIPs for the selective and efficient adsorption of MG, many variables need to be considered, including the particle size, number of surface carboxyl groups, specific surface area, and total pore volume, as well as the structural and property variations that are imparted via molecular imprinting. Subsequent sections discuss the adsorption performance of NIPs and MIPs, and the relationship between the structure and adsorption performance is also described.
3.3. Evaluation of the Adsorption Selectivity of MIPs toward MG
Three different dyes were used as the competing molecules against MG, and ITMS was used to measure the residual concentration of each dye after the adsorption by MIPs, along with the calculation of the adsorption amount of each dye composition. Prior to the preparation of the mixed dye solution, the standard MS spectra were measured for each dye, thus avoiding the overlap of the ion peaks associated with the different dye molecules. The standard MS spectrum of the mixed dye is provided in
Figure S5 (Supplementary Materials). The ion peaks at 283.1, 284.2, 315.1 and 329.2
m/
z can be indexed to MG, BY, MB and ST dyes, respectively. To plot an internal standard curve, a series of mixed dye solutions with different concentrations were prepared, and deuterated MG was employed as the internal standard (334.2
m/
z). The results showing the linear correlation coefficients are presented in
Table S2 (
Supplementary Materials).
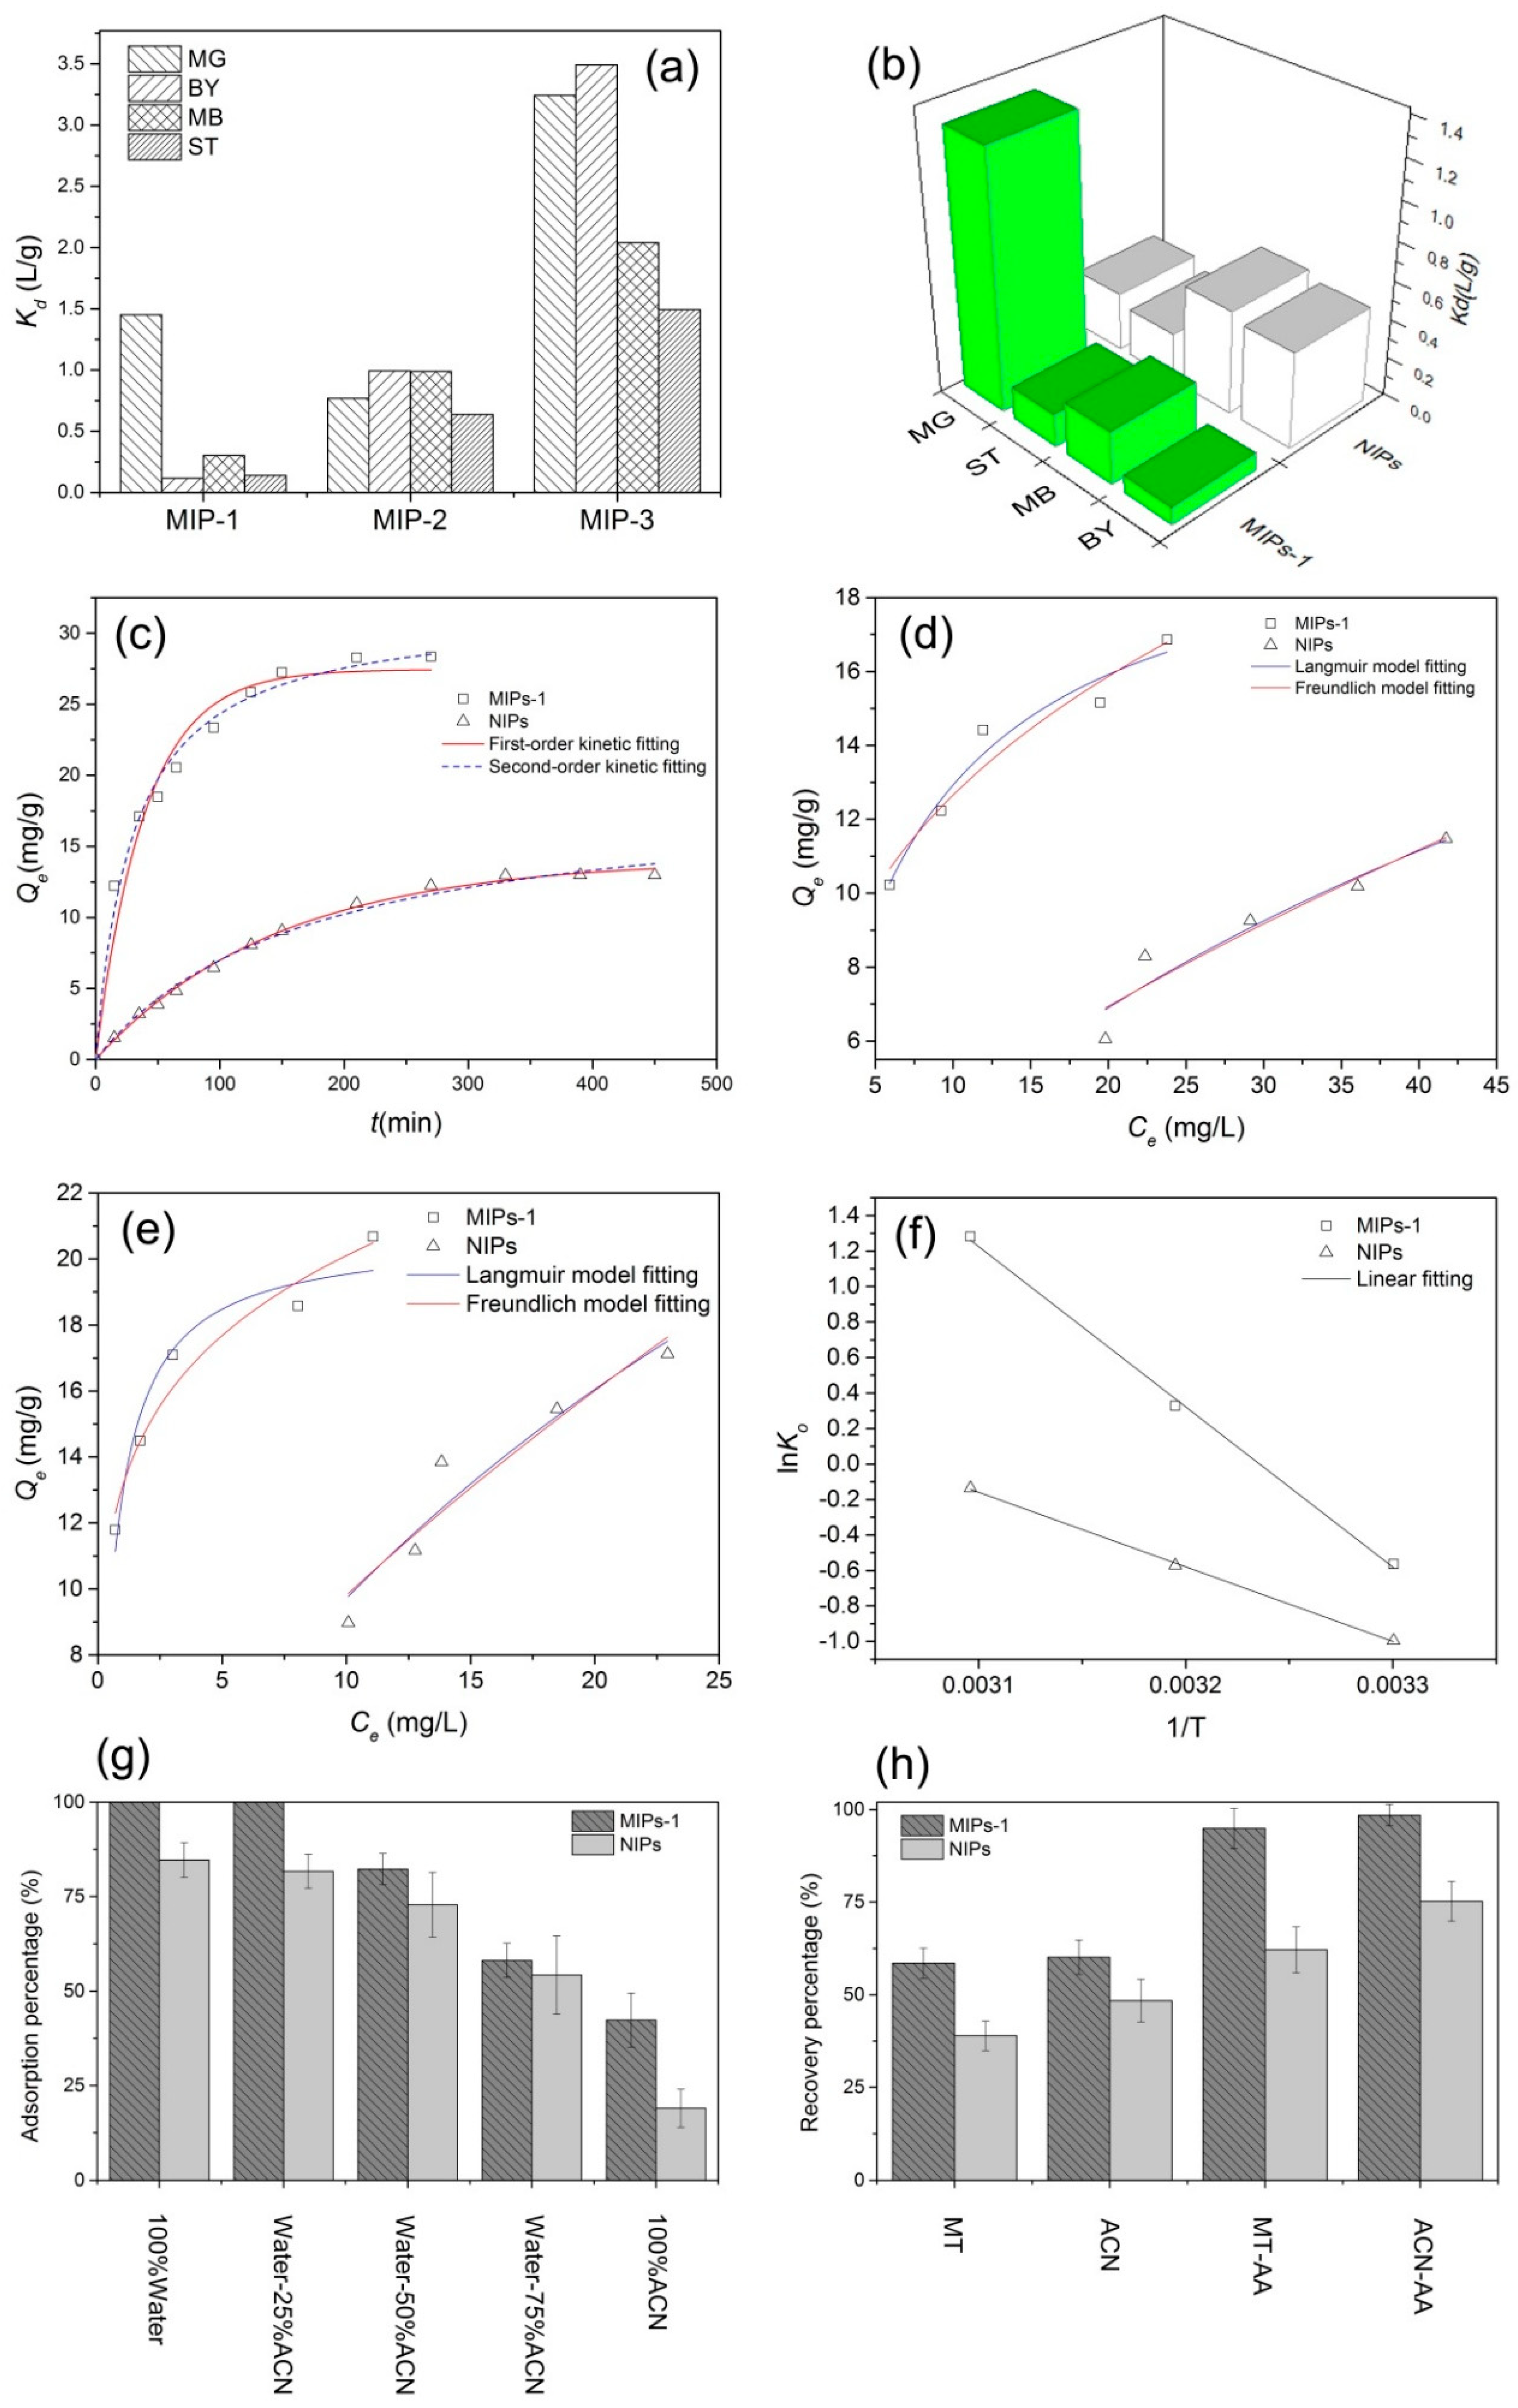
Figure 6a and
Table 2 present the distribution coefficients of the various prepared MIPs toward different competing molecules. The coefficient is defined as the ratio of the adsorption quantity to the equilibrium mass concentration. A larger distribution coefficient corresponds to a better specific adsorption effect for the given target molecules. Among the molecularly imprinted samples, it is noteworthy that the MIPs-1 sample exhibited the best selective adsorption performance toward MG with a
Kd value as high as 1.45. This distribution coefficient with MG was significantly larger than those of its competing molecules, all of which exhibited corresponding values no larger than 0.3. This indicates that the MIPs-1 sample exhibited significant adsorption selectivity toward MG in the presence of the competing molecules. Thus, this paper focuses on the MIPs-1 sample and its non-molecularly imprinted counterpart (i.e., NIPs) in the following sections.
During the preparation of the MIPs, it was also found that the MAA:EGDMA addition ratio in the emulsion had a great impact on the adsorption selectivity of the resulting MIPs. A higher MAA content could provide the resulting MIPs with higher adsorption capacity, which can be attributed to the incorporation of a greater number of carboxyl on the surfaces of the MIPs, as well as to the formation of large pores (
Figure 1,
Figure 2,
Figure 3,
Figure 4 and
Figure 5,
Table 1, and
Table S1 (Supplementary Materials)). The carboxyl groups could form ion pairs with the MG molecules. However, a large MAA:EGDMA ratio yields MIPs with unsatisfactory adsorption selectivity, attributable to the excessive carboxyl groups that are produced which facilitate rapid adsorption at the expense of adsorption selectivity.
The adsorption selectivities of the two parallel samples, namely MIPs-1 (with molecular imprinting) and NIPs (without molecular imprinting), were compared, and the results are shown in
Figure 6b and
Table 3. The non-molecularly imprinted NIPs sample presents a strikingly different adsorption performance relative to its molecularly imprinted counterpart MIPs-1 (
Figure 6b). MIPs-1 possesses a significantly higher
k’ value (
Table 3), verifying the superior adsorption selectivity of MIPs-1 to that of NIPs and hence confirming the success of the present molecular imprinting process.
3.5. Isothermal Adsorption Behavior
Figure 6d,e depicts the isothermal adsorption lines for the adsorption of MG molecules onto NIPs and MIPs-1 at different temperatures. It can be found that the adsorption capacity of MG is increased with an elevated initial MG concentration. Under the same adsorption conditions, MIPs-1 exhibited a superior adsorption capacity to NIPs at both 303 and 313 K, being 1.5- and 1.25-fold larger, respectively. At the same temperature, the equilibrium constant of MIPs-1 is also markedly larger than that of NIPs, which can be attributed to the higher specific surface area of MIPs-1 and its higher adsorption selectivity for MG.
Table 5 also provides the isothermal absorption parameters for the adsorption of MG onto the microspheres. With an increase in the temperature, the equilibrium adsorption constants (
kl and
kf) are noticeably increased. Larger equilibrium adsorption constants increase the adsorption power, indicating the adsorption capacity is enhanced at elevated temperatures. Higher temperatures facilitate the adsorption effect, which is most likely due to the fact that the higher temperatures promote the diffusion of the molecules and hence facilitate the adsorption process.
It is interesting to find that neither of the isothermal adsorption models adequately describes the present adsorption of MG molecules onto MIPs-1 and NIPs, due to a low fitting correlation coefficient (below 0.99). This suggests that the adsorption process involved here is more complex than monolayer adsorption alone. Multiple interactions could co-exist in driving the present adsorption process, including the electrostatic, van der Waals and hydrogen bonding interactions [
44,
45,
46,
47].
3.6. Adsorption Thermodynamics
The plots of the ln
K0 as a function of the reciprocal of the temperature (i.e., 1/
T) were depicted in
Figure 6f, with the specific results summarized in
Table 6. The slope and
y-intercept were calculated as the entropy change △
S and enthalpy change △
H for the adsorption systems at different temperatures, respectively. For both MIPs-1 and NIPs adsorbents, the values of △
H are estimated to be positive, and the value of △
G is lowered when the temperature increases. This reveals that an increase in the temperature facilitates the adsorption of MG onto both MIPs-1 and NIPs, as the desorption of water molecules from the surfaces of the polymer microspheres requires energy. The values of the total entropy change △
S for the adsorption of MG onto MIPs-1 and NIPs are both positive, thus confirming that the adsorption system becomes increasingly disordered after the adsorption has taken place. Actually, the accumulation of various molecules including the adsorbate and others would normally cause the system to become more ordered, thereby lowering the entropy. The actual increase in the entropy of the present system can be attributed to a layer of water molecules that are readily adsorbed onto the polymer microspheres prior to the adsorption of the MG molecules. This implies that our adsorption system is a simultaneous process involving the desorption of the previously adsorbed water molecules and the adsorption of the MG molecules. Considering that the molecular weight of a water molecule (18 g/mol) is much lower than that of an MG molecule (365 g/mol), the number of the desorbed water molecules can greatly exceed that of the corresponding number of MG molecules, resulting in the increased disorder of the present adsorption system. We also consider that the MG molecules could also be hydrated, and, before the effective interactions between MG molecules and the surface of MIPs, the hydration waters would need to be displaced; this might also result in the increase in the entropy.
3.7. Optimization of the MISPE Conditions
It was found that acetonitrile (ACN) exhibited an excellent extraction capability toward MG in solution, and thus a solvent mixture of ACN and water at different mixing ratios (
v/
v) were examined as the eluents. After the MISPE process, the concentration of the residual MG was measured to calculate the adsorption rate, and the measurements were repeated twice, with the results shown in
Figure 6g and
Table 7. Due to the strong elution power of ACN (as discussed below), the adsorption rate of the MG molecules onto the stationary phase of the MISPE column was gradually lowered as the ACN concentration was increased. No MG could be detected in the residual solutions collected after the MISPE process had taken place when the pure water or the aqueous solvent mixture containing a low ratio of ACN (25% by volume) was employed, and the adsorption rate of the MISPE column reached its maximum value. It is noteworthy that, irrespective of the eluent composition, higher retention capacities for MG were achieved when MIPs-1 served as the stationary phase rather than non-molecularly imprinted NIPs sample, which can be attributed to the higher adsorption selectivity imparted via molecular imprinting, as well as to the more dense packing resulting from the smaller diameter of the MIPs-1.
Before the practical measurements were performed, the MG molecules that were retained by the MISPE had to be removed via elution to avoid false positive results. High-purity water was used as the sample solvent for MG, and a series of eluents were then adopted as mobile phases for the MISPE column. The MG concentrations in the eluted liquids were determined, along with the recovery rates (
Figure 6h and
Table 8). It was demonstrated that ACN exhibited a higher elution performance in comparison with MT, and the addition of a weakly acidic buffer salt solution into the pure organic solvent dramatically enhanced the elution capacity. Consequently, a mixed solution of ACN and ammonium acetate (AA) was employed as the eluent.

 ,
, 

