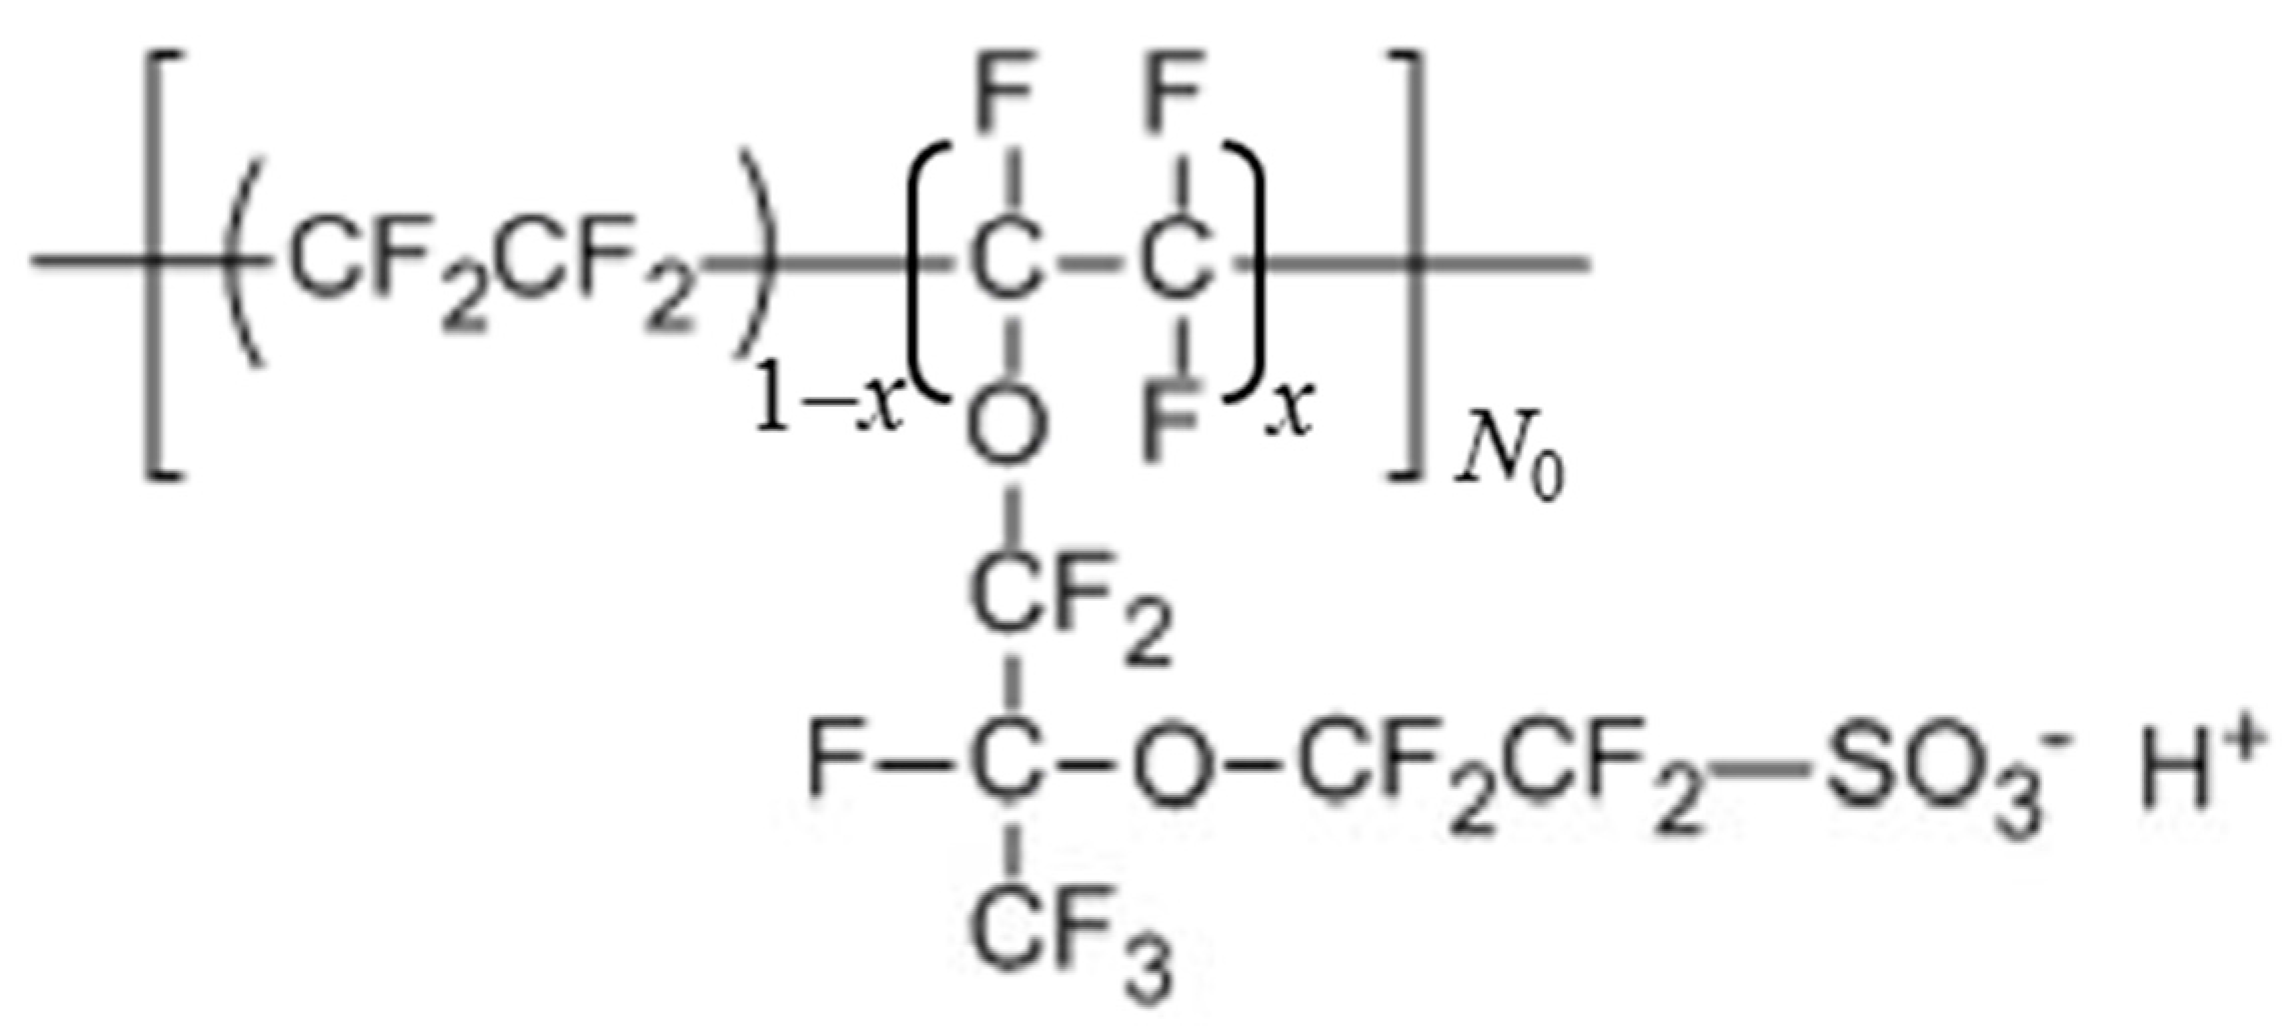
Colloidal Dispersion of a Perfluorosulfonated Ionomer in Water–Methanol Mixtures


Abstract
:
1. Introduction
2. Materials and Methods
2.1. Sample and Solutions
2.2. SLS and DLS Measurements
2.3. SAXS Measurements
3. Results and Discussion
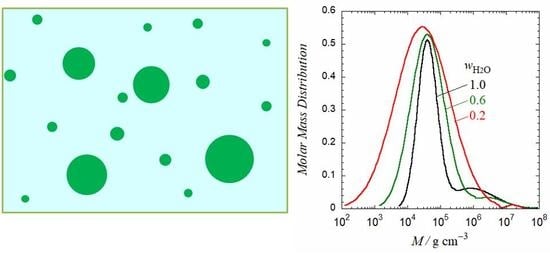
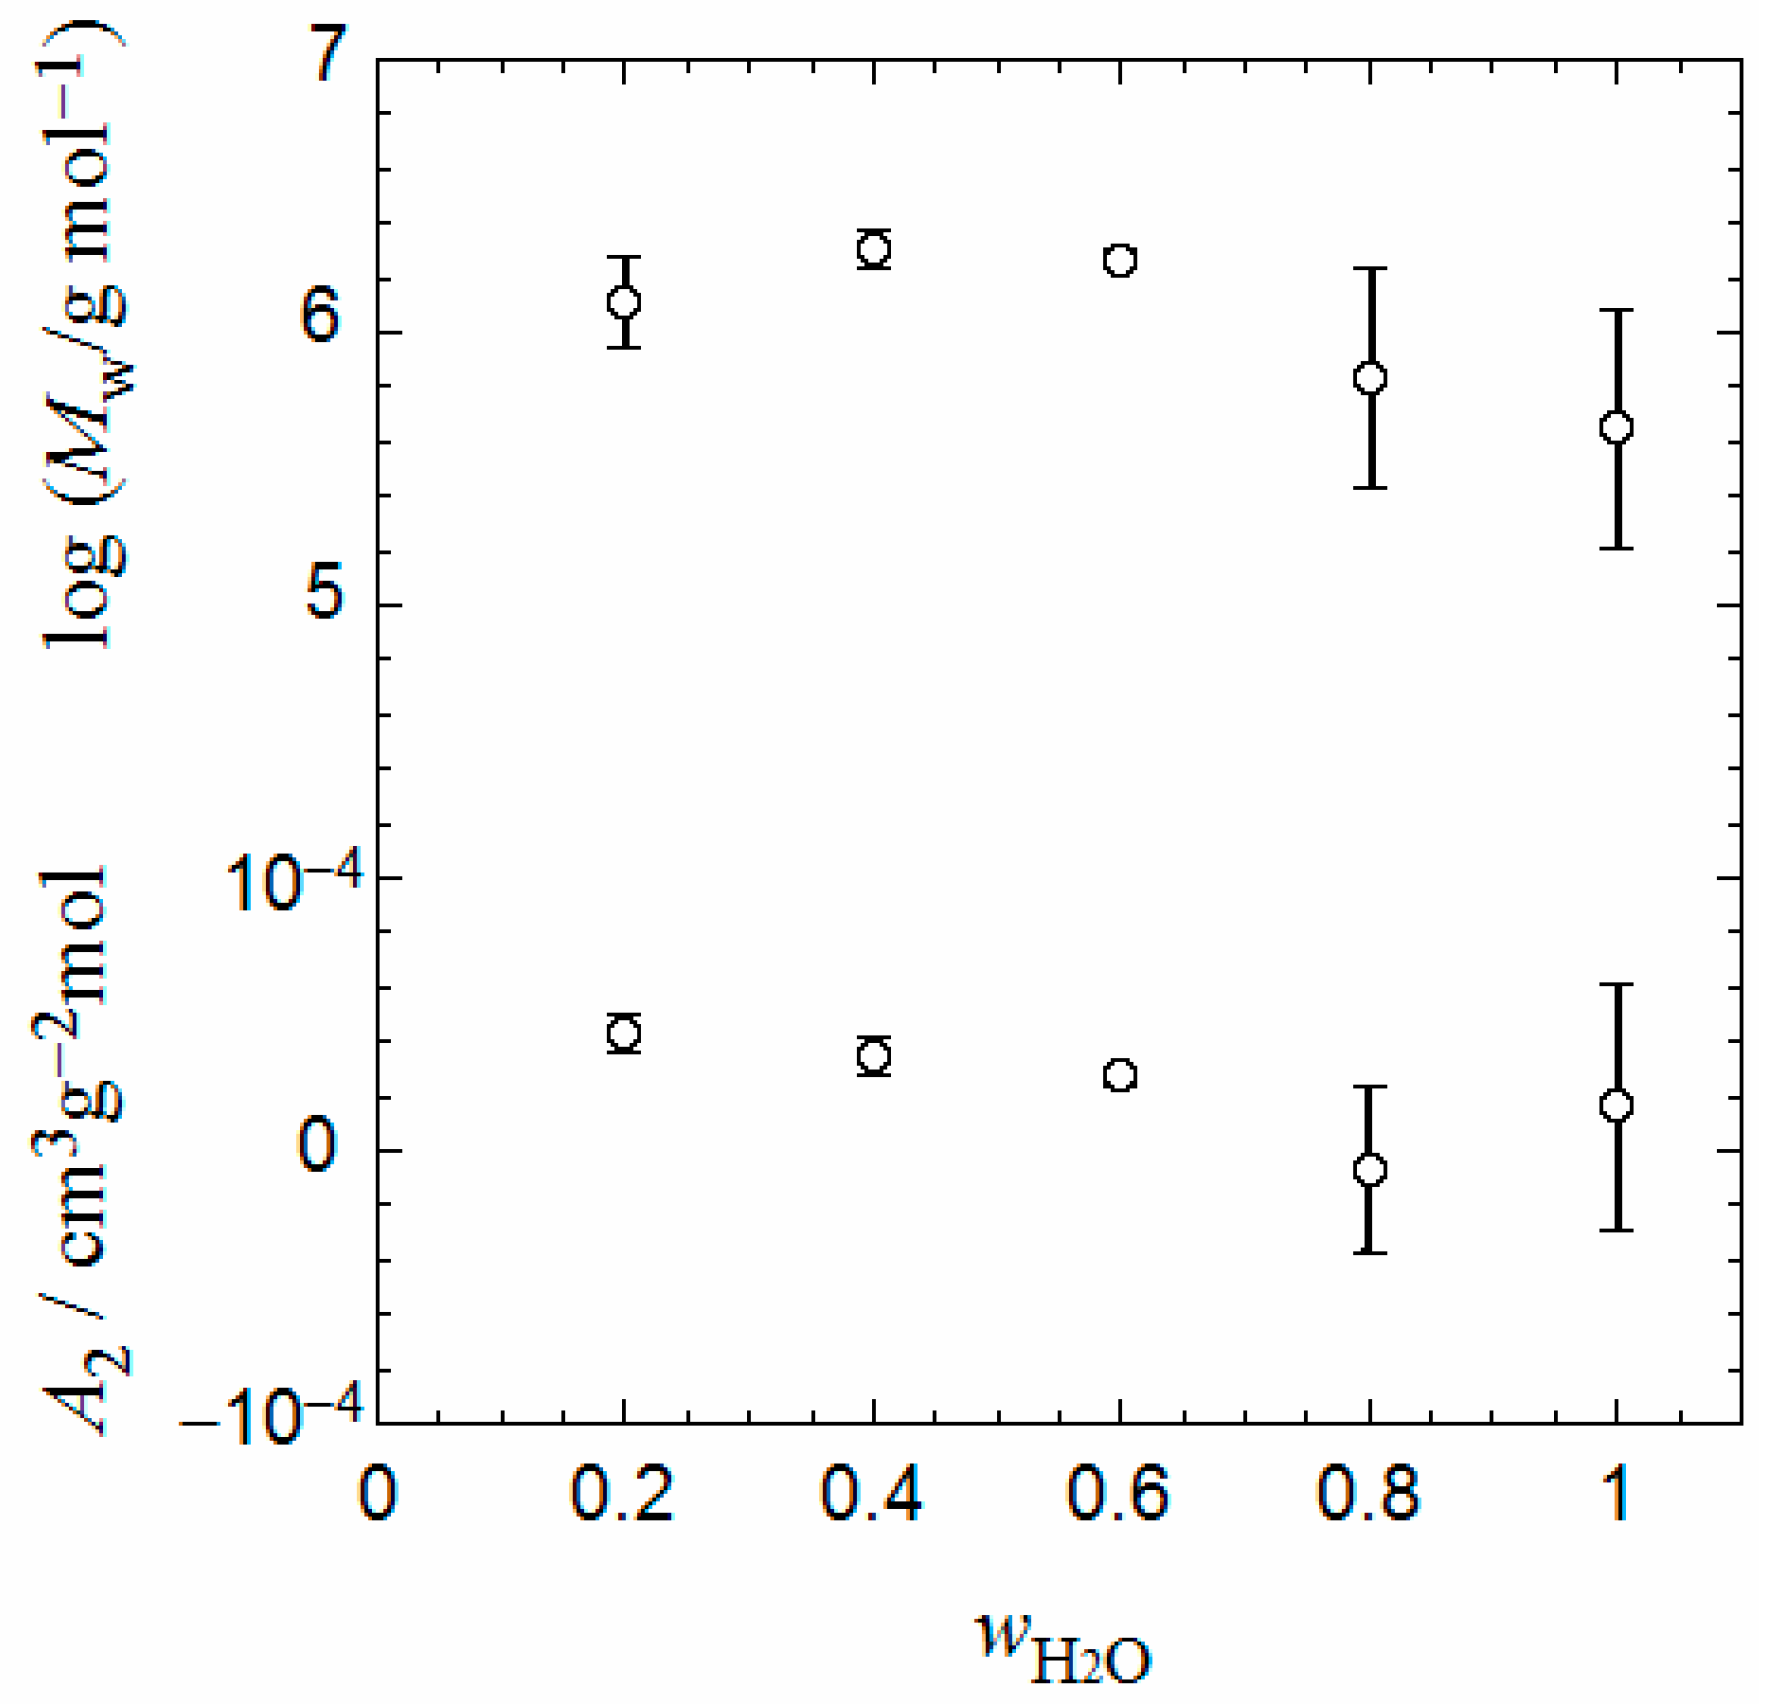
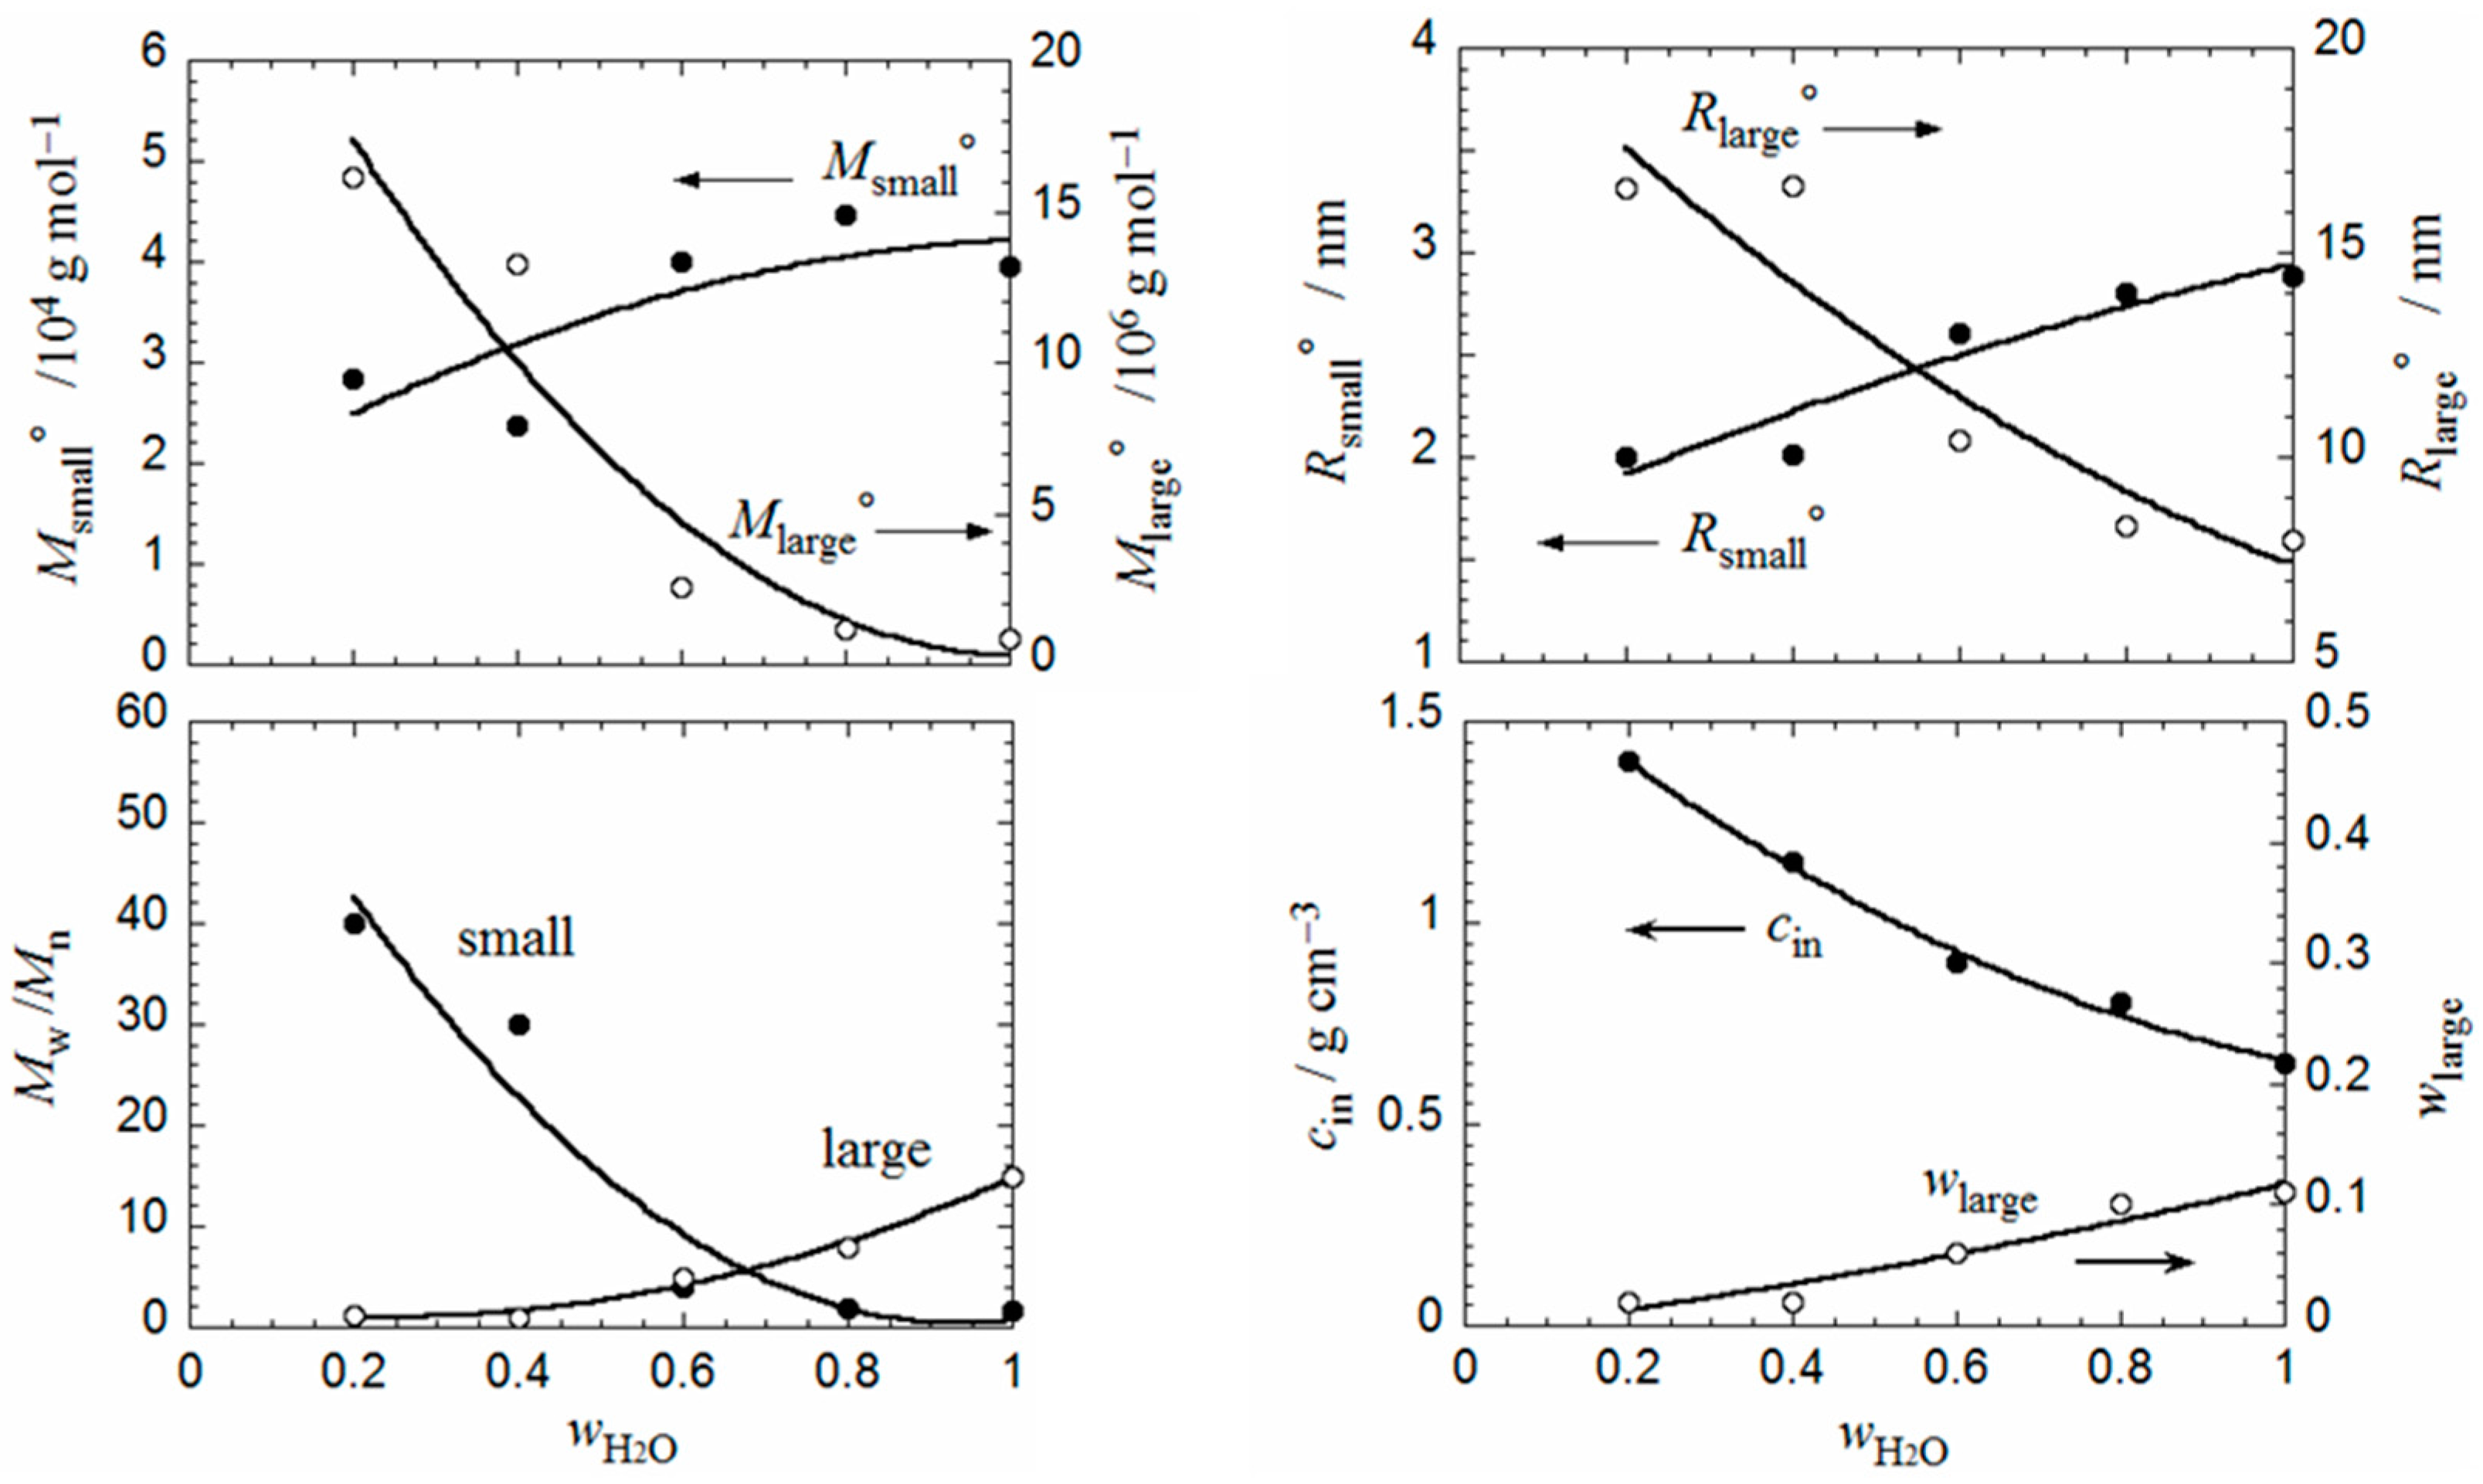
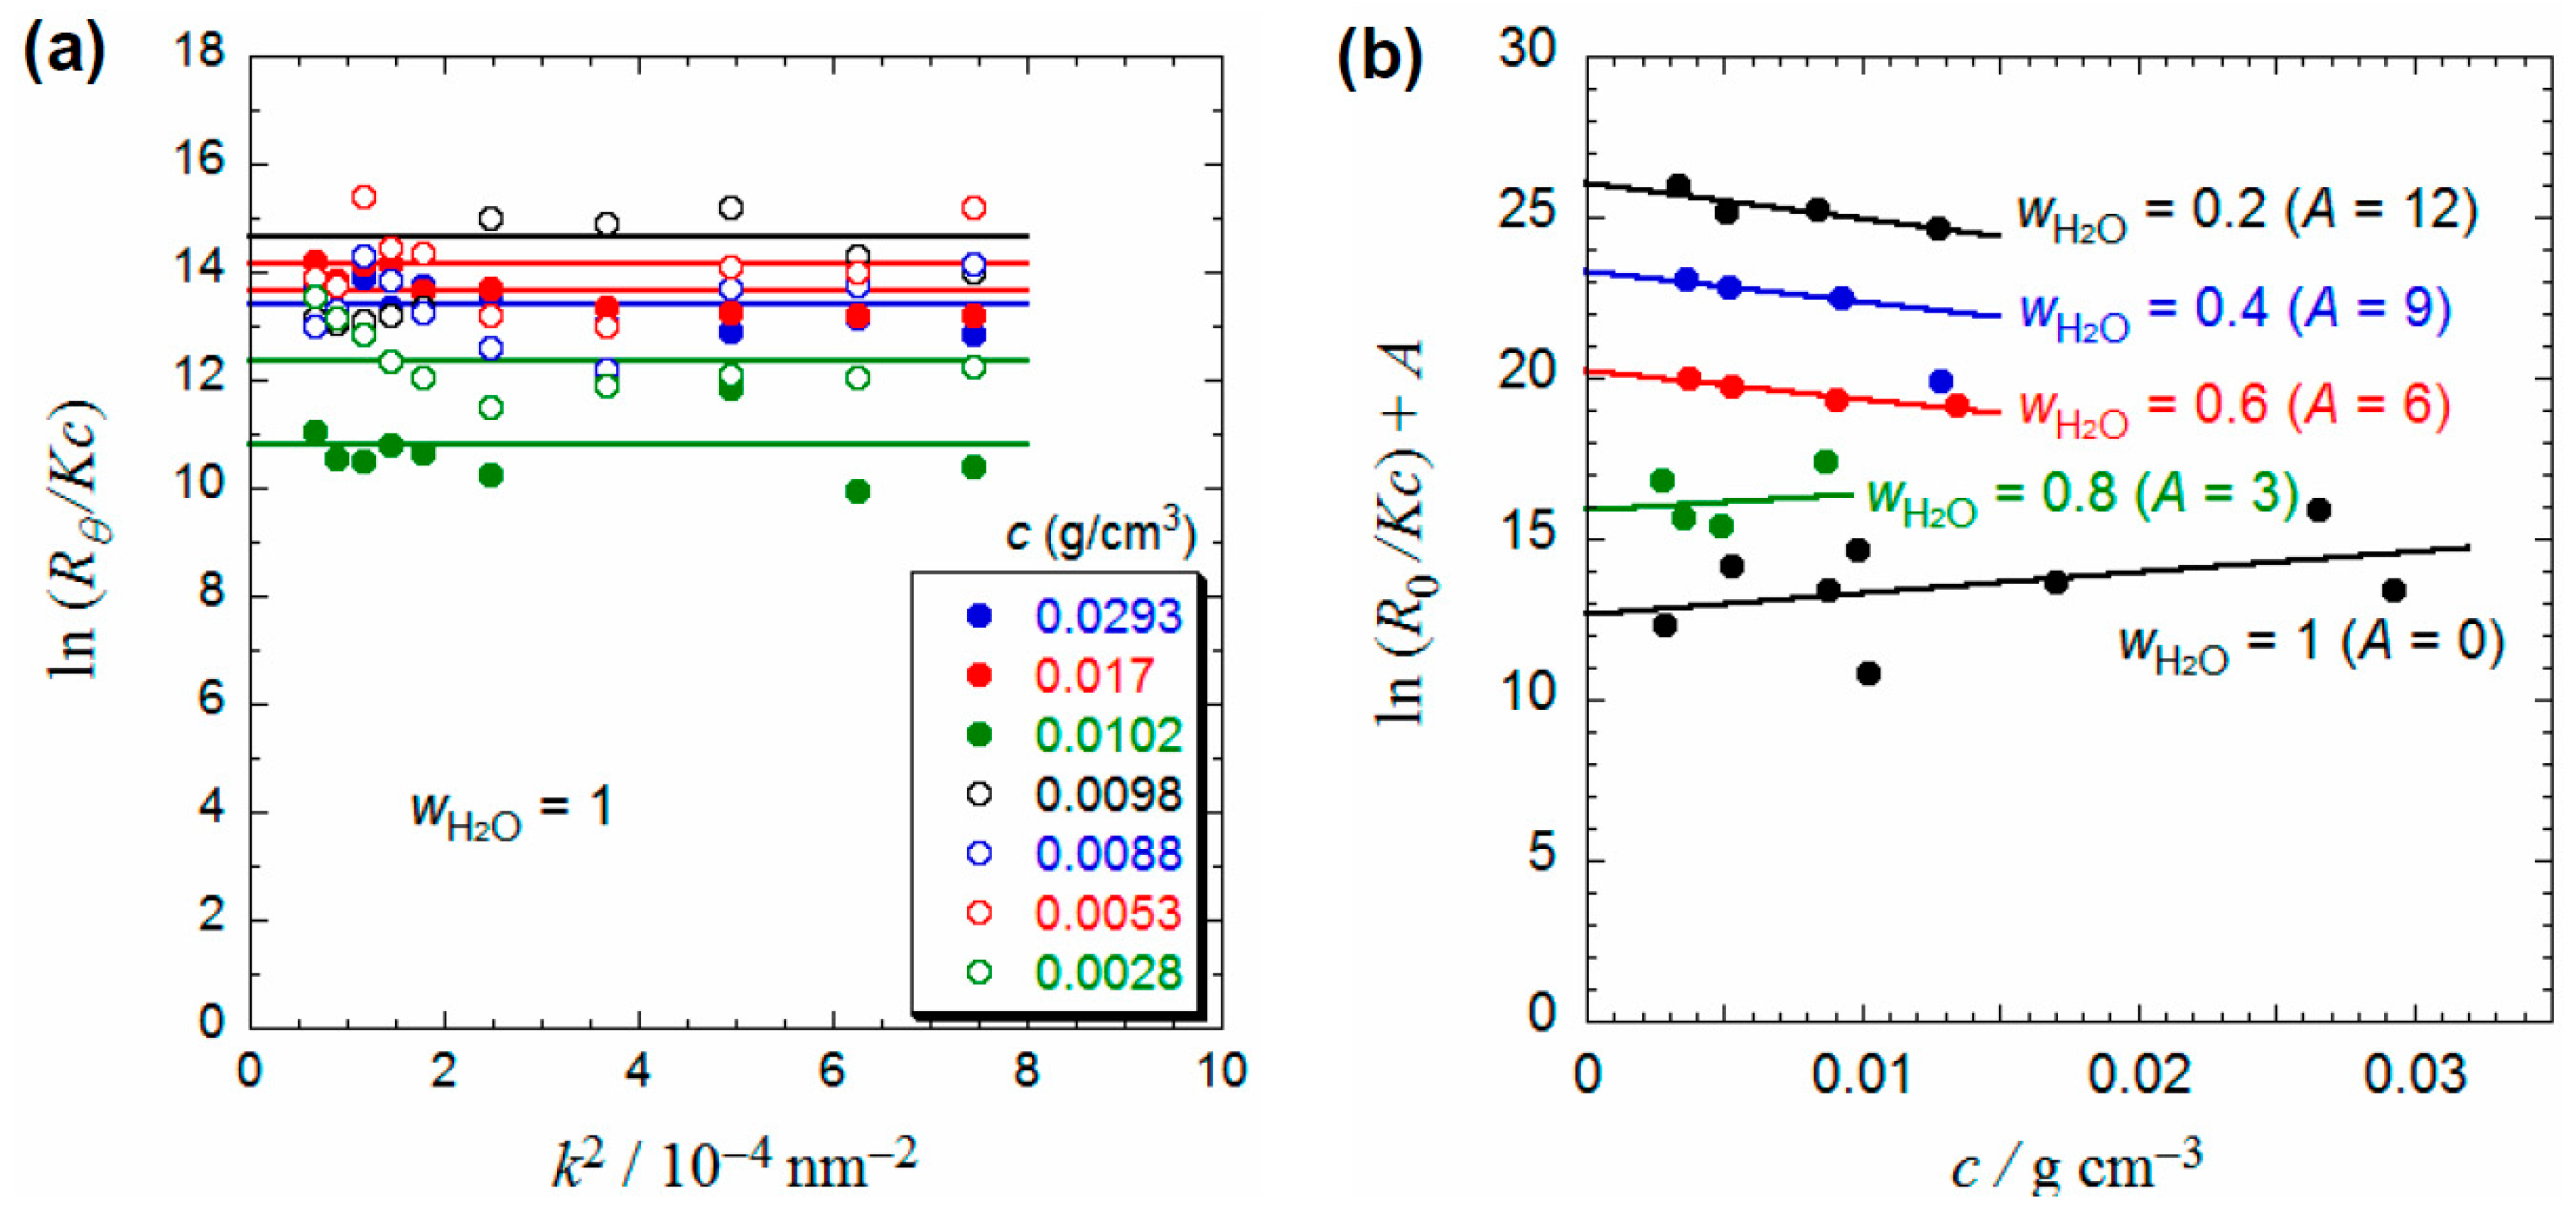
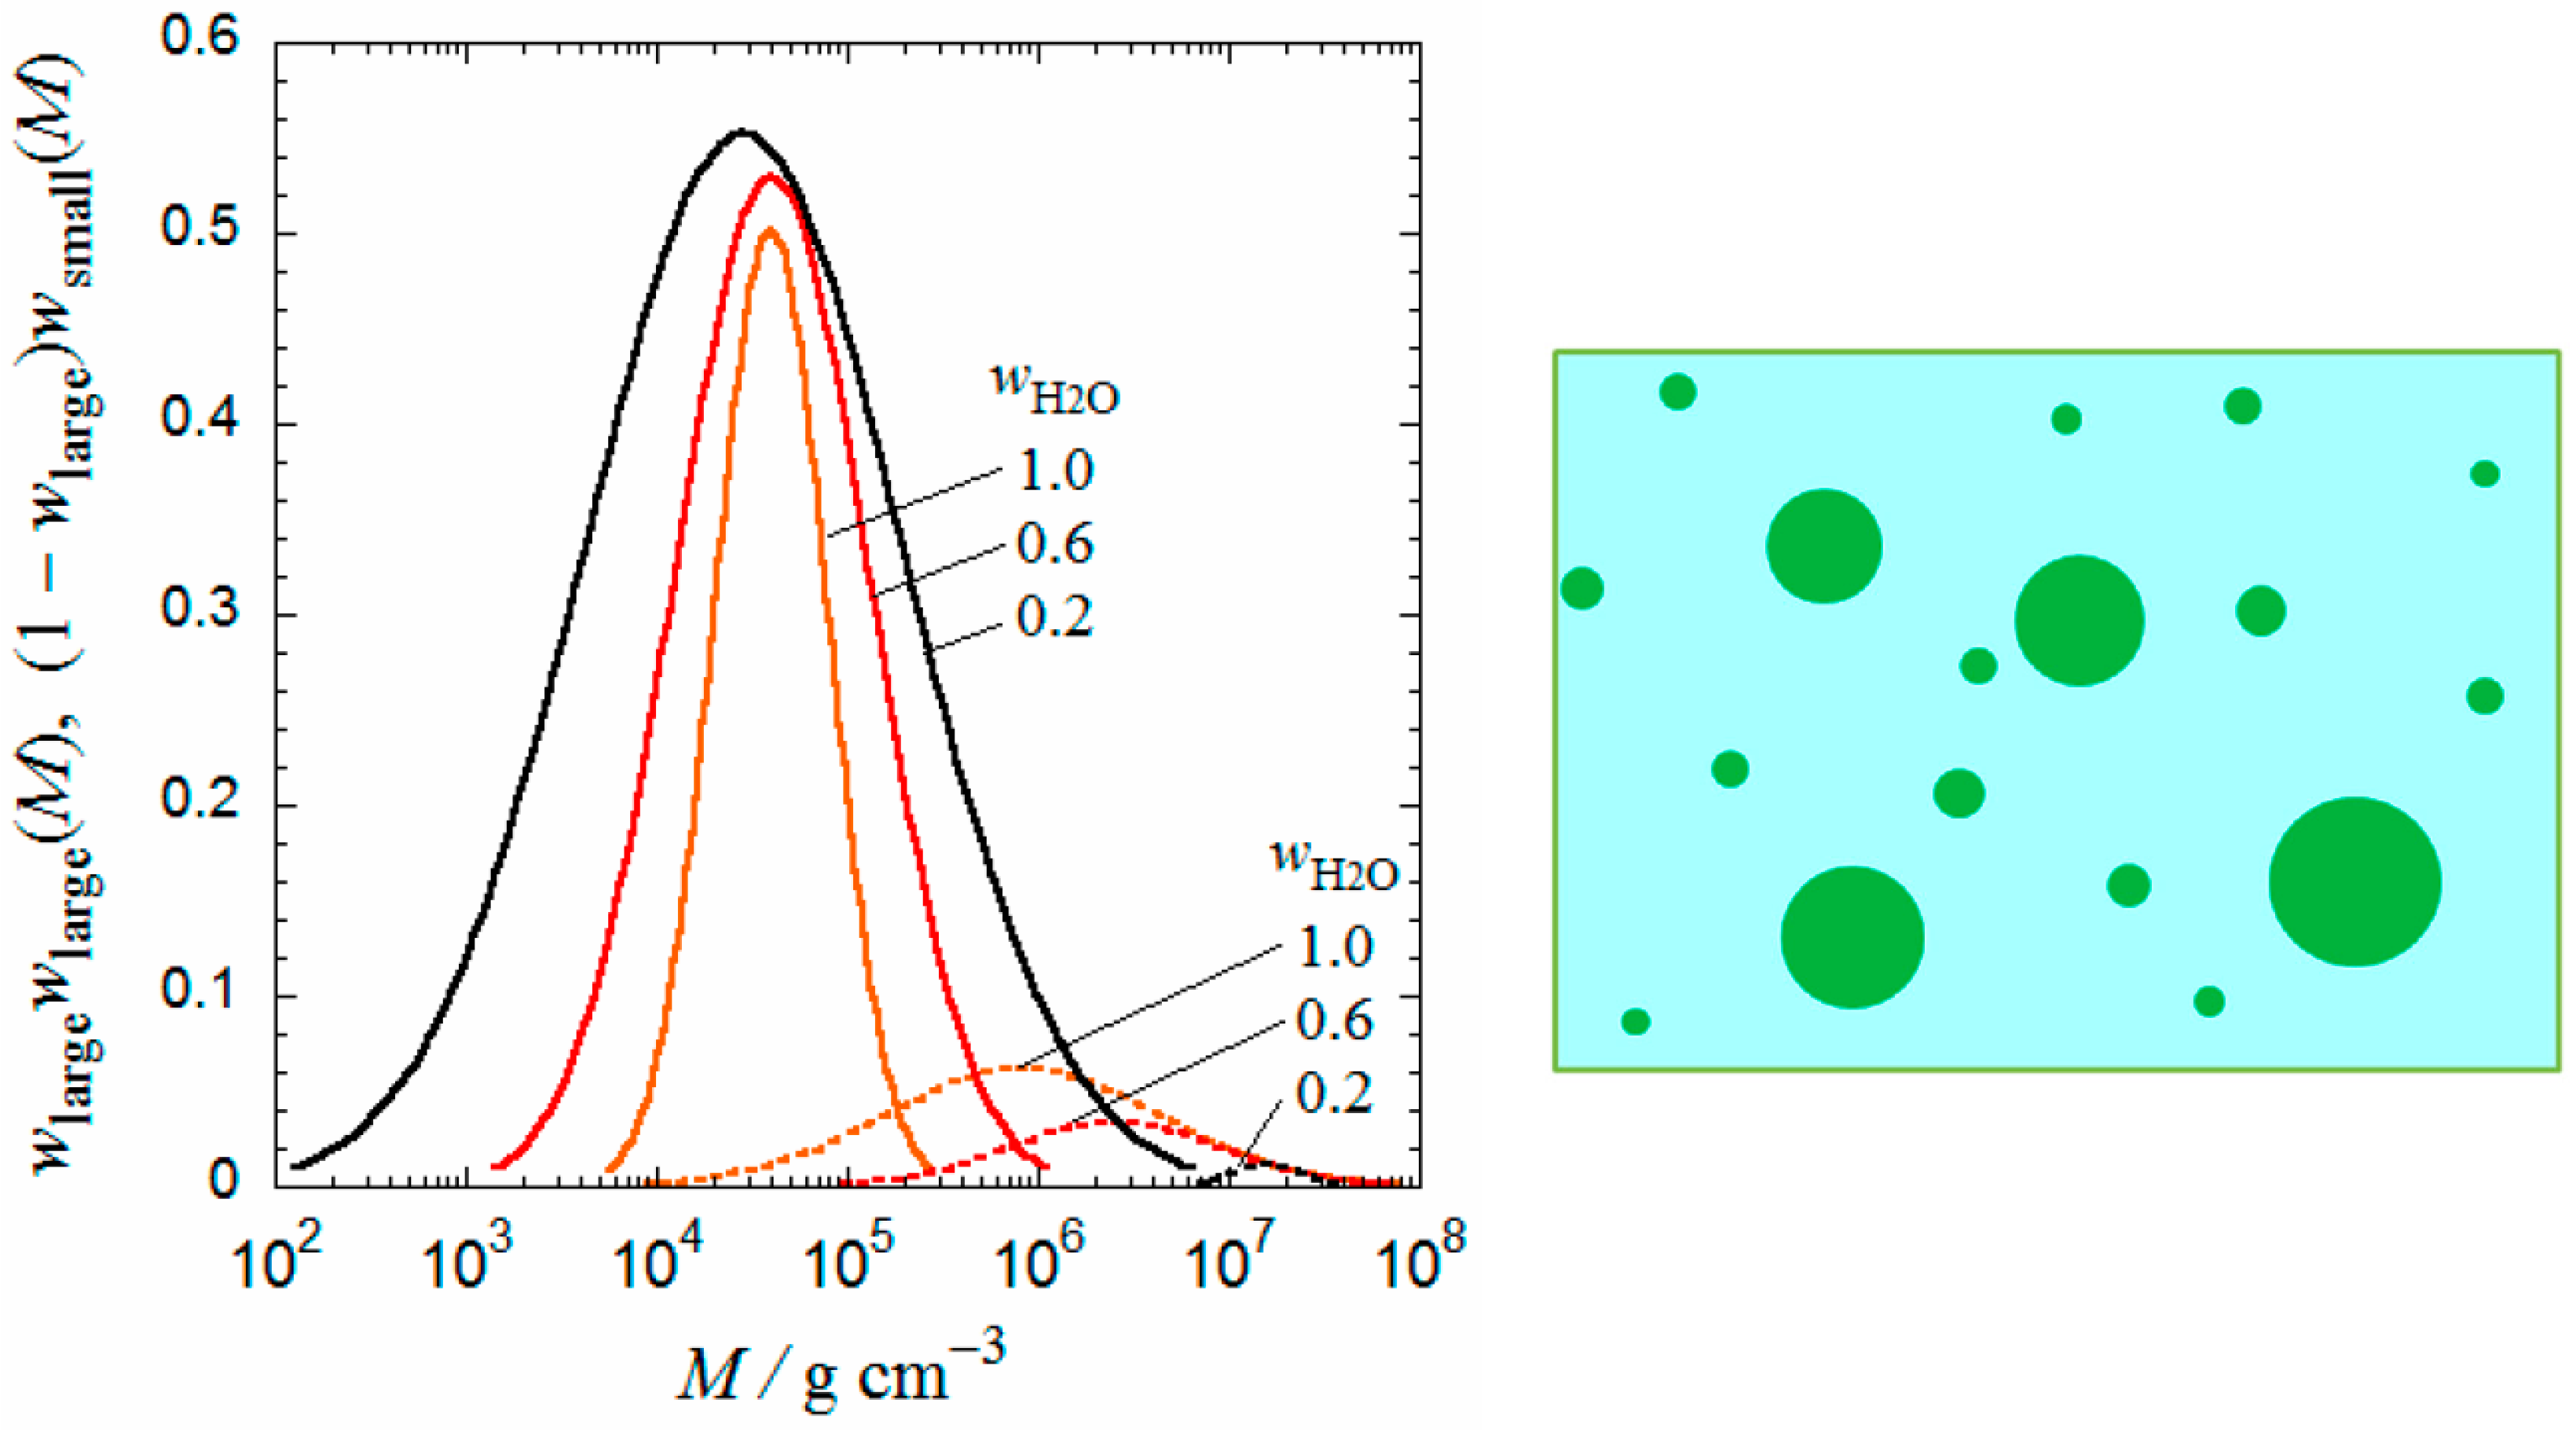
3.1. SLS
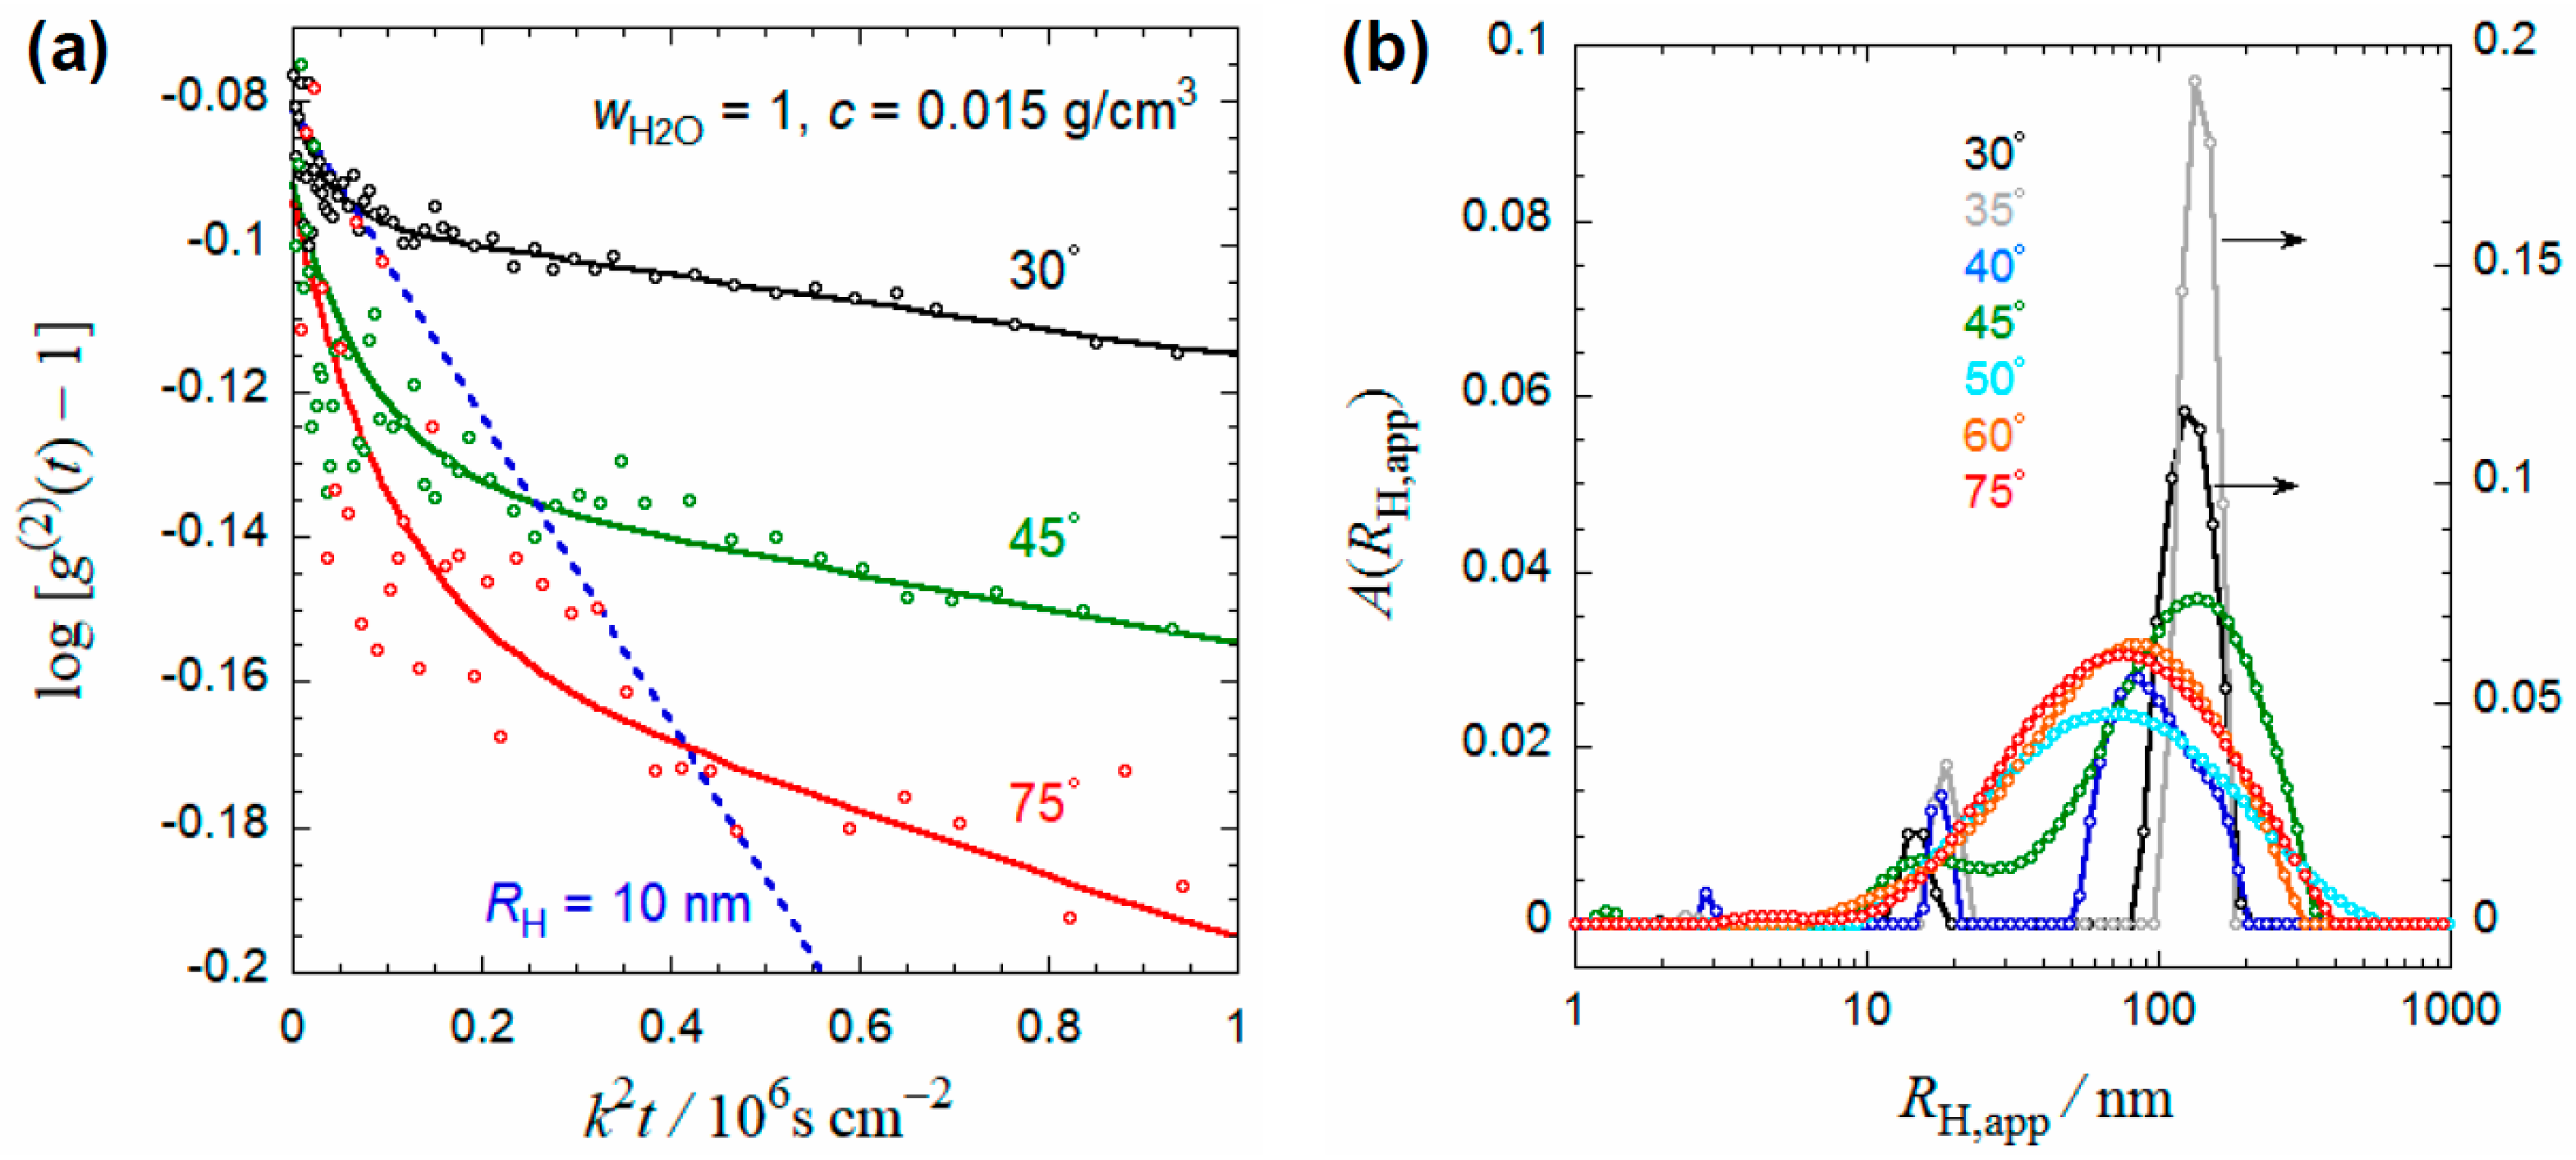
3.2. DLS
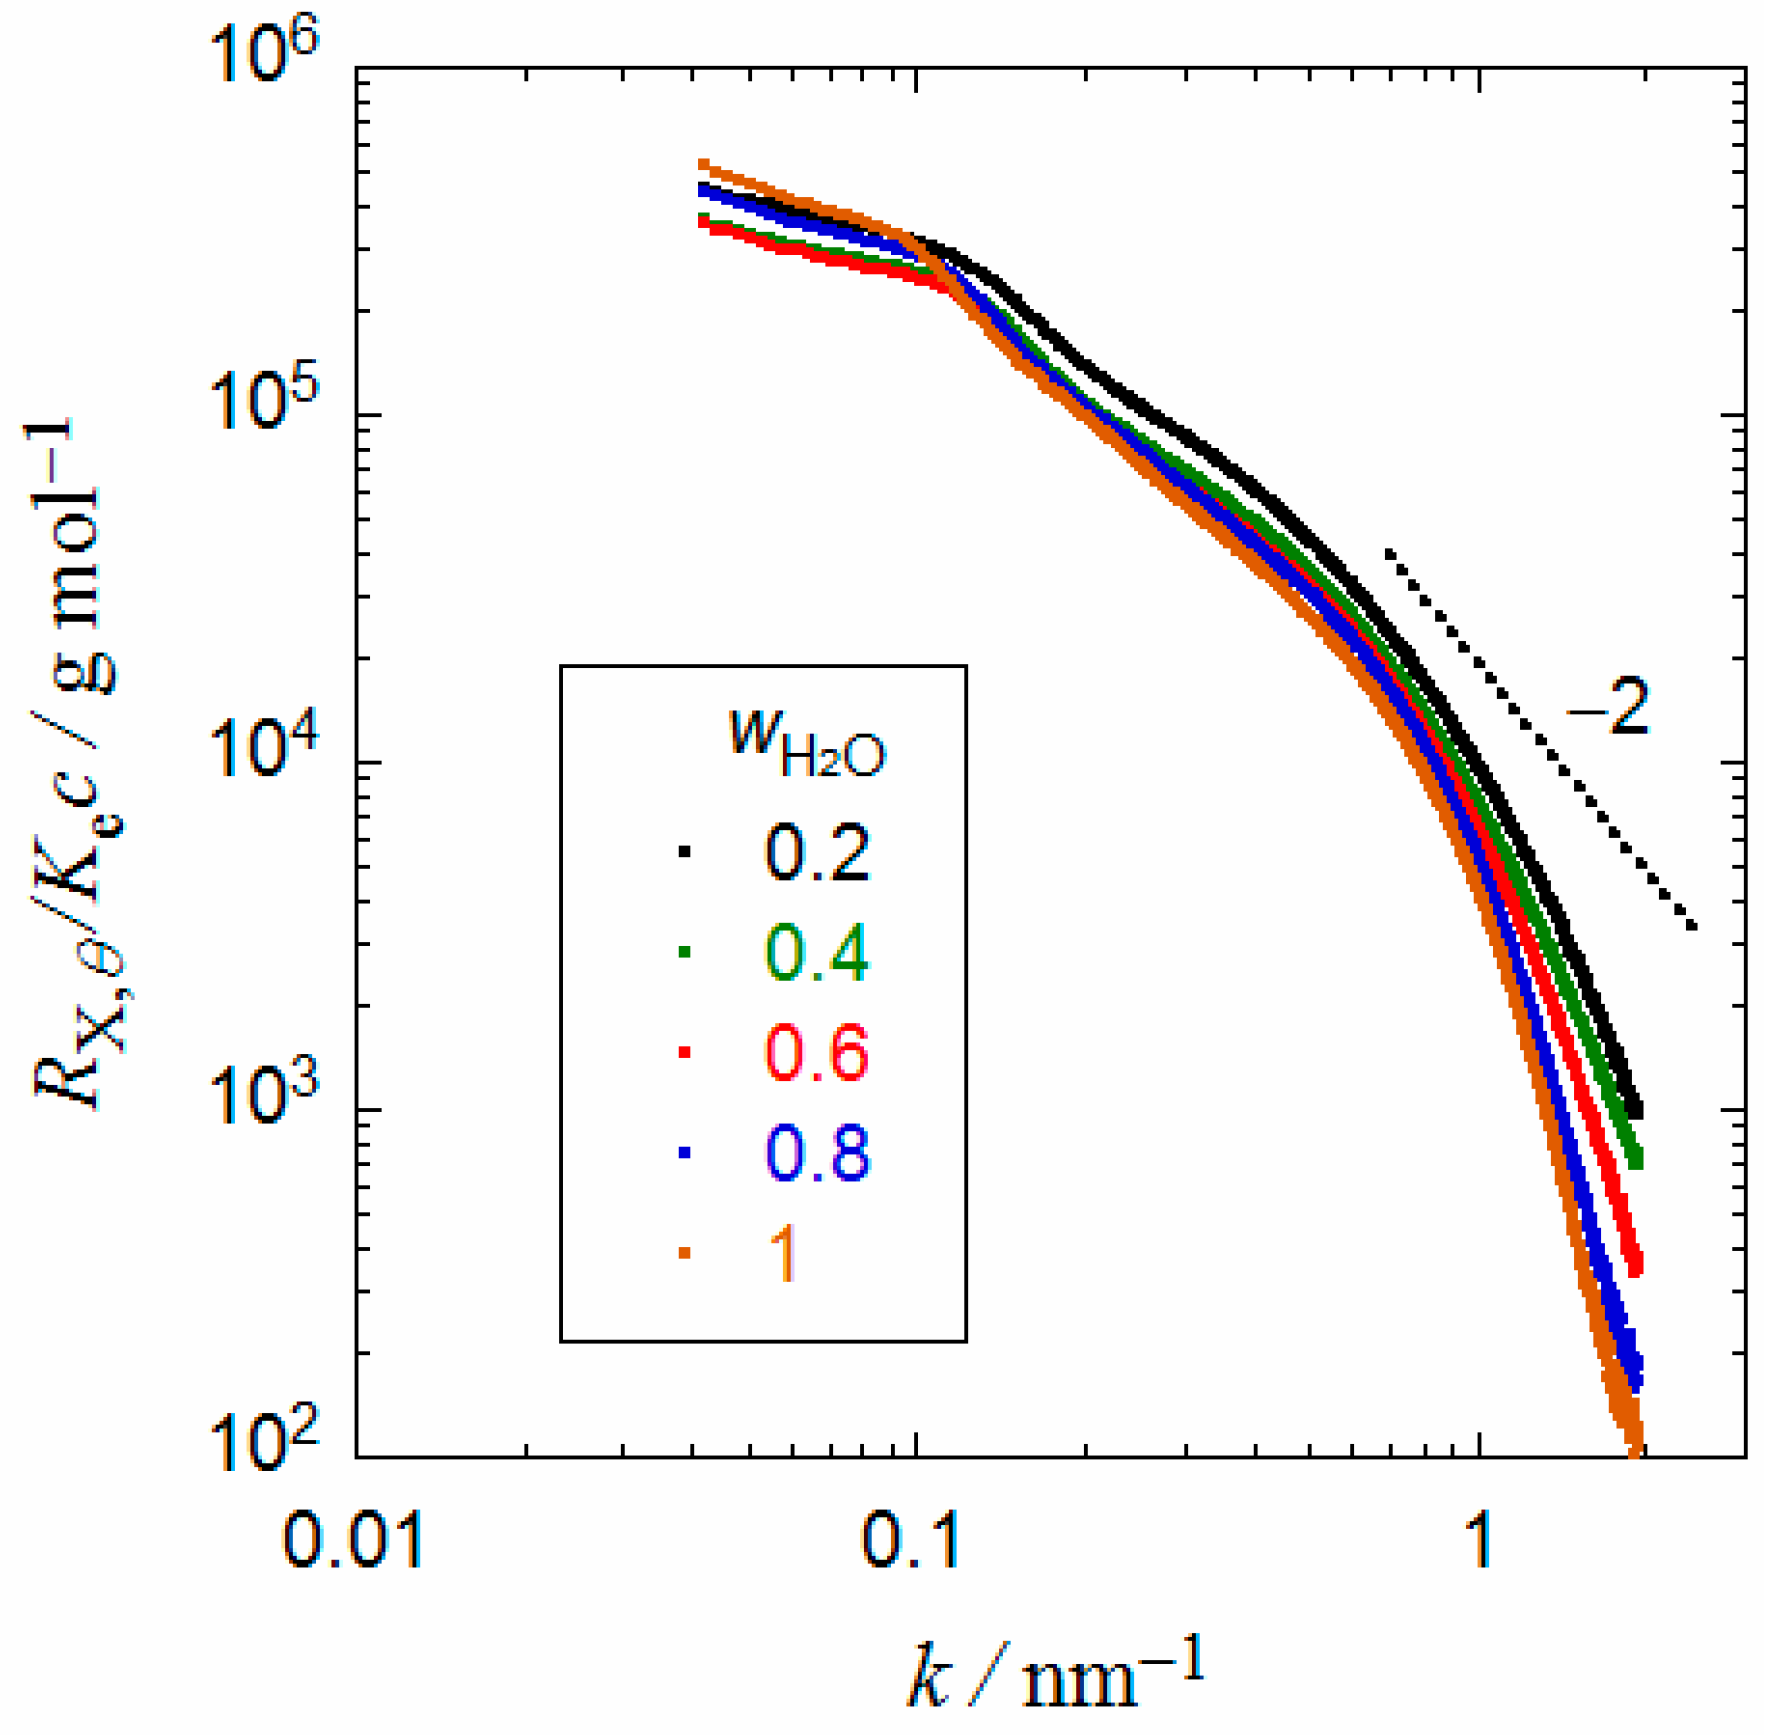
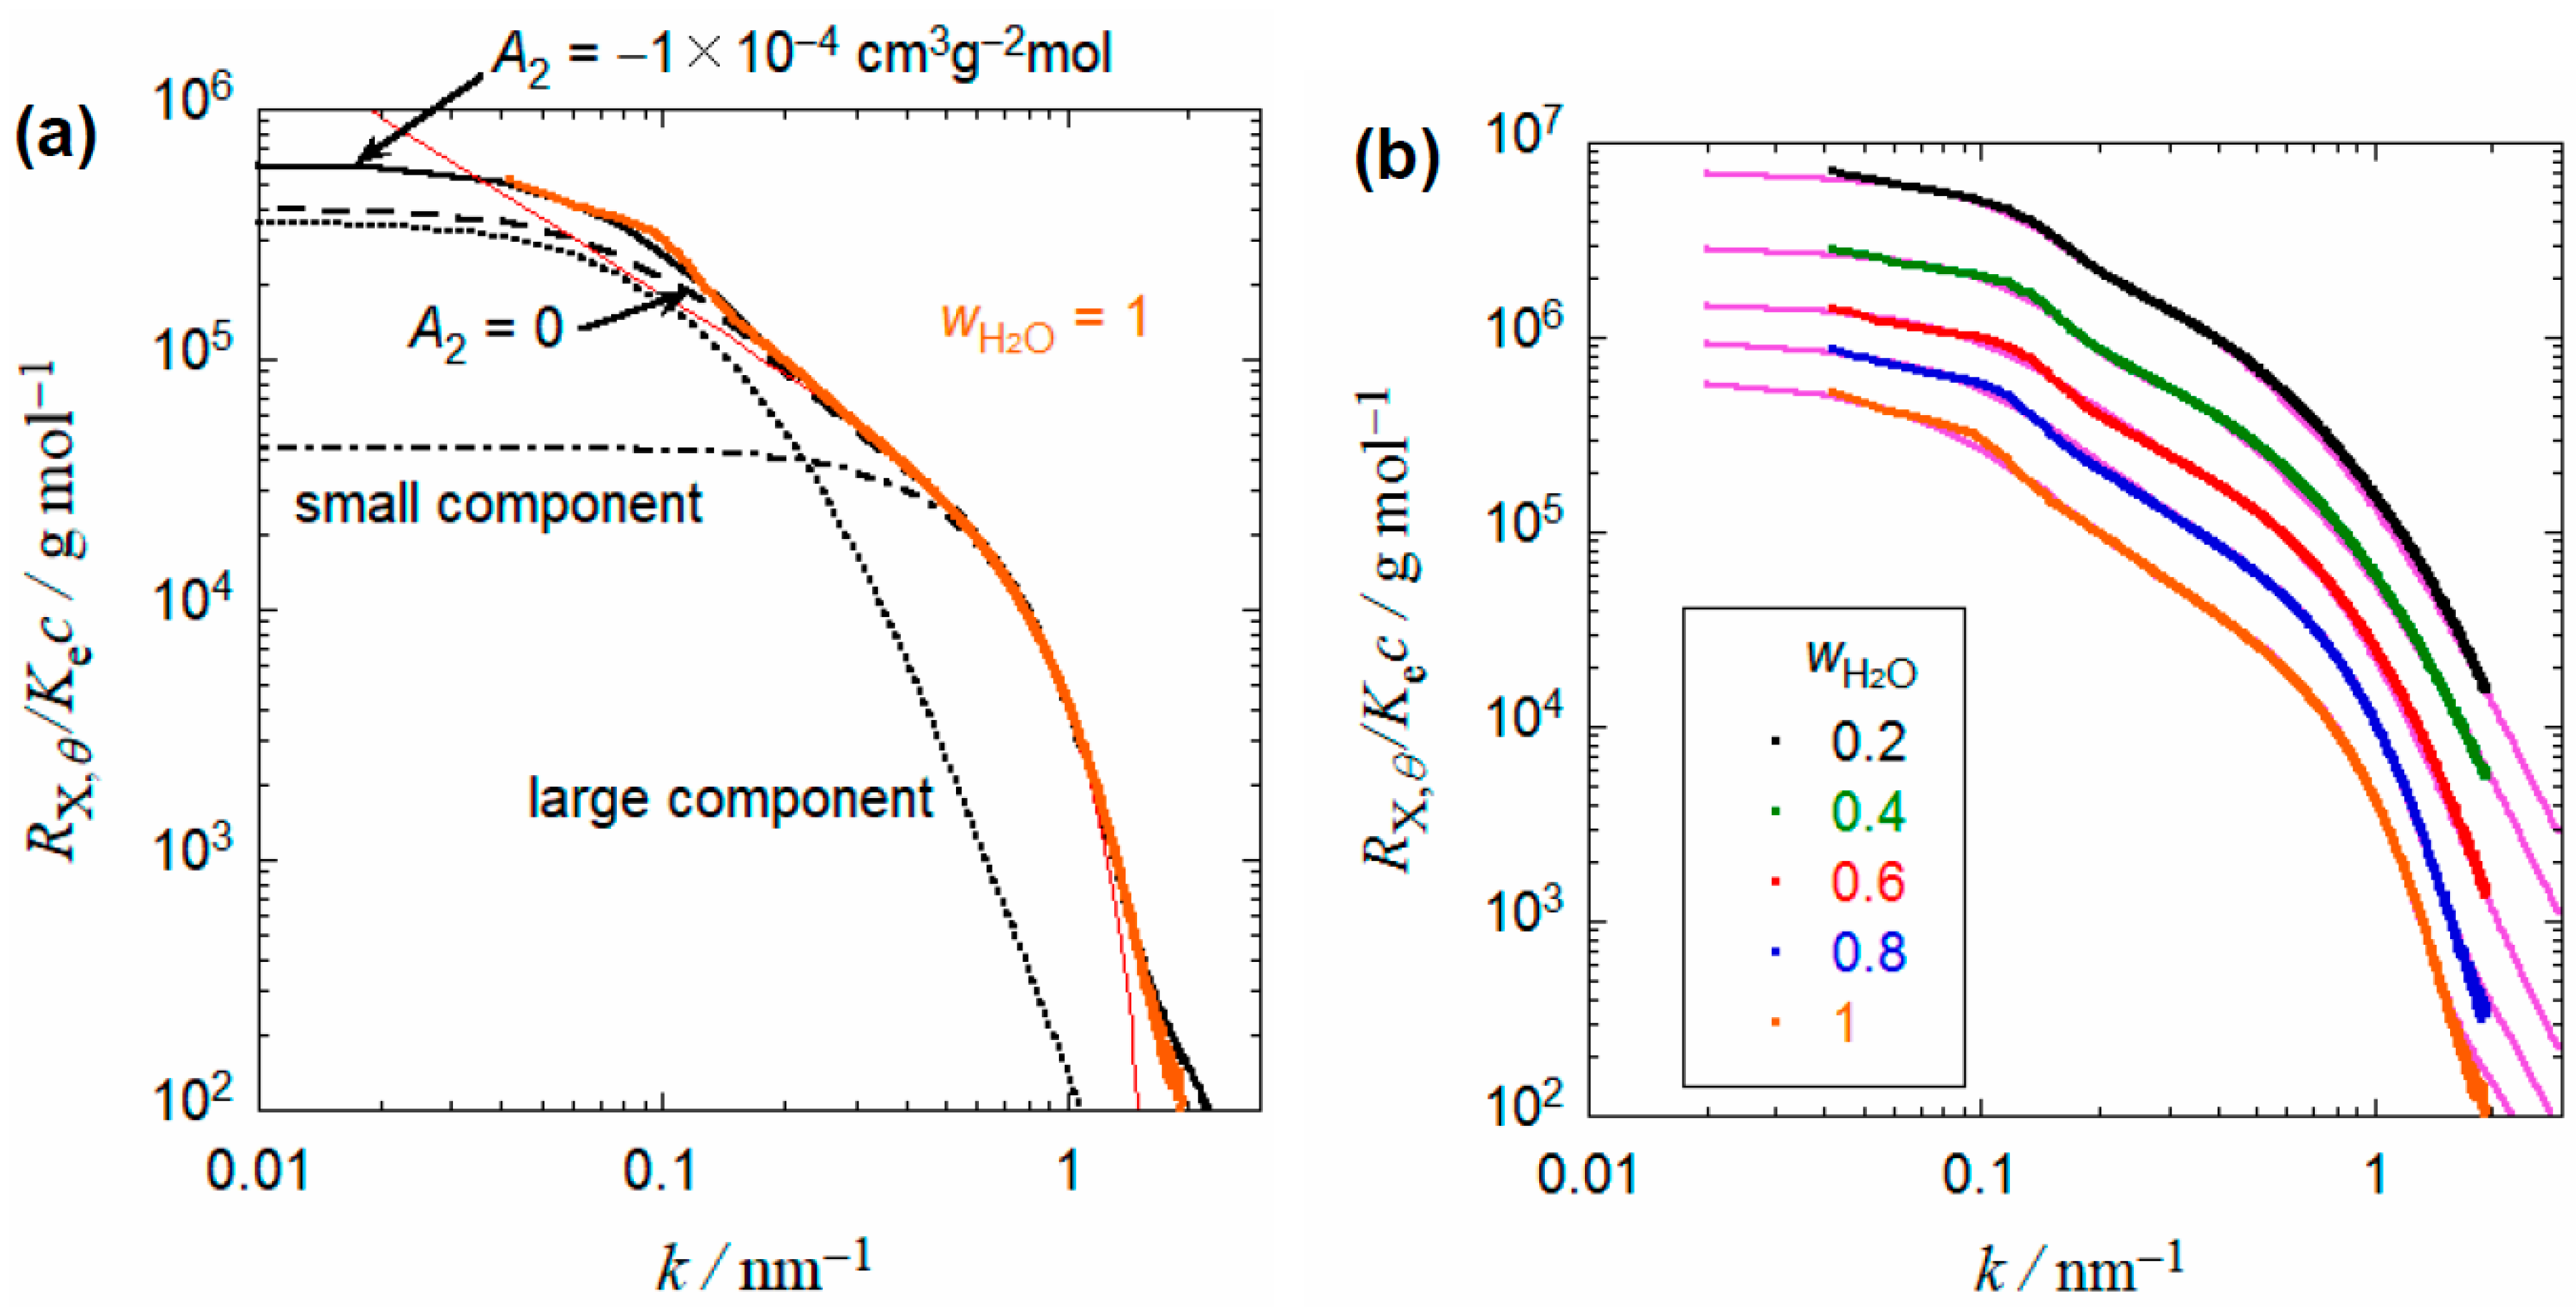
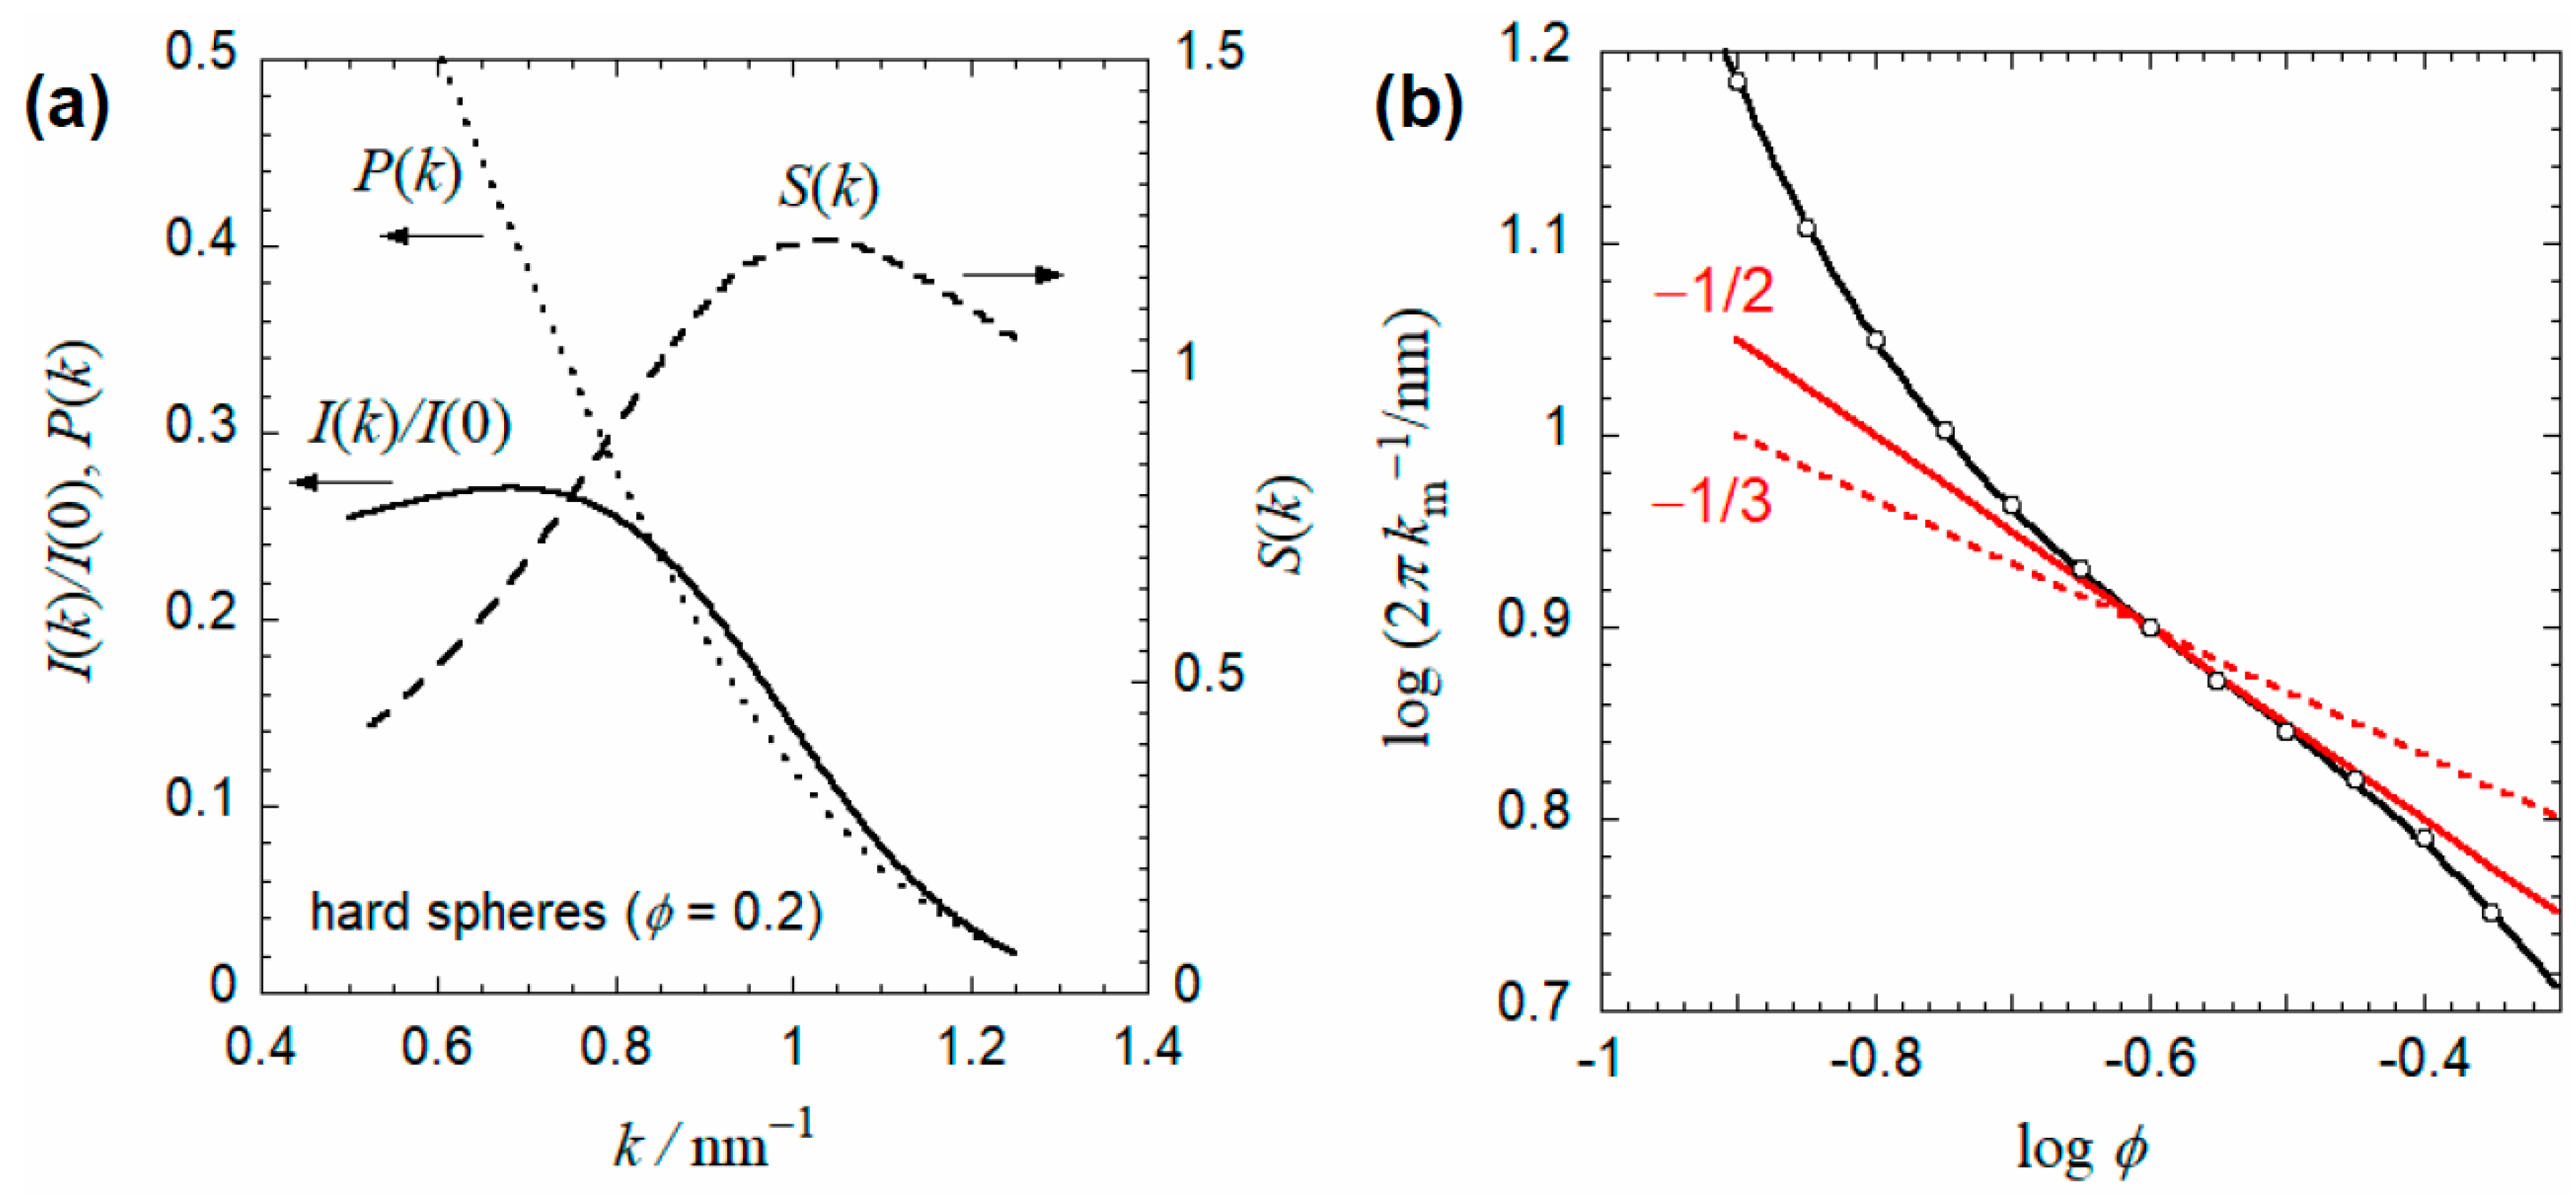
3.3. SAXS
Author Contributions
Conflicts of Interest
Appendix A

References
- Eisenberg, A.; Rinaudo, M. Polyelectrolytes and Ionomers. Polym. Bull. 1990, 24, 671. [Google Scholar] [CrossRef]
- Mauritz, K.A.; Moore, R.B. State of Understanding of Nafion. Chem. Rev. 2004, 104, 4535–4585. [Google Scholar] [CrossRef] [PubMed]
- Aldebert, P.; Dreyfus, B.; Pineri, M. Small-Angle Neutron Scattering of Perfluorosulfonated Ionomers in Solution. Macromolecules 1986, 19, 2651–2653. [Google Scholar] [CrossRef]
- Rebrov, A.V.; Ozerin, A.N.; Svergun, D.I.; Bobrova, L.P.; Bakeyev, N.F. Small Angle X-ray Scatter Study of the Aggregation of Macromolecules of the Perfluorosulphonated Ionomer in Solution. Polym. Sci. U.S.S.R. 1990, 32, 1515–1521. [Google Scholar] [CrossRef]
- Aldebert, P.; Gebelt, G.; Loppinet, B.; Nakamura, N. Polyelectrolyte Effect in Perfluorosulfonated Ionomer Solutions. Polymer 1995, 36, 431–434. [Google Scholar] [CrossRef]
- Li, H.; Schlick, S. Effect of Solvents on Phase Separation in Perfluorinated Ionomers, from Electron Spin Resonance of VO2+ in Swollen Membranes and Solutions. Polymer 1995, 36, 1141–1146. [Google Scholar] [CrossRef]
- Loppinet, B.; Gebel, G.; Williams, C.E. Small-Angle Scattering Study of Perfluorosulfonated Ionomer Solutions. J. Phys. Chem. B 1997, 101, 1884–1892. [Google Scholar] [CrossRef]
- Loppinet, B.; Gebel, G. Rodlike Colloidal Structure of Short Pendant Chain Perfluorinated Ionomer Solutions. Langmuir 1998, 14, 1977–1983. [Google Scholar] [CrossRef]
- Cirkel, P.A.; Okada, T.; Kinugasa, S. Equilibrium Aggregation in Perfluorinated Ionomer Solutions. Macromolecules 1999, 32, 531–533. [Google Scholar] [CrossRef]
- Szajdzinska-Pietek, E.; Wolszczak, M.; Plonka, A.; Schlick, S. Structure and Dynamics of Micellar Aggregates in Aqueous Nafion Solutions Reported by Electron Spin Resonance and Fluorescence Probes. Macromolecules 1999, 32, 7454–7460. [Google Scholar] [CrossRef]
- Jiang, S.; Xia, K.-Q.; Xu, G. Effect of Additives on Self-Assembling Behavior of Nafion in Aqueous Media. Macromolecules 2001, 34, 7783–7788. [Google Scholar] [CrossRef]
- Curtin, D.E.; Lousenberg, R.D.; Timothy, J.; Henry, T.J.; Tangeman, P.C.; Tisack, M.E. Advanced Materials for Improved PEMFC Performance and Life. J. Power Sources 2004, 131, 41–48. [Google Scholar] [CrossRef]
- Lee, S.-J.; Yu, T.L.; Lin, H.-L.; Liua, W.-H.; Lai, C.-L. Solution Properties of Nafion in Methanol/Water Mixture Solvent. Polymer 2004, 45, 2853–2862. [Google Scholar] [CrossRef]
- Yamakawa, H. Modern Theory of Polymer Solutions; Rice, S.A., Ed.; Harper & Row: New York, NY, USA, 1971. [Google Scholar]
- Kanao, M.; Matsuda, Y.; Sato, T. Characterization of Polymer Solutions Containing a Small Amount of Aggregates by Static and Dynamic Light Scattering. Macromolecules 2003, 36, 2093–2102. [Google Scholar] [CrossRef]
- Takahashi, R.; Sato, T.; Terao, K.; Shin-ichi, Y. Reversible Vesicle–Spherical Micelle Transition in a Polyion Complex Micellar System Induced by Changing the Mixing Ratio of Copolymer Components. Macromolecules 2016, 49, 3091–3099. [Google Scholar] [CrossRef]
- Israelachvili, J.N. Intermolecular and Surface Forces; Academic Press: London, UK, 1992. [Google Scholar]
- Pusey, P.N. Intensity Fluctuation Spectroscopy of Charged Brownian Particles: The Coherent Scattering Function. J. Phys. A Math. Gen. 1978, 11, 119–135. [Google Scholar] [CrossRef]
- Takahashi, R.; Sato, T.; Terao, K.; Qiu, X.-P.; Winnik, F.M. Self-Association of a Thermosensitive Poly(2-oxazoline) Block Copolymer in Aqueous Solution. Macromolecules 2012, 45, 6111–6119. [Google Scholar] [CrossRef]
- Sato, T.; Tanaka, K.; Toyokura, A.; Mori, R.; Takahashi, R.; Terao, K.; Yusa, S. Self-Association of a Thermosensitive Amphiphilic Block Copolymer Poly(N-isopropylacrylamide)-b-Poly(N-vinyl-2-pyrrolidone) in Aqueous Solution upon Heating. Macromolecules 2013, 46, 226–235. [Google Scholar] [CrossRef]
- Takahashi, R.; Qiu, X.-P.; Xue, N.; Sato, T.; Terao, K.; Winnik, F.M. Self-Association of the Thermosensitive Block Copolymer Poly(2-isopropyl-2-oxazoline)-b-Poly(N-isopropylacrylamide) in Water−Methanol Mixtures. Macromolecules 2014, 47, 6900–6910. [Google Scholar] [CrossRef]
- Zimm, B.H. The Scattering of Light and the Radial Distribution Function of High Polymer Solutions. J. Chem. Phys. 1948, 16, 1093–1099. [Google Scholar] [CrossRef]
- Kyriakos, K.; Philipp, M.; Lin, C.-H.; Dyakonova, M.; Vishnevetskaya, N.; Grillo, I.; Zaccone, A.; Miasnikova, A.; Laschewsky, A.; Peter Müller-Buschbaum, P.; Papadakis, C.M. Quantifying the Interactions in the Aggregation of Thermoresponsive Polymers: The Effect of Cononsolvency. Macromol. Rapid Commun. 2016, 37, 420–425. [Google Scholar] [CrossRef] [PubMed]
- Egelstaff, P.A. An Introduction to the Liquid State; Academic Press: London, UK; New York, NY, USA, 1967. [Google Scholar]
- Hayter, J.B.; Penfold, J. An Analytic Structure Factor for Macroion Solutions. Mol. Phys. 1981, 42, 109–118. [Google Scholar] [CrossRef]


| wH2O | 0.2 | 0.4 | 0.6 | 0.8 | 1 |
|---|---|---|---|---|---|
| ∂n/∂c a | 0.0110 | 0.0085 | 0.0087 | 0.0110 | 0.0136 |
| γ b | 0.145 | 0.1635 | 0.178 | 0.189 | 0.198 |
© 2018 by the authors. Licensee MDPI, Basel, Switzerland. This article is an open access article distributed under the terms and conditions of the Creative Commons Attribution (CC BY) license (http://creativecommons.org/licenses/by/4.0/).
Share and Cite
Li, S.; Terao, K.; Sato, T. Colloidal Dispersion of a Perfluorosulfonated Ionomer in Water–Methanol Mixtures. Polymers 2018, 10, 72. https://doi.org/10.3390/polym10010072
Li S, Terao K, Sato T. Colloidal Dispersion of a Perfluorosulfonated Ionomer in Water–Methanol Mixtures. Polymers. 2018; 10(1):72. https://doi.org/10.3390/polym10010072
Chicago/Turabian StyleLi, Sinan, Ken Terao, and Takahiro Sato. 2018. "Colloidal Dispersion of a Perfluorosulfonated Ionomer in Water–Methanol Mixtures" Polymers 10, no. 1: 72. https://doi.org/10.3390/polym10010072
APA StyleLi, S., Terao, K., & Sato, T. (2018). Colloidal Dispersion of a Perfluorosulfonated Ionomer in Water–Methanol Mixtures. Polymers, 10(1), 72. https://doi.org/10.3390/polym10010072