1. Introduction
Due to the potential application in fission fuel, actinoid-metal borocarbides are of great interest, especially thorium borocarbide compounds [
1,
2,
3,
4,
5,
6,
7]. Thorium borocarbide compounds have diversified stoichiometric proportions with different crystal structures due to the flexible B–C framework. Toth et al. [
1] first investigated thorium borocarbide compounds, and observed four related compounds, including ThBC, ThB
2C, ThBC
2, and Th
2BC
2. The crystal structure of ThBC [
2] shows a tetragonal symmetry with the
P4
122 space group, which contains tetrahedra and trigonal prisms of Th atoms, and two boron and two carbon atoms form isolated zigzag chains. ThB
2C [
3] crystallizes in the rhombohedral space group (
) with slightly puckered Th-metal layers, and boron atoms form B
6 hexagons connected by carbon atoms. Based on X-ray powder diffraction experiment, Rogl et al. reported the crystal structures of Th
3B
2C
3 [
4] and Th
2B
2C
3 [
5]. The monoclinic Th
3B
2C
3 belongs to the space group of
P2/m, in which Th atoms form octahedra, tetrahedra, and trigonal prisms with B and C atoms occupying their centers, and non-metal atoms form isolated zigzag B–C chain fragments [
4], which are similar to the B–C chains in ThBC [
2]. The crystal structure of Th
2B
2C
3 consists of the infinite branched B–C chains and triangular prisms of Th atoms. Therefore, the flexible B–C framework leads to the complexity of the crystal structures for thorium borocarbide compounds. Consequently, the crystal structure of ThBC
2, observed by Toth et al. long ago [
1], remains an open question in the past years.
Actually, the determinations of crystal structures of ternary borocarbide compounds would face many problems. First, the distributions of B and C atoms are so complex for a given crystal framework that it is hard to determine the lowest energy phases of ternary borocarbide compounds, which are called “coloring problems” in structural chemistry [
8,
9]. Second, from the point of view of the experiment, ternary borocarbide compounds contain heavy metal atoms, which can be readily distinguished by XRD or neutron-diffraction measurements. But for light B and C atoms, it is difficult to resolve their Wyckoff positions because the electronic and nuclear scattering cross-sections of B and C atoms are very similar [
10]. Therefore, it is challenging to solve their crystal structures in experiments. To complement experiments, many crystal structure prediction techniques [
11,
12,
13,
14] based on the first-principles density functional method have been proposed recently. In particular, the particle swarm optimization (PSO) technique as implemented in the crystal structure analysis by particle swarm optimization (CALYPSO) [
11] has been suggested to be an efficient tool to resolve the ground state of certain compound [
15,
16,
17].
In the present work, we performed the PSO technique combined with first-principles calculations to determine the ground state structure of ThBC2. The stability of ThBC2 is verified by the phonon spectrum and elastic constants. To show the mechanical properties, we have systematically studied the elastic anisotropies of ThBC2. In addition, the failure modes under tensile and shear strains are investigated by the ideal strength calculations.
2. Computational Methods
The crystal structure of ThBC
2 was predicted using the PSO technique as implemented in the CALYPSO package [
11]. To improve the prediction efficiency and avoid possible breakdown of structure optimization, the initial minimum inter-atomic distance between different types of atoms are 0.6 times the length of the sum of atomic covalent radii for the random structures. The proportion of the structures generated by PSO technique is set to 0.6. Other parameters are set as the default values of the CALYPSO package. All the self-consistent field calculations and structural relaxations were carried out within the framework of density functional theory using the Vienna ab initio simulation package (VASP) [
18]. The generalized gradient approximation (GGA) with the Perdew–Burke–Ernzerhof functional was employed to describe exchange–correlation interaction [
19]. The interactions between electron and core were described by the frozen-core projector augmented wave (PAW) method [
20], where the 6
s26
p66
d27
s2, 2
s22
p1, and 2
s22
p2 are valence electrons for Th, B, and C atoms, respectively. The PAW pseudo potential has been successfully used to study the compounds including Th atoms, such as thorium dicarbide [
21], thorium dioxide [
22], thorium dihydride [
23], and thorium mononitrides [
24]. The cutoff energy of 600 eV for plane wave and the 9 × 9 × 9
k-point meshes with Monkhorst–Pack method [
25] were adopted, which can ensure that the total energy was converged to 1 meV per atom. All the structures were relaxed until the forces on each atom are below 0.001 eV/Å. To verify the dynamical stability, we performed the finite displacement method to calculate the phonon spectrum of ThBC
2 with 2 × 2 × 2 supercell of primitive cell and 4 × 4 × 4
k-point meshes as implemented in PHONOPY package [
26]. The elastic constants were estimated by the strain–stress method described in our previous work [
27], and a set of homogeneous strains with maximum strain value of 0.1% is applied. The elastic moduli and Pugh’s ratio were calculated using the Voigt–Reuss–Hill approximation [
28]. To estimate the ideal tensile and shear strengths, the conventional cell of ThBC
2 is deformed incrementally and continuously along the direction of the applied strain. Then, the atomic basis vectors orthogonal to the applied strain and the positions of all atoms are relaxed simultaneously. As a result, the strain–stress curves for deducing the ideal strength are obtained [
29,
30]. Considering that the spin-orbit coupling (SOC) plays an important role on the compounds including heavy atoms [
31], we tested the influence of SOC on the crystal structure and elastic constants of ThBC
2. The calculated results [see the
Supplementary Material (SM)] imply that SOC has little impact on the structure and mechanical properties of ThBC
2. Therefore, we can ignore the SOC effect in the following. For orthorhombic structure, the Young’s modulus
E along the [
hkl] direction is described by the expression [
32]
where
sij are the elastic compliance constants of orthorhombic symmetry,
α,
β, and
γ denote the direction cosines of the [
hkl] direction. The shear modulus
G along the arbitrary [
uvw] directions on the (
hkl) shear plane can be written as [
32].
where
α1,
β1, and
γ1 are the direction cosines of the [
uvw] direction, while
α2,
β2, and
γ2 are the direction cosines of the normal direction of the (
hkl) shear plane. The anisotropy of Young’s modulus and shear modulus are discussed based on above two expressions.
3. Results and Discussion
To determine the ground state structure of ThBC
2, we performed the structural search by the unbiased PSO technique [
11] with the cell up to 8 formula units (f.u.). As a result, we obtained the ground state structure of ThBC
2 according to comparing their total energies. As shown in
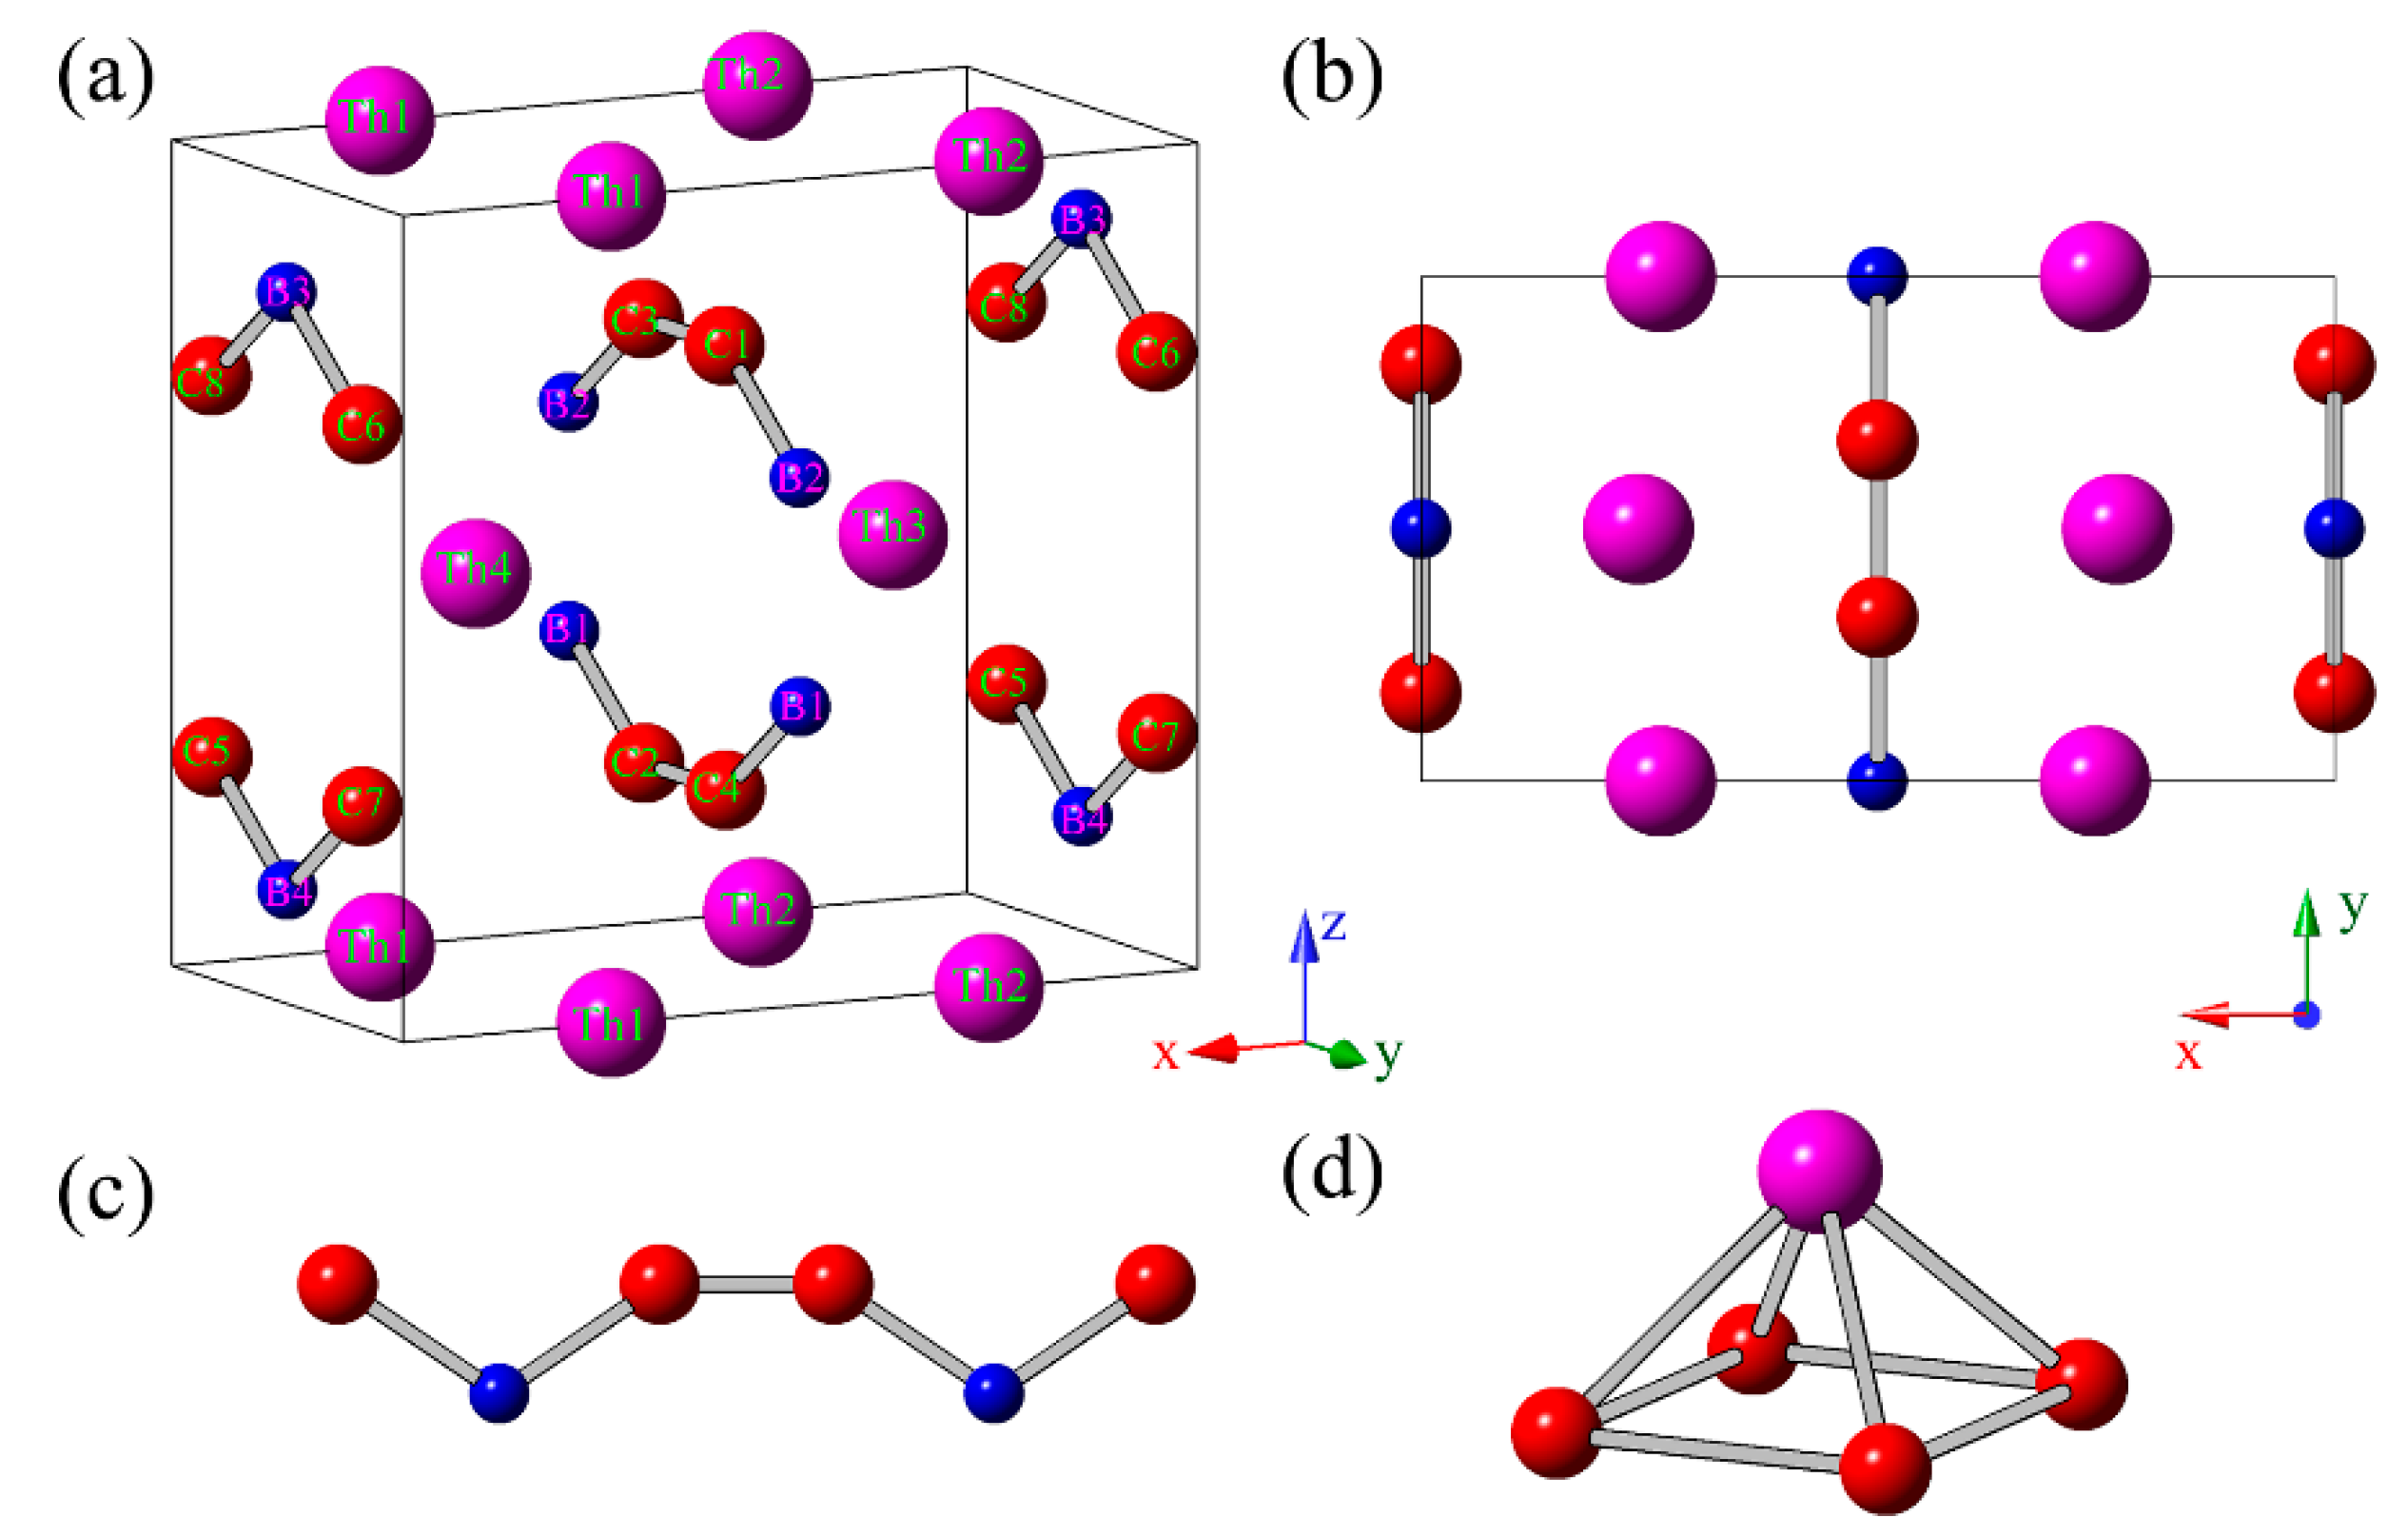
Figure 1a,b, the predicted crystal structure of ThBC
2 belong to the space group of
Immm (no. 71) within orthorhombic symmetry (16 atoms/cell), in which Th atoms occupy the 4
e (0.26226, 0, 0) Wyckoff position, B atoms occupy 4
j (1/2, 0, 0.36170) Wyckoff position, and C atoms occupy 8
l (0, 0.17557, 0.26910) Wyckoff position, respectively. The optimized lattice constants of the conventional cell are
a = 7.2403 Å,
b = 3.9978 Å, and
c = 6.7686 Å. Clearly, we can see that the B and C atoms form the armchair-like B–C chains along (010) direction (see
Figure 1c). These armchair-like B–C chains are separated by the adjacent Th atomic layers. Note that the armchair-like B–C chains had been uncovered in other thorium borocarbide compounds, such as ThBC [
2,
7]. One Th atom and four C atoms can constitute a square pyramid (see
Figure 1d), which serves as a basic building-block of ThBC
2. The average B–C bond length of ThBC
2 is 1.57 Å, which is shorter than those of
t-BC
4 (1.66 Å) [
27,
33] and
d-BC
3 (1.61 Å) [
34], but is slightly longer than those of ThBC (1.54 Å) [
2] and ThB
2C (1.49 Å) [
3]. The interatomic distance between adjacent B atoms is 1.87 Å, which is also larger than those of ThBC (1.77 Å) [
2] and ThB
2C (1.85 Å) [
3]. In addition, to facilitate the possible experimental synthesis, we discuss the metastable ThBC
2 in the
SM, and the crystal structures of the most stable form and other four predicted forms are available in the
SM.
To verify the stability, we first calculated the phonon spectrum of ThBC
2. As shown in
Figure 2a, it is found that there is no imaginary frequency in the Brillouin zone along the high-symmetry direction, which indicates the dynamical stability of ThBC
2. Moreover, due to the large differences of atomic masses among Th, B, and C atoms, the optical branches and acoustic branches of ThBC
2 are separated distinctly, leading to large acoustic-optical branch gap. Meanwhile, the high-frequency optical phonon bands are also discrete. The formation energy can reflect the relative stability of the compound and whether the compound can be readily synthesized experimentally. Here, we choose the face-centered cubic thorium, rhombohedral
α-boron and graphite as the reference phases. Therefore, the formation energy
of ThBC
2 can be defined by
where
represents the total energy of ThBC
2, and
,
, and
denote the total energies of bulk thorium,
α-boron, and graphite, respectively. The calculated formation energy of ThBC
2 is −1.454 eV/f.u., suggesting the thermodynamic stability and possible synthesis of ThBC
2 in experiment. In addition, the electronic band structure calculation reveals that ThBC
2 is metallic, as shown in
Figure 2b,c. The density of states (DOS) for ThBC
2 implies that the Th and C atoms mainly contribute to the total density of states around the Fermi level.
To further confirm the stability and assess the mechanical properties, we have calculated the elastic constants and elastic moduli of ThBC
2. The orthorhombic ThBC
2 has nine independent elastic constants, which are
C11 = 315 GPa,
C12 = 146 GPa,
C13 = 40 GPa,
C23 = 67 GPa,
C22 = 286 GPa,
C33 = 576 GPa,
C44 = 40 GPa,
C55 = 49 GPa, and
C66 = 117 GPa. Clearly, these elastic constants satisfy the elastic stability criteria for a stable orthorhombic structure, that is,
C11 > 0,
C44 > 0,
C55 > 0,
C66 > 0,
C11C22 >
C122,
C11C22C33 + 2
C12C13C23 −
C11C232 −
C22C132 −
C33C122 > 0 [
35]. The estimated bulk modulus (
B) and shear modulus (
G) of ThBC
2 are 184 and 86 GPa, which are larger than the bulk modulus (123 GPa) and shear modulus (61 GPa) of tetragonal ThBC [
7]. That is to say, our predicted orthorhombic ThBC
2 has better ability to resist the tensile and shear deformations than that of ThBC. Accordingly, we can obtain the Pugh’s modulus ratio
B/
G, which is an indicator for determining whether material is ductile or brittle; if Pugh’s ratio is larger than 1.75, a material will tend to be ductile, otherwise brittle [
36,
37]. The calculated Pugh’s ratio of 2.13 implies that our predicted ThBC
2 tends to be ductile.
The elastic anisotropy refers to the directional dependence of mechanical properties, which is closely related with plastic deformation and crack behavior of materials. To get a comprehensive understanding of elastic anisotropy, we calculated the Young’s modulus
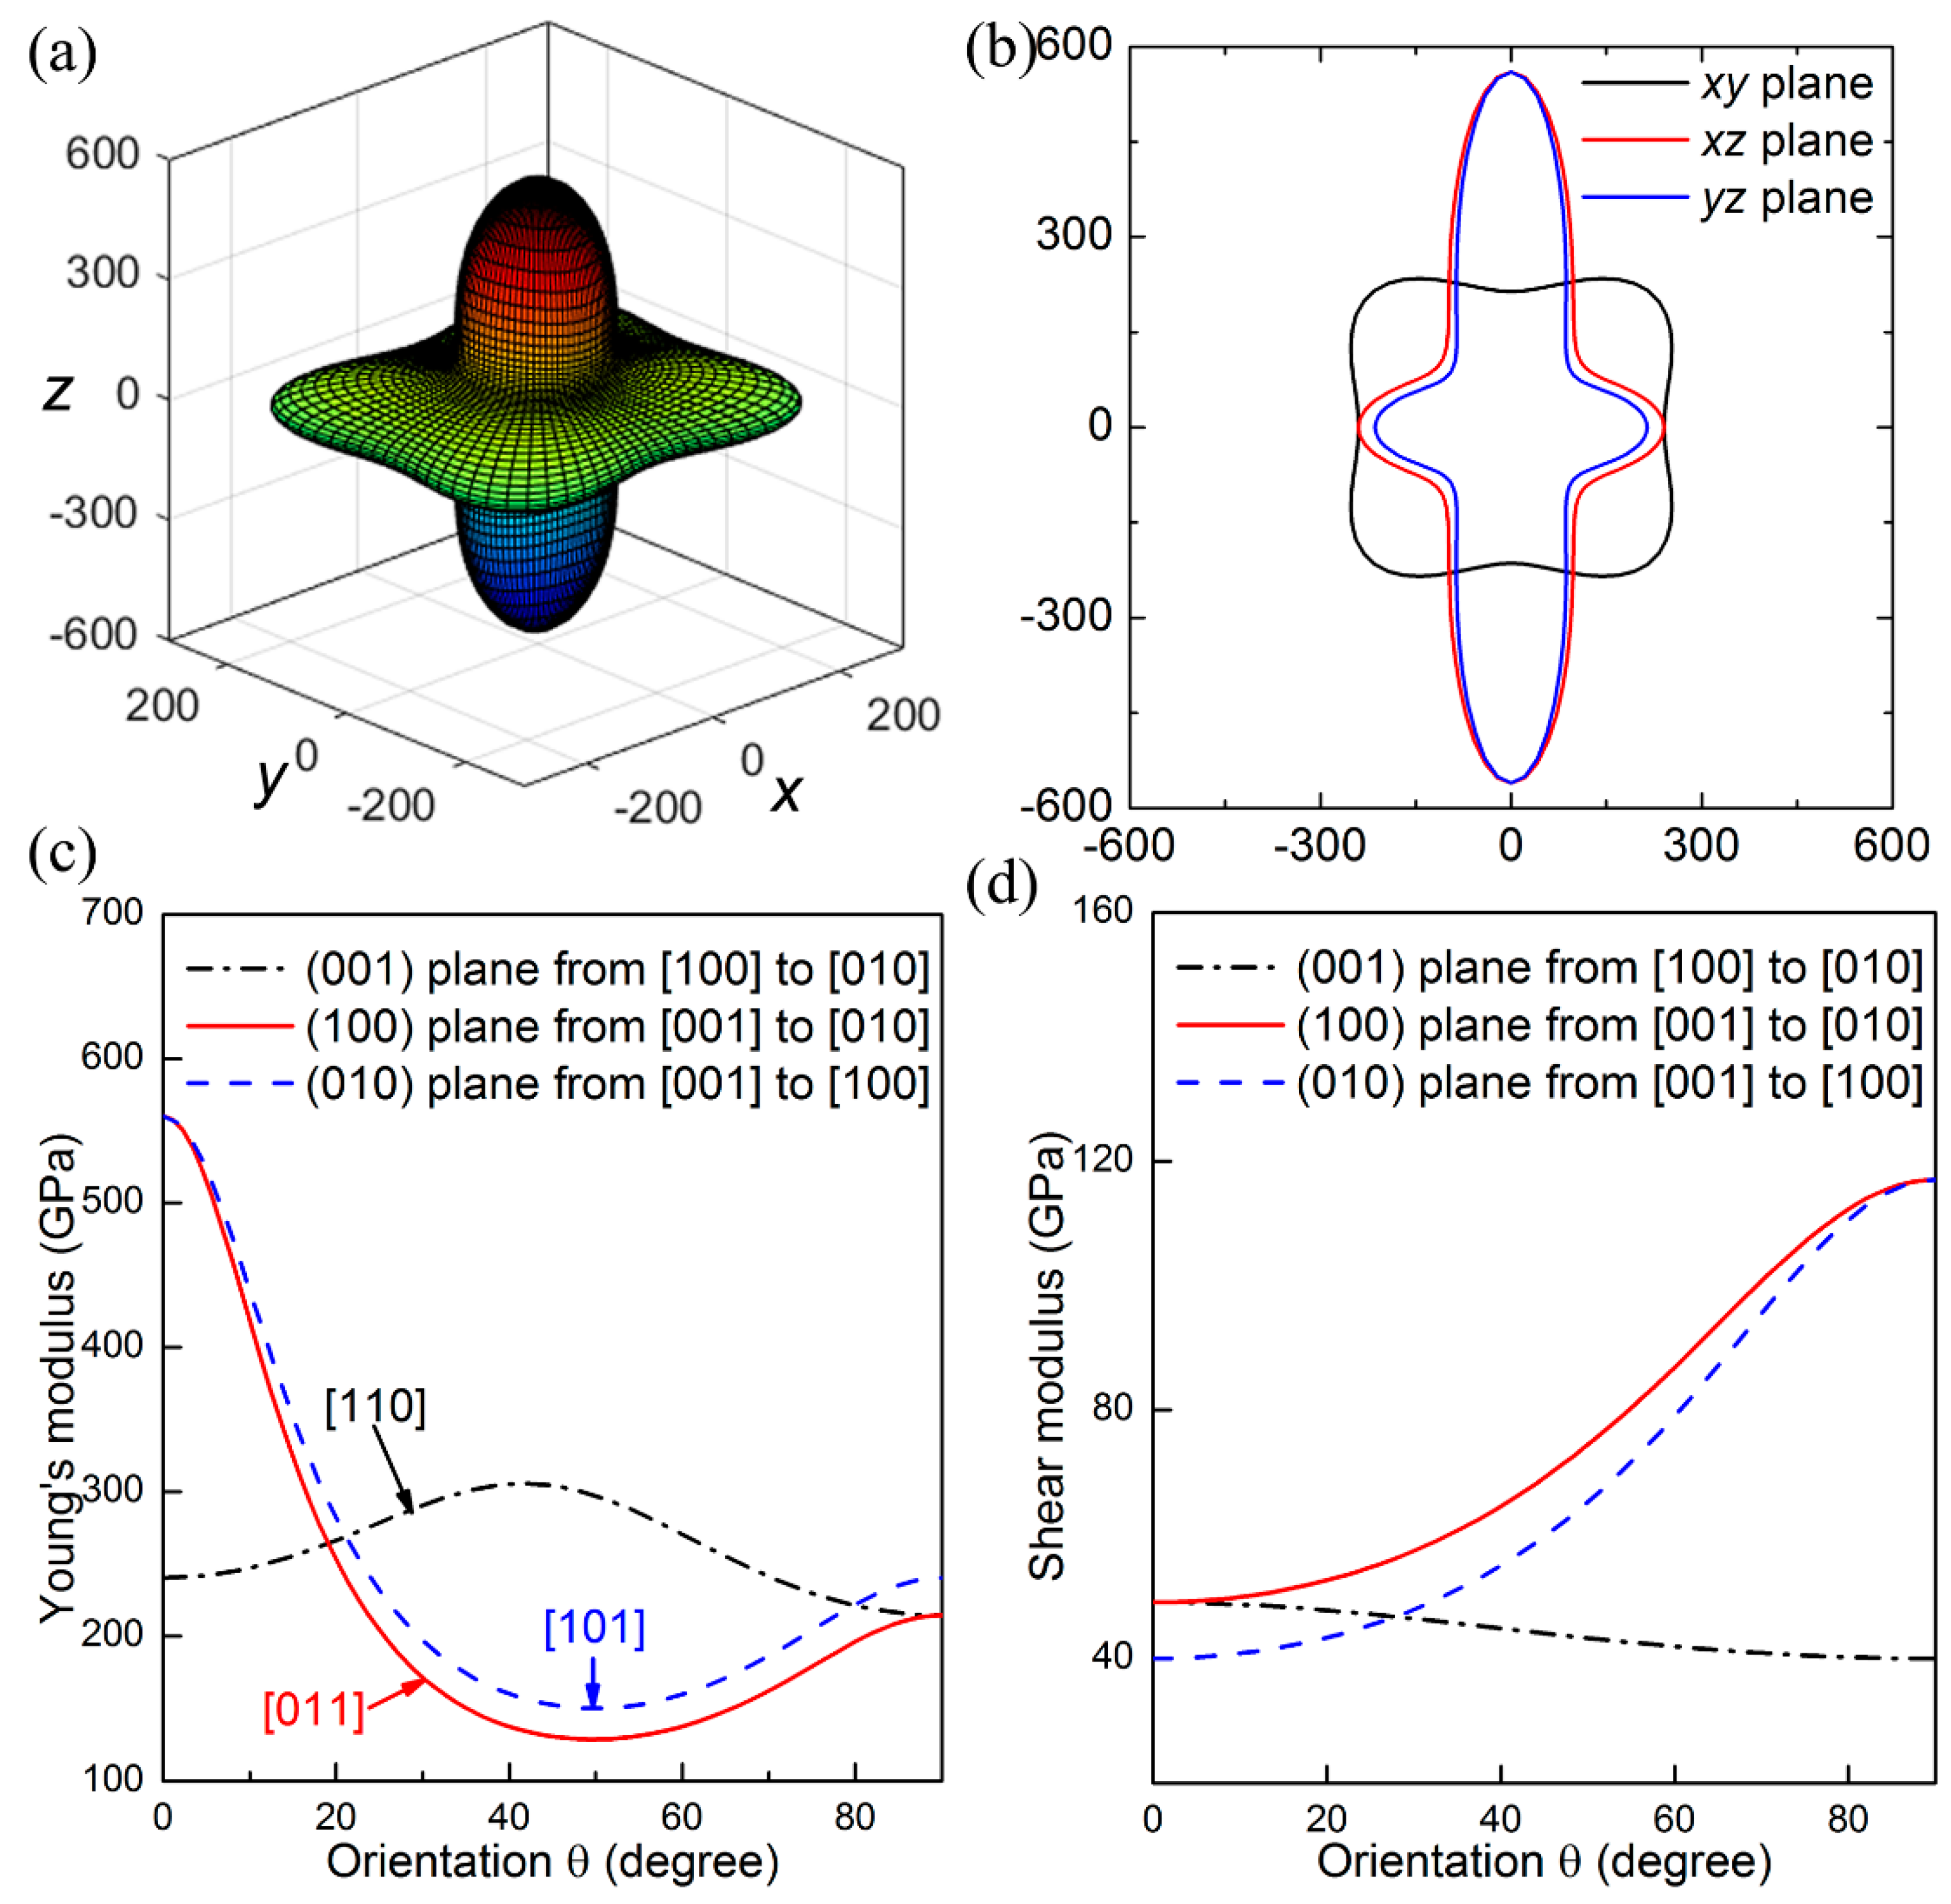
E as a function of the directions based on their analytical expressions discussed above, in which the elastic compliance constants can be deduced by the elastic constants. As shown in
Figure 3a,b, the Young’s moduli of ThBC
2 along different orientations present a high degree of anisotropy. In particular, we can clearly see that the maximum Young’s modulus is along the [001] direction, which is significantly larger than the Young’s modulus along other directions. This can be ascribed to the fact that there exist a number of strong covalent B–C bonds along the [001] direction, which facilitates ThBC
2 to resist tensile deformation and results in largest Young’s modulus along this direction.
To further study the mechanical anisotropy, we estimated the orientation dependence of Young’s modulus and shear modulus as the tensile or shear strain is within the (001), (100), and (010) planes. For instance, when the tensile strain is within the (001) plane, the tensile direction can be denoted as [
hk0], and we refer to the angle between the [
hk0] and [100] direction as
θ. As a result, the direction cosines of the [
hk0] can be obtained as
,
, and
. Thus, Equation (1) translates into
in which the Young’s modulus is dependent with the defined orientation
θ. The other orientation dependence of Young’s modulus and shear modulus can be obtained using similar method, and the detailed results can be found in Ref. [
32]. Based on the above approach, the calculated results are shown in
Figure 3c,d. The maximum Young’s modulus is found along the [001] direction (
E[001] = 560 GPa), which shows excellent consistency with the three-dimensional (3D) plots of Young’s modulus. It is found that Young’s modulus along principal crystal directions possess the sequence of
E[101] <
E[011] <
E[010] <
E[100] <
E[110] <
E[001]. To measure the ability of resisting shear deformation for ThBC
2, the dependences of shear moduli on the directions are illustrated in
Figure 3d. We can see that the largest shear modulus (
G = 117 GPa) appears along the [001] direction on the (100) shear plane. Meanwhile, the obtained smallest shear modulus is along the [100] direction on the (001) shear plane, i.e.,
G(001)[100] = 40 GPa, which is equal to the elastic constant of
C44.
The ideal strength of a material is the upper limit of mechanical strength that it can sustain. If the stress upon material is larger than ideal strength, it will collapse. In particular, the ideal tensile and shear strengths are intimately related with the failure mode of material, and thus can be employed to uncover when the cleavage fracture and slip will appear for certain compounds. Therefore, we next study the ideal tensile and shear strengths of ThBC
2 to further explore its mechanical property. The tensile and shear strains are continuously applied upon ThBC
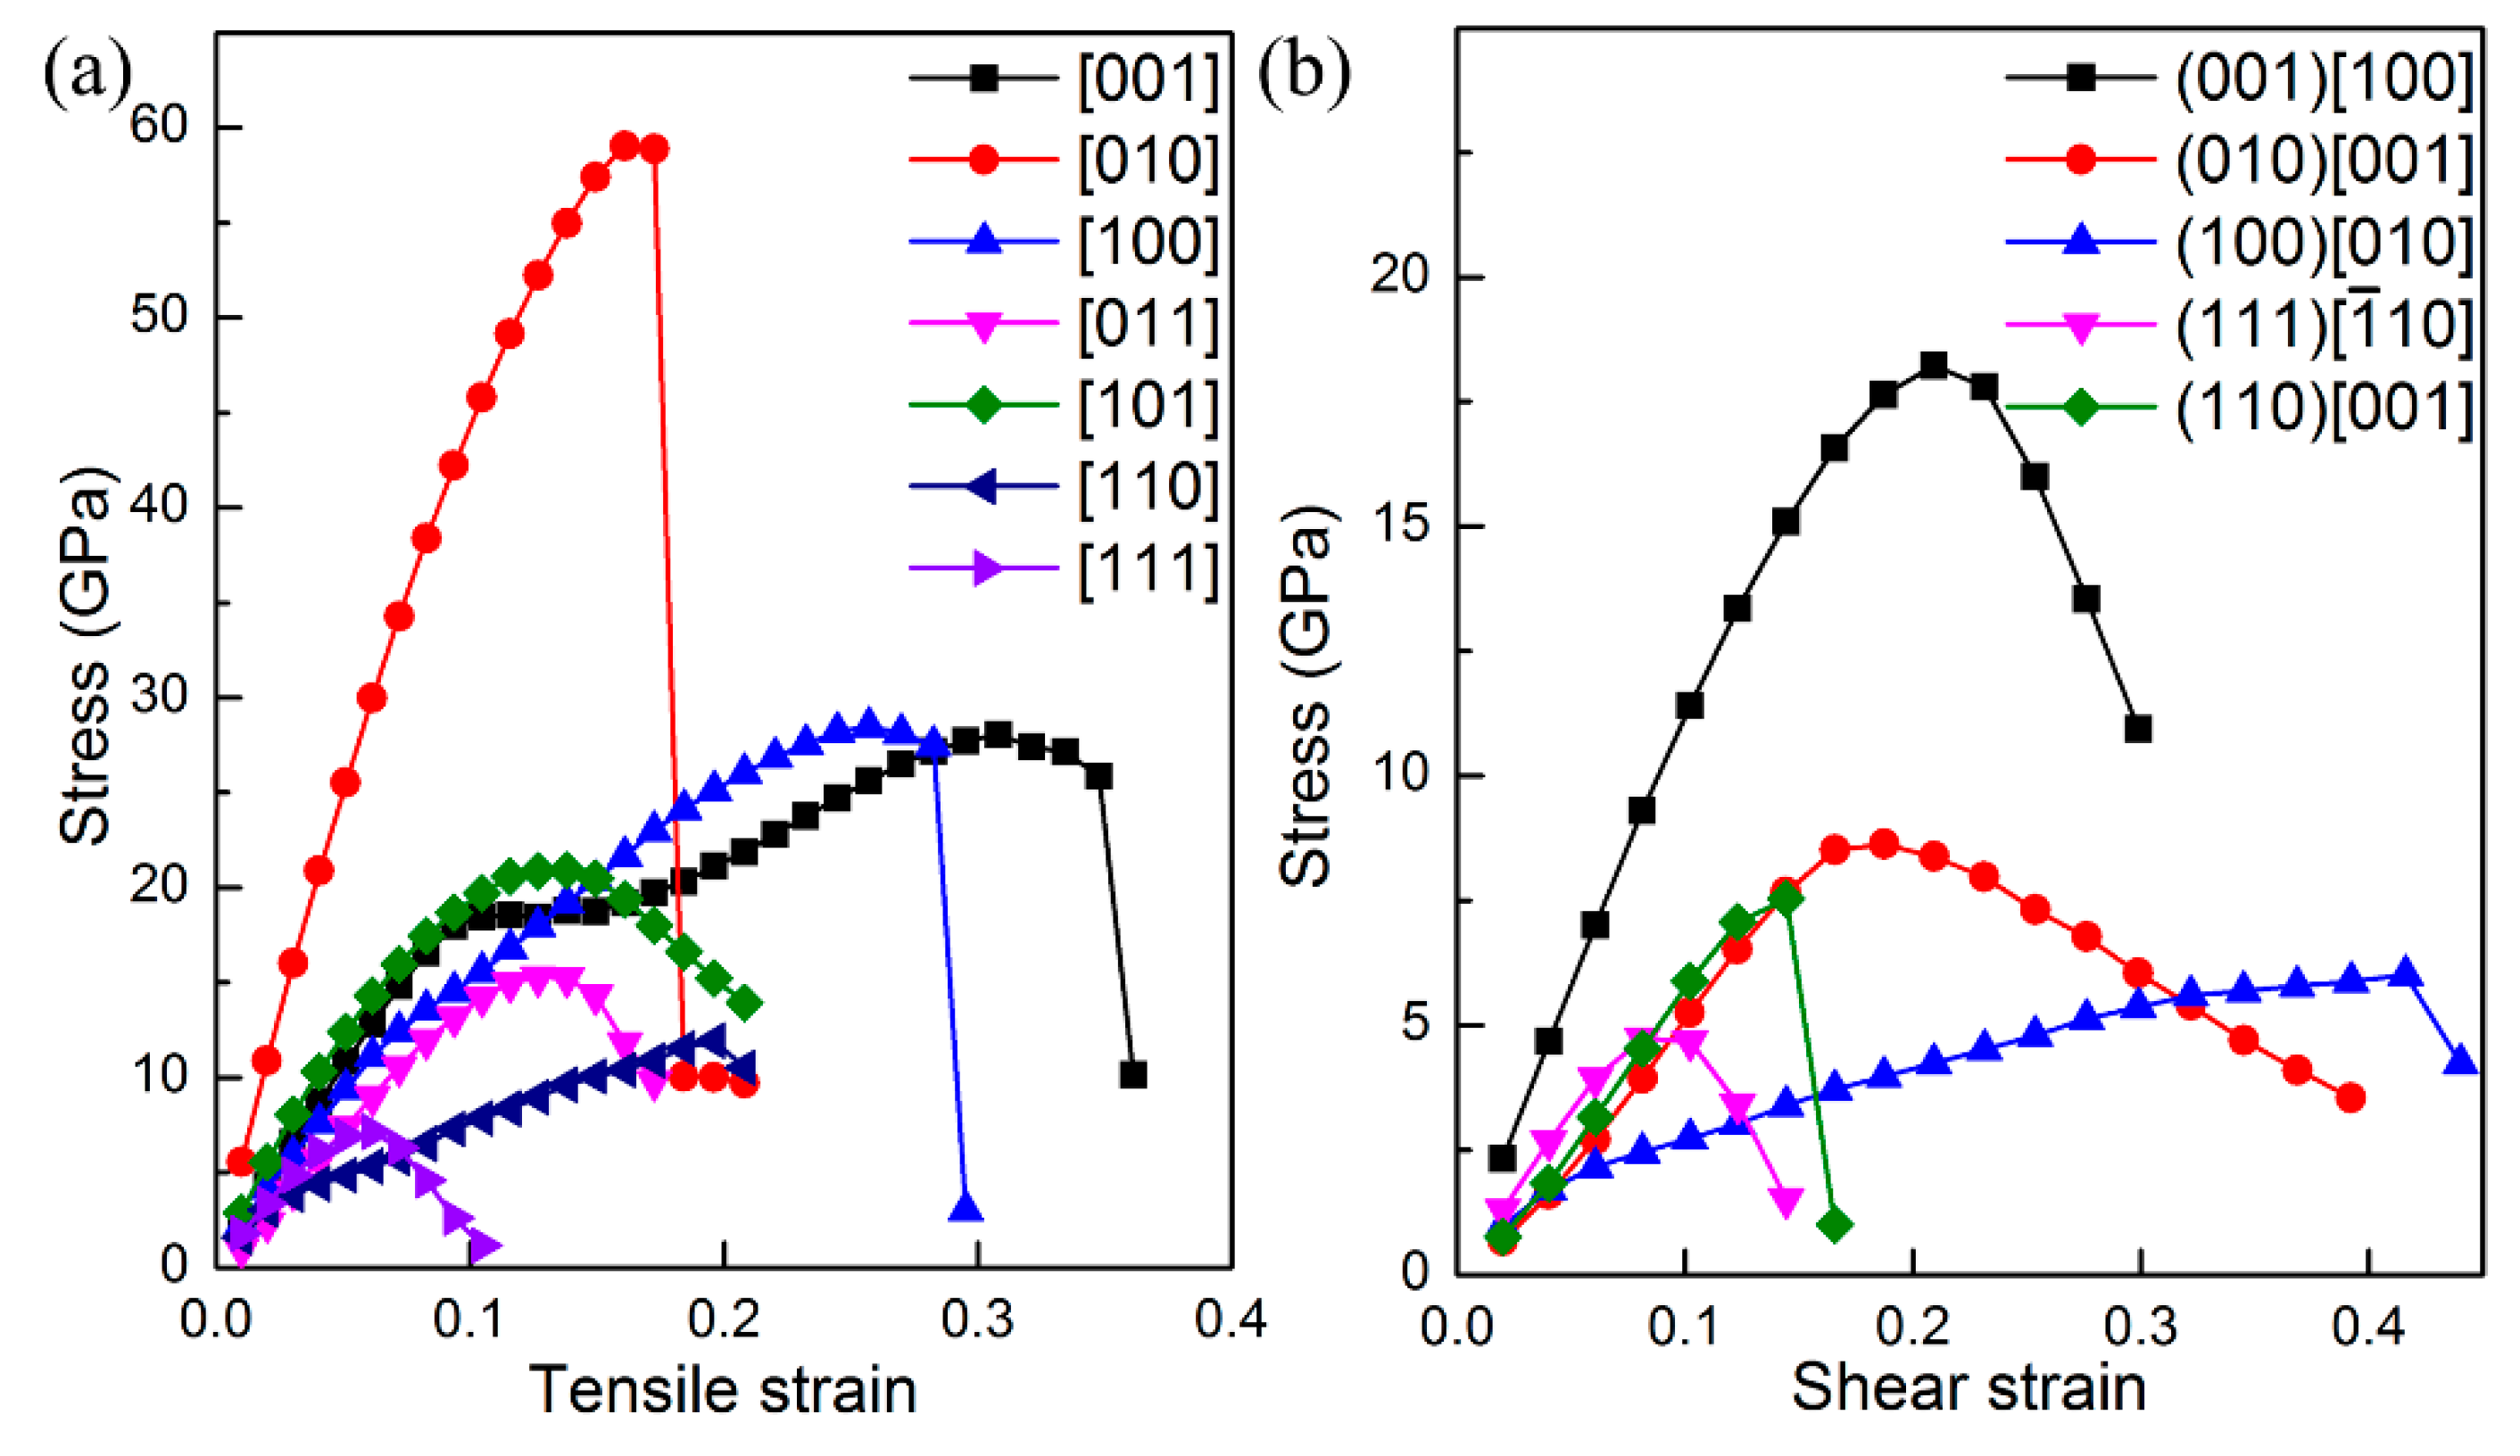
2 to obtain the strain–stress relationships, and consequently the ideal strength can be deduced. The calculated strain–stress relationships are shown in
Figure 4. It is found that the largest ideal tensile strength is σ = 59 GPa along the [010] direction. The main reason is that the armchair-like B–C chains are along [010] direction, which can form strong covalent B–C against the tensile deformation. The lowest ideal tensile strength appears in the [111] direction, i.e., σ
[001] = 7 GPa, suggesting that the cleavage fracture can easily occur along this direction. An inspection of the Th-C bond length suggests that the distance between the Th4 and C6 increases from 2.66 Å to 3.01 Å when the [111] tensile strain increases from 0 to 0.07. This fact implies these Th-C bonds are the main load bearing component along the [111] direction. Therefore, the weak Th-C bonds along the [111] direction is responsible for this low tensile strength. Besides the [111] direction, the [011] and [110] tensile deformation also easily stretch the weak Th-C bonds and result in small ideal tensile strength along these directions. It is worth noting that the ideal shear strengths of ThBC
2 on different shear planes are all very small, which is the inevitable consequence of the layered structure of ThBC
2. We can see that the highest ideal shear strength is along the [100] direction on the (001) plane, i.e., τ
(001)[100] = 18 GPa, and the obtained lowest ideal shear strength occurs within the [
] direction on the (111) plane, indicating that ThBC
2 can readily slip under shear along this direction.
Interestingly, the strain–stress curves under tensile and shear deformation exhibit different characteristic along various directions. For instance, the stress along the [010] direction drops abruptly under tensile deformation, while along the [111] direction the stress decreases gradually rather than a sharp decrease past the elastic limit. To get deeper insights into this interesting characteristic, we next analyze atomic bondings and electron localization function (ELF) to clarify this point.
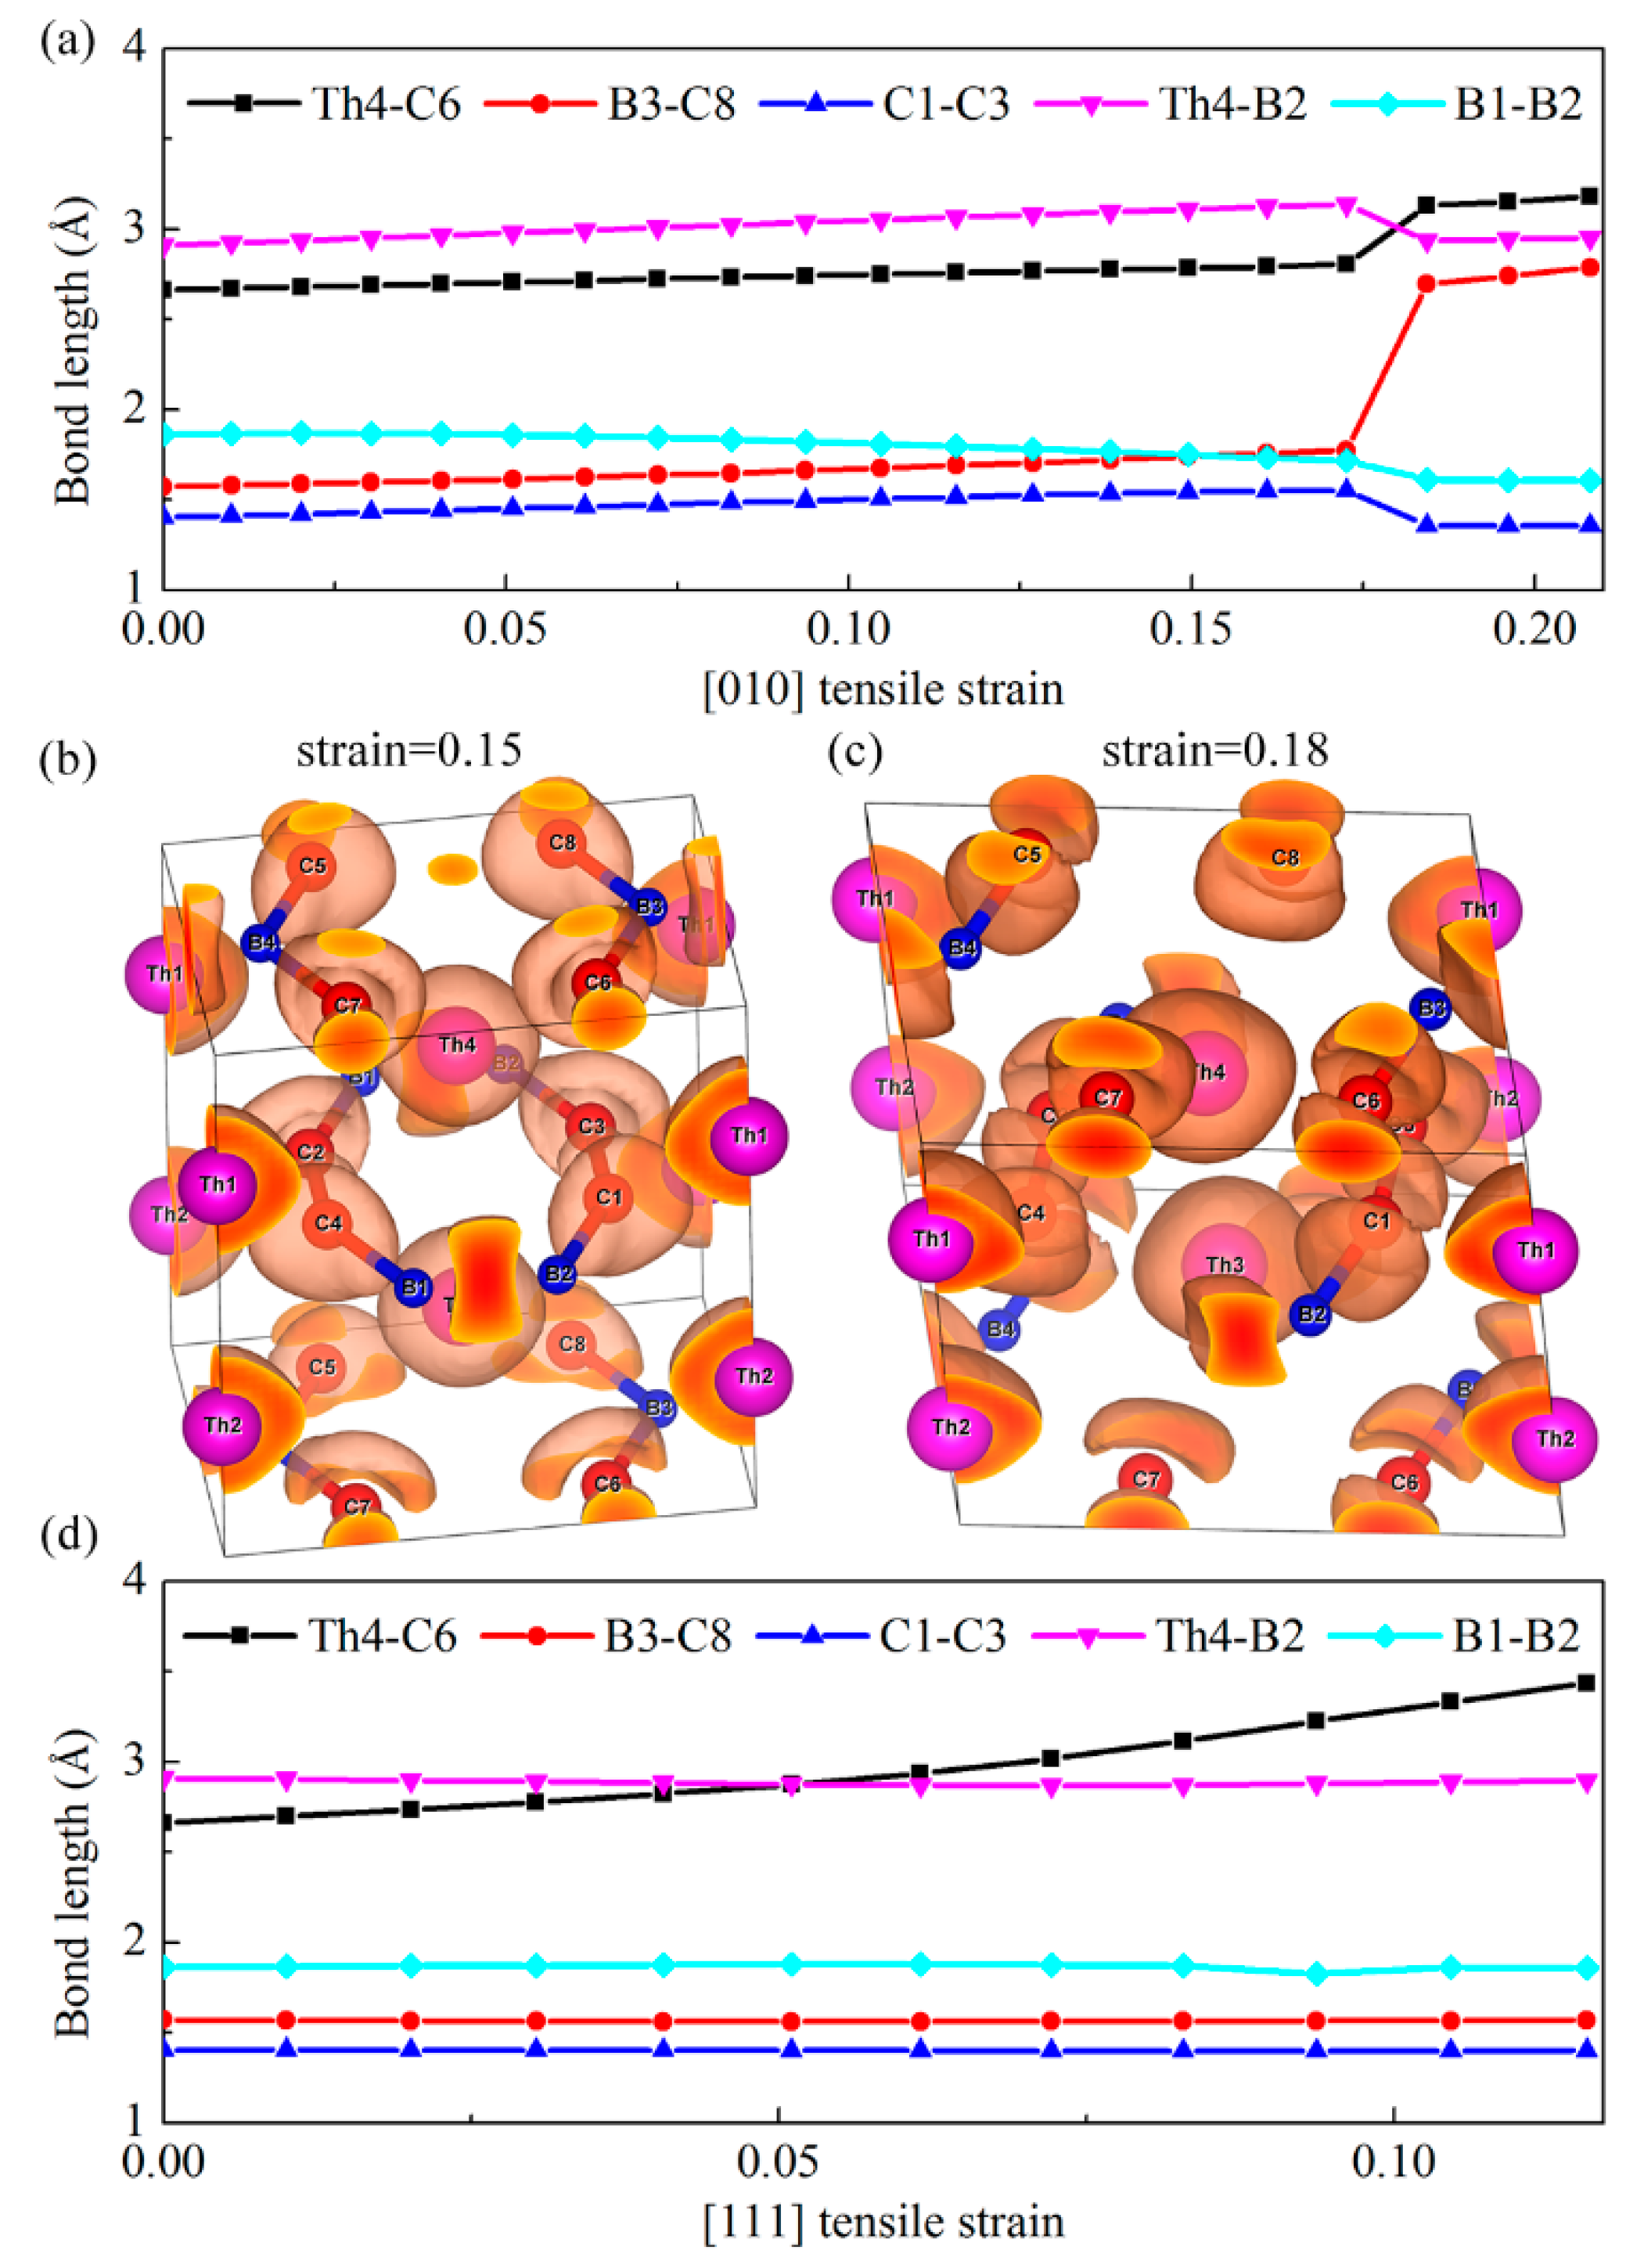
Figure 5a shows the bond lengths of our chosen typical Th-C, B–C, C–C, Th-B, and B–B bonds as a function of the [010] tensile strain. Clearly, we can see that the distance between the B3 and C8 atoms increases abruptly when the tensile strain exceeds the critical value of 0.17, while other bonds show small changes compared with the B–C bonds. Therefore, the alignment of strong covalent B–C bonds along the [010] direction is the main load bearing component, which leads to the largest ideal tensile strength 59 GPa. Nevertheless, once the tensile strain is larger than the critical value of 0.17, as show in
Figure 4, a sudden ‘‘hard’’ breaking of the strong covalent B–C bonds occurs, which accounts for the sharp decrease of the stress along this direction. To further confirm this bond-breaking pattern, the three-dimensional isosurfaces of ELF with an isovalue of 0.75 before and after the critical tensile strains are plotted in
Figure 5b,c. Generally, the large ELF value corresponds to high electron localization and is the characterization of covalent bondings. As shown in
Figure 5b,c, the charge distribution localized in between B3–C8 bond exhibits a sharp decrease when the tensile strain changes from 0.15 to 0.18, further suggesting the bond-breaking of strong covalent B–C bond under the [010] tensile deformation. However, for the [111] tensile deformation, as shown in
Figure 5d, the bond lengths of B–C, C–C, Th-B, and B–B bonds nearly keep invariant with the increase of tensile strain, while the Th-C bond increases gradually as the tensile loading increases, even though beyond the critical strain 0.06. Therefore, the stress under this tensile mode change gradually beyond the critical strain, corresponding to the softer bond-deformation behavior. In a word, the ‘hard’’ breaking of B–C bonds correspond to the sharp decrease of the stress in the strain–stress curve, while the weak Th-C bonds result in softer bond-deformation behavior as characterized by a gradual decrease of the stress.


