Synergistic Path for Dual Anisotropic and Electrically Switchable Emission From a Nanocomposite of CsPbBr3 Quantum Cuboids and Nematic Liquid Crystal


Abstract

1. Introduction
2. Experimental
3. Results and Discussion
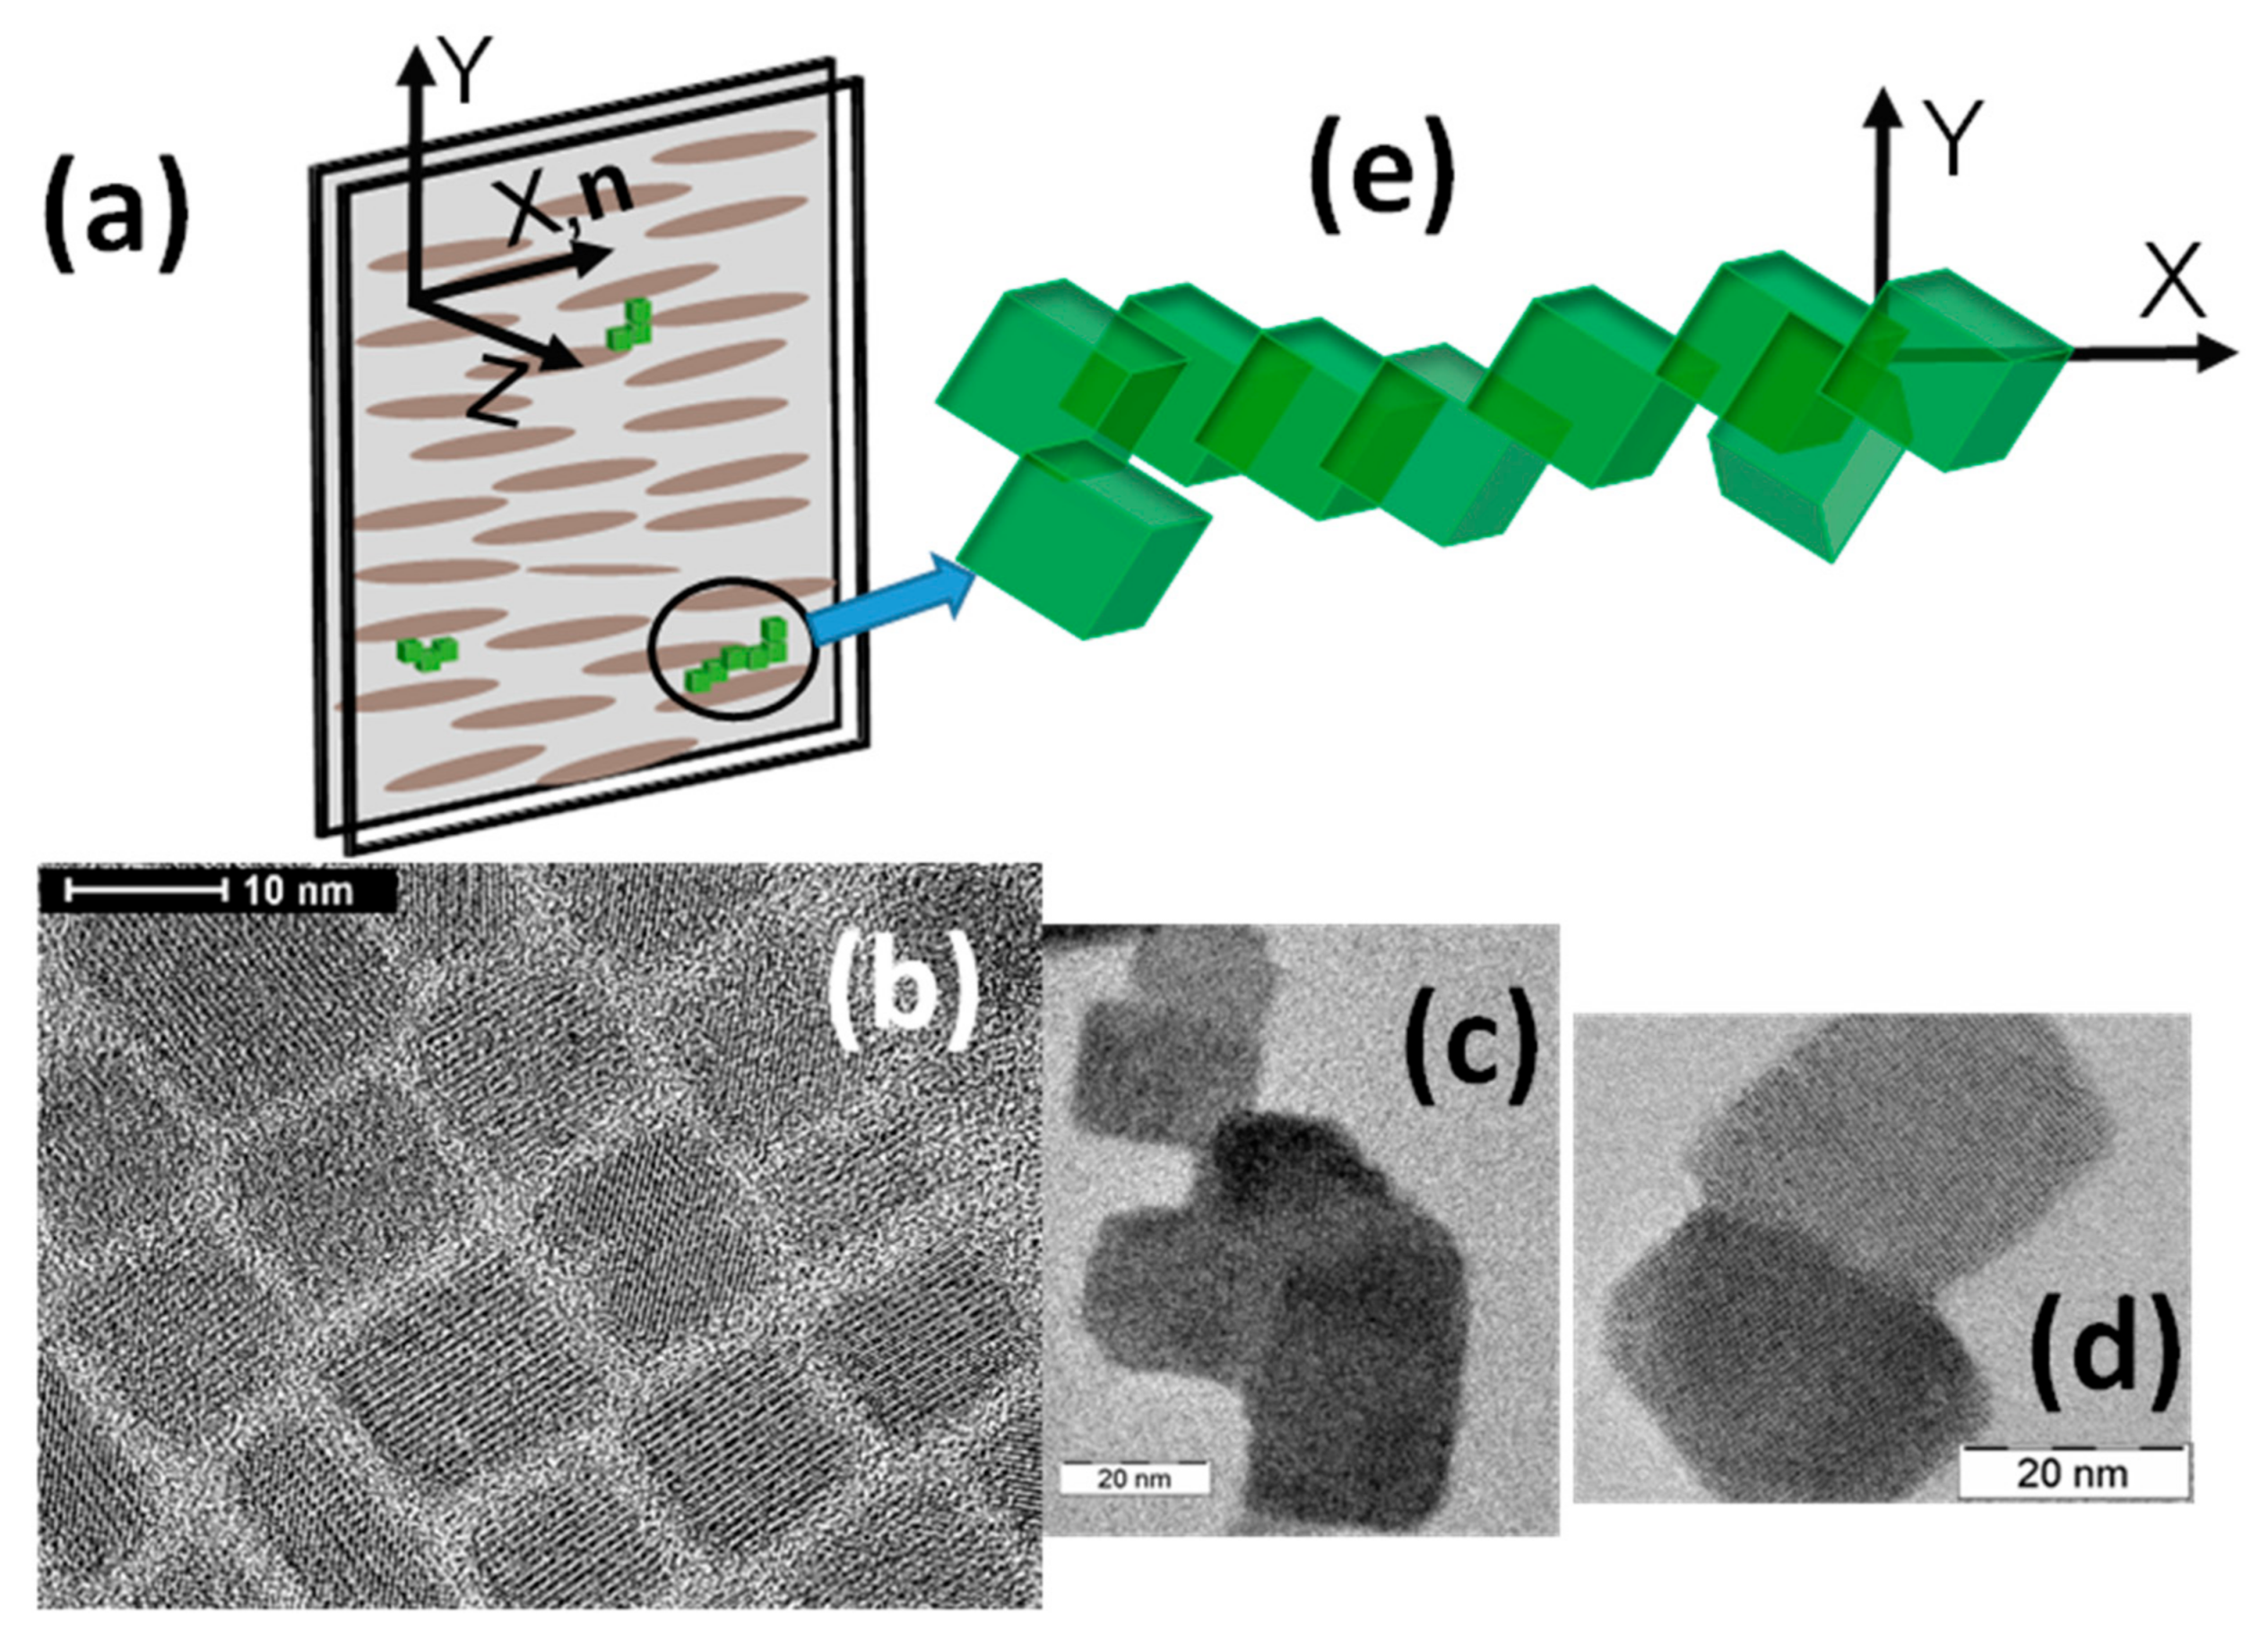
3.1. Microscopy
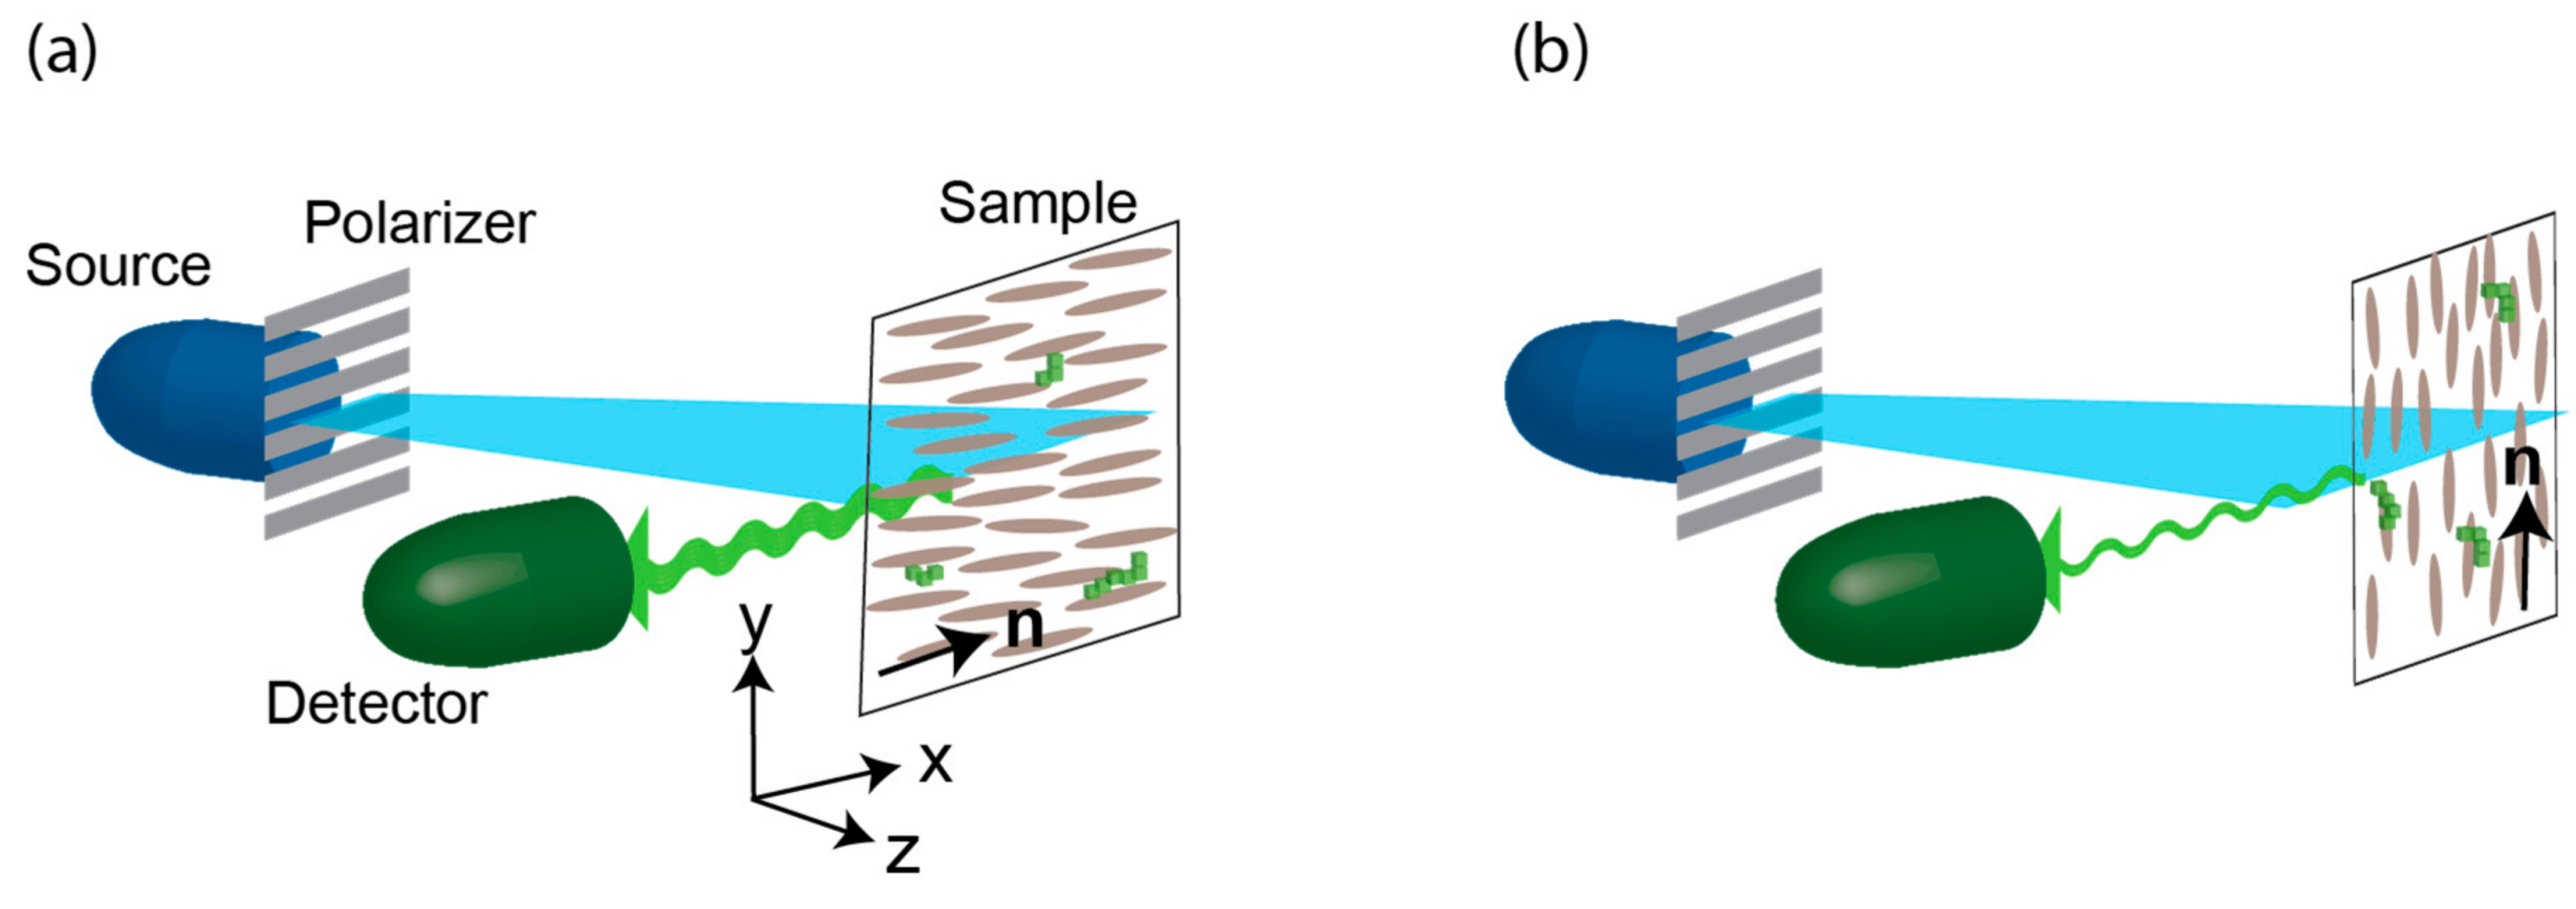
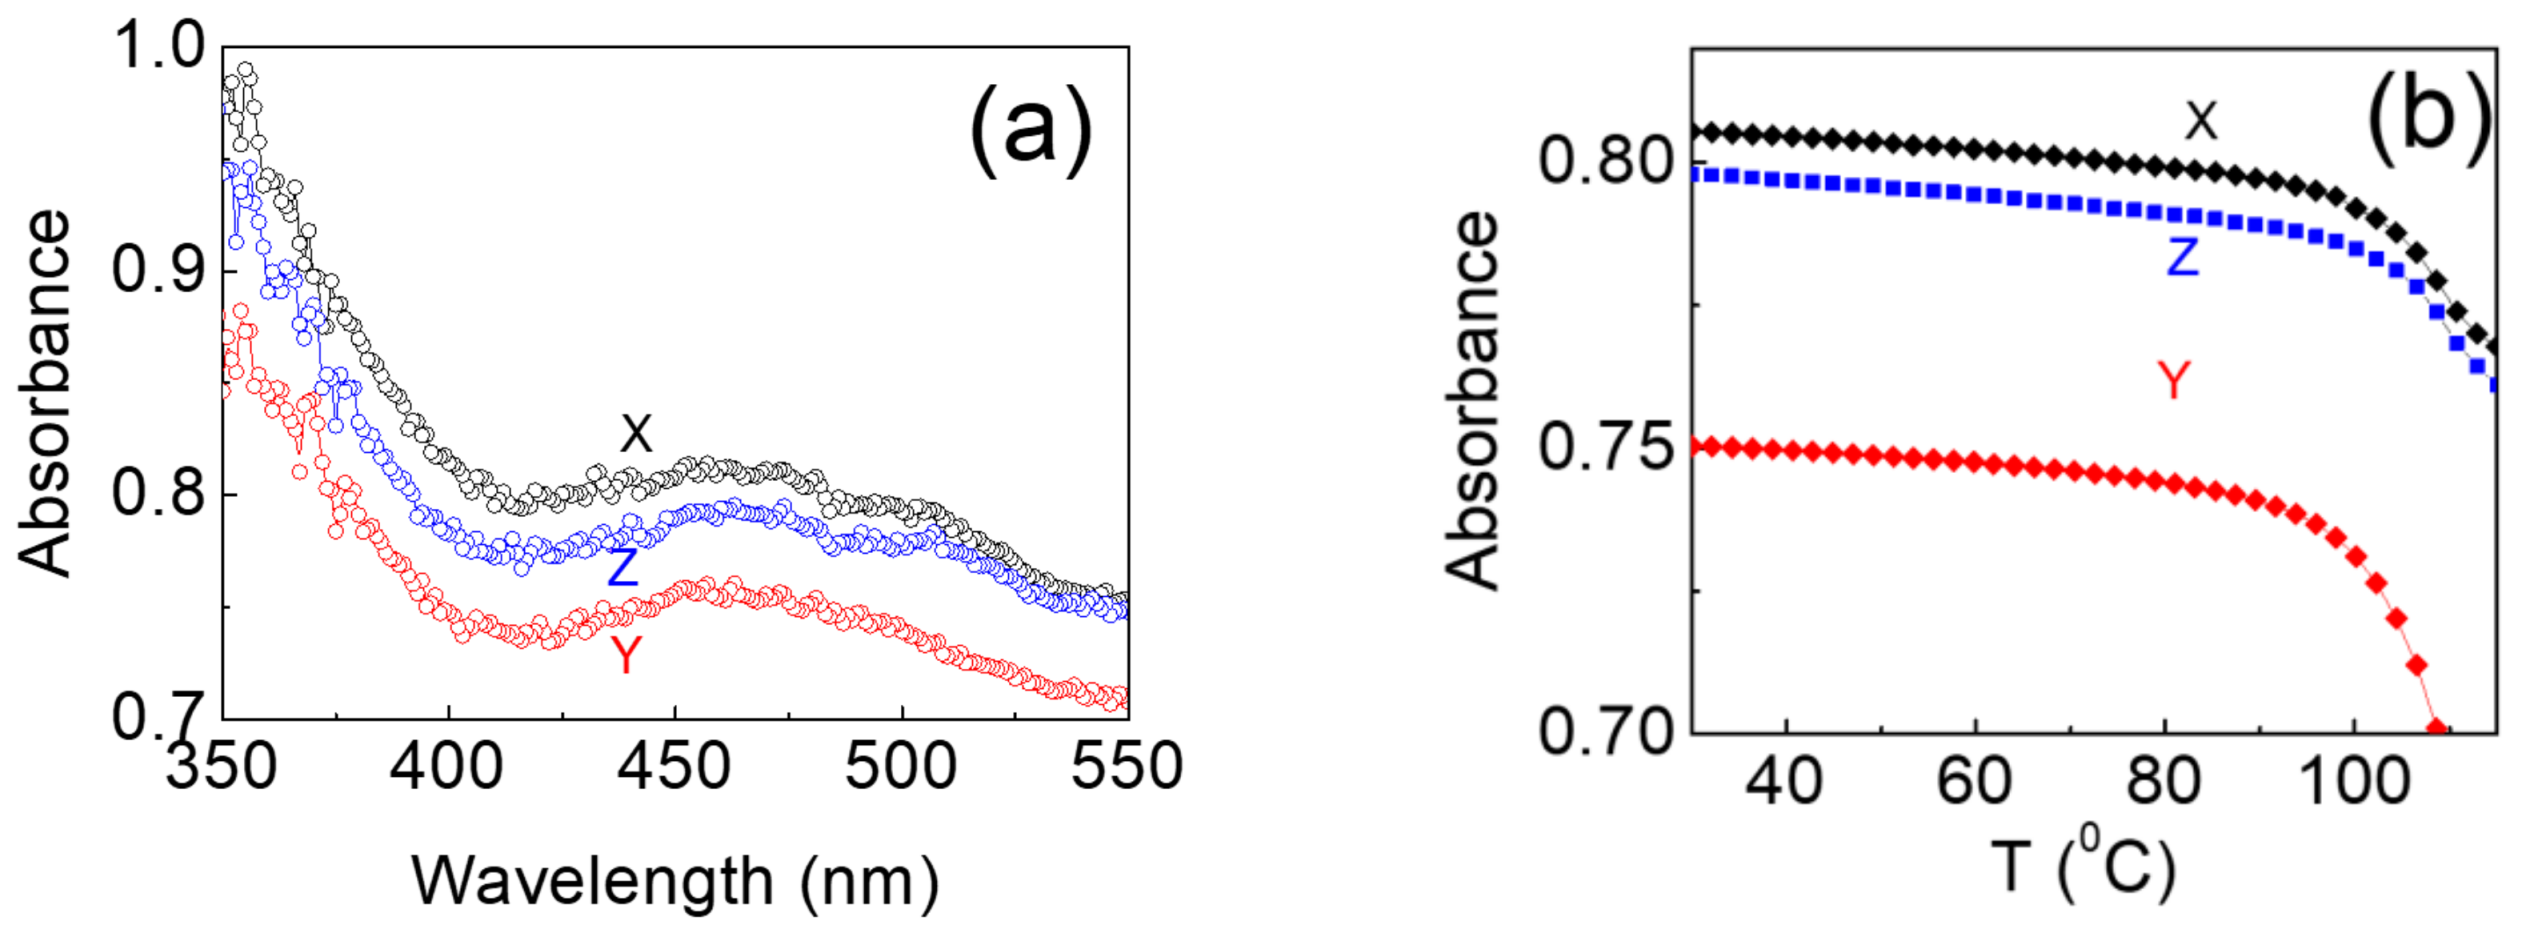
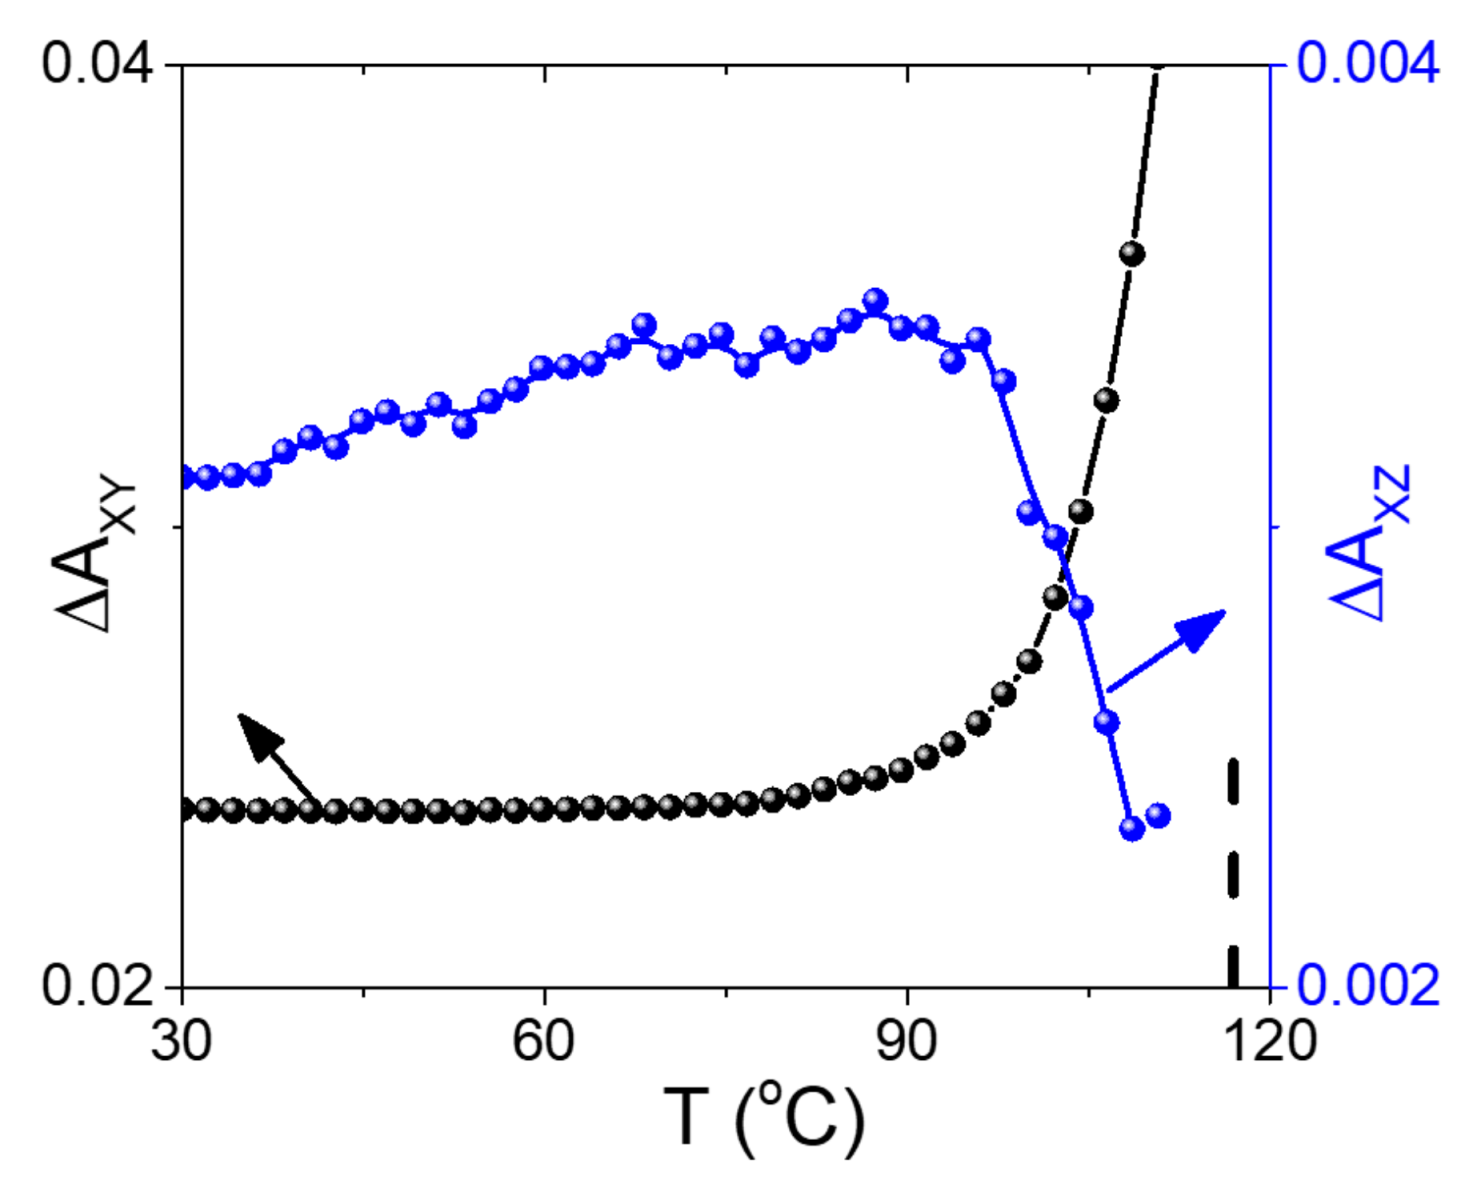
3.2. Absorption
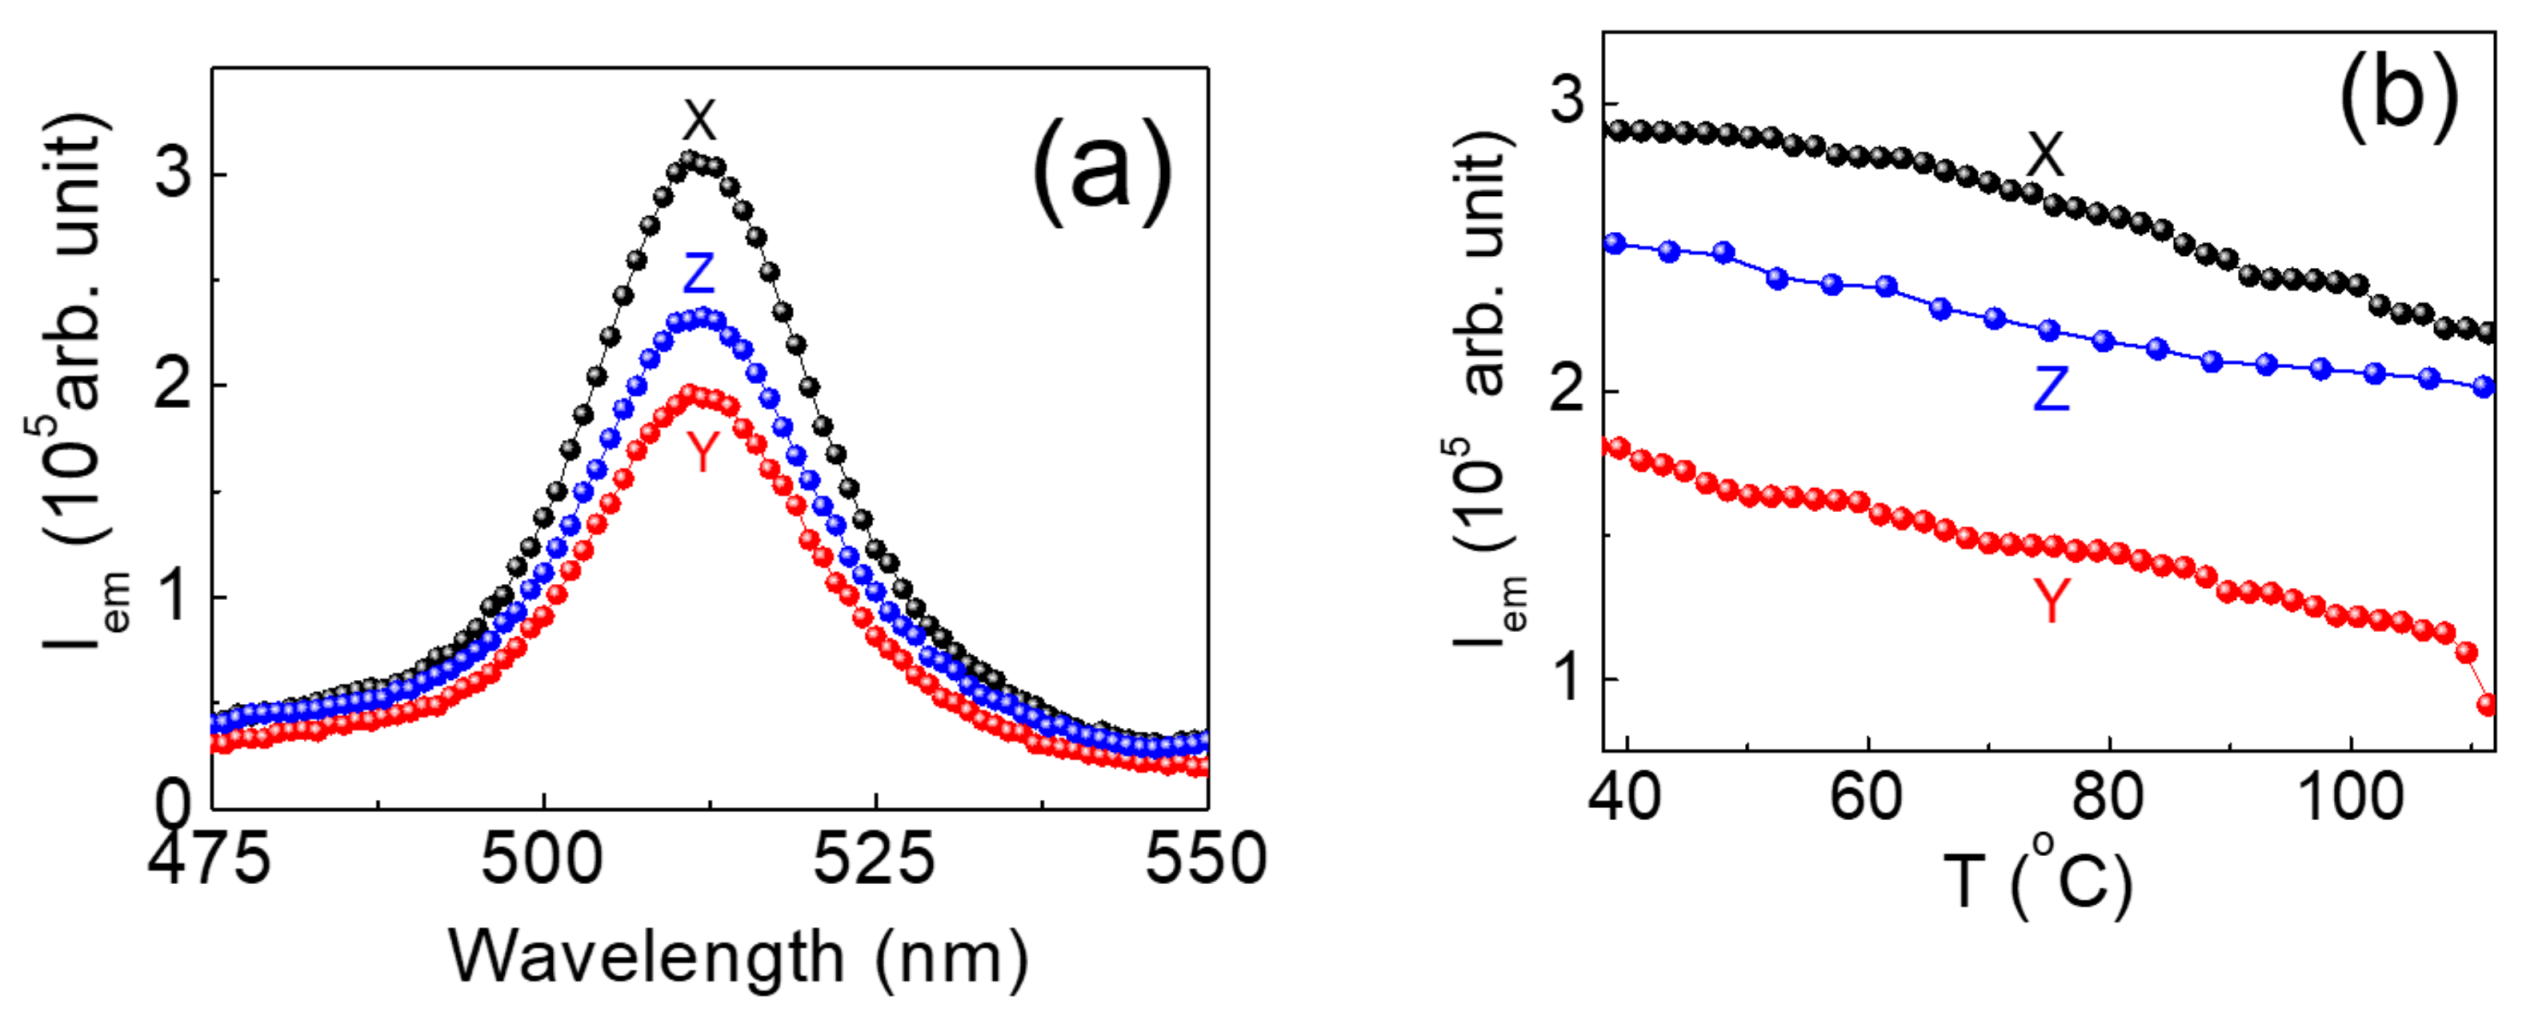
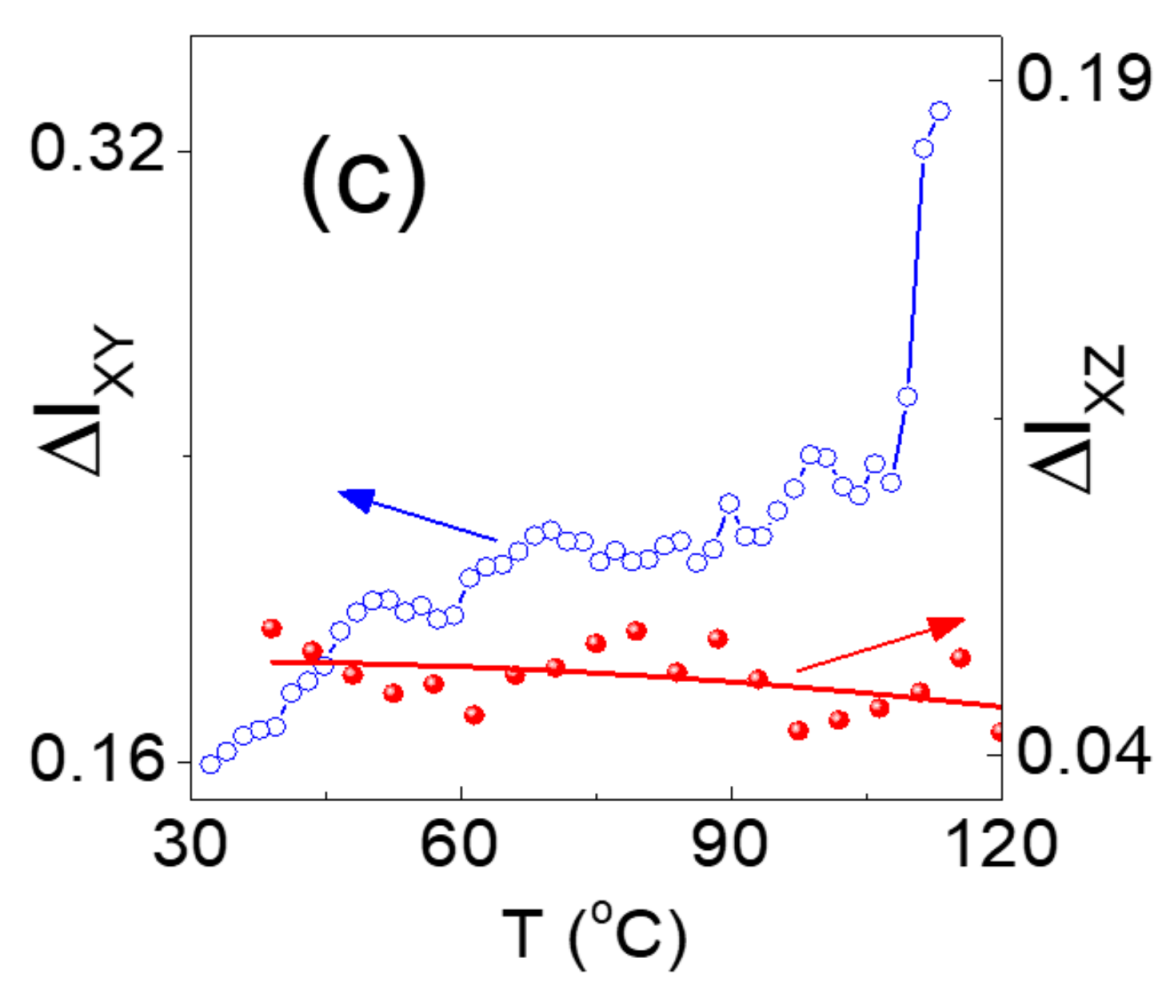
3.3. Dual Anisotropic Photoluminescence
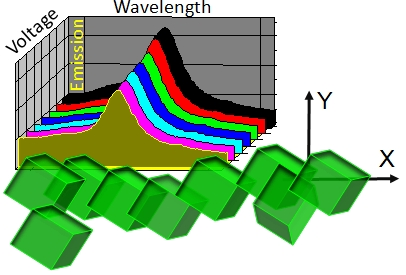
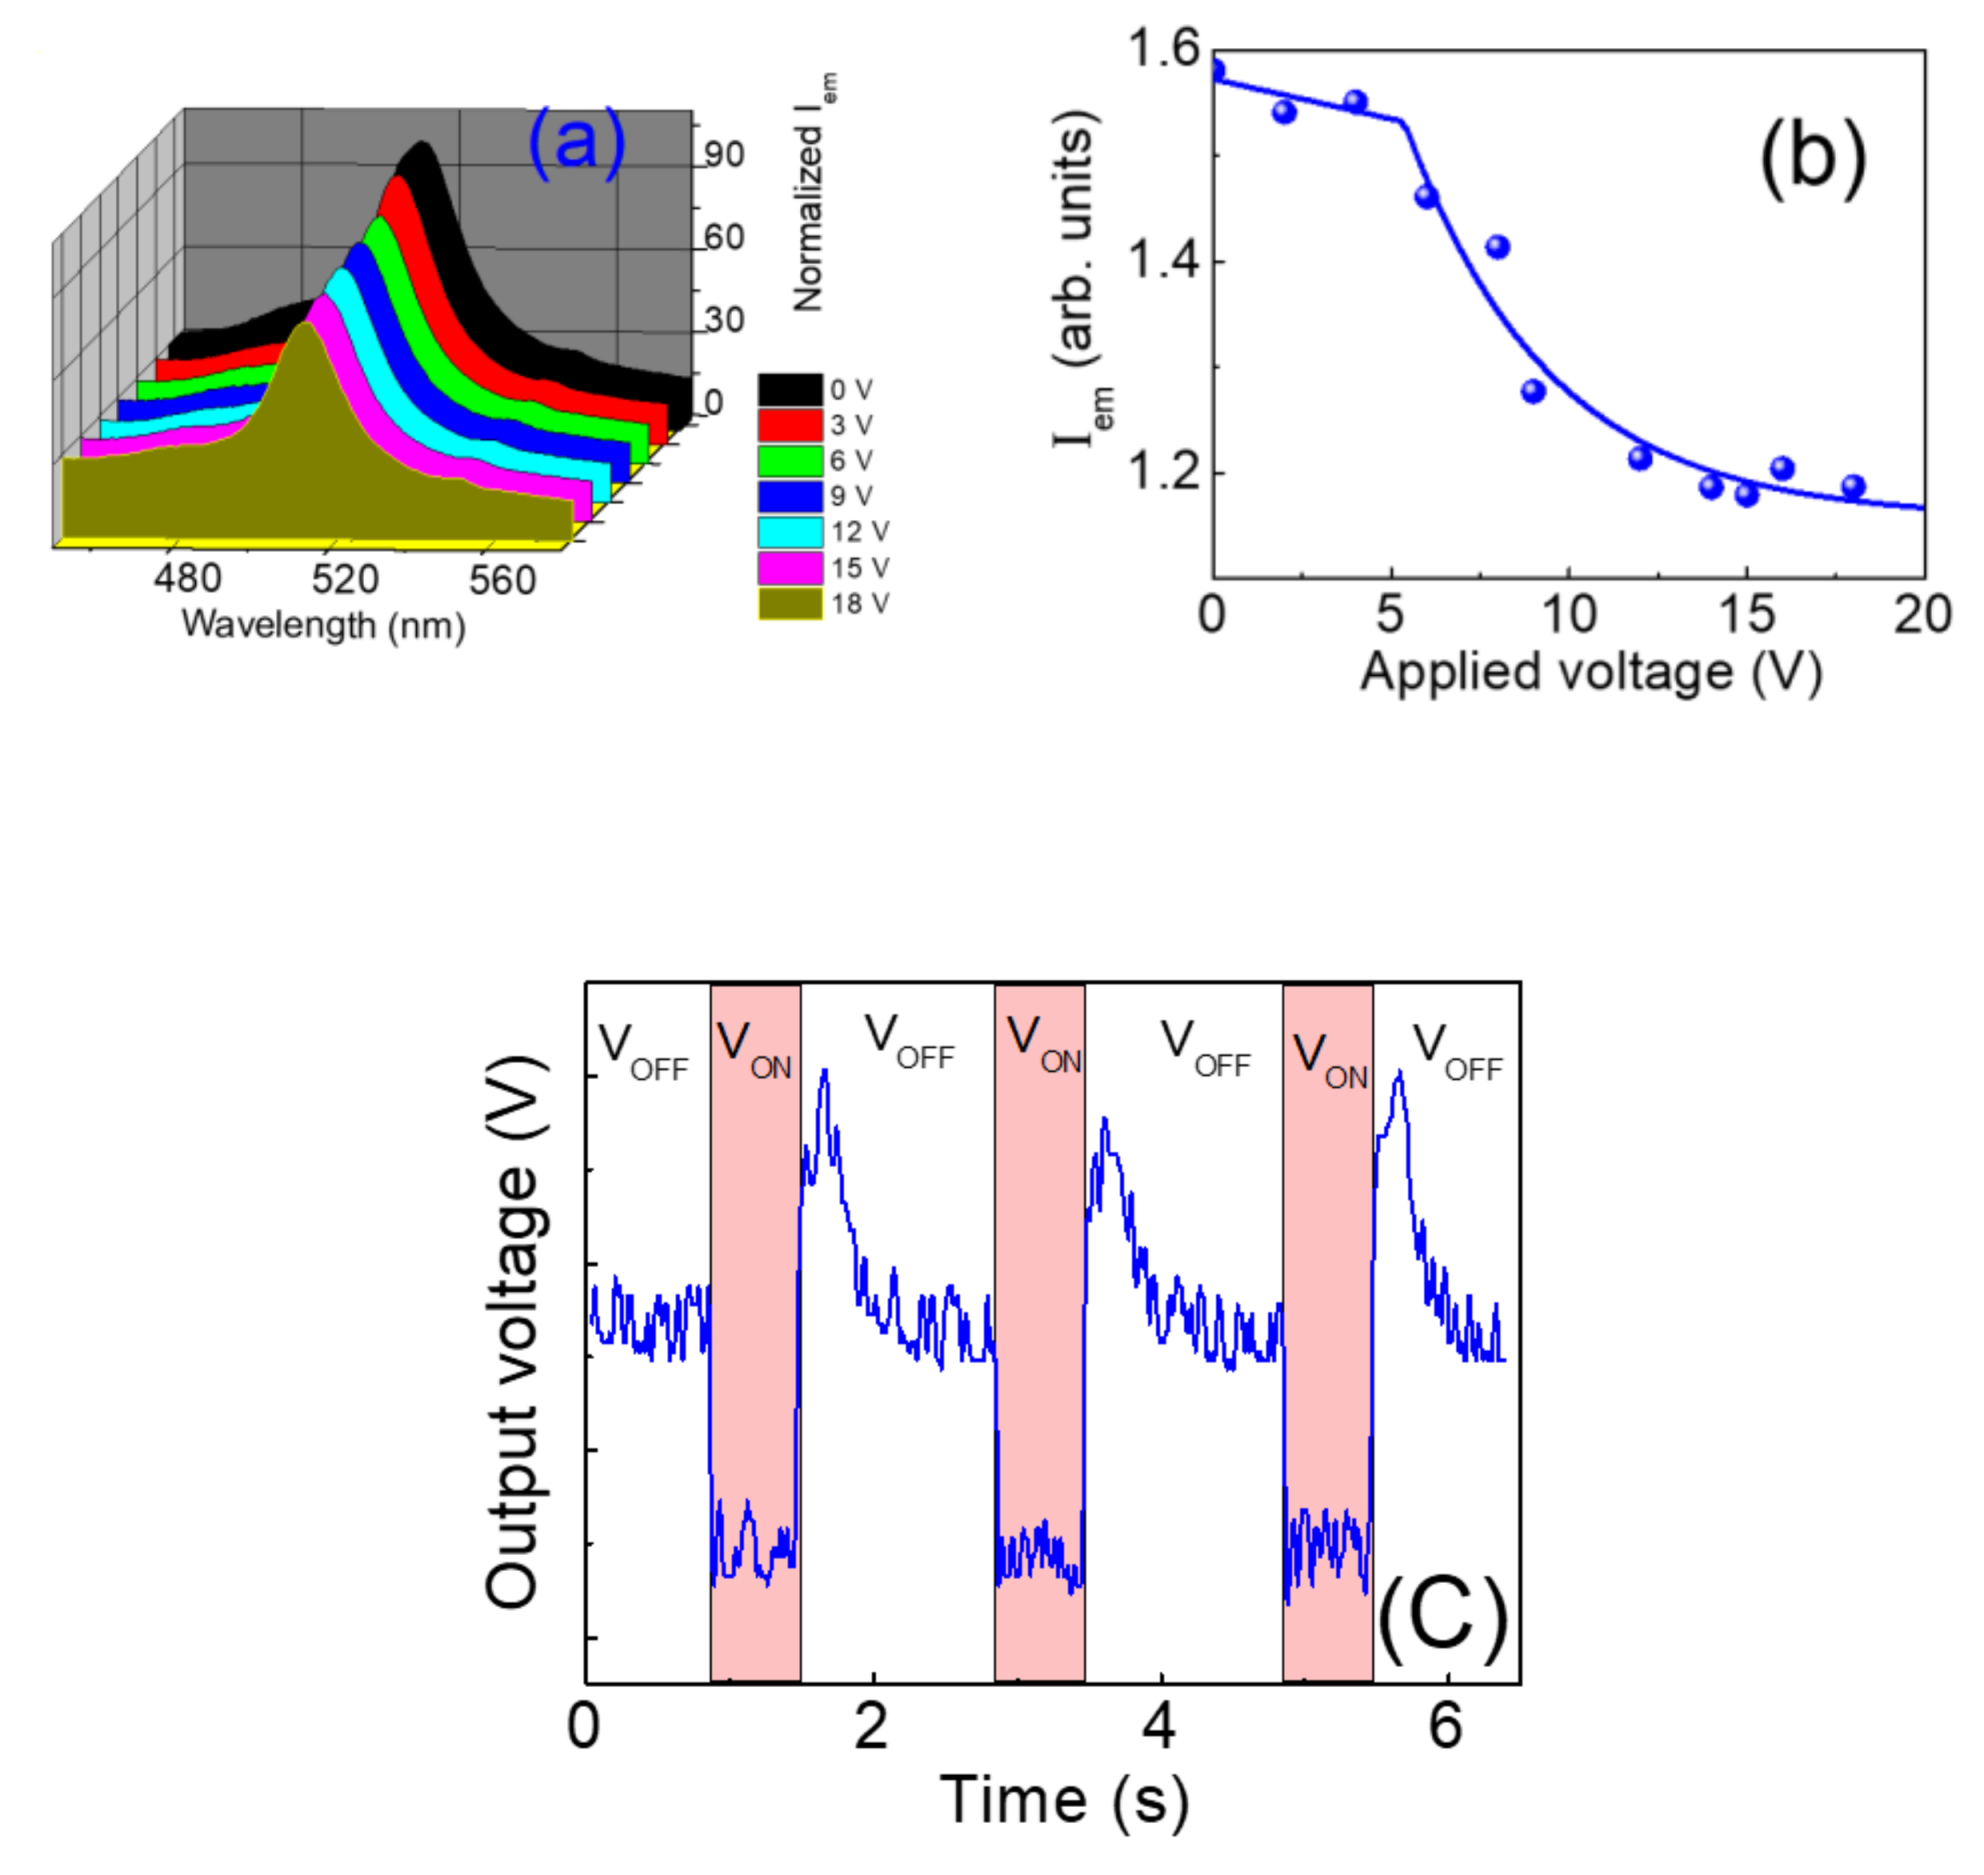
3.4. Voltage-Switchable Photoluminescence
4. Summary and Outlook
Author Contributions
Funding
Acknowledgments
Conflicts of Interest
References
- Chandrasekhar, S. Liquid Crystals, 2nd ed.; Cambridge University Press: Cambridge, UK, 1992. [Google Scholar]
- He, Z.; Gou, F.; Chen, R.; Yin, K.; Zhan, T.; Wu, S.-T. Liquid Crystal Beam Steering Devices: Principles, Recent Advances, and Future Developments. Crystal 2019, 9, 292. [Google Scholar] [CrossRef]
- Tang, X.; Zu, Z.; Shao, H.; Hu, W.; Zhou, M.; Deng, M.; Chen, W.; Zang, Z.; Zhua, T.; Xue, J. All-inorganic perovskite CsPb(Br/I)3 nanorods for optoelectronic application. Nanoscale 2016, 8, 15158–15161. [Google Scholar] [CrossRef] [PubMed]
- Chuang, C.H.; Brown, P.R.; Bulović, V.; Bawendi, M.G. Improved performance and stability in quantum dot solar cells through band alignment engineering. Nat. Mater. 2014, 13, 796–801. [Google Scholar] [CrossRef] [PubMed]
- Liu, R.-S. Phosphors, Up Conversion Nano Particles, Quantum Dots and Their Applications; Springer: Berlin/Heidelberg, Germany, 2016; Volume 1. [Google Scholar]
- Anczykowska, A.; Bartkiewicz, S.; Nyk, M.; Mysliwiec, J. Study of Semiconductor Quantum Dots Influence on Photorefractivity of Liquid Crystals. Appl. Phys. Lett. 2012, 101, 101107. [Google Scholar] [CrossRef]
- Dong, Y.; Qiao, T.; Kim, D.; Parobek, D.; Rossi, D.; Son, D.H. Precise Control of Quantum Confinement in Cesium Lead Halide Perovskite Quantum Dots via Thermodynamic Equilibrium. Nano Lett. 2018, 18, 3716–3722. [Google Scholar] [CrossRef] [PubMed]
- Li, J.; Xu, L.; Wang, T.; Song, J.; Chen, J.; Xue, J.; Dong, Y.; Cai, B.; Shan, Q.; Han, B.; et al. 50-Fold EQE Improvement up to 6.27% of Solution-Processed All-Inorganic Perovskite CsPbBr3 QLEDs via Surface Ligand Density Control. Adv. Mater. 2017, 29, 1603885. [Google Scholar] [CrossRef] [PubMed]
- Singh, G.; Fisch, M.R.; Kumar, S. Tunable Polarised Fluorescence of Quantum Dot Doped Nematic Liquid Crystals. Liq. Cryst. 2017, 44, 444–452. [Google Scholar] [CrossRef]
- Satapathy, P.; Santra, P.K.; Haque, A.; Yelamaggad, C.V.; Das, S.; Prasad, S.K. Anisotropic Fast Electrically Switchable Emission from Composites of CsPbBr3 Perovskite Quantum Cuboids in a Nematic Liquid Crystal. Adv. Opt. Mater. 2019, 7, 1801408. [Google Scholar] [CrossRef]
- Kim, Y.; Yassitepe, E.; Voznyy, O.; Comin, R.; Walters, G.; Gong, X.; Kanjanaboos, P.; Nogueira, A.F.; Sargent, E.H. Efficient Luminescence from Perovskite Quantum Dot Solids. ACS Appl. Mater. Interfaces 2015, 7, 25007–25013. [Google Scholar] [CrossRef] [PubMed]
- Hegde, G.; Nair, G.G.; Prasad, S.K.; Yelamaggad, C.V. A Photodriven Dual-Frequency Addressable Optical Device. J. Appl. Phys. 2005, 97, 93105. [Google Scholar] [CrossRef]
- Madhuri, P.L.; Rao, D.S.S.; Yelamaggad, C.V.; Achalkumar, A.S.; Prasad, S.K. Fast Photoluminescence Switching in the Nematic Phase of Calamitic–Discotic Composites. Adv. Opt. Mater. 2015, 3, 1116–1124. [Google Scholar] [CrossRef]
- Satapathy, P.; Santra, P.K.; Prasad, S.K. Mangalore University, India. Unpublished work. 2019. [Google Scholar]
- Diroll, B.T.; Koschitzky, A.; Murray, C.B. Tunable Optical Anisotropy of Seeded CdSe/CdS Nanorods. J. Phys. Chem. Lett. 2014, 5, 85–91. [Google Scholar] [CrossRef] [PubMed]
- Wang, D.; Wu, D.; Dong, D.; Chen, W.; Hao, J.; Qin, J.; Xu, B.; Wang, K.; Sun, X. Polarized Emission from CsPbX3 Perovskite Quantum Dots. Nanoscale 2016, 8, 11565–11570. [Google Scholar] [CrossRef] [PubMed]
- Eaton, S.W.; Lai, M.; Gibson, N.A.; Wong, A.B.; Dou, L.; Ma, J.; Wang, L.-W.; Leone, S.R.; Yang, P. Lasing in Robust Cesium Lead Halide Perovskite Nanowires. Proc. Natl. Acad. Sci. 2016, 113, 1993–1998. [Google Scholar] [CrossRef] [PubMed]
- Dirin, D.N.; Cherniukh, I.; Yakunin, S.; Shynkarenko, Y.; Kovalenko, M.V. Solution-Grown CsPbBr3 Perovskite Single Crystals for Photon Detection. Chem. Mater. 2016, 28, 8470–8474. [Google Scholar] [CrossRef] [PubMed]
- Cunningham, P.D.; Boercker, J.E.; Placencia, D.; Tischler, J.G. Anisotropic Absorption in PbSe Nanorods. ACS Nano 2014, 8, 581–590. [Google Scholar] [CrossRef]
- Dasallas, L.L.; Jaculbia, R.B.; Balois, M.V.; Garcia, W.O.; Hayazawa, N. Position, Orientation, and Relative Quantum Yield Ratio Determination of Fluorescent Nanoemitters via Combined Laser Scanning Microscopy and Polarization Measurements. Opt. Mater. Express 2018, 8, 1290–1304. [Google Scholar] [CrossRef]
- Diroll, B.T.; Dadosh, T.; Koschitzky, A.; Goldman, Y.E.; Murray, C.B. Interpreting the Energy-Dependent Anisotropy of Colloidal Nanorods Using Ensemble and Single-Particle Spectroscopy. J. Phys. Chem. C 2013, 117, 23928–23937. [Google Scholar] [CrossRef]
- Baral, M.; Prasad, S.K.; Patel, H.; Achalkumar, A.S.; Yelamaggad, C.V. Giant enhancement of photoluminescence and tertiary emission in a chiral nematic by matching photonic band gap and excitation wavelength. J. Mol. Liq. 2018, 262, 354–362. [Google Scholar] [CrossRef]
- Prasad, S. K, Photostimulated and photo suppressed phase transitions in liquid crystals. Angew. Chem. Int. Ed. 2012, 51, 10708. [Google Scholar] [CrossRef] [PubMed]
- Smart Light-Responsive Materials: Azobenzene-Containing Polymers and Liquid Crystals. Zhao, Y.; Ikeda, T. (Eds.) John Wiley & Sons: Hoboken, NJ, USA, 2009. [Google Scholar]


© 2019 by the authors. Licensee MDPI, Basel, Switzerland. This article is an open access article distributed under the terms and conditions of the Creative Commons Attribution (CC BY) license (http://creativecommons.org/licenses/by/4.0/).
Share and Cite
Satapathy, P.; Santra, P.K.; Prasad, S.K. Synergistic Path for Dual Anisotropic and Electrically Switchable Emission From a Nanocomposite of CsPbBr3 Quantum Cuboids and Nematic Liquid Crystal. Crystals 2019, 9, 378. https://doi.org/10.3390/cryst9080378
Satapathy P, Santra PK, Prasad SK. Synergistic Path for Dual Anisotropic and Electrically Switchable Emission From a Nanocomposite of CsPbBr3 Quantum Cuboids and Nematic Liquid Crystal. Crystals. 2019; 9(8):378. https://doi.org/10.3390/cryst9080378
Chicago/Turabian StyleSatapathy, Pragnya, Pralay K. Santra, and S. Krishna Prasad. 2019. "Synergistic Path for Dual Anisotropic and Electrically Switchable Emission From a Nanocomposite of CsPbBr3 Quantum Cuboids and Nematic Liquid Crystal" Crystals 9, no. 8: 378. https://doi.org/10.3390/cryst9080378
APA StyleSatapathy, P., Santra, P. K., & Prasad, S. K. (2019). Synergistic Path for Dual Anisotropic and Electrically Switchable Emission From a Nanocomposite of CsPbBr3 Quantum Cuboids and Nematic Liquid Crystal. Crystals, 9(8), 378. https://doi.org/10.3390/cryst9080378