The Potential Application of MnZn Ferrite Nanofluids for Wettability Alteration and Oil-Water Interfacial Tension Reduction


Abstract
:1. Introduction
2. Materials and Methods
2.1. Materials
2.2. Nanoparticles Synthesis
2.3. XRD, FESEM & VSM Characterizations
2.4. Nanofluids Preparation
2.5. Interfacial Tension, Contact Angle and Viscosity Measurements
3. Results
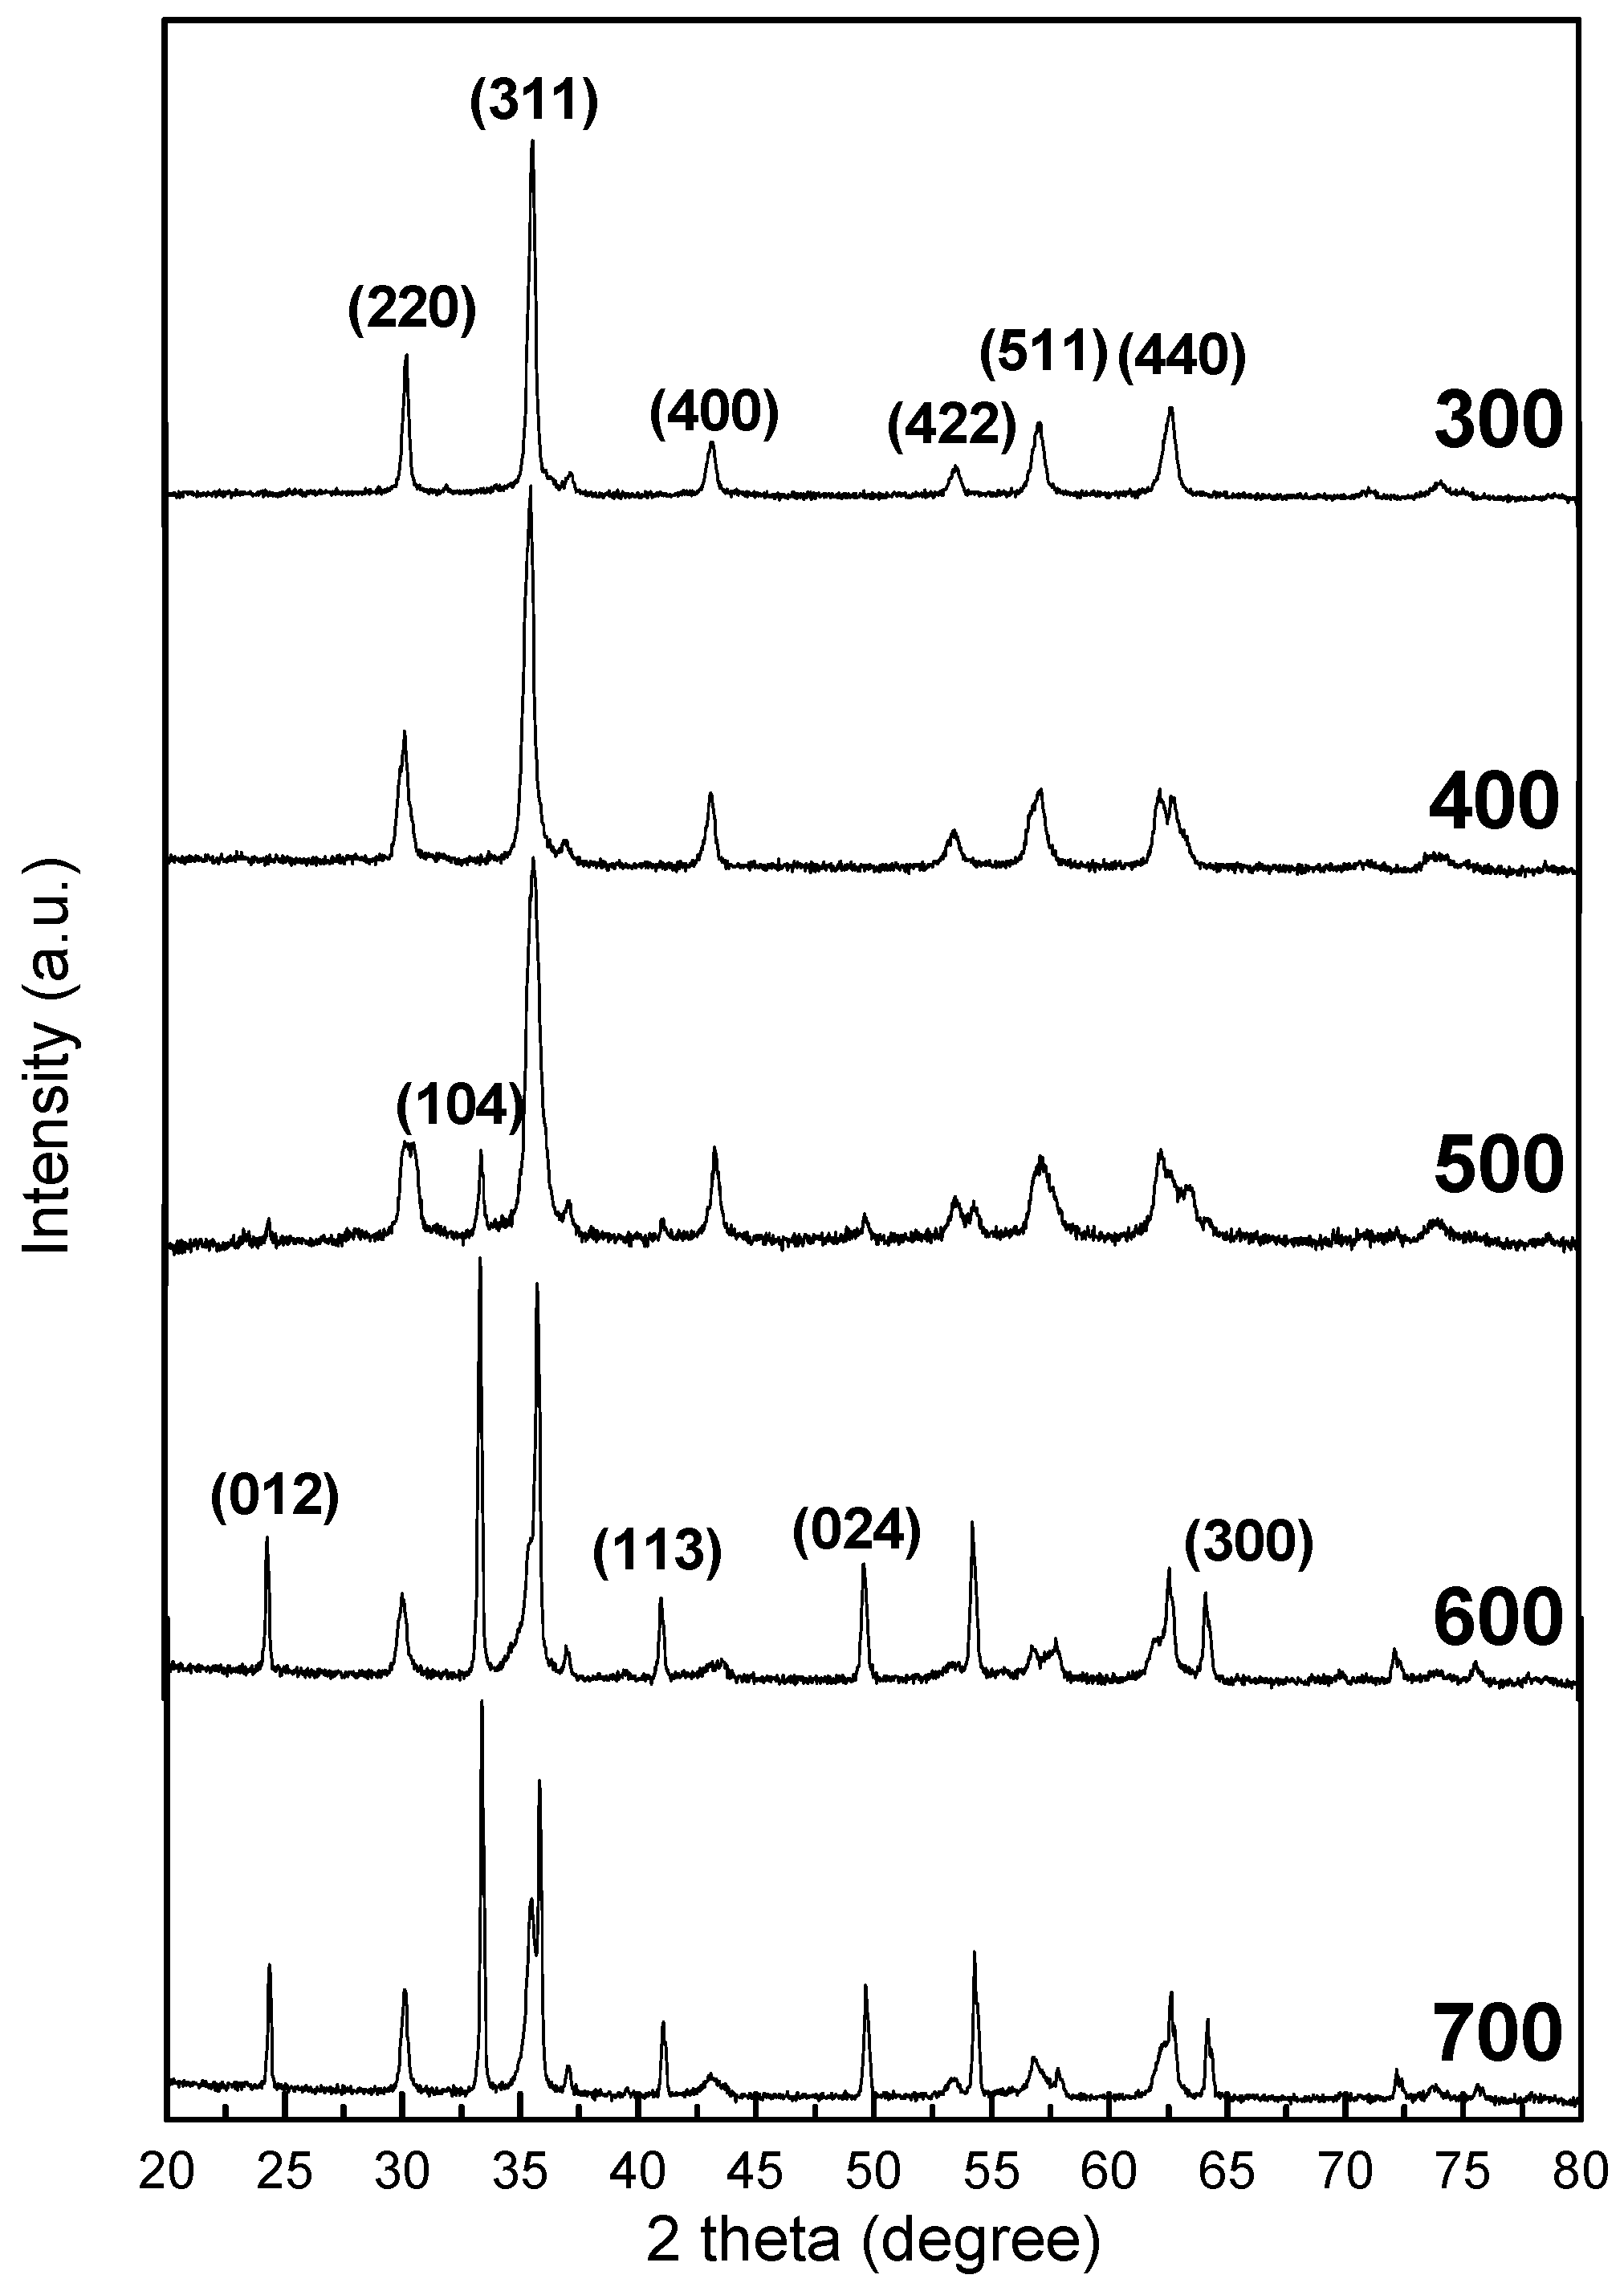
3.1. XRD Analysis
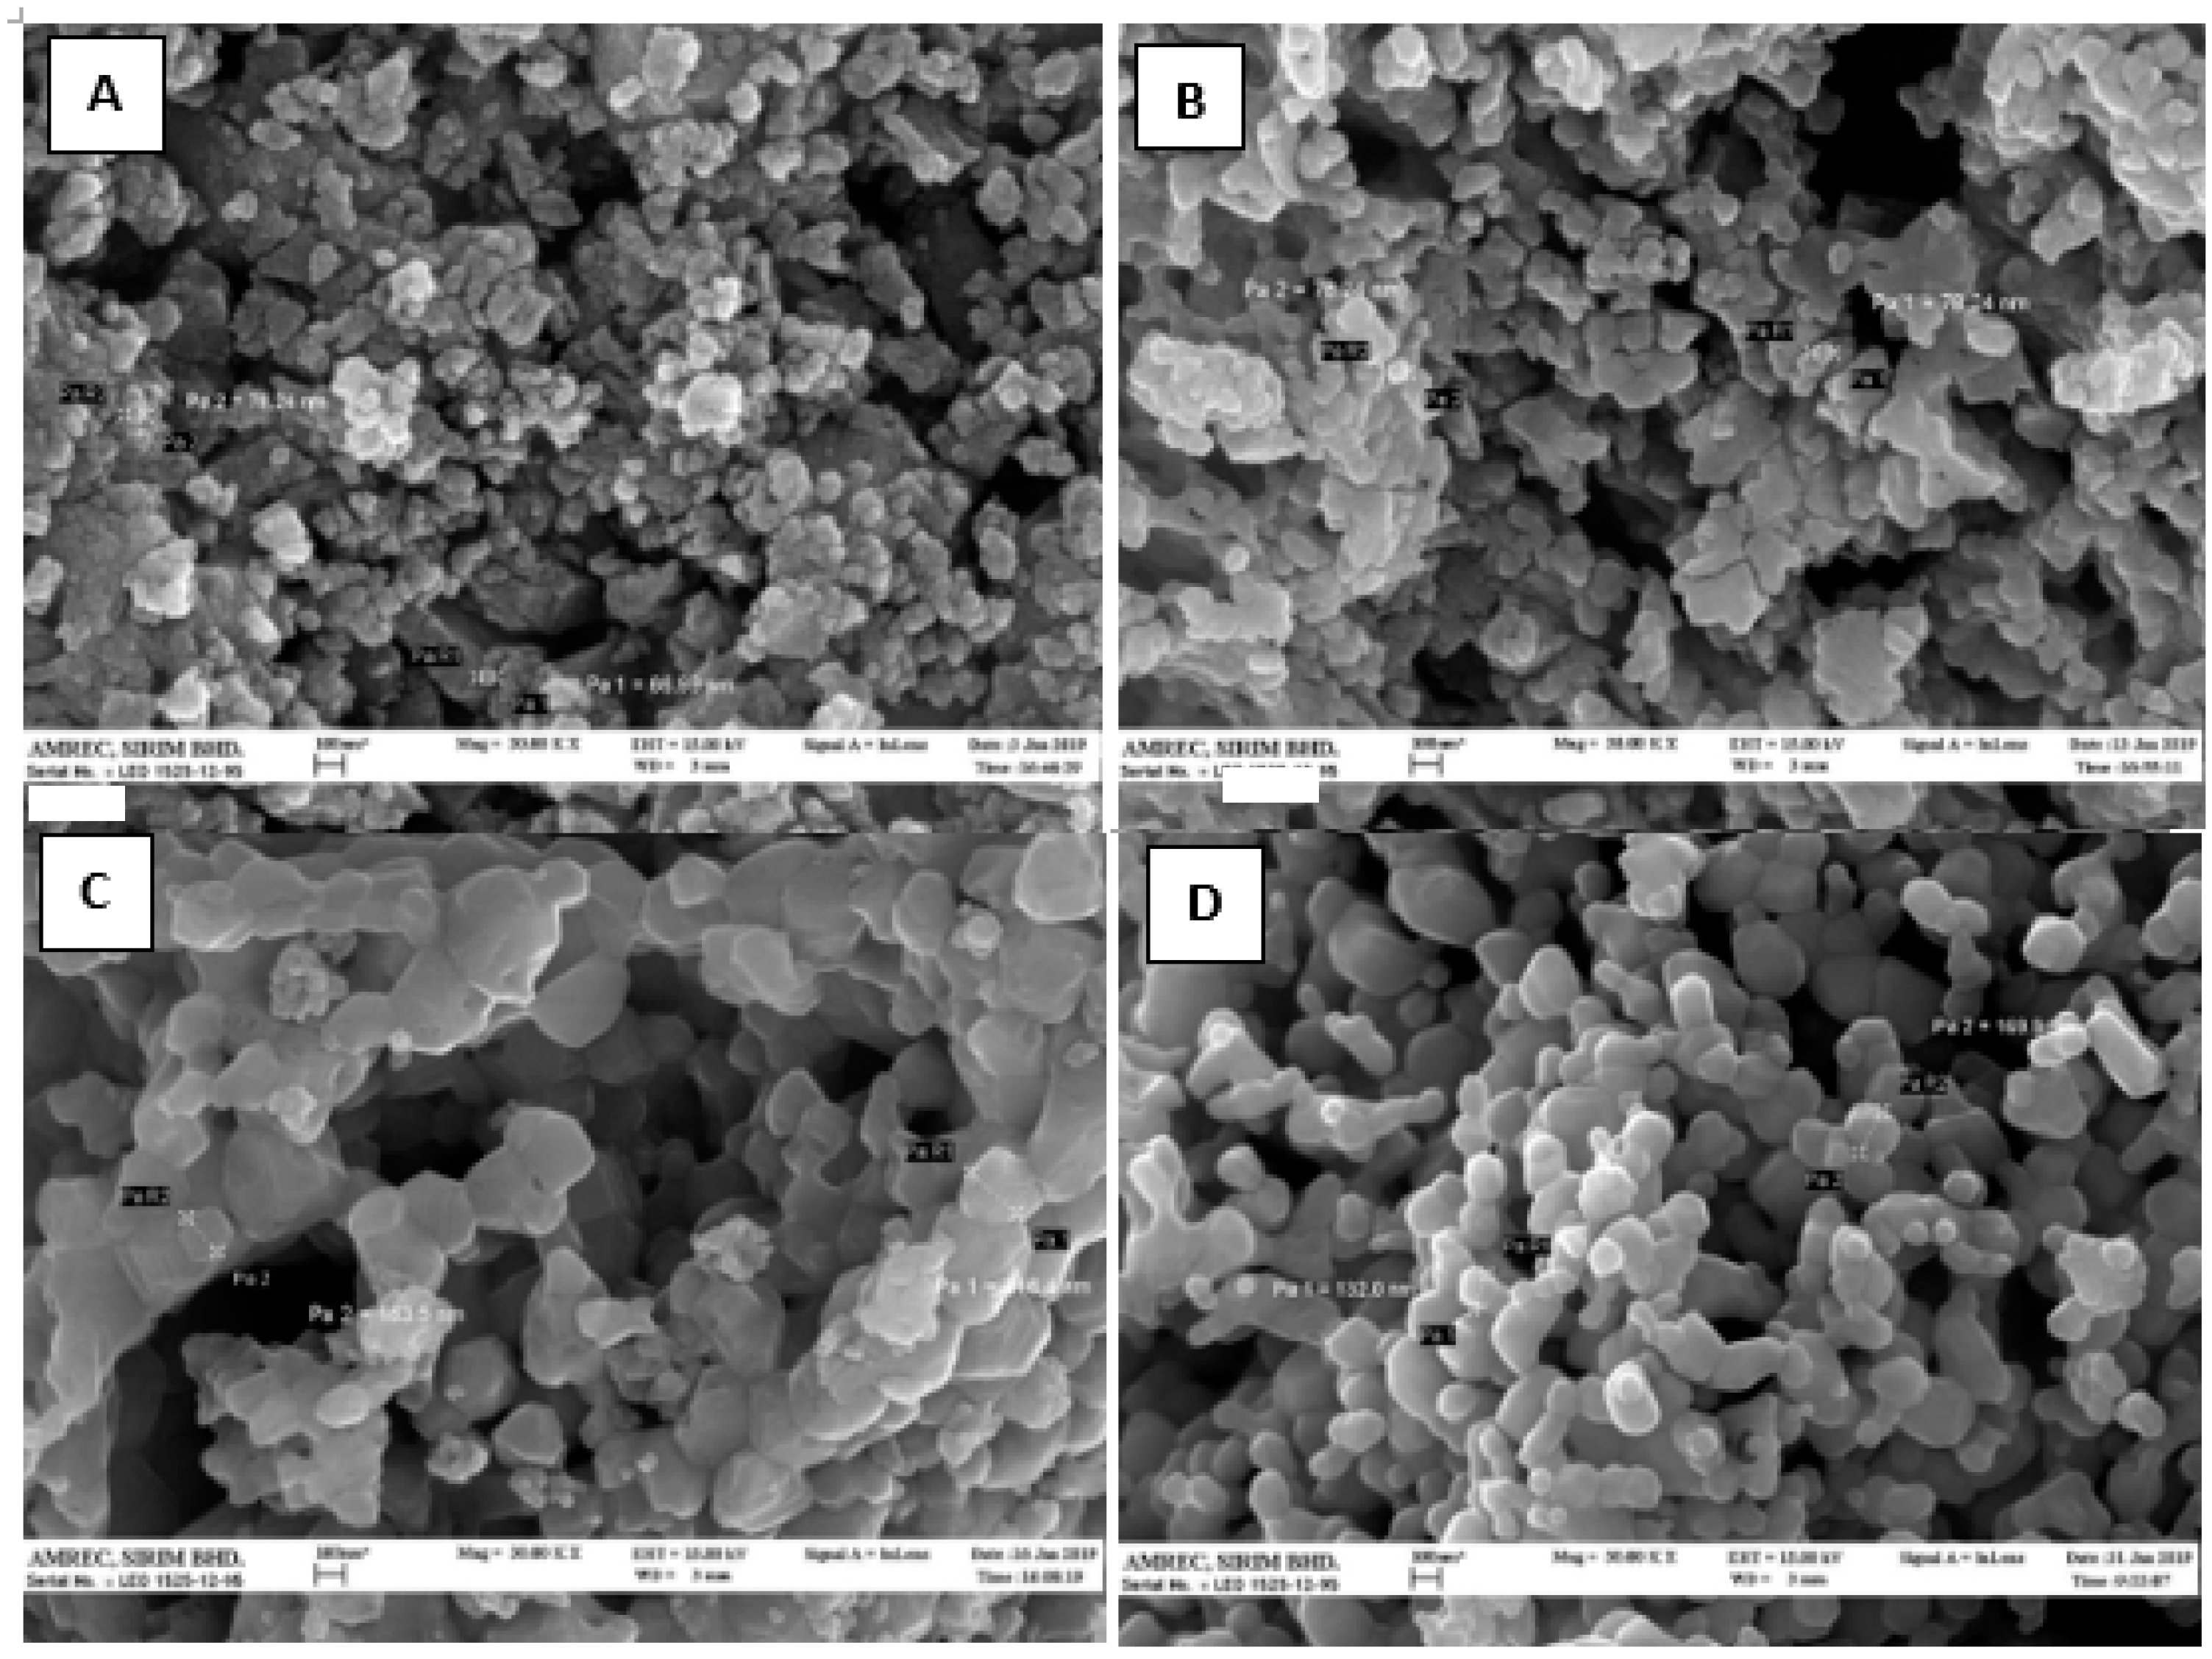
3.2. FESEM Analysis
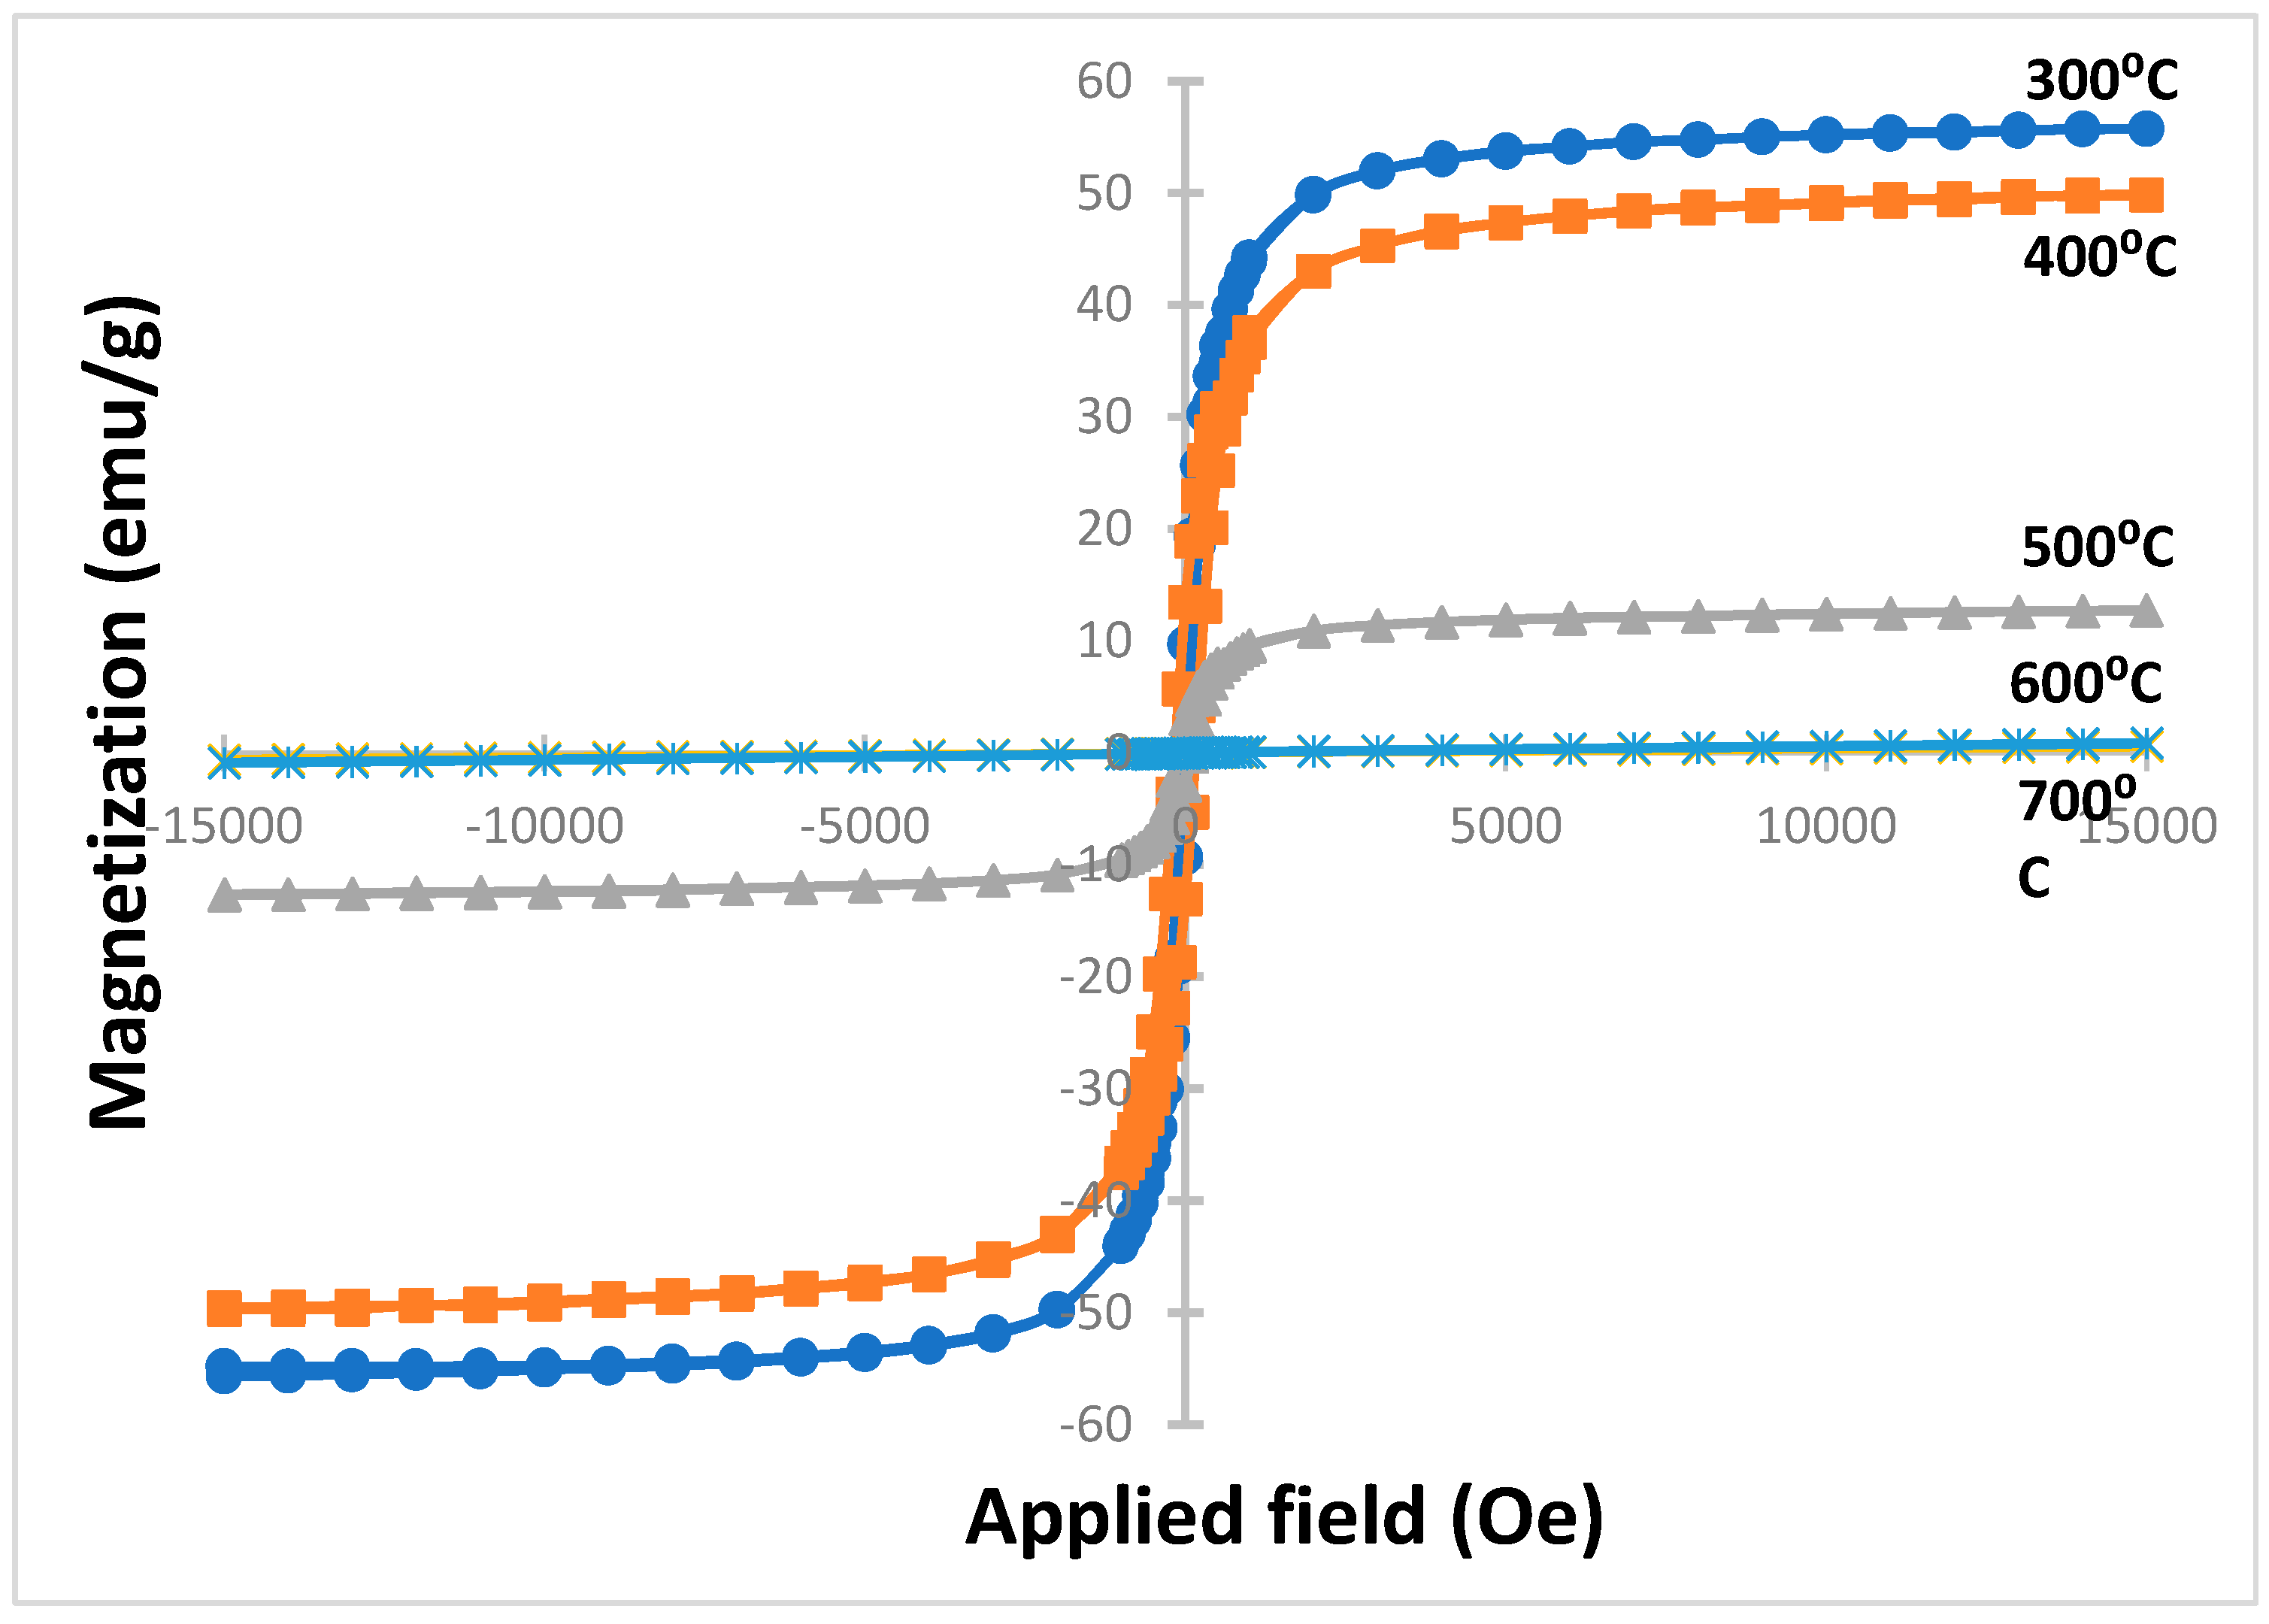
3.3. VSM Analysis
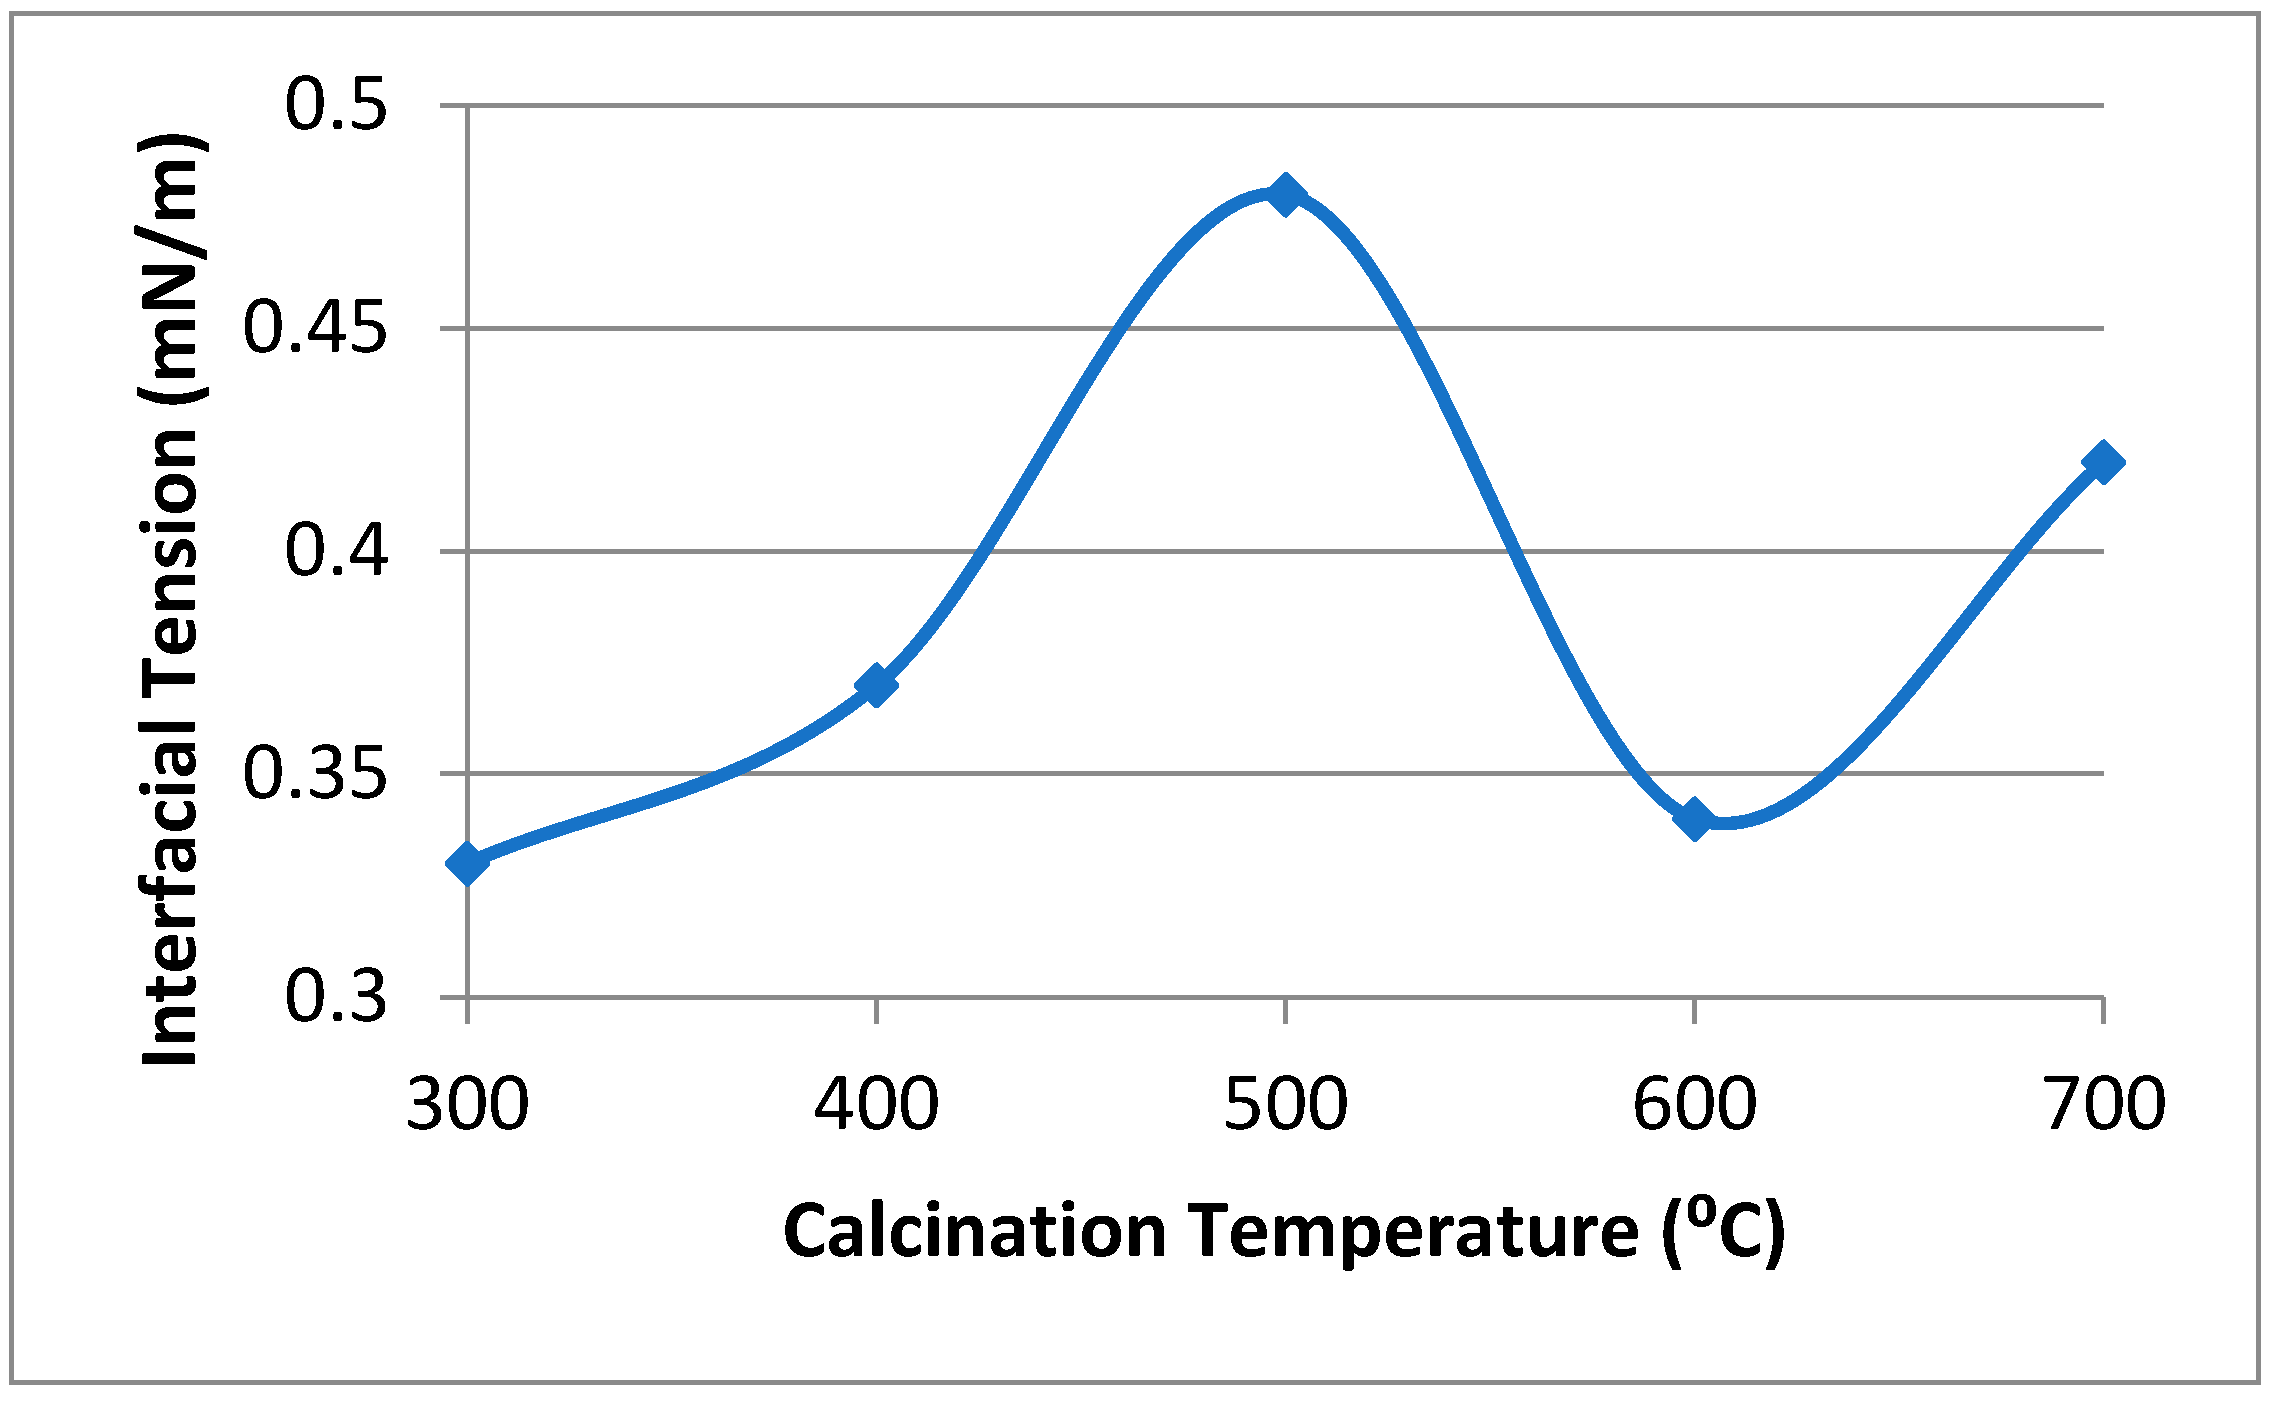
3.4. IFT Analysis
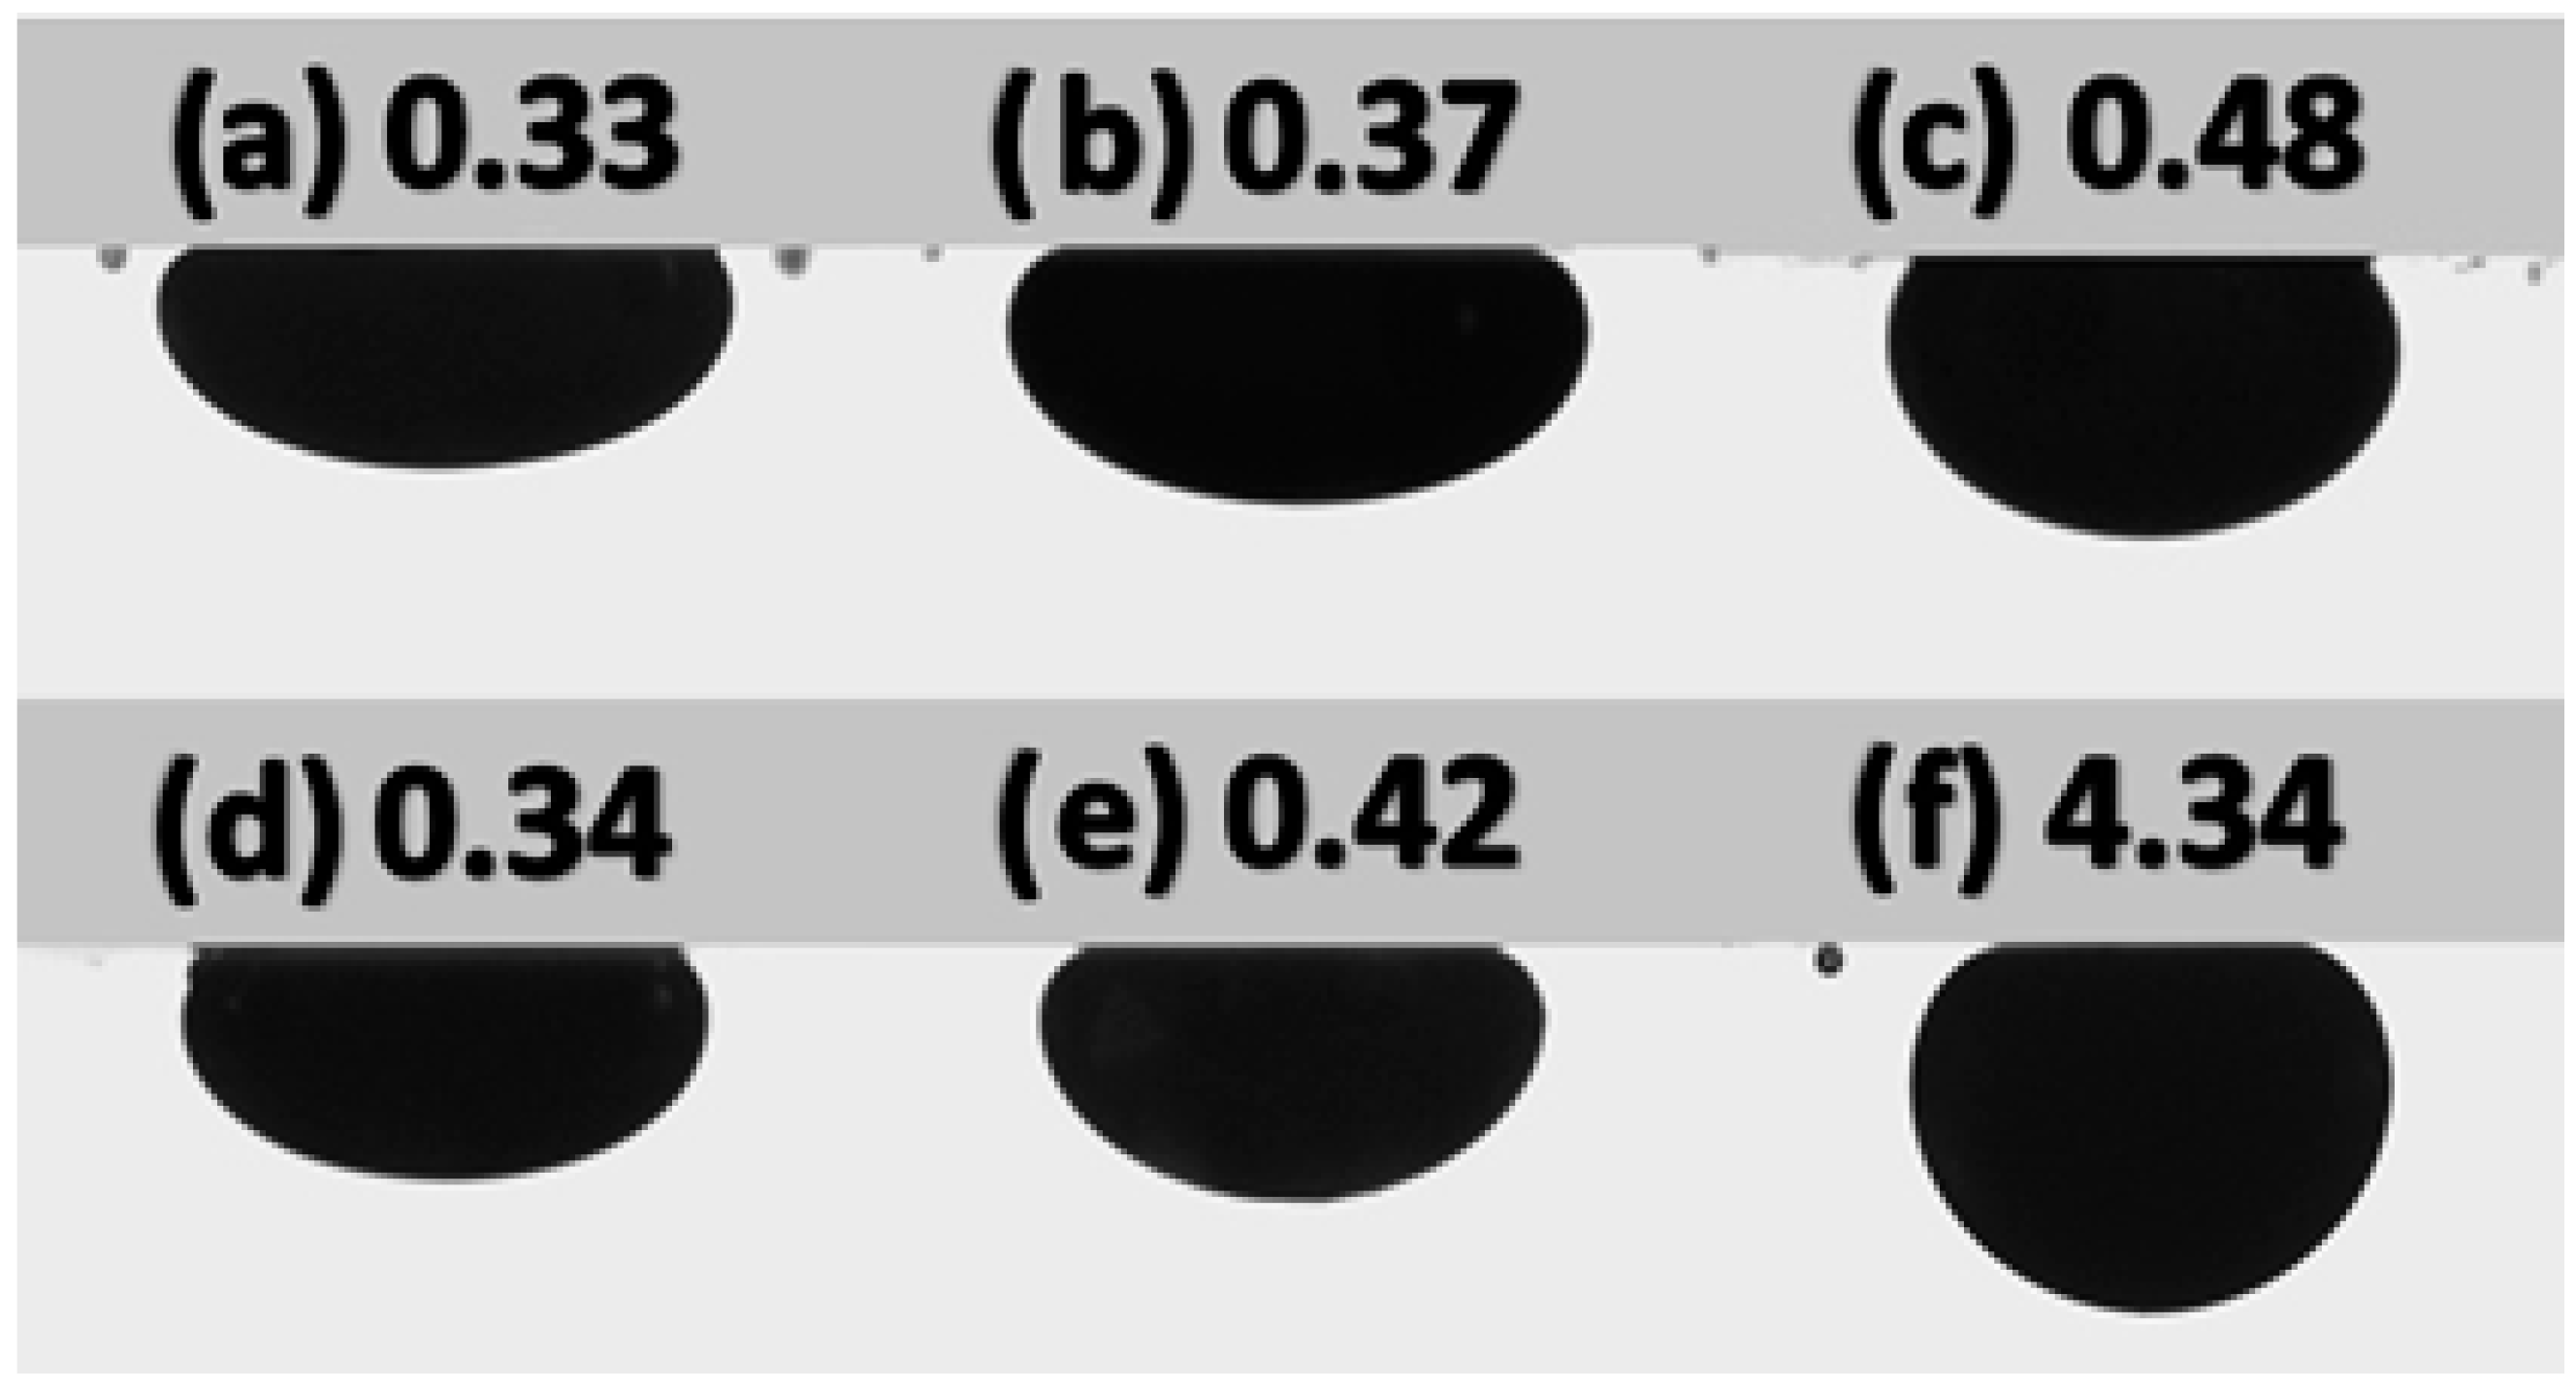
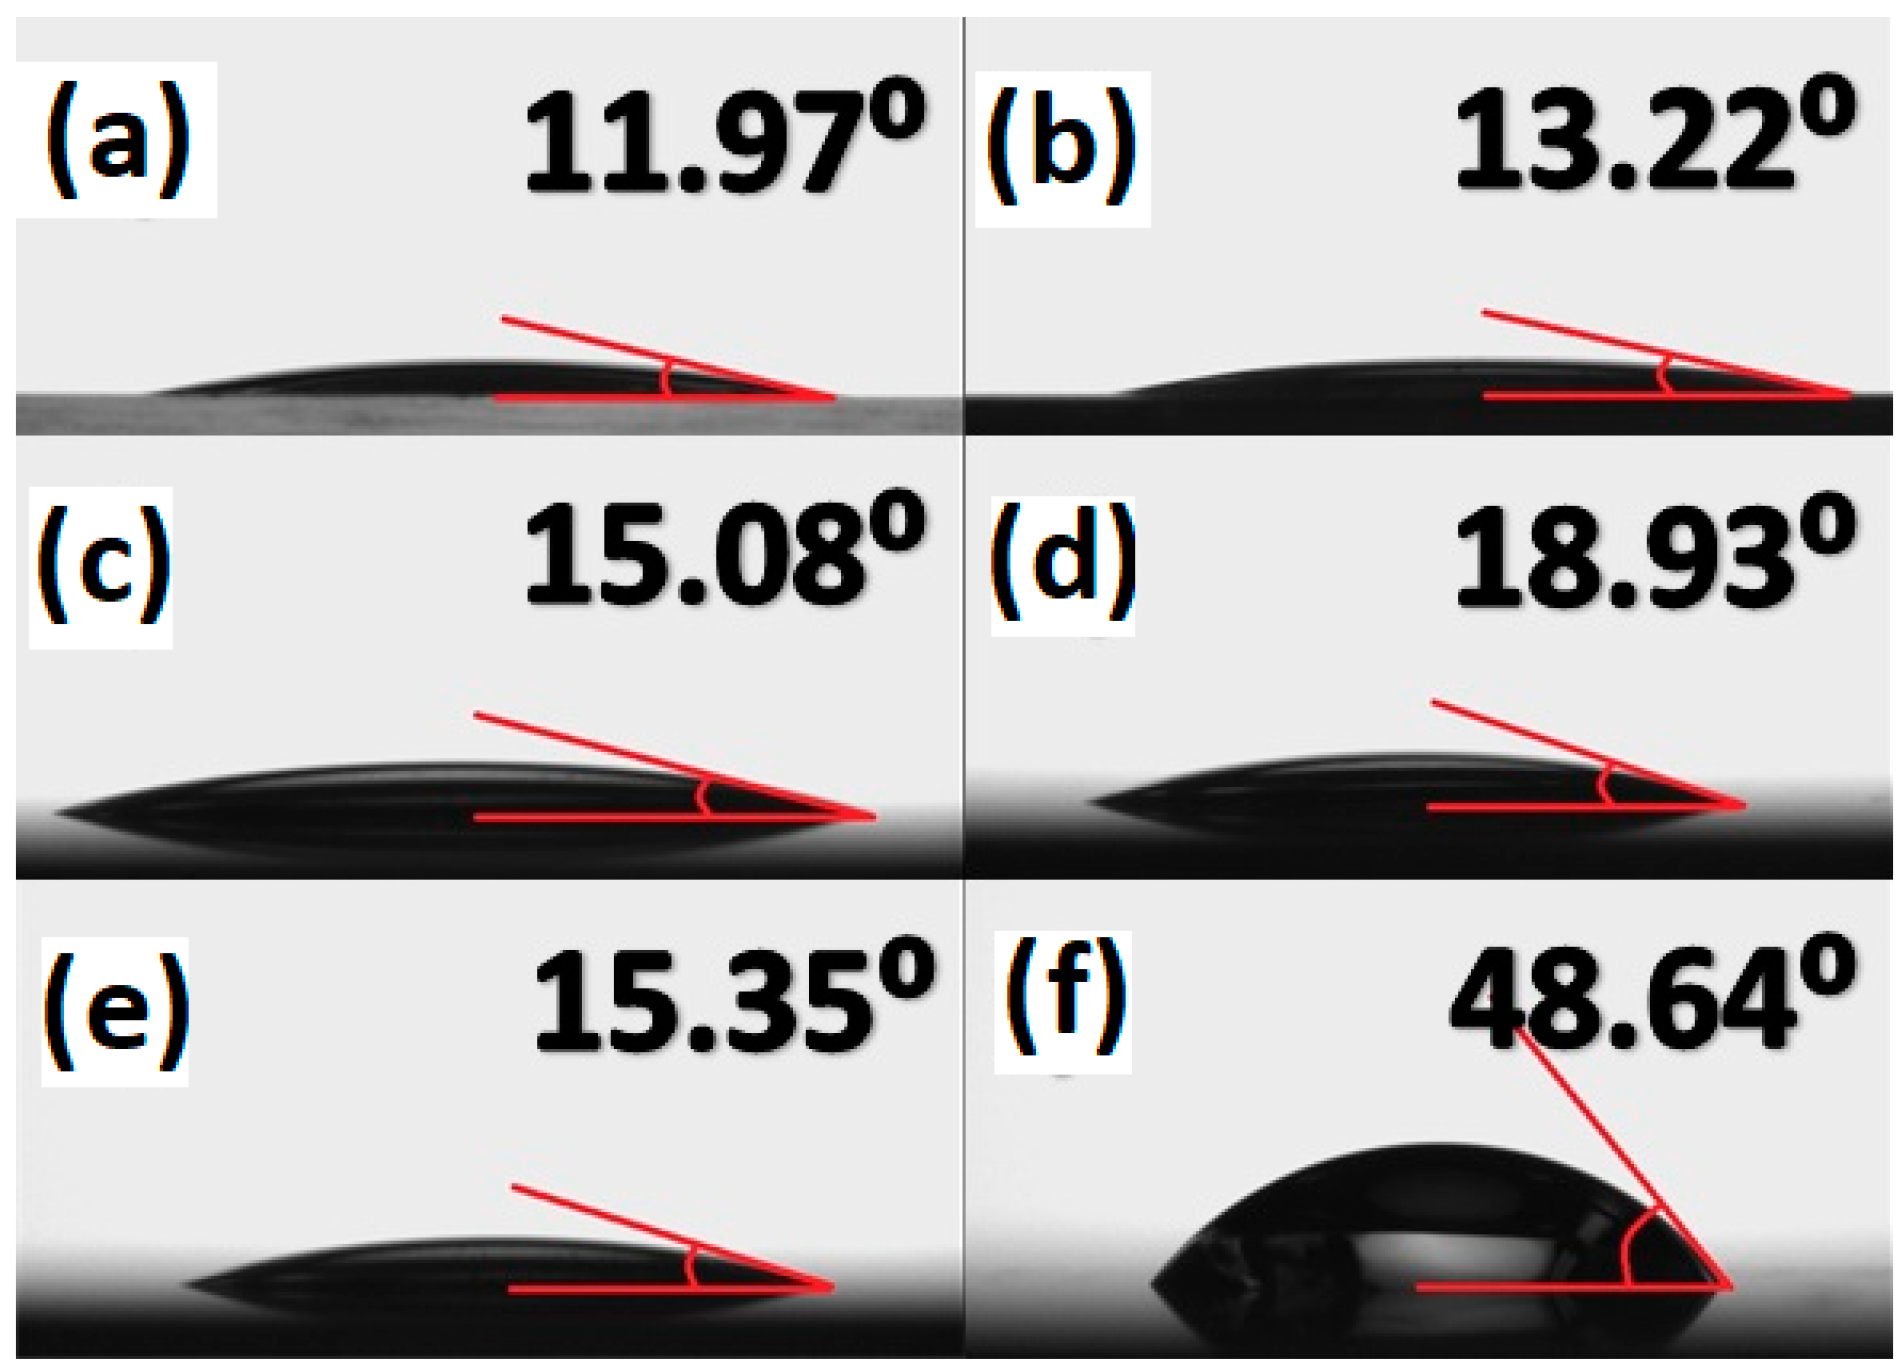
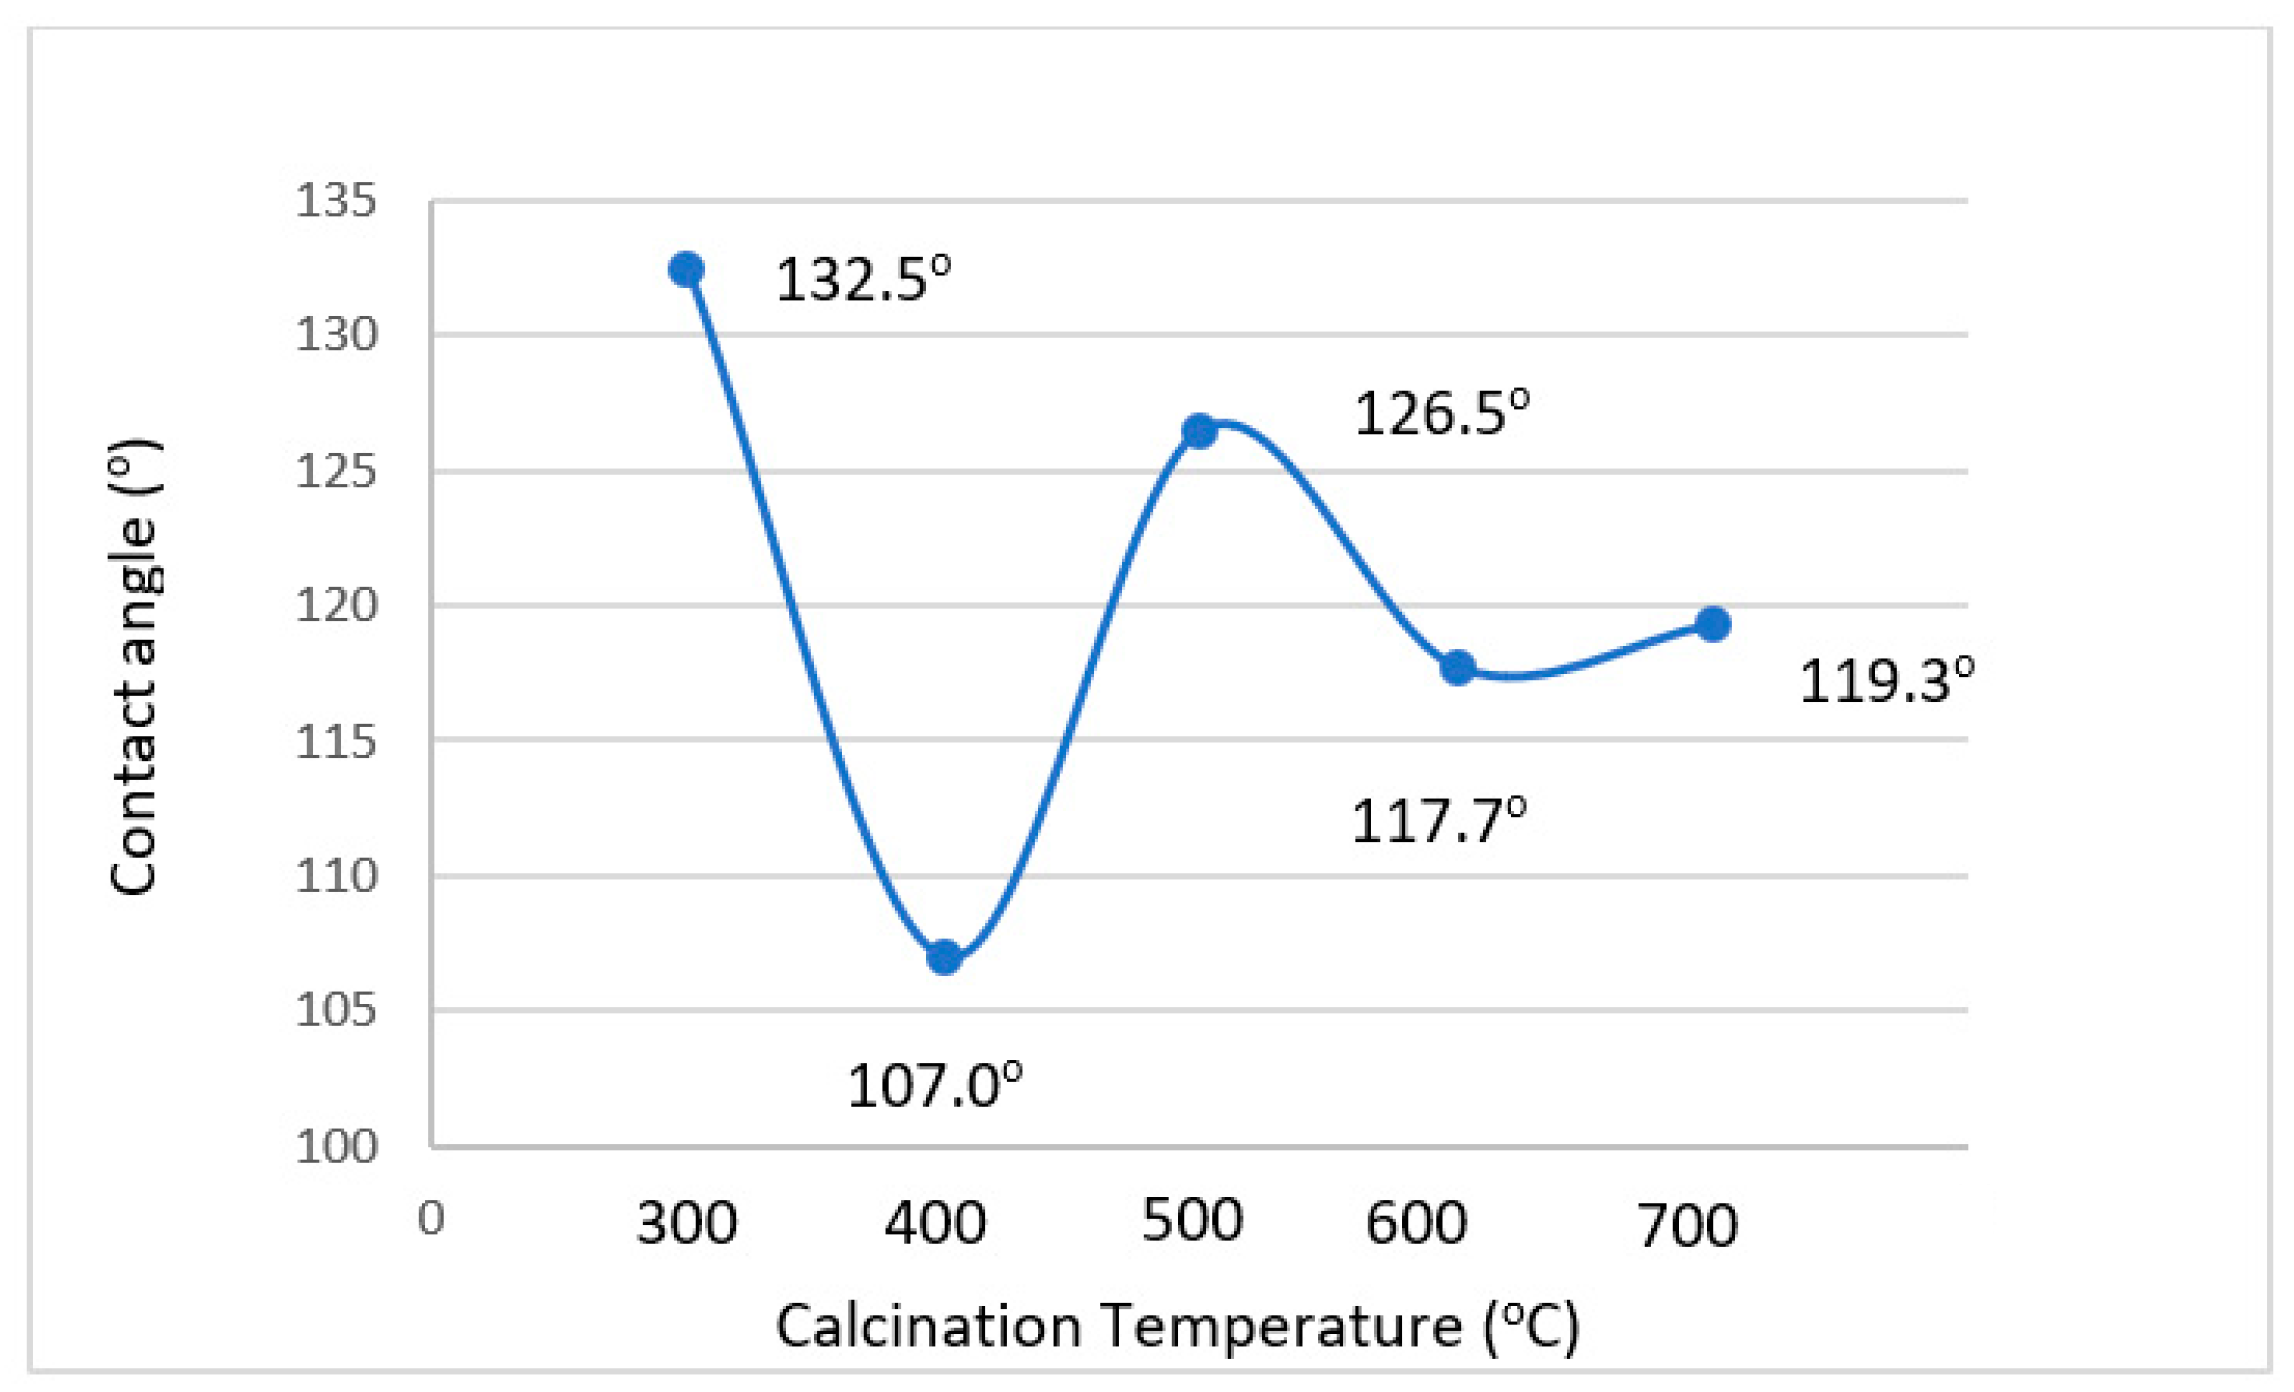
3.5. Wettability Analysis
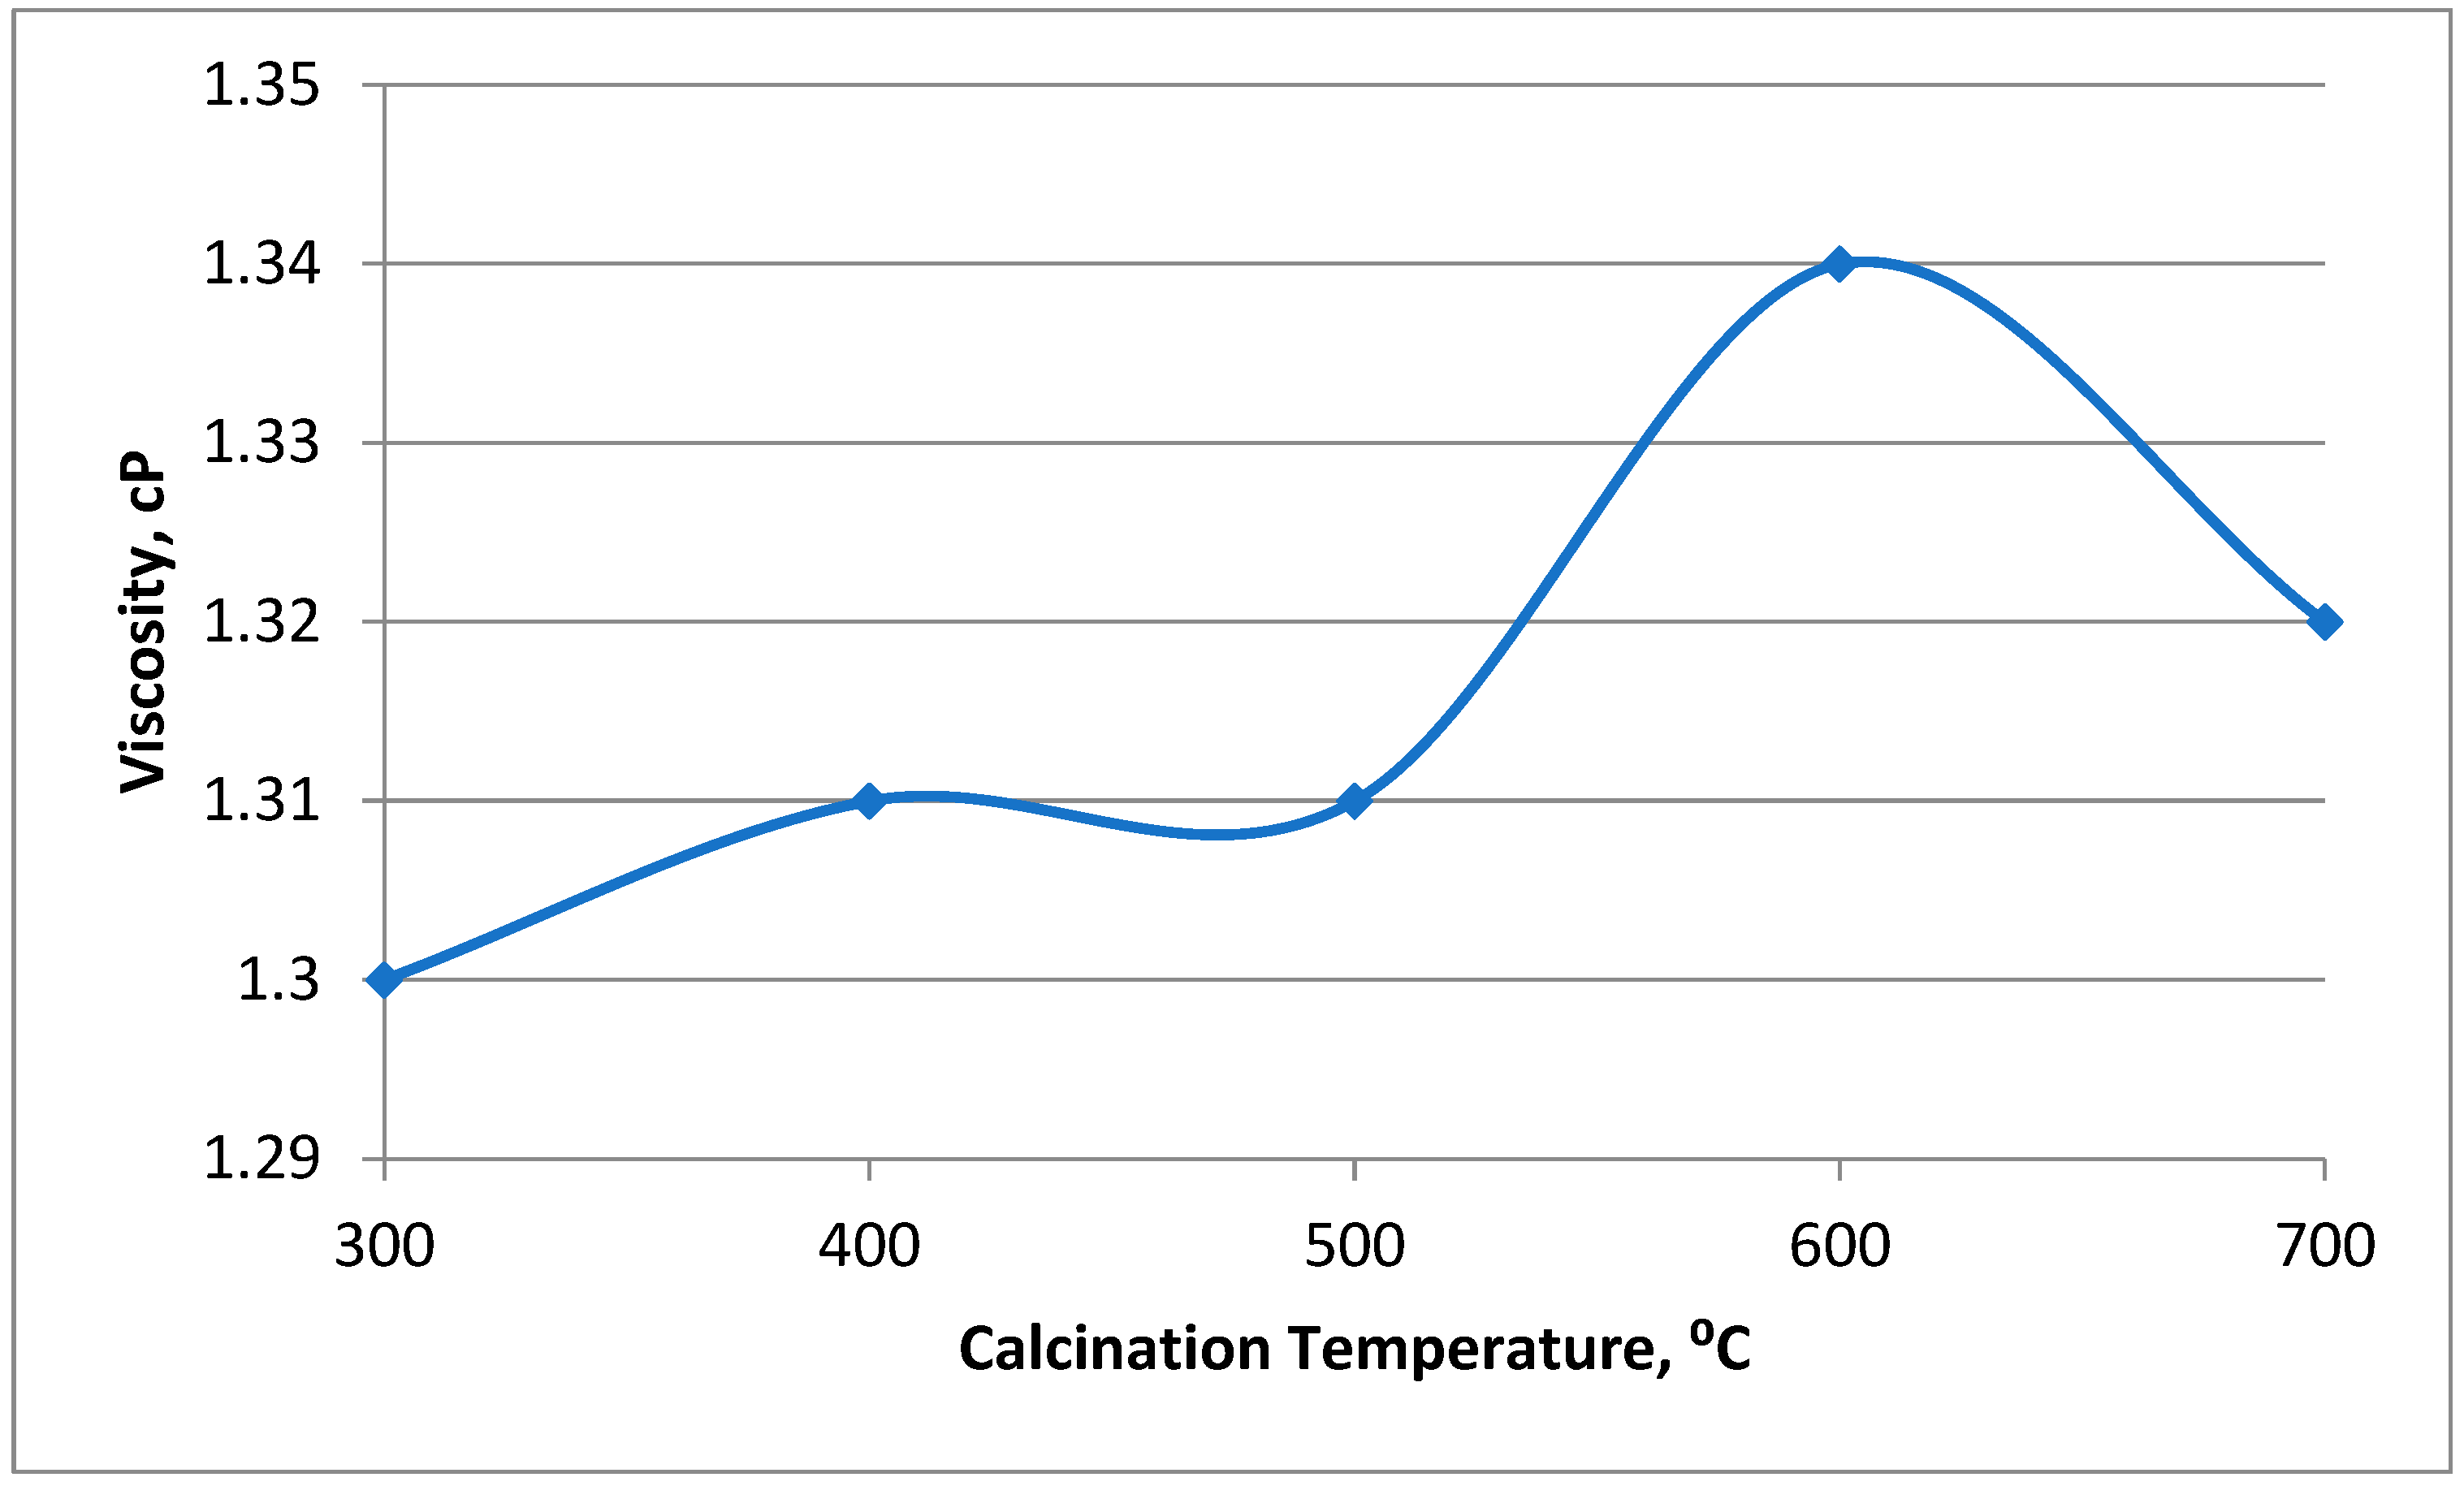
3.6. Viscosity Analysis
4. Conclusions
Author Contributions
Funding
Acknowledgments
Conflicts of Interest
References
- Alvarado, V.; Manrique, E. Enhanced Oil Recovery: An Update Review. Energies 2010, 3, 1529–1575. [Google Scholar] [CrossRef]
- Tunio, S.Q.; Tunio, A.H.; Ghirano, N.A.; Adawy, Z.M. Comparison of different enhanced oil recovery techniques for better oil productivity. Int. J. Appl. Sci. Technol. 2011, 1, 143–153. [Google Scholar]
- Yousefvand, H.A.; Jafari, A.; Yousefvand, H.A. Stability and flooding analysis of nanosilica/ NaCl /HPAM/SDS solution for enhanced heavy oil recovery. J. Pet. Sci. Eng. 2018, 162, 283–291. [Google Scholar] [CrossRef]
- Hendraningrat, L.; Li, S.; Torsæter, O. A coreflood investigation of nanofluid enhanced oil recovery. J. Pet. Sci. Eng. 2013, 111, 128–138. [Google Scholar] [CrossRef]
- Mokhatab, S.; Fresky, M.A.; Islam, M.R. Applications of Nanotechnology in Oil and Gas E&P. J. Pet. Technol. 2006, 58, 48–51. [Google Scholar]
- Ogolo, N.; Olafuyi, O.; Onyekonwu, M. Enhanced Oil Recovery Using Nanoparticles. In SPE Saudi Arabia Section Technical Symposium and Exhibition; Society of Petroleum Engineers: Richardson, TX, USA, 2012. [Google Scholar]
- Karimi, A.; Fakhroueian, Z.; Bahramian, A.; Pour Khiabani, N.; Darabad, J.B.; Azin, R.; Arya, S. Wettability alteration in Carbonates using zirconium oxide nanofluids: EOR Implications. Energy Fuels 2012, 26, 1028–1036. [Google Scholar] [CrossRef]
- Esmaeilnezhad, E.; Le Van, S.; Chon, B.H.; Choi, H.J.; Schaffie, M.; Gholizadeh, M.; Ranjbar, M. An experimental study on enhanced oil recovery utilizing nanoparticle ferrofluid through the application of a magnetic field. J. Ind. Eng. Chem. 2018, 58, 319–327. [Google Scholar] [CrossRef]
- Esmaeilzadeh, P.; Hosseinpour, N.; Bahramian, A.; Fakhroueian, Z.; Arya, S. Effect of ZrO2 Nanoparticles on the interfacial behavior of surfactant solutions at air–water and n-heptane–water interfaces. Fluid Phase Equilib. 2014, 361, 289–295. [Google Scholar] [CrossRef]
- Zaid, H.M.; Ahmad Latiff, N.R.; Yahya, N. The effect of zinc oxide and aluminum oxide nanoparticles on interfacial tension and viscosity of nanofluids for enhanced oil recovery. Adv. Mater. Res. 2014, 1024, 56–59. [Google Scholar] [CrossRef]
- Ahmed, A.; Saaid, I.M.; Tunio, A.H.; Pilus, R.M.; Mumtaz, M.; Ahmad, I. Investigation of dispersion stability and IFT reduction using surface modified nanoparticle: Enhanced oil recovery. J. Appl. Environ. Biol. Sci. 2017, 7, 56–62. [Google Scholar]
- Joonaki, E.; Ghanaatian, S. The Application of Nanofluids for Enhanced Oil Recovery: Effects on Interfacial Tension and Coreflooding Process. Pet. Sci. Technol. 2014, 32, 2599–2607. [Google Scholar] [CrossRef]
- Soleimani, H.; Yahya, N.; Latiff, N.R.A.; Zaid, H.M.; Demiral, B.; Amighian, J. Novel enhanced oil recovery method using Co2+ xFe2+1−x Fe3+2 O4 as magnetic nanoparticles activated by electromagnetic waves. J. Nano Res. 2014, 111–116. [Google Scholar] [CrossRef]
- Cui, M.; Emrick, T.; Russell, T.P. Stabilizing Liquid Drops in Nonequilibrium Shapes by the Interfacial Jamming of Nanoparticles. Science 2013, 342, 460–463. [Google Scholar] [CrossRef] [PubMed]
- Kothari, N.; Raina, B.; Chandak, K.B.; Iyer, V.; Mahajan, H.P. Application of Ferrofluid for Enhanced Surfactant Flooding in Eor; Society of Petroleum Engineers: Richardson, TX, USA, 2010; p. 131272. [Google Scholar]
- Şabikoğlu, I.; Paralı, L.; Malina, O.; Novak, P.; Kaslik, J.; Tuček, J.; Pechousek, J.; Navařík, J.; Schneeweiss, O.; Parali, L. The effect of neodymium substitution on the structural and magnetic properties of nickel ferrite. Prog. Nat. Sci. 2015, 25, 215–221. [Google Scholar] [CrossRef]
- Jiang, J.; Yang, Y.-M.; Li, L.-C. Synthesis and magnetic properties of lanthanum-substituted lithium–nickel ferrites via a soft chemistry route. Phys. B Condens. Matter 2007, 399, 105–108. [Google Scholar] [CrossRef]
- Gaber, A.; Abdel-Rahim, M.; Abdel-Latief, A.; Abdel-Salam, M.N. Influence of calcination temperature on the structure and porosity of nanocrystalline SnO2 synthesized by a conventional precipitation method. Int. J. Electrochem. Sci. 2014, 9, 81–95. [Google Scholar]
- Adil, M.; Lee, K.C.; Zaid, H.M.; Latiff, N.R.A.; Alnarabiji, M.S. Experimental study on electromagnetic-assisted ZnO nanofluid flooding for enhanced oil recovery (EOR). PLoS ONE 2018, 13, e0193518. [Google Scholar] [CrossRef] [PubMed]
- Joonaki, E.; Buckman, J.; Burgass, R.; Tohidi, B. Water versus asphaltenes; liquid-liquid and solid-liquid molecular interactions unravel the mechanisms behind an improved oil recovery methodology. Sci. Rep. 2019, 9, 1–13. [Google Scholar] [CrossRef] [PubMed] [Green Version]

| Calcination Temperature (°C) | Lattice Constant. a (Å) | D-Spacing (Å) | Average Crystallite Size (nm) | Phase Content of MnZnFe2O4 (%) | Phase Content of ZnFe2O4 (%) | Phase content of MnFe2O4 (%) | Phase Content of Fe2O3 (%) |
|---|---|---|---|---|---|---|---|
| 300 | 8.355 | 2.519 | 34.2 | 100 | - | - | - |
| 400 | 8.430 | 2.542 | 43.84 | 100 | - | - | - |
| 500 | 8.369 | 2.523 | 32.0 | 61 | 36 | 3 | - |
| 600 | 8.403 | 2.534 | 87.96 | 7 | 17 | 44 | 32 |
| 700 | 8.387 | 2.529 | 86.23 | 11 | 15 | 36 | 38 |
| Calcination Temperature (°C) | Hc (Oe) | Ms (emu/g) |
|---|---|---|
| 300 | 59.9 | 55.8 |
| 400 | 156.42 | 49.8 |
| 500 | 110.95 | 12.7 |
| 600 | 122.19 | 0.613 |
| 700 | 129.67 | 0.878 |
© 2019 by the authors. Licensee MDPI, Basel, Switzerland. This article is an open access article distributed under the terms and conditions of the Creative Commons Attribution (CC BY) license (http://creativecommons.org/licenses/by/4.0/).
Share and Cite
Mohd Mokhtar, N.A.; Beh, H.G.; Lee, K.C. The Potential Application of MnZn Ferrite Nanofluids for Wettability Alteration and Oil-Water Interfacial Tension Reduction. Crystals 2019, 9, 626. https://doi.org/10.3390/cryst9120626
Mohd Mokhtar NA, Beh HG, Lee KC. The Potential Application of MnZn Ferrite Nanofluids for Wettability Alteration and Oil-Water Interfacial Tension Reduction. Crystals. 2019; 9(12):626. https://doi.org/10.3390/cryst9120626
Chicago/Turabian StyleMohd Mokhtar, Nurul Afiqah, Hoe Guan Beh, and Kean Chuan Lee. 2019. "The Potential Application of MnZn Ferrite Nanofluids for Wettability Alteration and Oil-Water Interfacial Tension Reduction" Crystals 9, no. 12: 626. https://doi.org/10.3390/cryst9120626
APA StyleMohd Mokhtar, N. A., Beh, H. G., & Lee, K. C. (2019). The Potential Application of MnZn Ferrite Nanofluids for Wettability Alteration and Oil-Water Interfacial Tension Reduction. Crystals, 9(12), 626. https://doi.org/10.3390/cryst9120626