Article

Numerical Investigation of Thermal Buoyancy, the Electromagnetic Force and Forced Convection in Conventional RF Systems for 4-Inch Sic by TSSG

The Institute of Technological Sciences, Wuhan University, Wuhan 430072, China
*
Author to whom correspondence should be addressed.
Crystals 2019, 9(10), 516; https://doi.org/10.3390/cryst9100516
Submission received: 17 September 2019 / Revised: 30 September 2019 / Accepted: 1 October 2019 / Published: 8 October 2019
(This article belongs to the Section Crystalline Materials)

Abstract

:
In this paper, we study thermal buoyancy, the electromagnetic force and forced convection in a conventional radio frequency (RF) furnace for growing large-sized (4-inch) silicon carbide ingots using the top-seeded solution method. The thermal buoyancy and electromagnetic force are analyzed qualitatively and quantitatively under real working conditions, and a method to increase the growth stability of large-sized (4-inch) SiC is proposed through the study of forced convection.

1. Introduction

With the rapid development of wide bandgap semiconductor industry, silicon carbide has become a kind of strategic advanced electronic material [1,2]. Common silicon carbide production technologies include the physical vapor transport (PVT) method and the top-seeded solution growth (TSSG) method [3]. Although the PVT method has been adopted in the industry due to its fast growth and low cost, during the past ten years, increasing attention has been paid to the TSSG method because it is closer to the thermodynamic growth equilibrium and produces low defect crystals [4,5]. To date, several groups have been developing the top-seeded solution growth (TSSG) method [6,7,8] and have demonstrated that its growth mechanism is relatively complex and lacks measuring tools. Therefore, a numerical simulation is a powerful tool that can be used to examine transport phenomena during the growth process.
Many simulation studies have been performed on the analysis of the internal conditions of opaque high-temperature solutions. On the premise of neglecting the effect of the solute on fluid flow, Mercier and Dedulle established a TSSG growth model containing only electromagnetic convection, forced convection, Marangoni convection, and buoyancy convection and studied the relationship between the crucible shape and flow field [6]. The electromagnetic force and thermal buoyancy were preliminarily discussed by Mercier [7], and it was considered that thermal buoyancy was dominant. Yamamoto [8] established a three-dimensional model to study the effect of the current frequency (80 kHz and 25 kHz) on RF coil equipment (including resistance heating), and three important conclusions were obtained. 1. For a high-frequency coil, the predicted flow is axisymmetric or weakly oscillating. 2. For a small-frequency coil, the melt flow is fully disturbed. 3. The electromagnetic force was dominant at all coil frequencies in their system, which means the fluid flow is mainly controlled by Lorentz force. Umezaki et al. [9,10] studied the effect of high-speed seed rotation (from 20 rpm to 250 rpm) on the crystal growth rate of SiC, and the results suggested that a high-speed seed crystal rotation may drastically improve the growth rate. Marangoni convection was also studied by Yamamoto [11], and the results show that the Marangoni force changed the direction of the fluid flow and had adverse effects on the growth.
To date, no simulation studies exist on the thermal buoyancy and electromagnetic force in a conventional radio frequency (RF) furnace without resistance heating from the qualitative and quantitative aspects. Furthermore, although Umezaki [9,10] studied the relationship between forced convection and the growth rate of the seed with a 2-inch diameter, the stability of growth for a large crystal ingot (4-inch) is another standard for measuring crystals. Therefore, in this study, the electromagnetic force, buoyancy, and forced convection were studied during the growth of large-sized SiC in a conventional RF furnace.

2. Process and Model Descriptions

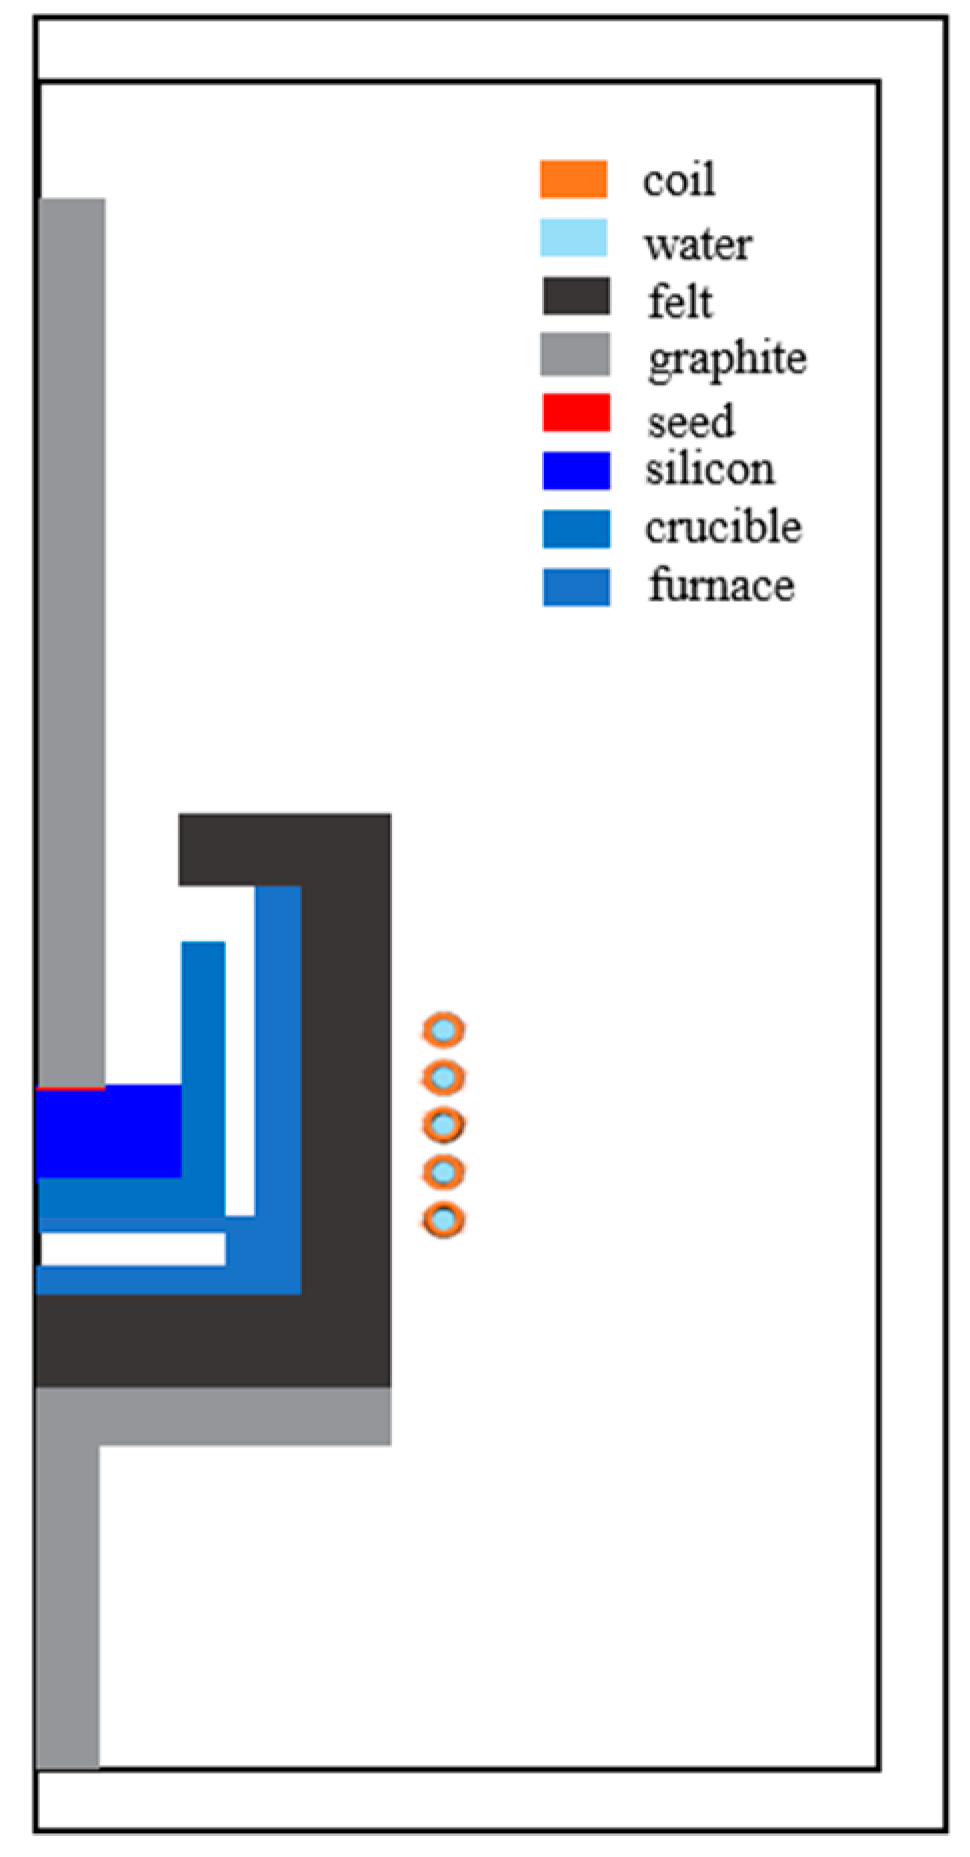
2.1. Geometric Model

Studying the growth environment of large-sized (4-inch) silicon carbide crystals is necessary for industrial production. Figure 1 shows a simplified schematic of the computed area. The external graphite crucible (called a furnace) is directly heated by induction (30 kHz). The inner crucible (called a crucible) acts both as a container for the liquid and as the carbon source for the process. The crucible is mainly heated by radiation from the furnace. Pure liquid silicon (Mitsubishi Materials Corporation, Tokyo, Japan) is used as a solvent and placed in the inner crucible [12]. The liquid container is filled until it is 100 mm in radius and 72 mm in height. The crystallon of 50 mm in radius is mounted on a rotating graphite rod of 20 rpm and dipped into the liquid approximately 3 mm.

2.2. Governing Equation

The physical parameters, electromagnetic equation, heat transfer equation, and assumptions were introduced in Mercier [6]. A brief description of the boundary conditions is as follows: Marangoni convection and slip are applied to the gas–liquid interface; no-slip is applied to the solid–liquid interface. The inner boundary of the coil is set to 300 K to simulate the cooling of the water flow, etc. [6]. As this paper mainly studies thermal buoyancy, the electromagnetic force, and forced convection, we only introduce the fluid momentum equation and do not explain the heat transfer equation and the electromagnetic equation.
u t + u · u = 1 ρ p + ν 2 u + F
where u is the velocity vector, t is the time, ρ is the density of pure silicon, p is the pressure and F is the volume force (external force), which can include buoyancy, electromagnetic force, and other external forces.
The formula for calculating buoyancy [6] is as follows:
F B u o = α g ρ ( T T r e f )
where FBuo is the buoyancy, g is the acceleration (9.81 m/s2), α is the coefficient of thermal expansion of pure silicon, T is the Kelvin temperature and Tref is the reference temperature of 1687 K. For incompressible fluids, ρ (the density) is based on the Boussinesq approximation, which is a temperature-only variable.
The formula for calculating the electromagnetic force [6] is as follows:
F E = 0.5 real ( J × B * )
where FE is the electromagnetic force, real () is the real part, J is the total current density and B* is the complex conjugate of the magnetic flux density B.
The formula for calculating the rotation speed [6] is as follows, which imposes on the moving boundary (rotating graphite rod and seed):
v = w r
where v is the rotation speed, w is the angular velocity and r is the distance from the center of rotation.

2.3. Numerical Method

We adopted the finite element method and the linear discrete method to solve the equation. Referring to the previous study [13,14,15], turbulence (k-w model in RANS) was considered because the Rayleigh number is higher than the critical number (Rac = 4 × 10⁴) [16,17]. The Rayleigh number is defined as follows:
R a = g β ( T T c r y s t a l ) h 3 υ κ
where g is the gravity, β is the thermal expansion coefficient, T is deduced from the Si solution, Tcrystal = 1970 K, h is the height of the liquid, ν is the kinematic viscosity, and κ is the thermal diffusivity.
For the calculation of the area mesh, we refer to the work of Yamamoto [8] and Ha [18,19]. The mesh is more refined in the flow area; the number of grids in the fluid region is 15,000, and the finest grid-scale is 0.5 mm at the seed–solution interface.

3. Results and Discussion

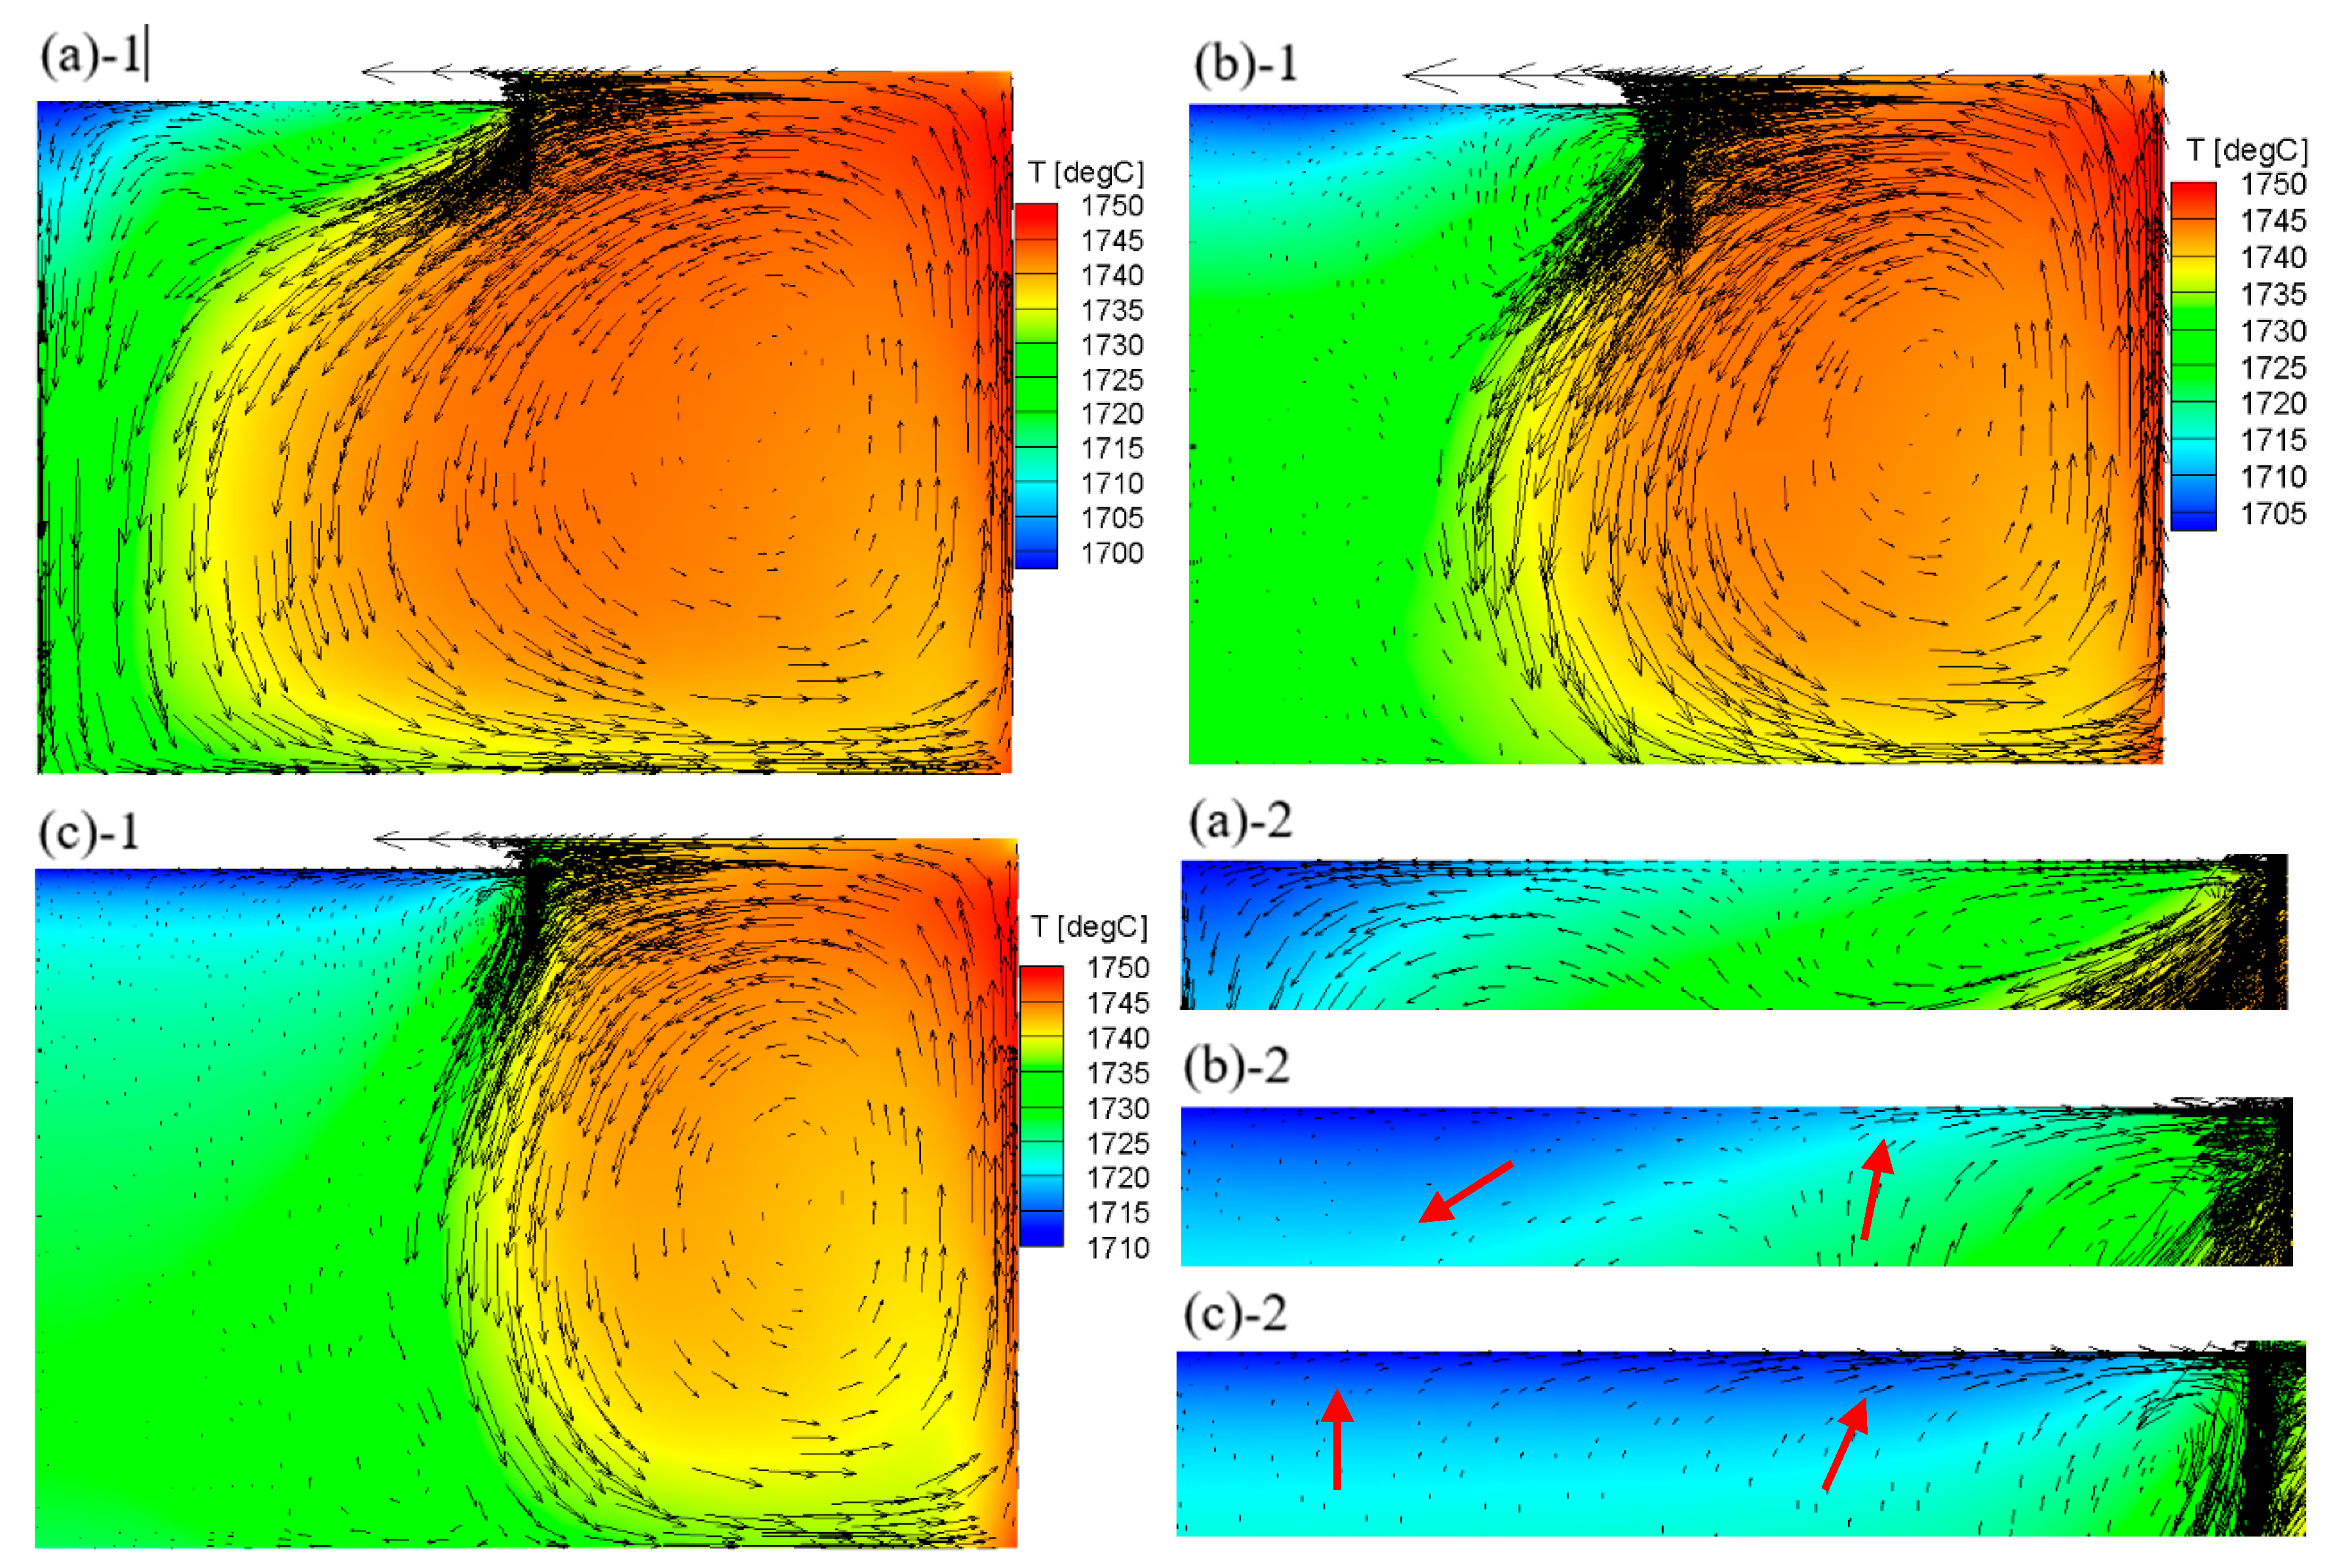
3.1. Distribution of the Temperature

Buoyancy is related to the temperature in the solution, and the electromagnetic force is determined by the current intensity, which has a direct impact on the temperature of the solution. Therefore, in addition to the electromagnetic force and buoyancy, the temperature distribution is also necessary. We chose different currents (660 A, 700 A and 740 A,) to study the relationship between currents and temperature. Figure 2 shows the temperature and temperature difference under different currents.
As shown in Figure 2a, the maximum temperature appears on the right side, and the minimum temperature occurs at the center of the seed in the upper left corner because the wall of the inner crucible directly receives the external graphite crucible radiation. Figure 2b shows that the internal temperature of the solution rises rapidly and that the internal temperature difference becomes more significant as the input current intensity increases. Therefore, according to Hofmann [4], because they are closer to the thermodynamic equilibrium condition and more conducive to the growth of higher quality crystals, we should choose the smaller values as the input currents. Another important reason for choosing a smaller current is that the internal temperature difference of the solution will increase rapidly with increasing input current, which may cause a stronger convection phenomenon.

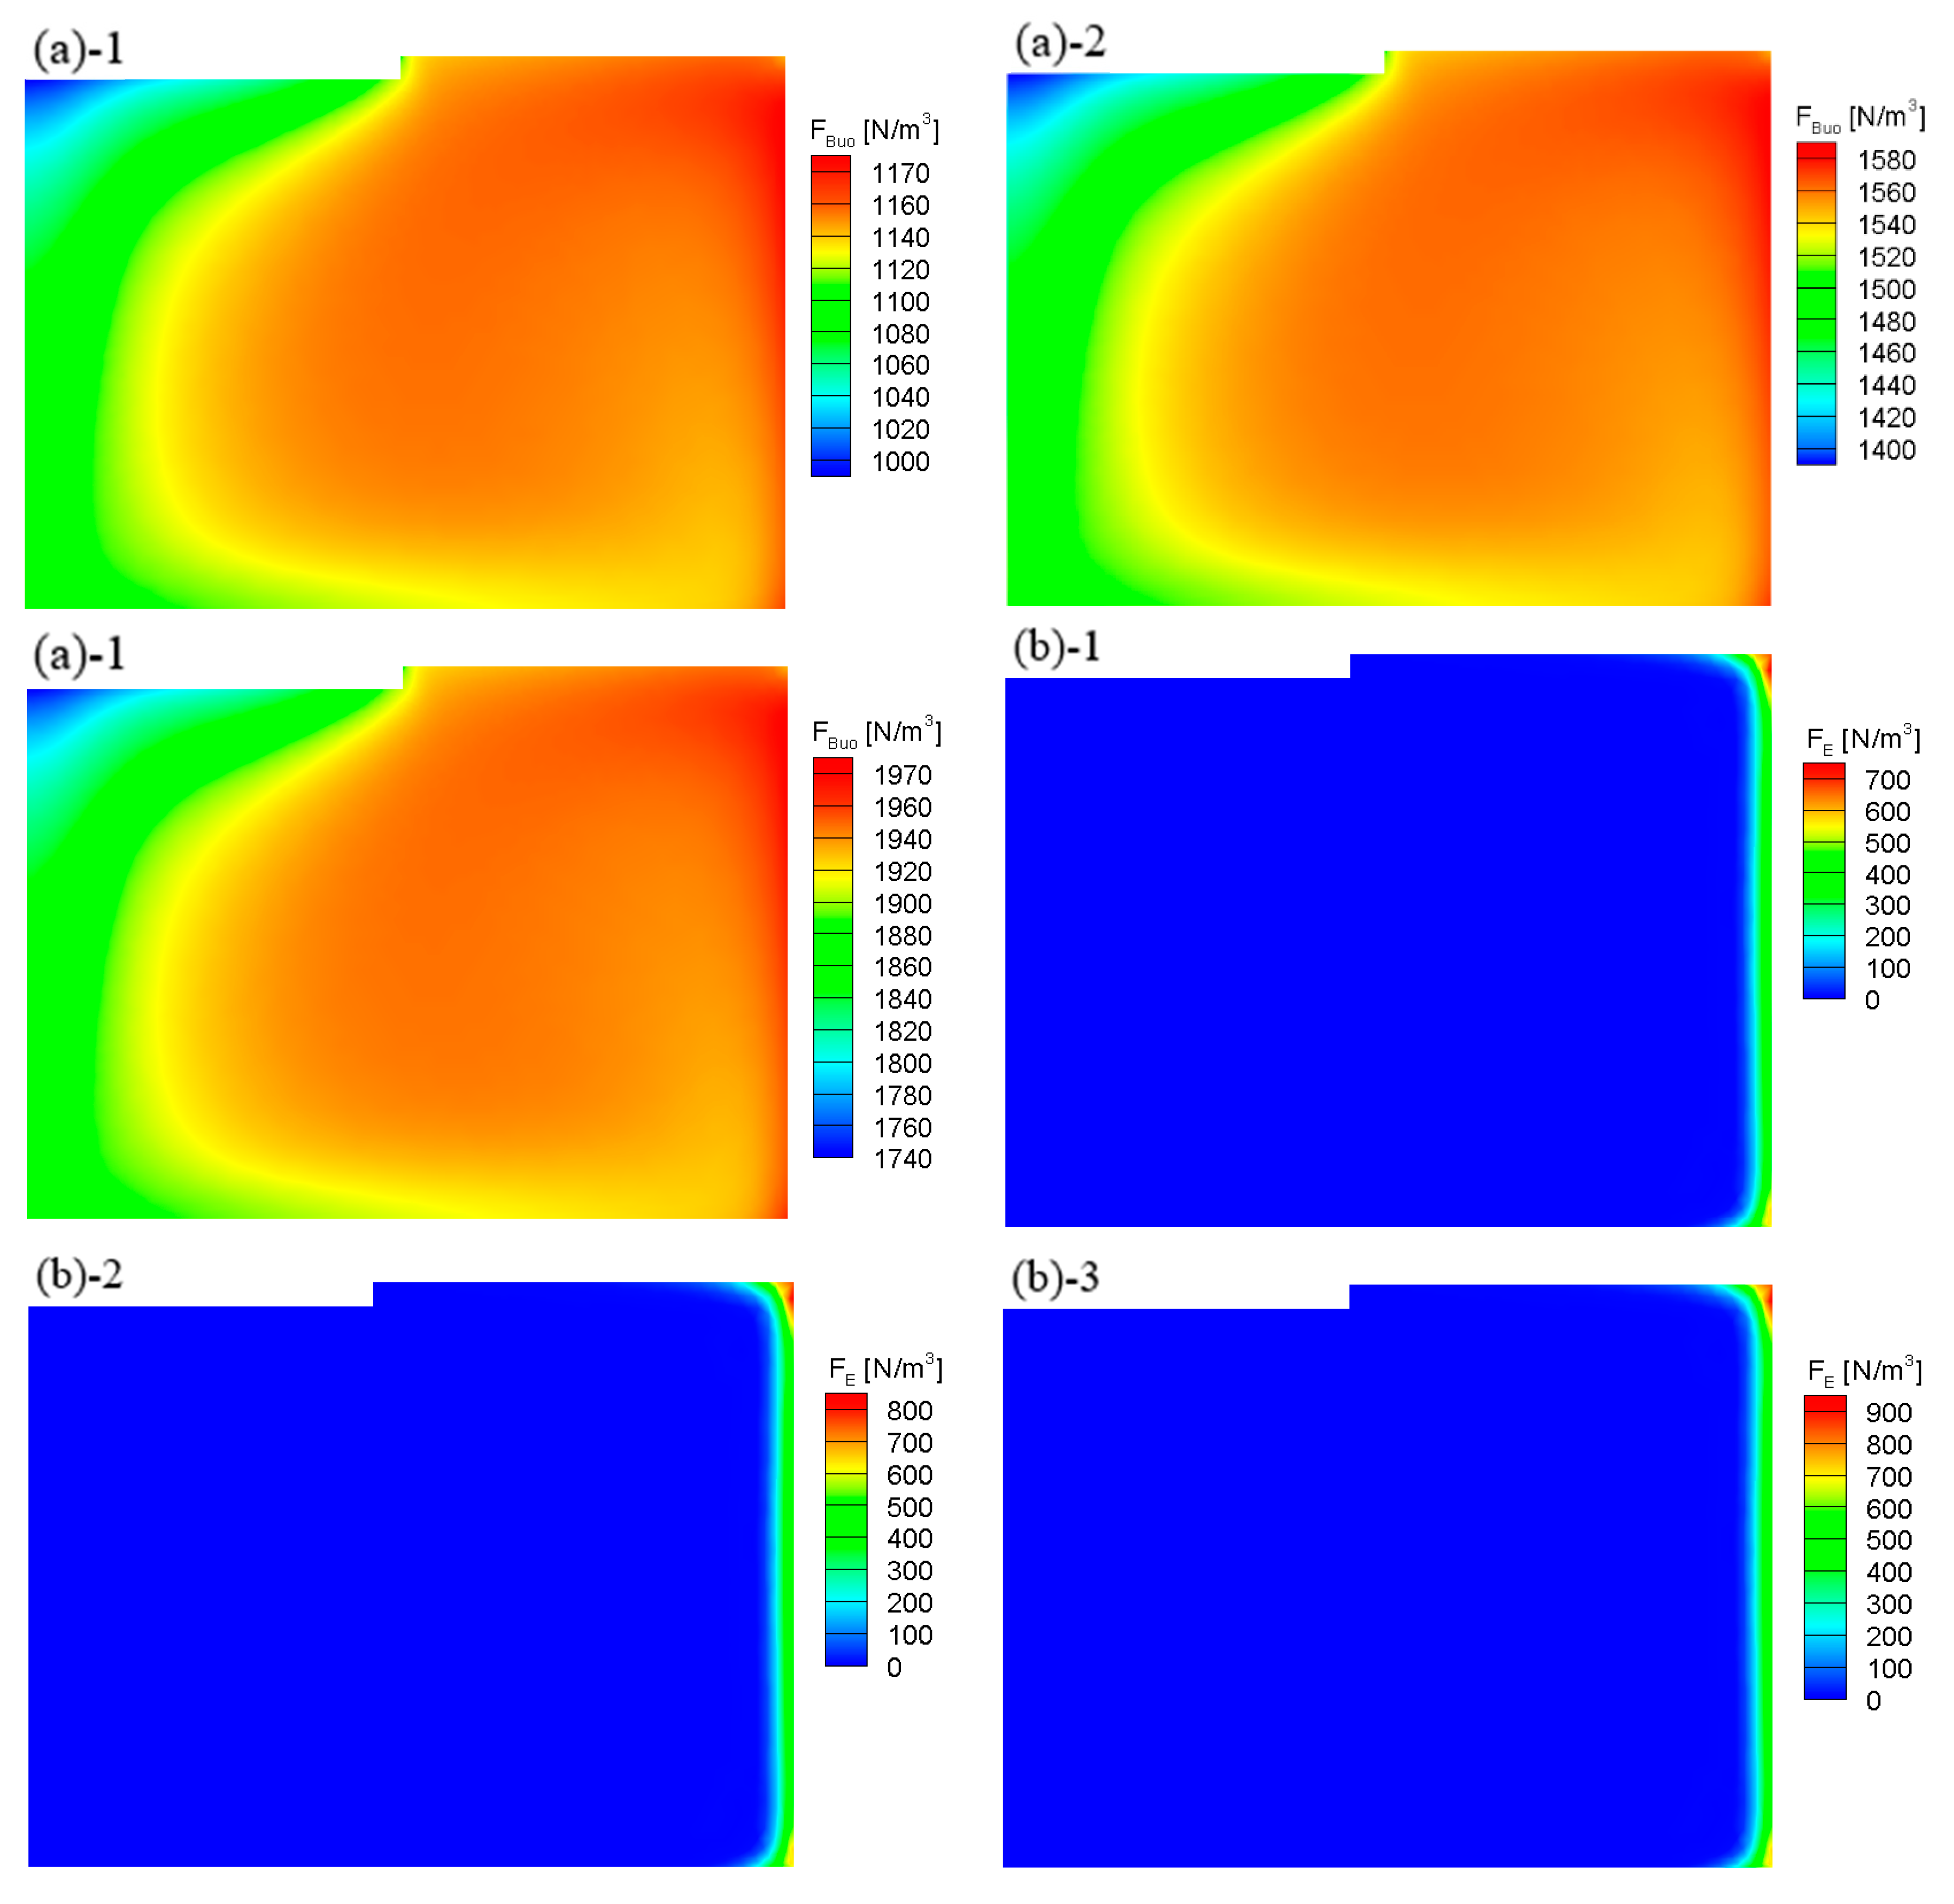
3.2. Distribution of the Buoyancy and Electromagnetic Force

The distribution of the thermal buoyancy and electromagnetic force in solution is shown in Figure 3.
The distribution of the thermal buoyancy is the same as that of the temperature. The maximum is located at the right boundary, and the minimum is located at the center below the seed. The distribution is the result of the definition of thermal buoyancy. The electromagnetic force is mainly concentrated on the right sidewall, the corner is more extensive, and the center is smaller. Although this distribution is consistent with the induction furnace with resistance heating studied by Yamamoto [8], it differs significantly in value. This conflict can be attributed to the different operating conditions used, such as the furnace heating mode, because the most common RF furnace is selected in this paper.
As shown in Figure 4, the thermal buoyancy is greater than the electromagnetic force under different input currents. The difference between the thermal buoyancy and electromagnetic force increases significantly with an increase in the current, ranging from 1.61:1 of 660 A to 2.15:1 of 740 A. This finding indicates that the thermal buoyancy is dominant in the whole solution growth method, which is consistent with the results of Mercier’s [7] qualitative description. This result also shows that it is not an ideal choice to suppress the buoyancy by using an electromagnetic force in an induction heating system. In addition, a low-frequency coil can be used because it has little effect on the fluid in a conventional RF furnace.

3.3. Effect of Forced Convection on the Growth Stability

Forced convection is hugely beneficial for increasing the growth rate and is therefore essential for solution growth. The figure below shows the variation in the concentration gradient of carbon, which is proportional to the growth rate [10,12] at the near wall of the seed at different rotational speeds for large-sized (4-inch) silicon carbide.
As shown in Figure 5, when the rotating speed of the crystallon is small (less than 90 rpm), an increase in rotating speed has little effect on the concentration gradient of large-sized SiC but has a significant influence on the position of the maximum concentration gradient. With increasing rotational speed of the crystallon (from 90 rpm to 170 rpm), the fluctuation of the concentration gradient near the wall of the seed becomes more visible, so increasing rotational speed in this region is harmful to the stability of crystal growth. When the rotational speed is higher than the above region (more than 170 rpm), the fluctuation of the concentration gradient near the wall of the seed crystal will decrease significantly, which is beneficial for the stable growth of large-sized crystals.
According to our previous research, the flow field near the wall of the seed is closely related to the concentration gradient. Therefore, we attempted to determine the cause of the above phenomenon from the flow field direction.
As shown in Figure 6, when the rotational speed is 10 rpm, the fluid flow separation at the near-wall surface is more apparent, and the flow driven by the temperature difference is dominant at this time. As the speed increases to 170 rpm, the apparent flow separation phenomenon near the wall has disappeared and is replaced by a slower and more chaotic flow. At this time, the forced convection and the temperature difference jointly dominate the fluid flow. When the rotational speed reaches 300 rpm, the flow near the wall changes from downward (10 rpm) to the upward flow and this upward flow is highly beneficial for crystal growth stability. Now, forced convection caused by rotation becomes the main factor affecting the flow near the wall of the seed.
Combining Figure 5 and Figure 6, we conclude that when the rotational speed increases from 0 rpm, it is not helpful for the growth stability of large-sized SiC crystals. When the rotational speed is between 90 rpm and 170 rpm, the increase in the rotational speed is not conducive to the stable growth of SiC crystals. When the rotational speed is greater than 200 rpm, the growing stability of SiC increases with increasing rotational speed.

4. Conclusions

This paper studies the situation of the thermal buoyancy, electromagnetic force and forced convection in a conventional RF furnace when growing large-sized (4-inch) silicon carbide ingots. The results show the following. 1. The maximum temperature difference inside the solution increases with increasing temperature; 2. compared with the electromagnetic force, thermal buoyancy has always dominated and becomes increasingly apparent with increasing coil current; and 3. when forced convection reaches a certain level (300 rpm), it has a positive effect on the stability of large-sized silicon carbide crystal growth. Of course, this also needs to be verified by accurate experiments.

Author Contributions

Conceptualization, B.L. and B.G.; methodology, B.L.; software, Y.Y.; validation, X.T., Y.Y. and B.L.; formal analysis, Y.Y.; investigation, X.T.; supervision, B.G.

Funding

This research received no external funding.

Acknowledgments

Thank Xia Tang for providing computer resources.

Conflicts of Interest

The authors declare no conflict of interest.

References

  1. Nee, H.P.; Rabkowski, J. High-efficiency power conversion using silicon carbide power electronics. Mater. Sci. Forum 2014, 1083, 778–780. [Google Scholar] [CrossRef]
  2. Biela, J.; Schweizer, M.; Waffler, S.; Kolar, J.W. SiC versus Si—Evaluation of potentials for performance improvement of inverter and DC–DC converter systems by SiC power semiconductors. IEEE Trans. Ind. Electron. 2011, 58, 2872. [Google Scholar] [CrossRef]
  3. Chaussende, D.; Pons, M.; Wellmann, P. Status of SiC bulk growth processes. J. Phys. D: Appl. Phys. 2007, 40, 6150. [Google Scholar] [CrossRef]
  4. Hofmann, D.H.; Muller, M.H. Prospects of the use of liquid phase techniques for the growth of bulk silicon carbide crystals. Mater. Sci. Eng. B 1999, 61, 29–39. [Google Scholar] [CrossRef]
  5. Yamamoto, Y.; Harada, S. Low-dislocation-density 4H-SiC crystal growth utilizing dislocation conversion during solution method. Appl. Phys. Express 2014, 7, 065501. [Google Scholar] [CrossRef]
  6. Mercier, F.; Dedulle, J.M.; Chaussende, D.; Pons, M. Coupled heat transfer and fluid dynamics modeling of high-temperature SiC solution growth. J. Cryst. Growth 2010, 312, 155–163. [Google Scholar] [CrossRef]
  7. Mercier, F.; Nishizawa, S.I. Solution growth of SiC from silicon melts: Influence of the alternative magnetic field on fluid dynamics. J. Cryst. Growth 2011, 318, 385. [Google Scholar] [CrossRef]
  8. Yamamoto, T.; Adkar, N.; Okano, Y.; Ujihara, T.; Dost, S. Numerical investigation of the transport phenomena occurring in the growth of SiC by the induction heating TSSG method. J. Cryst. Growth 2017, 474, 50–54. [Google Scholar] [CrossRef]
  9. Umezaki, T.; Koike, D.; Horio, A.; Harada, S. Increase in the growth rate by rotating the seed crystal at high speed during the solution growth of SiC. Mater. Sci. Forum 2014, 63, 778–780. [Google Scholar] [CrossRef]
  10. Umezaki, T.; Koike, D.; Harada, S.; Ujihara, T. Analysis of the carbon transport near the growth interface with respect to the rotational speed of the seed crystal during top-seeded solution growth of SiC. J. Jpn. Appl. Phys. 2016, 55, 125601. [Google Scholar] [CrossRef]
  11. Yamamoto, T.; Okano, Y.; Ujihara, T.; Dost, S. Global simulation of the induction heating TSSG process of SiC for the effects of Marangoni convection, free surface deformation and seed rotation. J. Cryst. Growth 2017, 470, 75–88. [Google Scholar] [CrossRef]
  12. Lefebure, J.; Dedulle, J.M.; Ouisse, T. Modeling of the growth rate during top seeded solution growth of SiC using pure silicon as a solvent. Cryst. Growth Des. 2012, 12, 909–913. [Google Scholar] [CrossRef]
  13. Kusunoki, K.; Okada, N.; Kamei, K.; Moriguchi, K.; Daikoku, H.; Kado, M.; Sakamoto, H.; Bessho, T.; Ujihara, T. Top-seeded solution growth of three-inch-diameter 4H-SiC using convection control technique. J. Cryst. Growth 2014, 395, 68–73. [Google Scholar] [CrossRef]
  14. Tsunooka, Y.; Kokubo, N.; Hatasa, G.; Harada, S.; Tagawa, M.; Ujihara, T. High-speed prediction of computational fluid dynamics simulation in crystal growth. CrystEngComm 2018, 20, 6546–6550. [Google Scholar] [CrossRef] [Green Version]
  15. Mercier, F.; Nishizawa, S. Numerical investigation of the growth rate enhancement of SiC crystal growth from silicon melts. Jpn. J. Appl. Phys. 2011, 50, 035603. [Google Scholar] [CrossRef]
  16. Muller, G.; Neumann, G.; Weber, W. Natural convection in vertical Bridgman configurations. J. Cryst. Growth 1984, 70, 78–93. [Google Scholar] [CrossRef]
  17. Touihri, R.; Hadid, H.B.; Henry, D. On the onset of convective instabilities in cylindrical cavities heated from below. Phys. Fluids 1999, 11, 2078. [Google Scholar] [CrossRef]
  18. Ha, M.-T.; Yu, Y.-J.; Shin, Y.-J.; Bae, S.-Y.; Lee, M.-H.; Kim, C.-J.; Jeong, S.-M. Flow modification enhancing the growth rate in top seeded solution growth of SiC crystals. RSC Adv. 2019, 9, 26327–26337. [Google Scholar] [CrossRef] [Green Version]
  19. Ha, M.T.; Shin, Y.J.; Lee, M.H.; Kim, C.-J.; Jeong, S.-M. Effects of the Temperature Gradient Near the Crystal-Melt Interface in Top Seeded Solution Growth of SiC Crystal. Physica Status Solidi A 2018, 215, 1701017. [Google Scholar] [CrossRef]
Figure 1. Simplified schematic of the computed area.
Crystals 09 00516 g001
Figure 2. (a) Solution internal temperature distribution. 1,2,3 correspond to the coil current 660 A, 700 A and 740 A, respectively. (b) Variation in the minimum temperature and maximum temperature difference of the solution with the current. T is the minimum temperature, I is the coil current, and △T is the maximum temperature difference.
Crystals 09 00516 g002
Figure 3. Distribution of the electromagnetic force and thermal buoyancy in solution. (a) Thermal buoyancy distribution and (b) electromagnetic force distribution; 1, 2 and 3 correspond to the coil currents of 660 A, 700 A, and 740 A, respectively.
Crystals 09 00516 g003
Figure 4. Comparison of the maximum values of the thermal buoyancy and electromagnetic force, the black line is the thermal buoyancy, and the red line represents the electromagnetic force.
Crystals 09 00516 g004
Figure 5. Variation in the concentration gradient along the seed radius.
Crystals 09 00516 g005
Figure 6. Variation in the temperature and flow field: (a), (b), (c) correspond to the rotational speed of 10 rpm, 170 rpm, 300 rpm, respectively; 1 and 2 correspond to the overall and partial speed, respectively.
Crystals 09 00516 g006

