1. Introduction
Paramagnetic liquid crystalline lanthanide complexes with organic ligands (lanthanidomesogens) combined highly effective luminescence with abnormally large values of magnetic susceptibility anisotropy
,
and
are components of magnetic susceptibility in directions parallel and perpendicular to the axis of the preferred orientation of the molecules [
1].
These properties of nematic lanthanidomesogens make it possible to create optical media with linearly polarized luminescence for use in optoelectronic devices controlled by magnetic and electric fields [
2]. Some gadolinium-based liquid crystal complex are applied as contrast agents in magnetic resonance imaging (see, e.g., the review [
3]). However, the thermotropic liquid crystal complex considered in this work cannot be used as a contrast agent, since the liquid crystal state is reached at a temperature of the order of 100
C.
For effective practical use of lanthanidomesogens, it is necessary to study orientation processes occurring in lanthanidomesogens under the influence of magnetic and electric fields. In this regard, the aim of this work is to experimentally and theoretically investigate the influence of a magnetic field on the degree of homogeneity of the orientation of lanthanidomesogens and the determination of the Frank elastic constants.
Changing the degree of homogeneity of the director orientation is connected with the well-known Fréedericksz transition. The classical Fréedericksz effect has been studied for a long time and it is described in detail both theoretically and experimentally [
4,
5,
6]. Recently, much attention has been paid to the study of this effect in more complex systems and in more complex situations than previously, see, e.g., [
7,
8,
9,
10,
11,
12,
13,
14,
15].
Considerable attention was paid to the analysis of the transition for different types of boundary conditions. The most common model for the anchoring energy of the molecules with the orienting surface is the Gaussian-type Rapini–Popular potential [
16]. In the nematic liquid crystals with finite anchoring energy, the Fréedericksz transition is continuous and the director orientation above the threshold is changed in the whole volume including the boundary [
5].
Between the description of the Fréedericksz effect in the electric and magnetic fields, there is a significant difference. The reason is that the electric field inside the liquid crystal with a nonuniform distribution of the director is not homogeneous [
17,
18]. The details of this problem and the choice of an appropriate thermodynamic potential describing the system in an external field are discussed in [
19,
20,
21,
22].
In the present work, we investigate the changing the degree of homogeneity of the director orientation with the strong and weak anchoring in the presence of the external electric and magnetic field. In order to determine the type of equilibrium configuration of the director, we used a method based on the minimization of the liquid crystal free energy. Moreover, the Frank elastic constants were considered as unknown parameters. They were also obtained by minimizing the functional of the free energy.
A good agreement was achieved between the experimental results and numerical calculations, taking into account that two elastic constants were obtained using minimization procedures. The estimation of errors in determining elastic constants is carried out. As a self check, the proposed method was tested on a well-studied sample of a liquid crystal (5CB). For this sample, good agreement was achieved between the known values of the elastic constants and the values calculated numerically.
The paper is organized as follows.
Section 2 describes the sample under investigation, experimental setup, and the measurement procedure.
Section 3 presents the general equations for the free energy of the liquid crystal cell in external electric and magnetic fields. In this section, the expression for the sample permittivity is obtained. In
Section 4 variational method for numerical simulations is described.
Section 5 contains results for the director distribution in the cell obtained by direct minimization of the free energy. In this section, we obtain the best values for the Frank elastic constants for the lanthanidomesogens and perform the error estimation. Finally, in
Section 6 we discuss the obtained results.
2. Materials and Methods
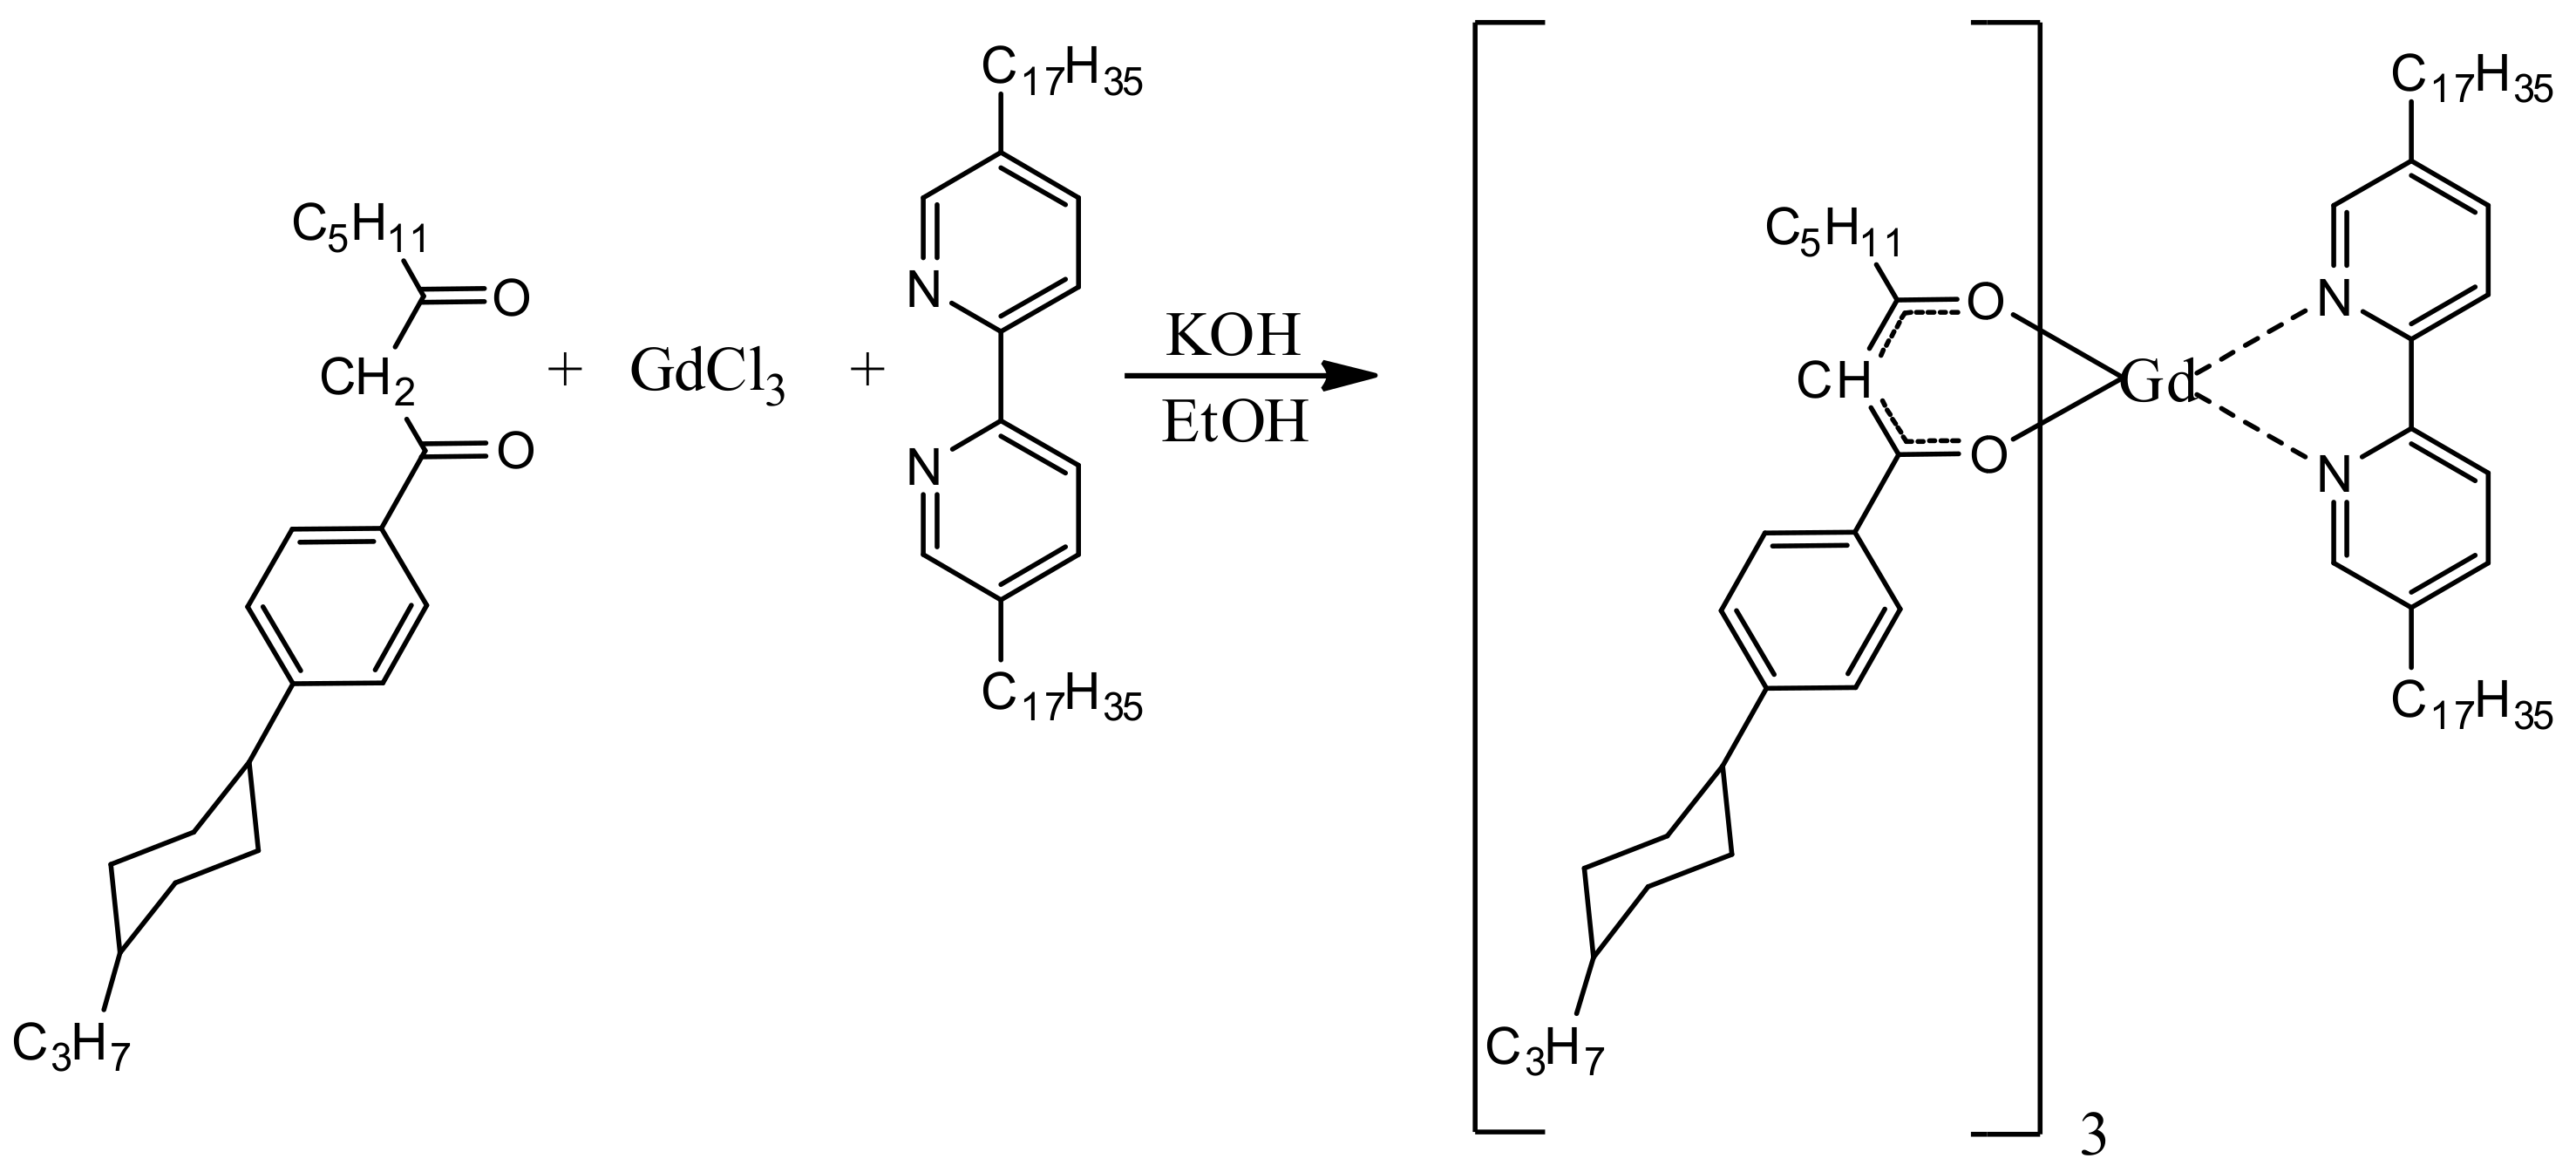
The object of the study was a liquid crystal (LC) complex tris[1-(4-(4-propylcyclohexyl)phenyl)octane-1,3-dion]-[5,5’-di(heptadecyl)-2,2’-bipyridine] gadolinium
which has been synthesized in Kazan National Research Technological University. The material was synthesized in Kazan National Research Technological University (KNRTU) by research group of professor Yu.G. Galyametdinov. The chemical structure and synthesis procedure of the investigated material are shown on
Figure 1. The general procedure for synthesis of nematic complexes of lanthanides is given in [
23].
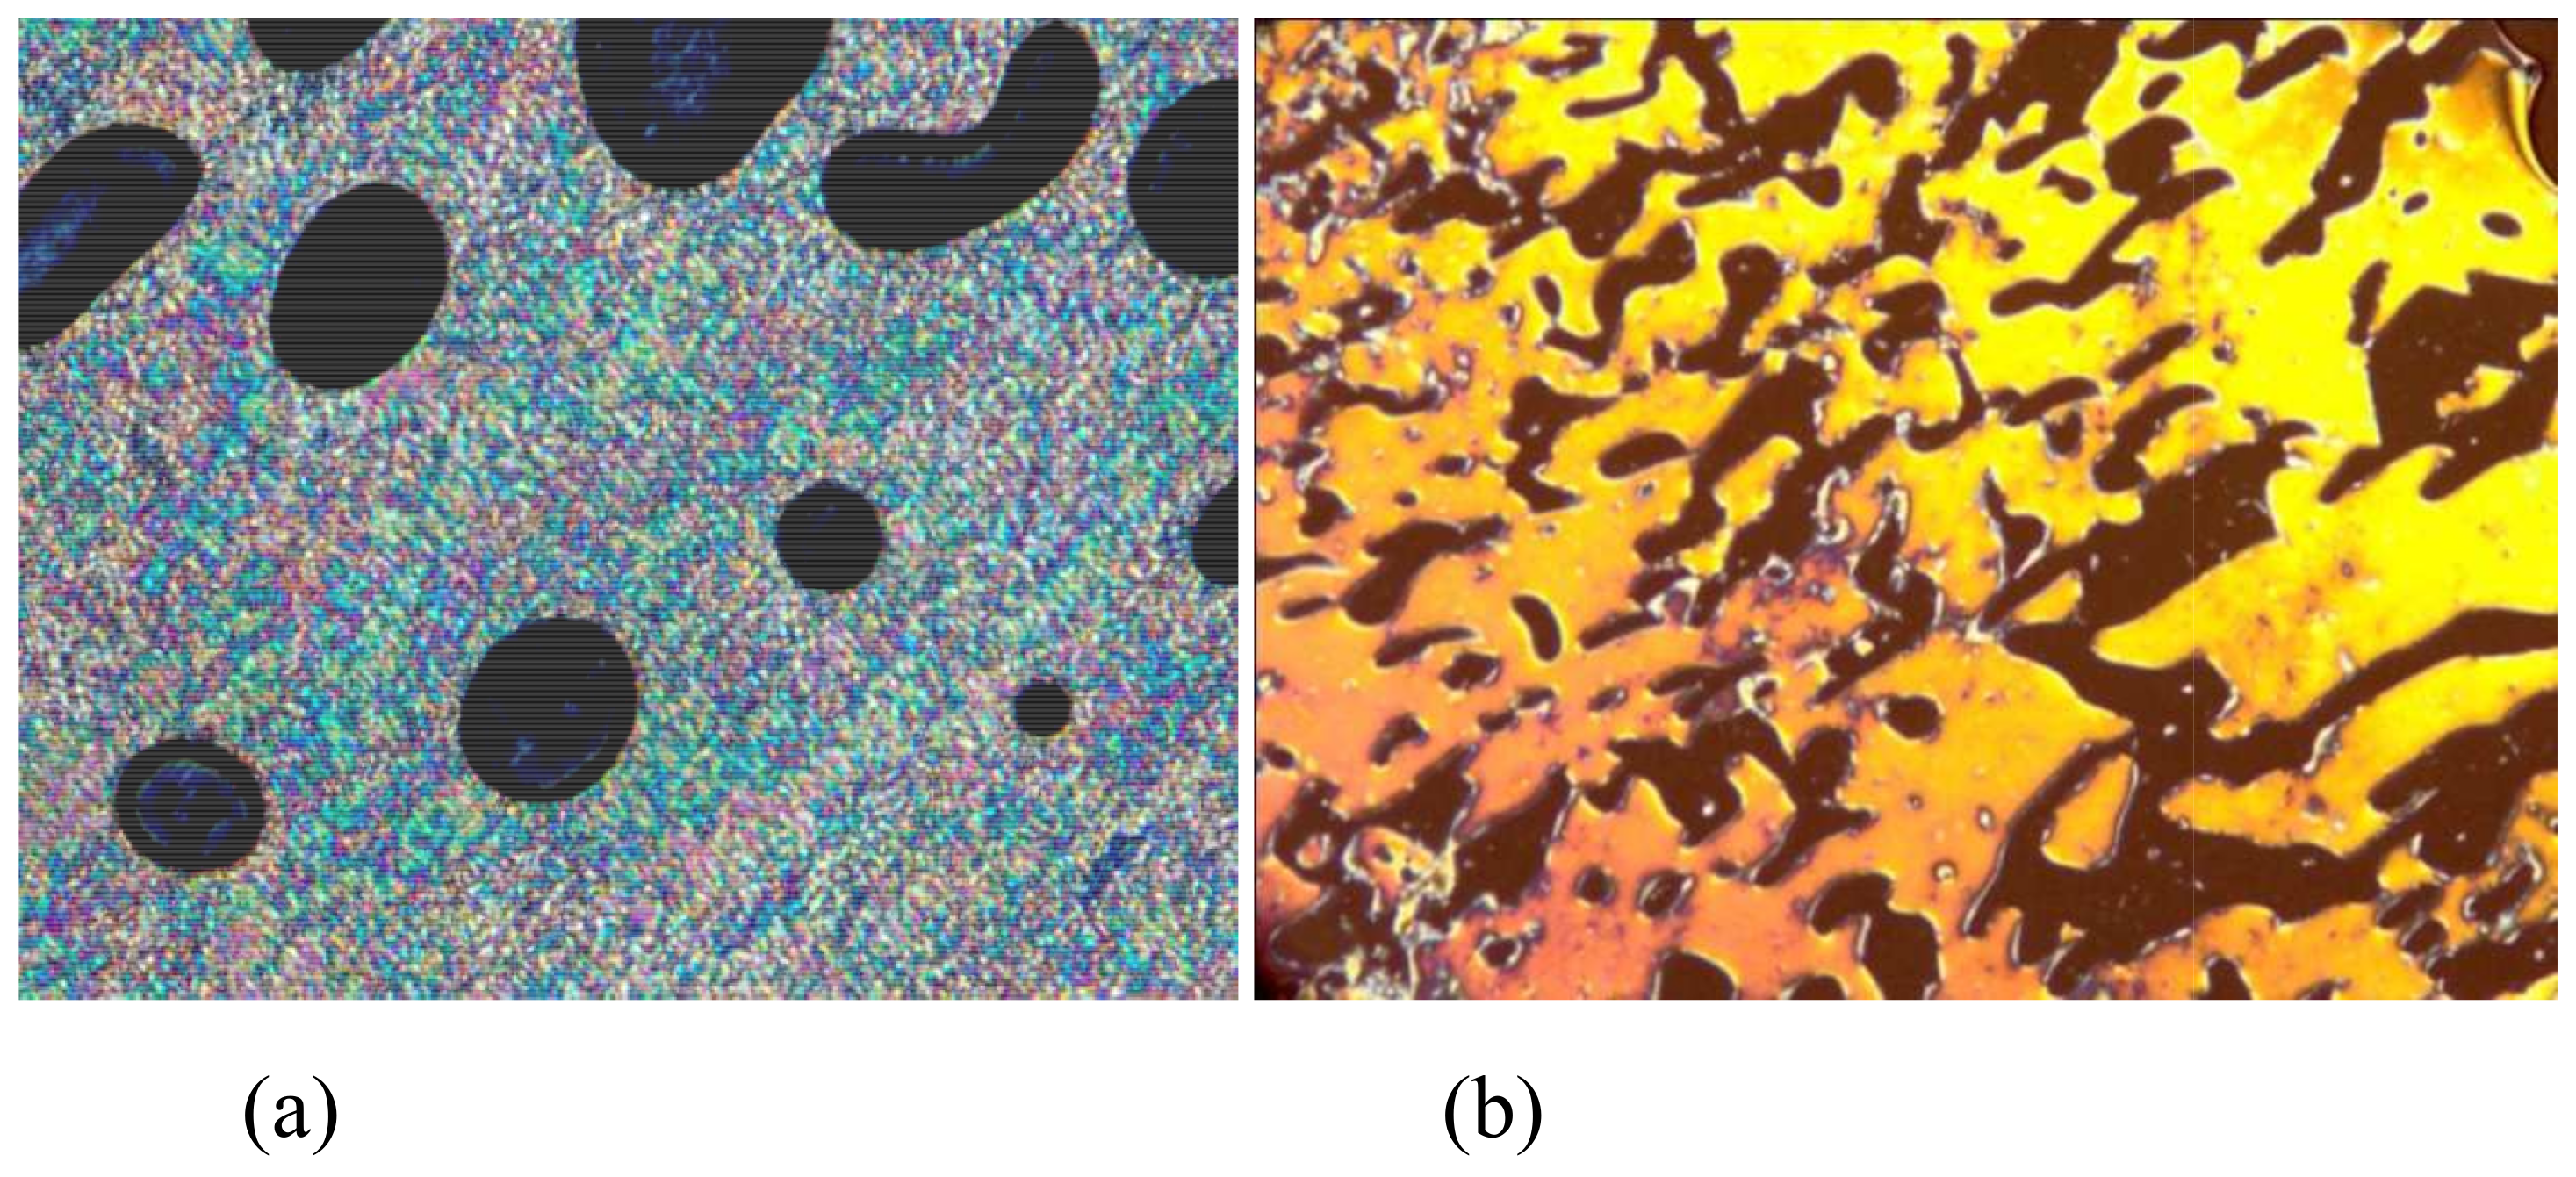
Upon heating, the gadolinium complex
exhibits smectic A and nematic polymorphism, which were observed by a polarizing microscope Olympus-BX51 (Olympus, Japan) (
Figure 2). Upon cooling, the complexes do not crystallize but the mesophase freezes into a glass, while maintaining the texture of the smectic A mesophase.
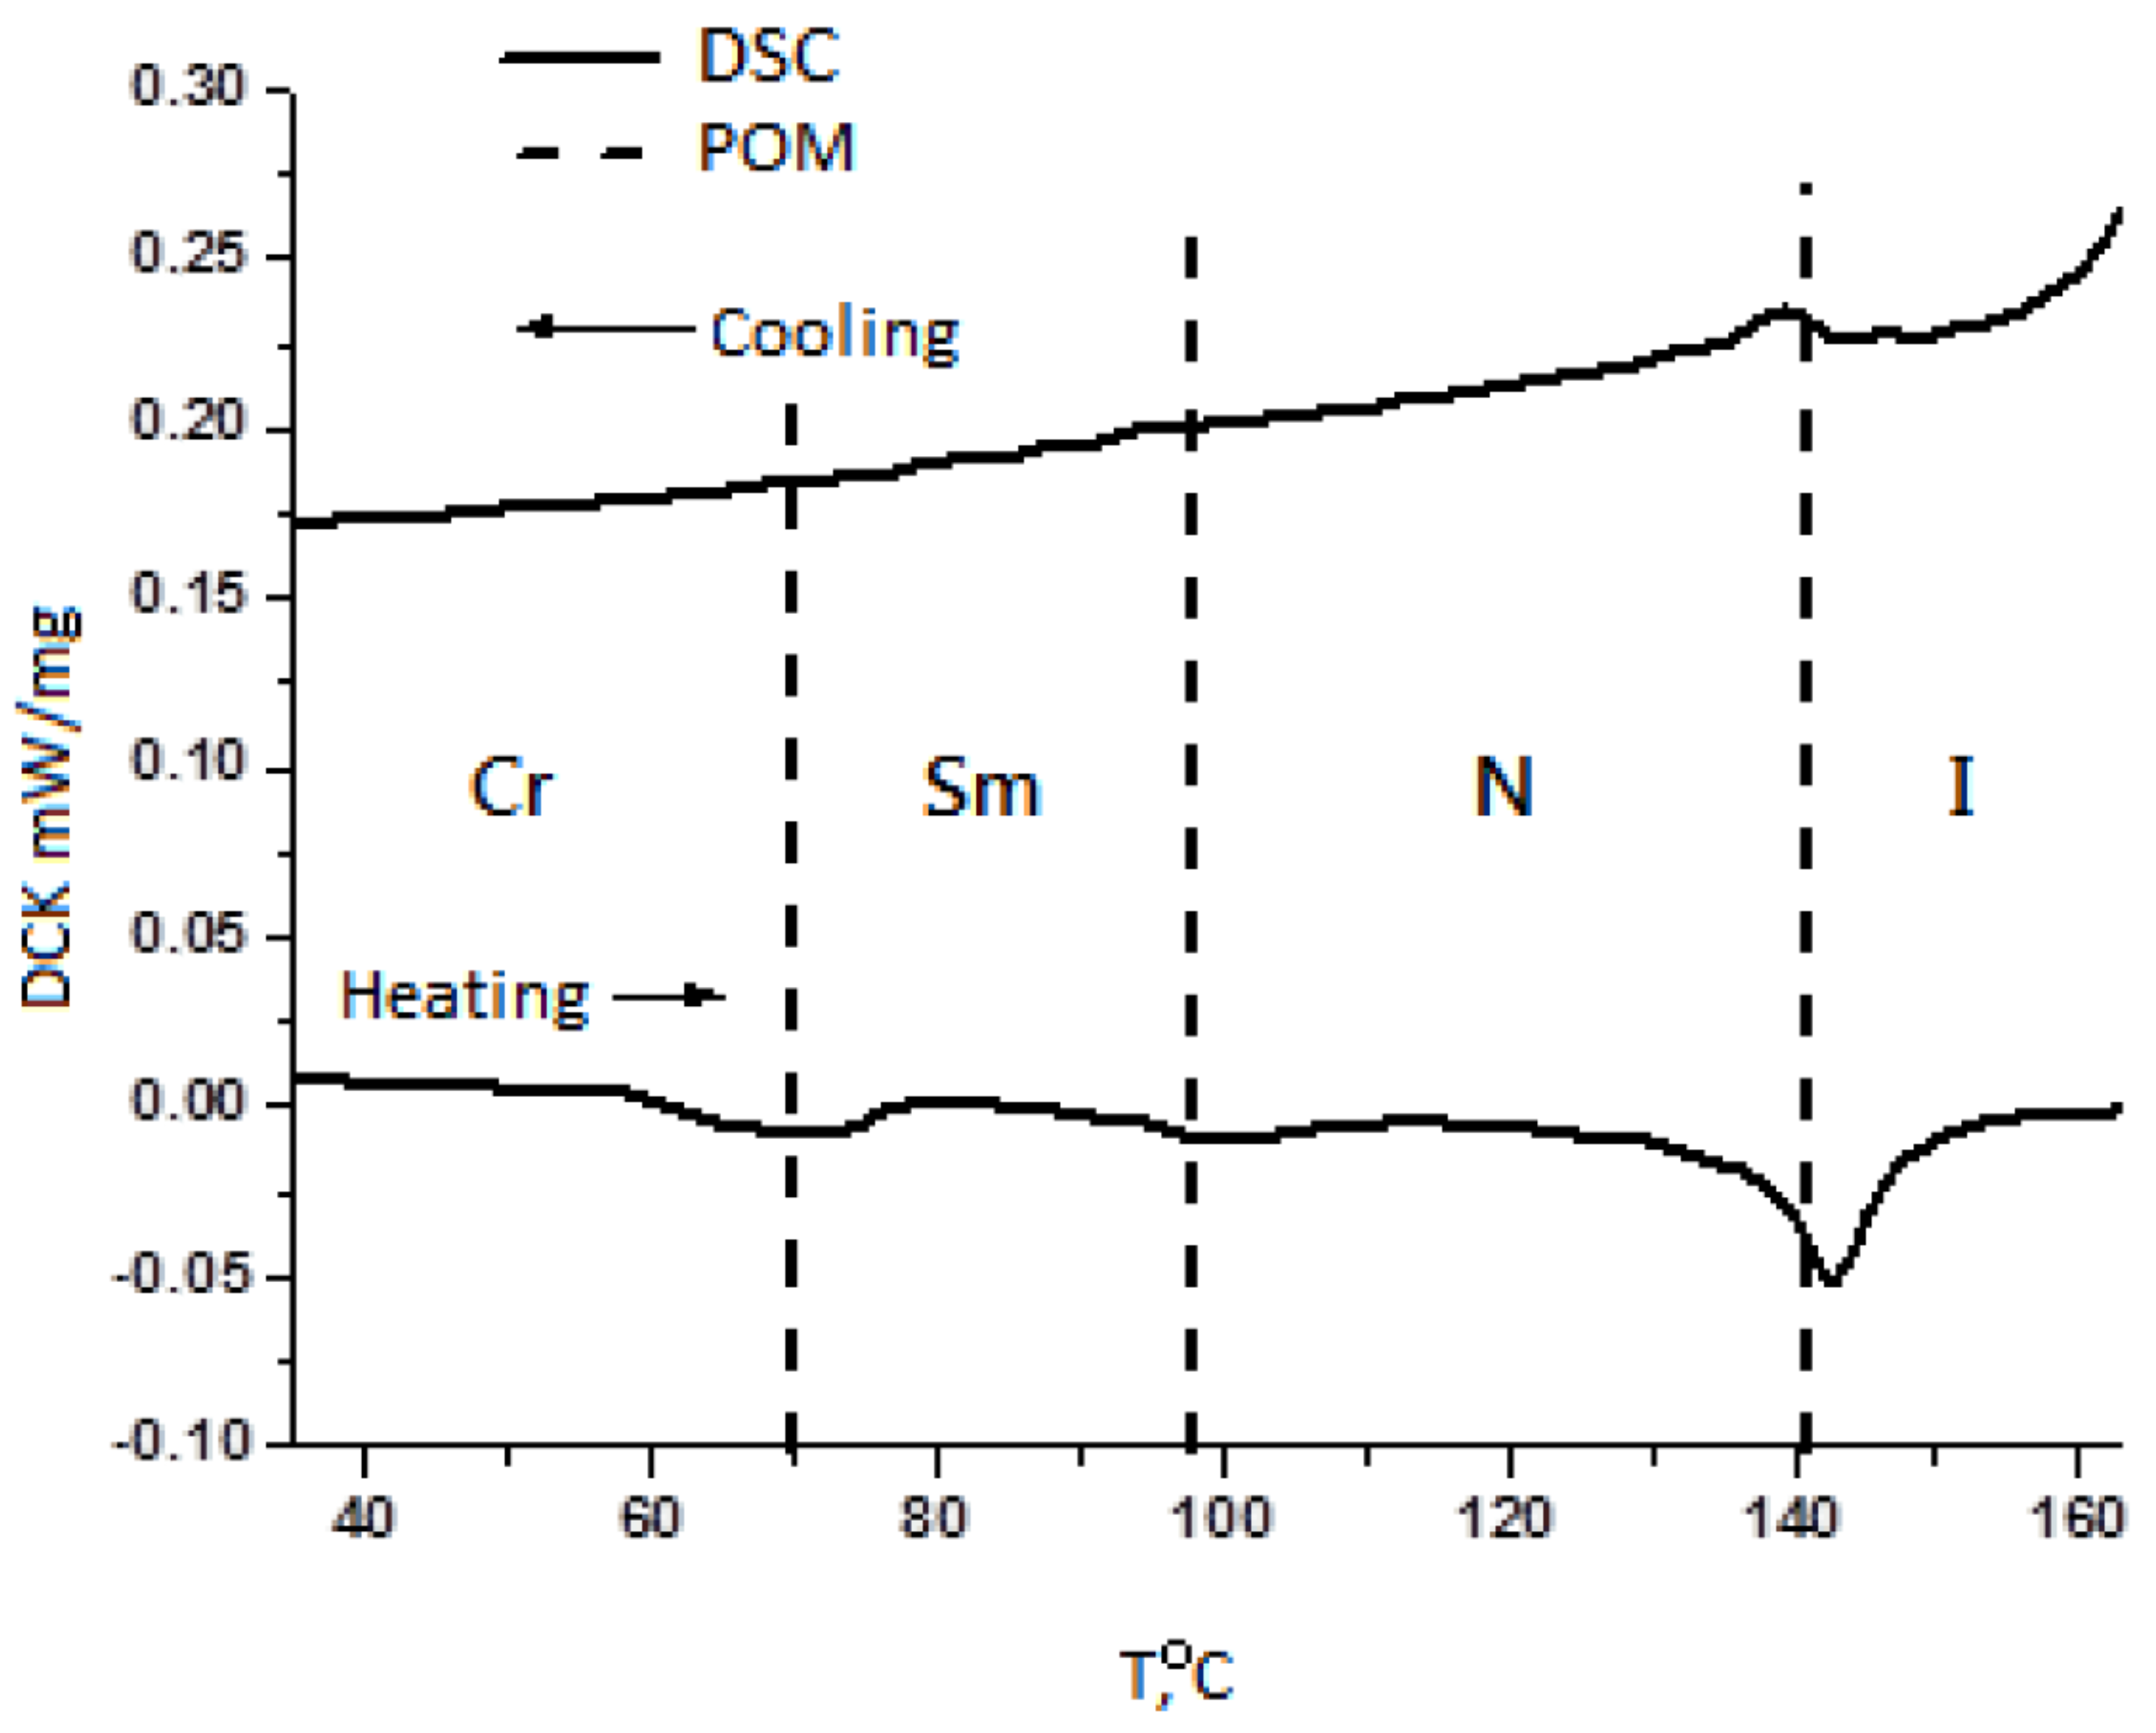
The temperatures of phase transition were determined using an Olympus-BX51 (Olympus, Japan) polarizing optical microscope with a Linkam heating system and differential scanning calorimeter DSC-1 Star system (Mettler-Toledo, Greifensee, Switzerland) in the heating and cooling mode at a scan rate of 10
C/min (
Figure 3).
The intervals of existence of smectic and nematic phases are 70–98
C and 98–141
C respectively. Polarized optical microscopy (POM) and differential scanning calorimetry (DSC) investigations were conducted by researchers from KNRTU [
23,
24].
The anisotropy of the magnetic susceptibility of the complex was measured in Technical University Darmstadt by research group of professors W. Haase. The object of study was cooled from an isotropic melt in the presence of a magnetic field. In this case, the total magnetic moment of the substance increased due to the ordering of the molecules under the action of an external magnetic field. The anisotropy of the magnetic susceptibility was found from the difference in the values of the effective magnetic moment in the ordered and disordered states using Faraday weights. The value of anisotropy of the magnetic susceptibility
for the gadolinium complex
is
[
24,
25].
The anisotropy of the magnetic susceptibility of the complex (
) was measured using the Faraday method [
24,
25].
The positive sign of
was determined via optical birefringence measurements in a magnetic field (Cotton–Mouton effect) [
26].
In this case () the direction of the greatest magnetic susceptibility and the director of the coincide with the direction of the orienting magnetic field.
To analyze the degree of homogeneity of the orientation of
in a magnetic field, the capacitance method was used [
27,
28]. The degree of homogeneity of the orientation under the action of external fields is accompanied by a change in the electrical capacity of the cells under study. Measuring the capacitance of liquid crystal cells at different magnetic field strengths
allows us to record the results of the field effect on the degree of homogeneity of the orientation in the sample under study.
The measuring cell was a flat titanium capacitor with a capacity of 12 pF and an electrode spacing of
d = 200
. Capacitance measurements were performed using an RLC-Meter HIOKI-3532 at the frequency of
Hz at which the components of the dielectric permittivity
have quasistatic values [
29]. A probing voltage
U was used 1 V because the dielectric permittivity does not depend on
U between 0.5 V and 2.0 V. Consequently in this range of
U the electric field does not affect the orientation of the complex [
29].
The components of dielectric permittivity and in directions parallel and perpendicular to the axis of the preferred orientation of the molecules in the cell was calculated from the measured capacitance. The macroscopic alignment of the sample under study was created by the magnetic field of the electromagnet. The maximum magnitude of the magnetic field reached 7500 Oe.
The orientation of the nematic liquid crystal molecules in the plane perpendicular to the boundaries of the cell relative to the direction of the orienting magnetic field
and the probing electric field
is shown schematically on
Figure 4.
The temperature of the substance in the cell was maintained at 130 by a thermostat with an accuracy of 0.1 .
The effective dielectric permittivities of
were measured at various values of the orienting magnetic field in geometries shown on
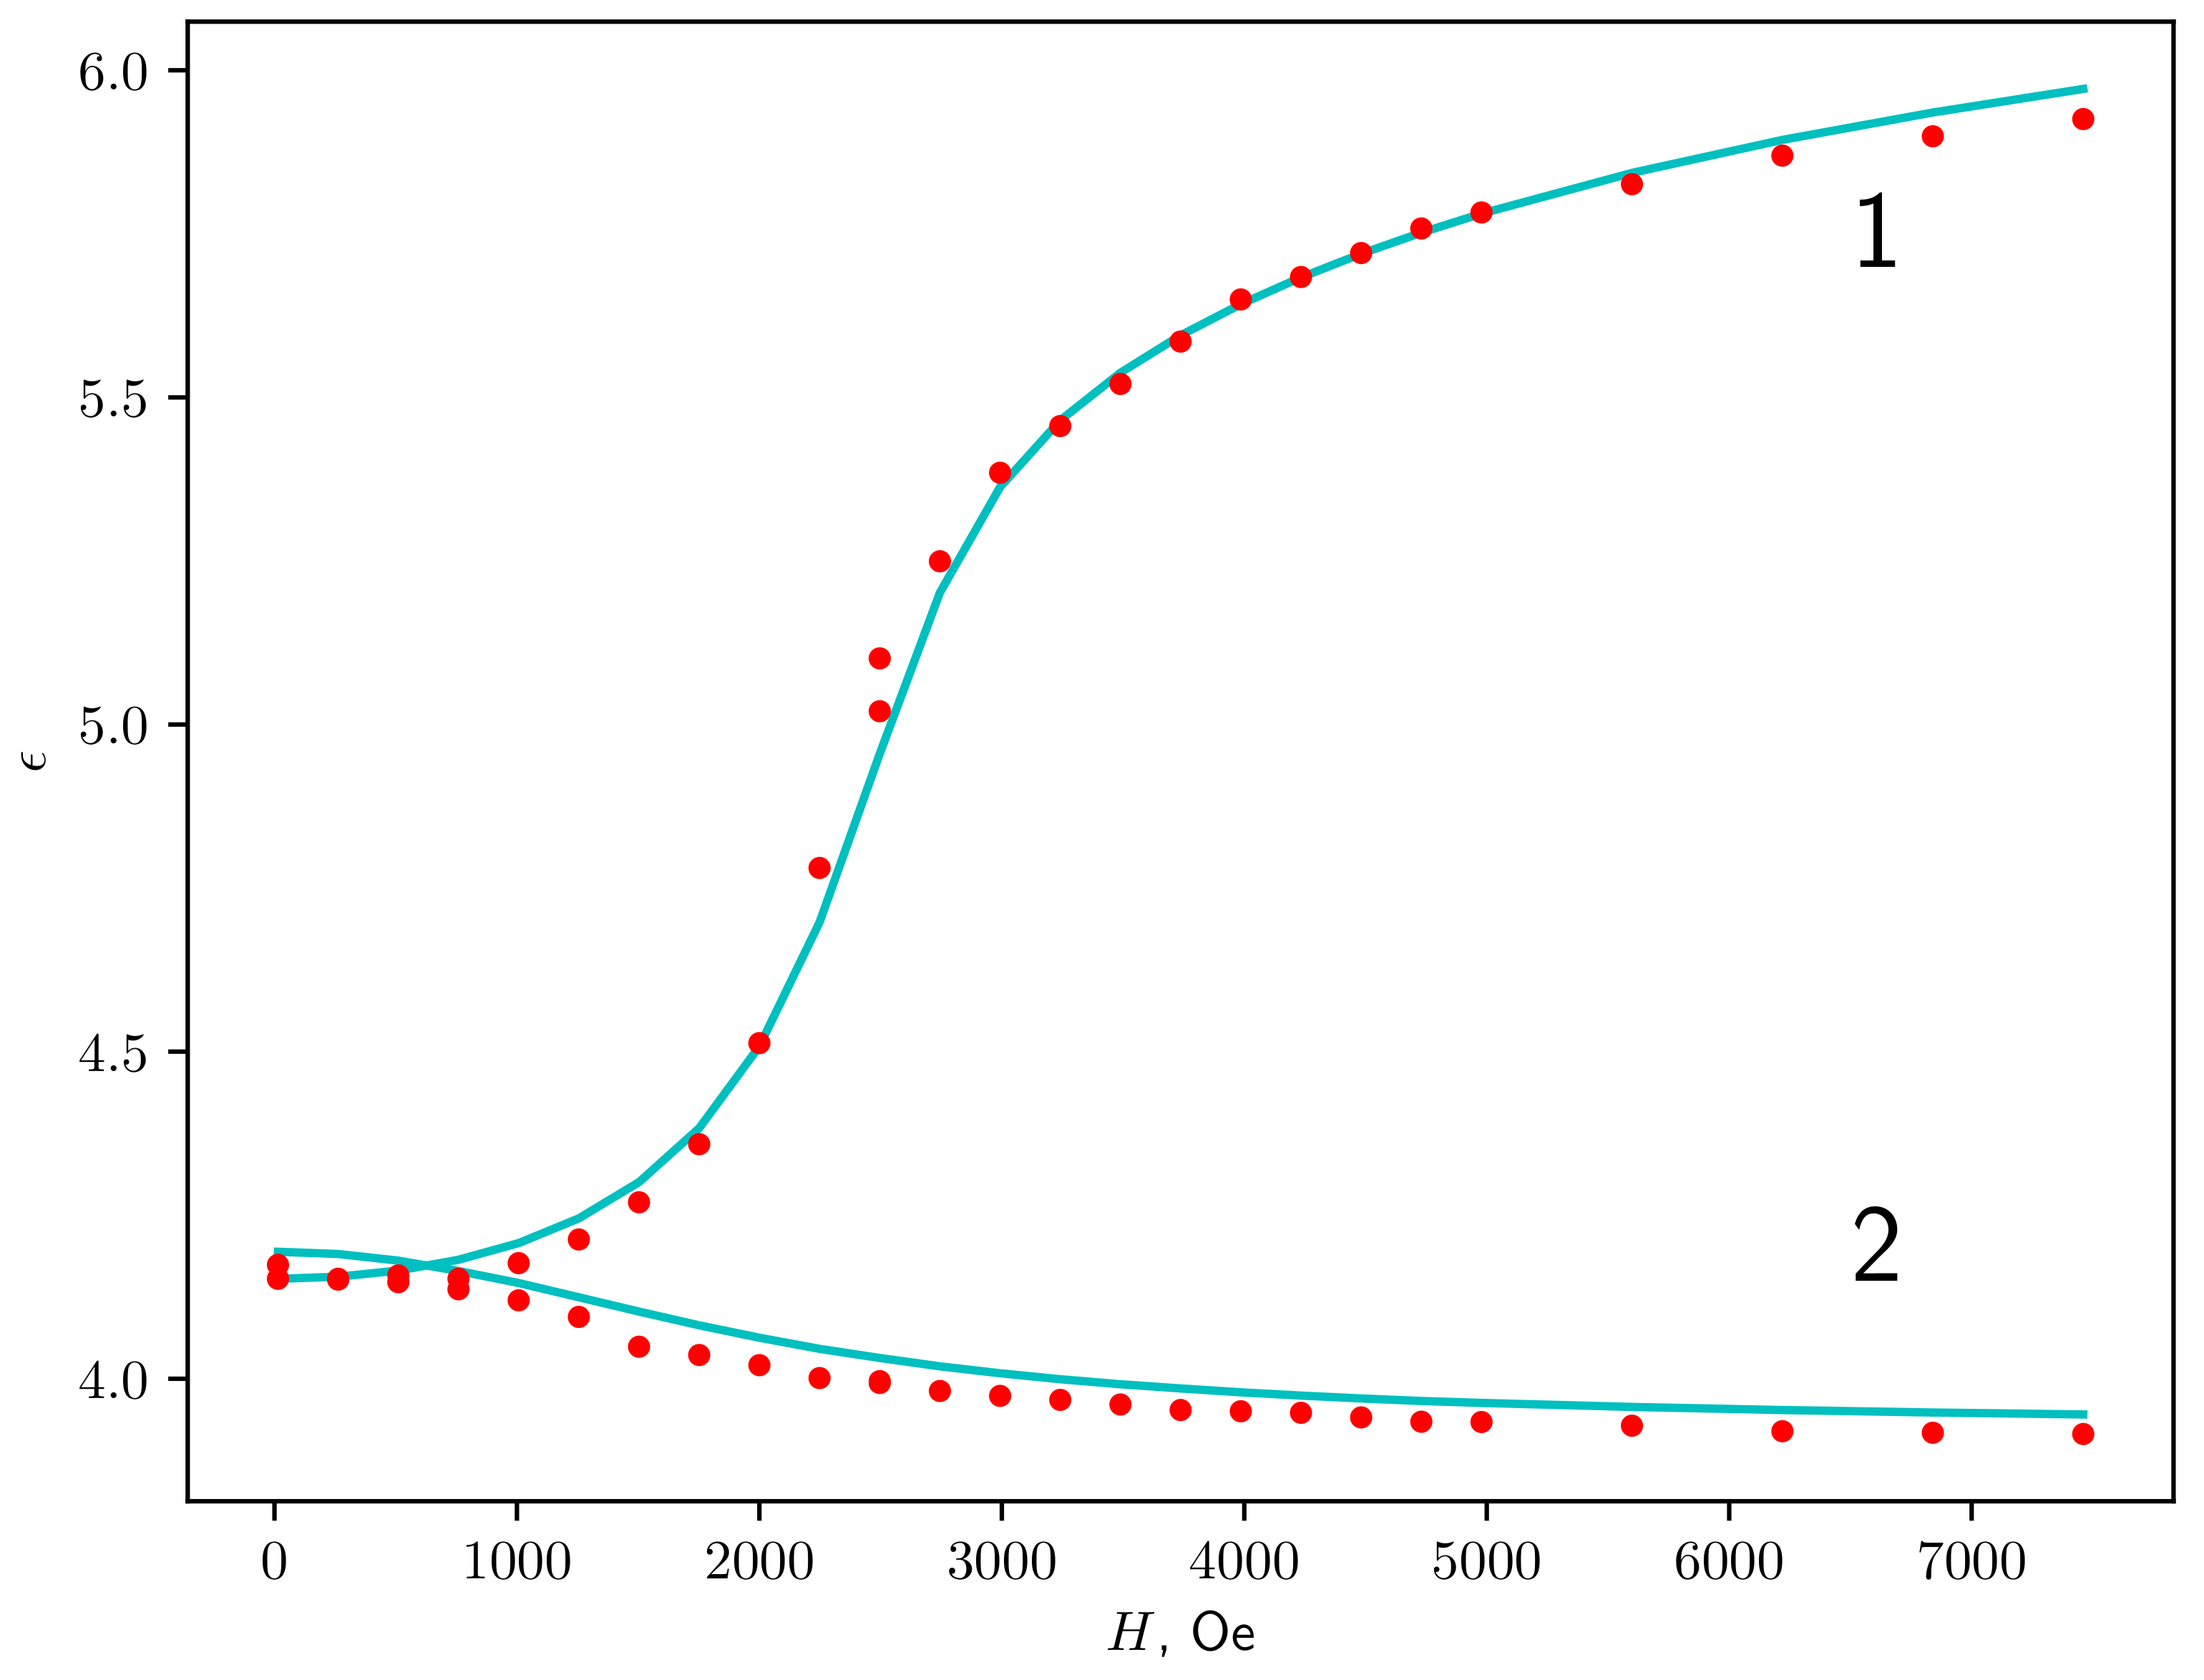
Figure 4. The dependencies of effective dielectric permittivities on the orienting magnetic field magnitude are presented on Figure 11 and will be discussed in
Section 5.
3. Theoretical Model
The effective permittivity
of the sample is dependent on the distribution of the director
throw the volume of the sample. That distribution can be found by solving the minimization problem on the free energy
F. The energy is determined by its density
in each point of the sample volume
V and the surface interaction contribution, that was considered with both weak and strong anchoring models with nonzero pretilt angle.
The free energy density consists of elastic and field contributions
. First describes internal interactions and is given by [
4]
where
,
,
are Frank elastic constants, which describe the elastic properties of the material. The second is given by
where
is electric field,
is magnetic field,
is anisotropy of susceptibility, and
is anisotropy of permittivity;
are permittivities along and across
.
The idea that the director remains the same in the plane of constant height in the sample leads us to
where
S is the square of the capacitor plate surface, and
z is integrating variable going from bottom to the top of the cell with a height
d.
For the materials with
the director in the sample may be described with the
angle only [
5]. Than, using the transformation of the contribution due to the electric field to the dependence on voltage [
30] we can obtain
where sign “−” in “∓” corresponds to
and sign “+” corresponds to
. The effective sample permittivity is related to the director through the
angle
To set the minimization task, it is necessary to add boundary conditions. In what follows, we assume that the surfaces bounding the sample at planes and are the same. Therefore, the boundary conditions on these surfaces are also considered the same. In this paper, we consider both the strong
and weak coupling models, which is defined by adding to the energy density (
5) the following term
where
k is the coupling coefficient and
is the pretilt angle on the surfaces of the sample. Note, models with zero initial angle
showed their inconsistency (see more details in
Section 5). The above contribution is similar to the anchoring potential introduced by Rapini and Papoular [
16].
For the case it is easily seen that
Here the boundary conditions allow making the director the same through the whole sample. The same situation takes place for
Then, using Equation (
6) we have
That leads us to the condition on
:
where
is permittivity of a sample in absence of electric and magnetic fields. As the electric field in our experiment is chosen so that it does not affect to orientation of the director we can estimate the pretilt angle
from the measurement for zero
H and nonzero
E.
Now we can set the problem of minimization of the functional (
4) with boundary conditions (
7) or surface energy density (
8). The minimum of the free energy gives us the profile of the director, i.e., the dependence
. That will lead us to the dependence of
on
H with the system parameters
and
. This problem was solved numerically for various parameters
,
for the set of experimental values of the magnetic field
H.
Note that the proposed model makes it possible to study the behavior of the system at various temperatures. Indeed, in functional (
4), the temperature functions are the permittivities, anisotropy of magnetic susceptibility, and Frank elastic constants. The dependence of the Frank elastic constants on temperature has both experimental and theoretical confirmations. For example, in the well-known molecular statistical model of hard rods, the temperature dependences of the Frank elastic constants were obtained quite a long time ago [
31,
32]. The experimental results on determining the temperature dependences of the Frank constants or their relations are also well known. For example, for the cyanobiphenyl family, one of whose homologues we will use as a model system, these results were obtained by the Rayleigh light scattering methods [
33], capacitance detection of the Fréedericksz transition [
34], and optical transmission method [
35]. It should be noted that there is a significant limitation in the study of the temperature dependences of the Frank elastic constants. As a rule, most theoretical models and experimental methods do not work well near phase transition points. The same applies to the model under consideration. Far from the phase transition points, this model allows one to obtain information on the values of Frank elastic constants at various temperatures in those cases when the values of permittivity and anisotropy of magnetic susceptibility at these temperatures are known.
4. Numerical Calculations
The first step of the numerical task was to find the dependence of
on
z for various values of magnetic fields. The solution was found by approximation with a cubic spline. The direct numerical solution of the minimization problem has an advantage over the corresponding problem of finding a solution using the Euler–Lagrange equation [
6], since it does not require the calculation of the second derivative, which requires additional accuracy of calculations. Moreover, the soft boundary conditions are naturally implemented in the direct minimization problem method while they are represented as the special boundary problem which requires additional computations for the Euler–Lagrange equation.
A feature of this minimization problem is the presence of at least two minima. For example, for
we have trivial solution
for any field, and a non-trivial solution only for a field above the threshold value. The trivial solution gives us local, but not global minimum for the field above the threshold. This problem is especially acute when the field is close to critical. The task of searching for a global minimum was solved using the basin-hopping [
36] method which represents a genetic algorithm for searching for the multidimensional global minimum.
The position and amount of the control points for the cubic spline are defined by the adaptive way. The initial configuration of the control points was uniformly distributed with the amount of 5. New points were set in the centre of the interval where the ratio of the maximum derivative to the interval length was maximum. The criterion for reaching the necessary number of points is the insignificance of impact for implementing additional points in .
The second step was to find a theoretical dependence of on H that is the closest to the experimental one. The least squares root (LSR) method was chosen as the minimum criterion
where the summation is carried out over all
N points of the experimental dependence
on the field
H and
is the numerical value calculated for this field. Using the criterion (
13) we find the values
and
giving the smallest deviation from the experimental data.
Thus, two minimization problems are solved sequentially, one for finding , and the second one for the best , according to the experimental results.
5. Results
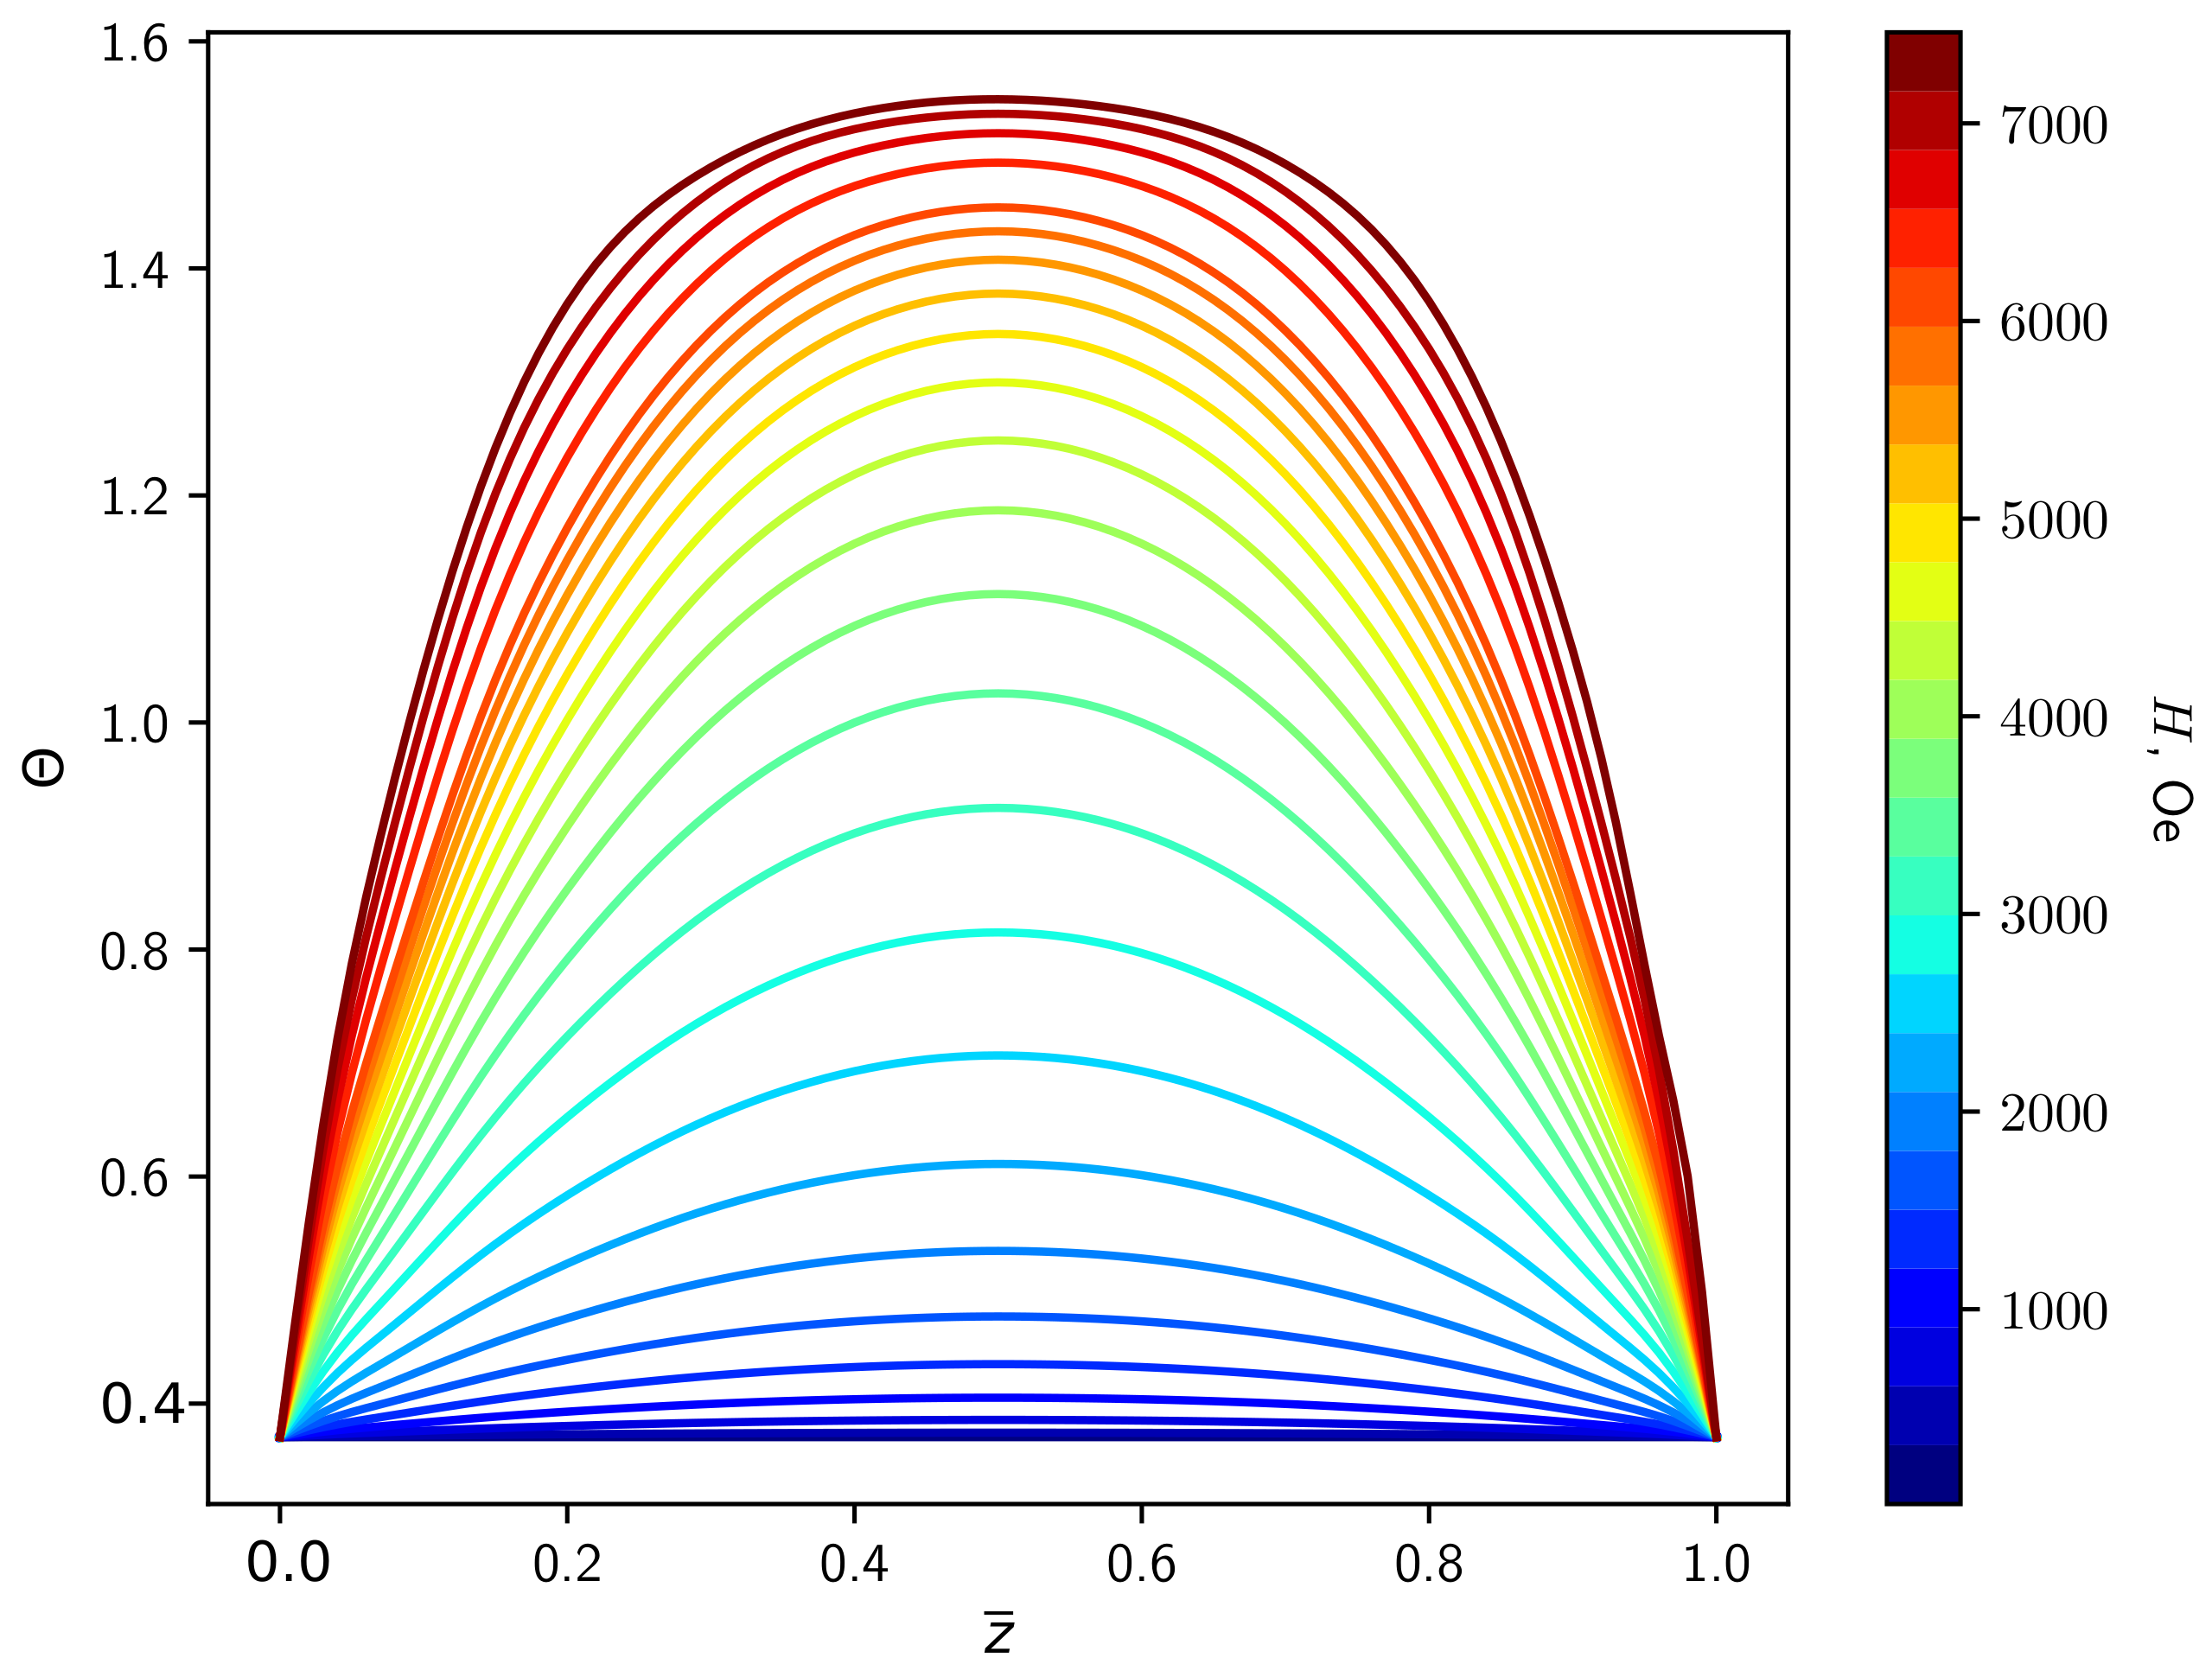
For the first part of the calculations we obtain the profile of
, where
.
Figure 5 illustrates this dependence for different values of magnetic field for the
case.
This dependence was obtained for elastic constants
,
given by the minimization procedure on the second step of numerical calculations. The boundary conditions are defined by Equations (
7) and (
12).
The process of searching for the best
,
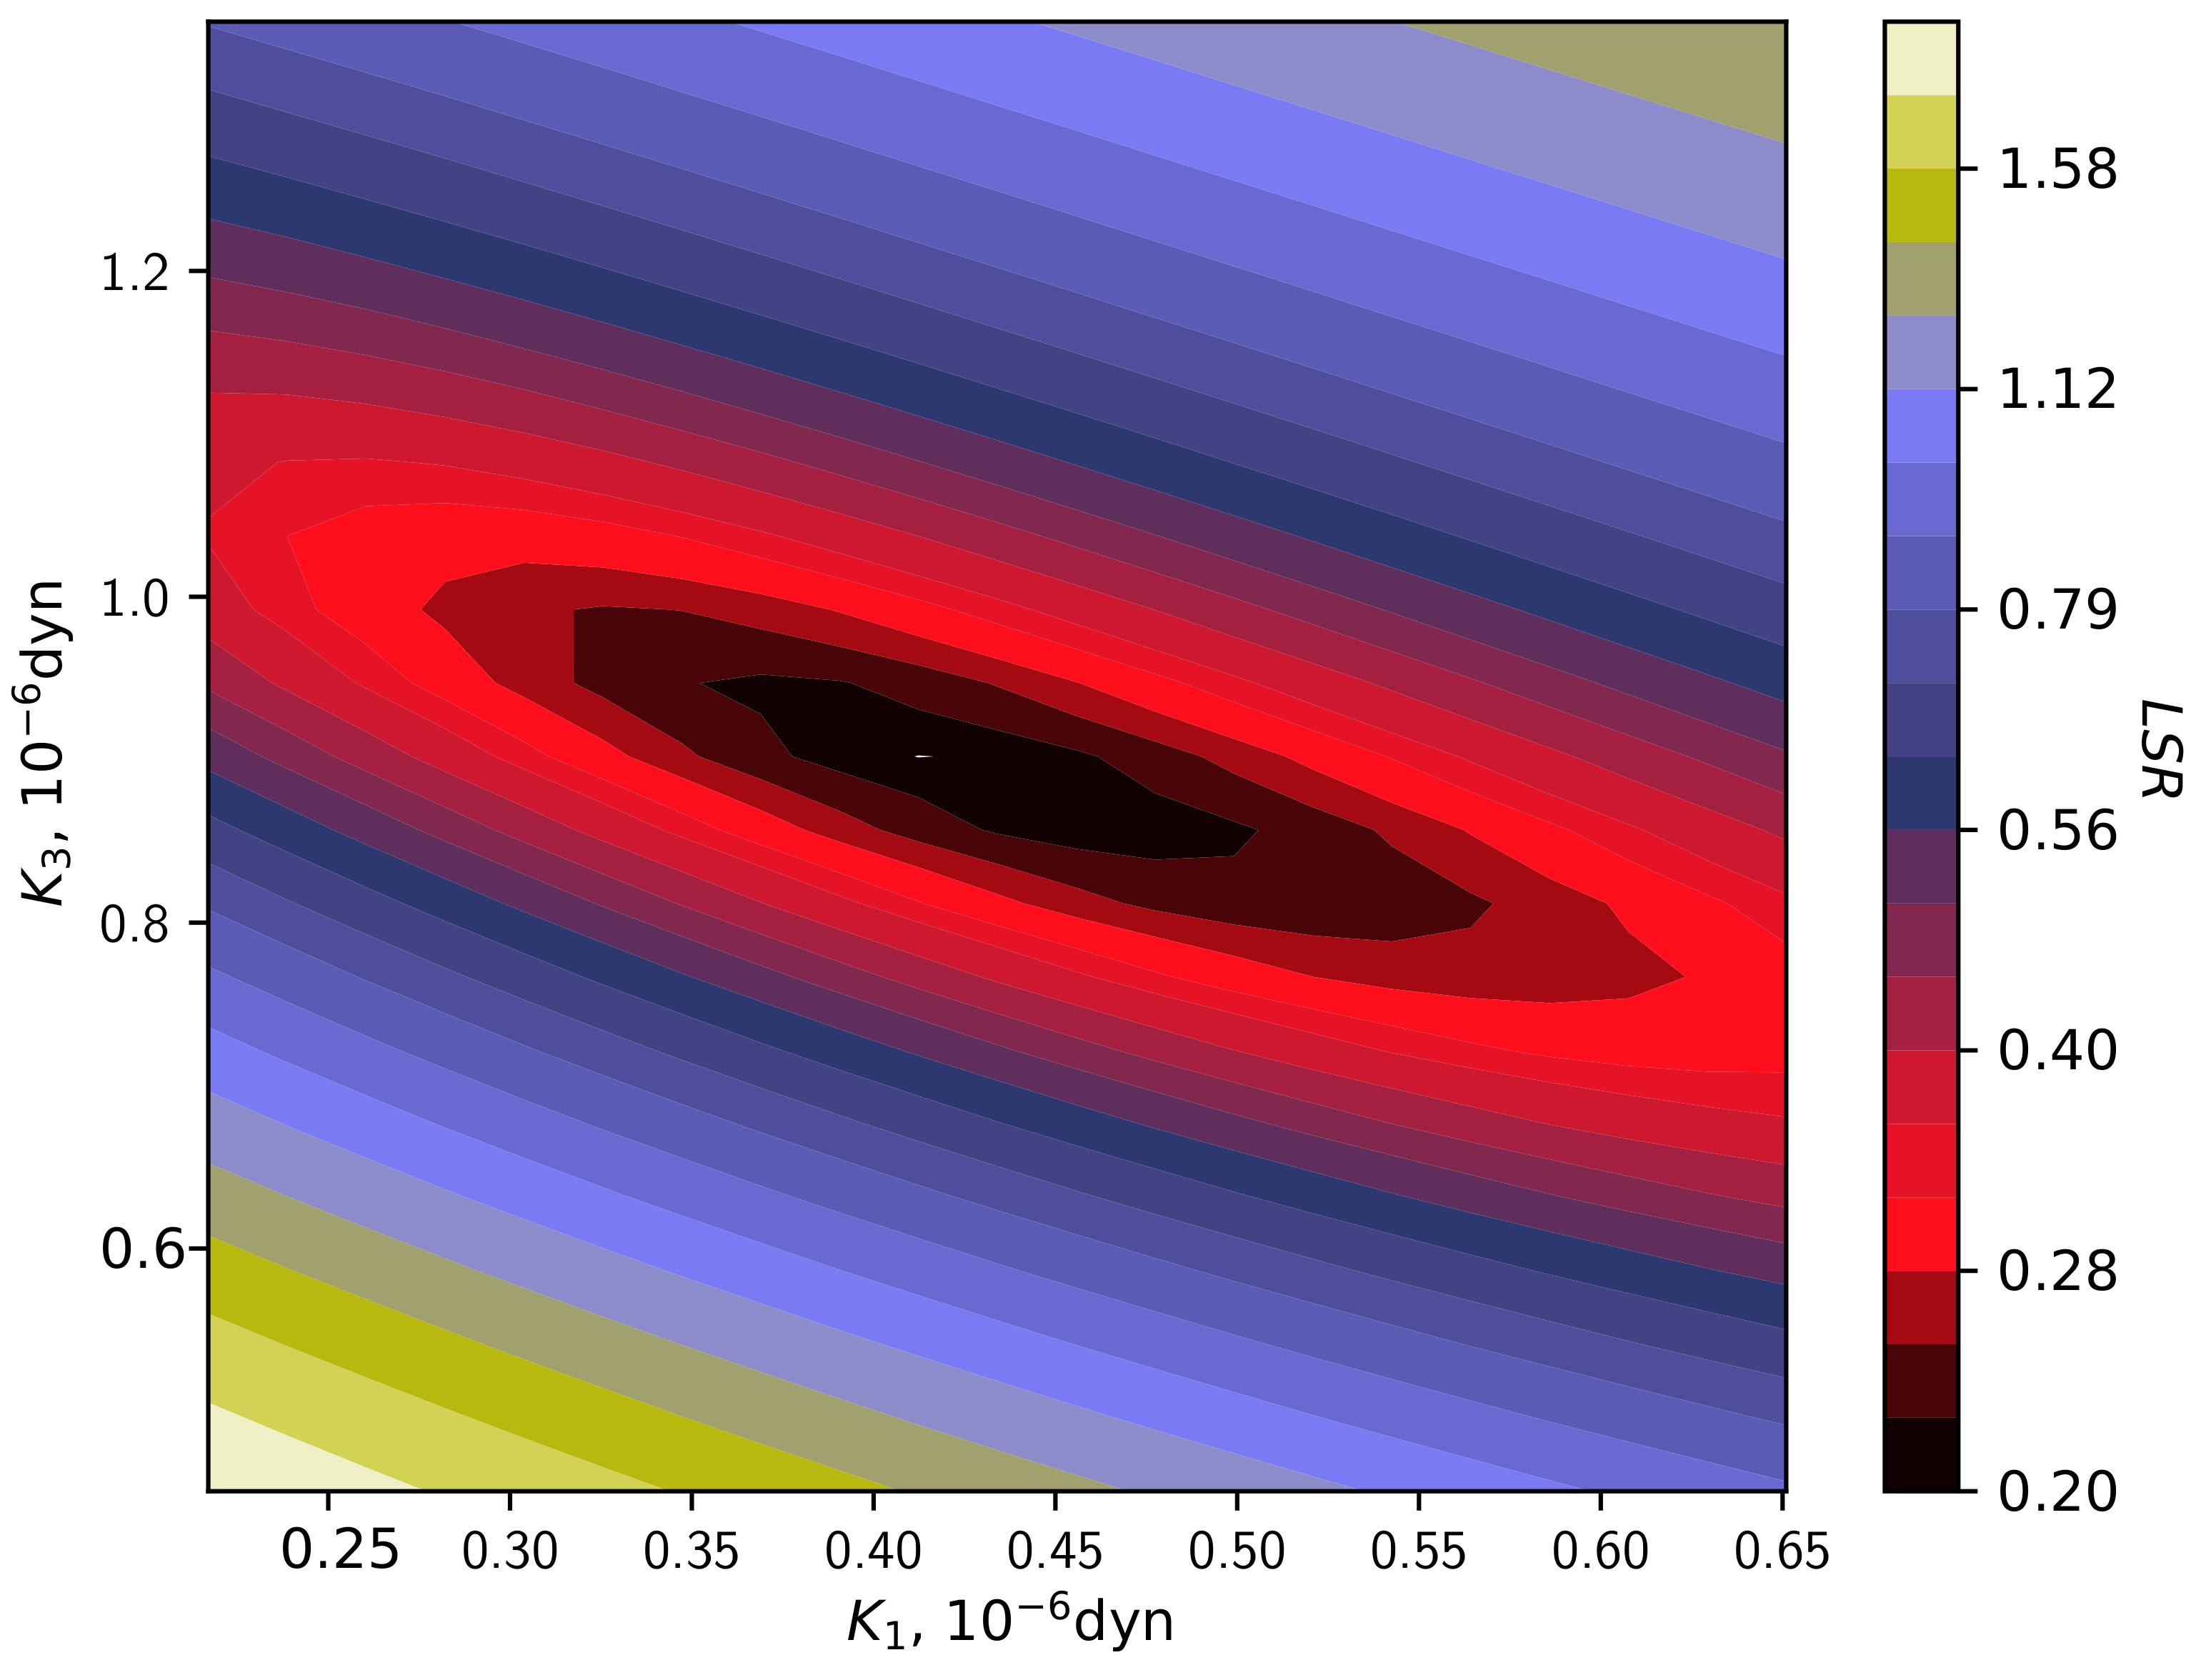
consists of obtaining the map for the LSR criterion (
13) for various elastic constants.
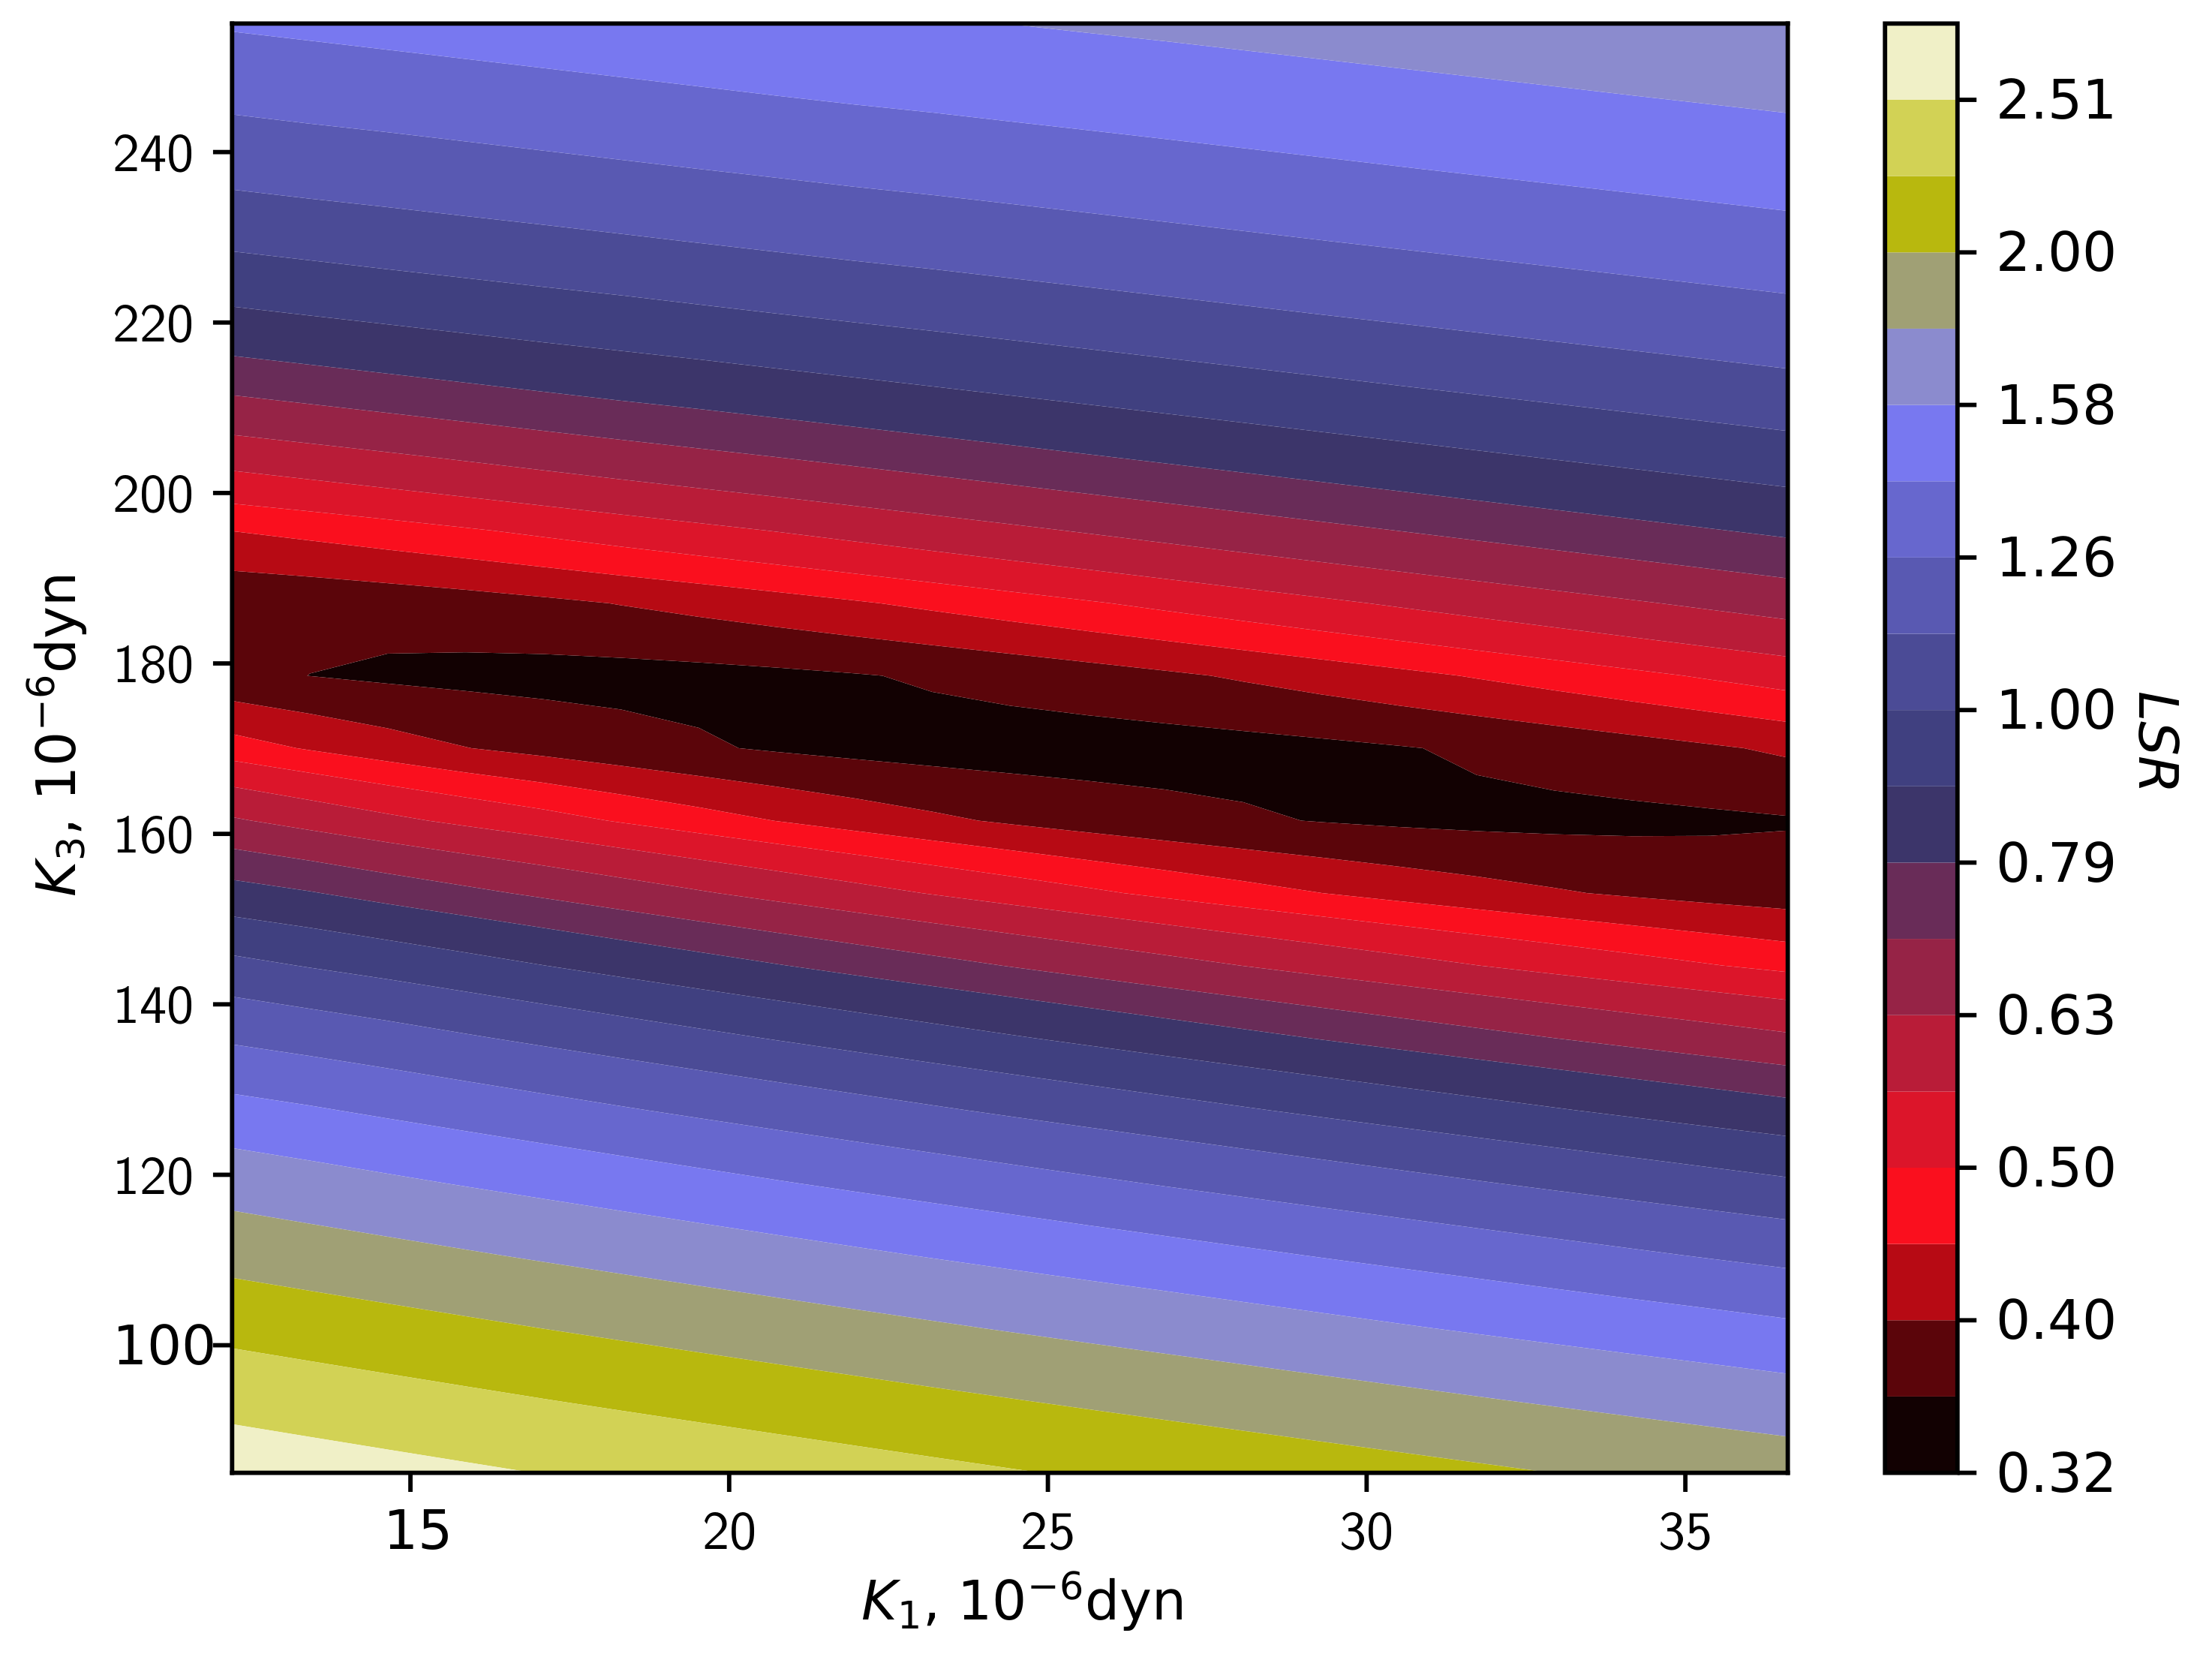
On
Figure 6 one can see the region with the lowest LSR results. This map was made using 1681 uniformly distributed points. The minimum point is
dyn,
dyn.
For the error estimation study the self check procedure was made. For this purpose the
dependence given by Equation (
6) was generated for the same set of
H as for experiment with lanthanide complex with given
dyn,
dyn, that correspond to the minimization results for Gd complex and
, that corresponds to the value of
for
. Suppose that we do not know the
and
for this dependence and try to find them by LSR criterion (
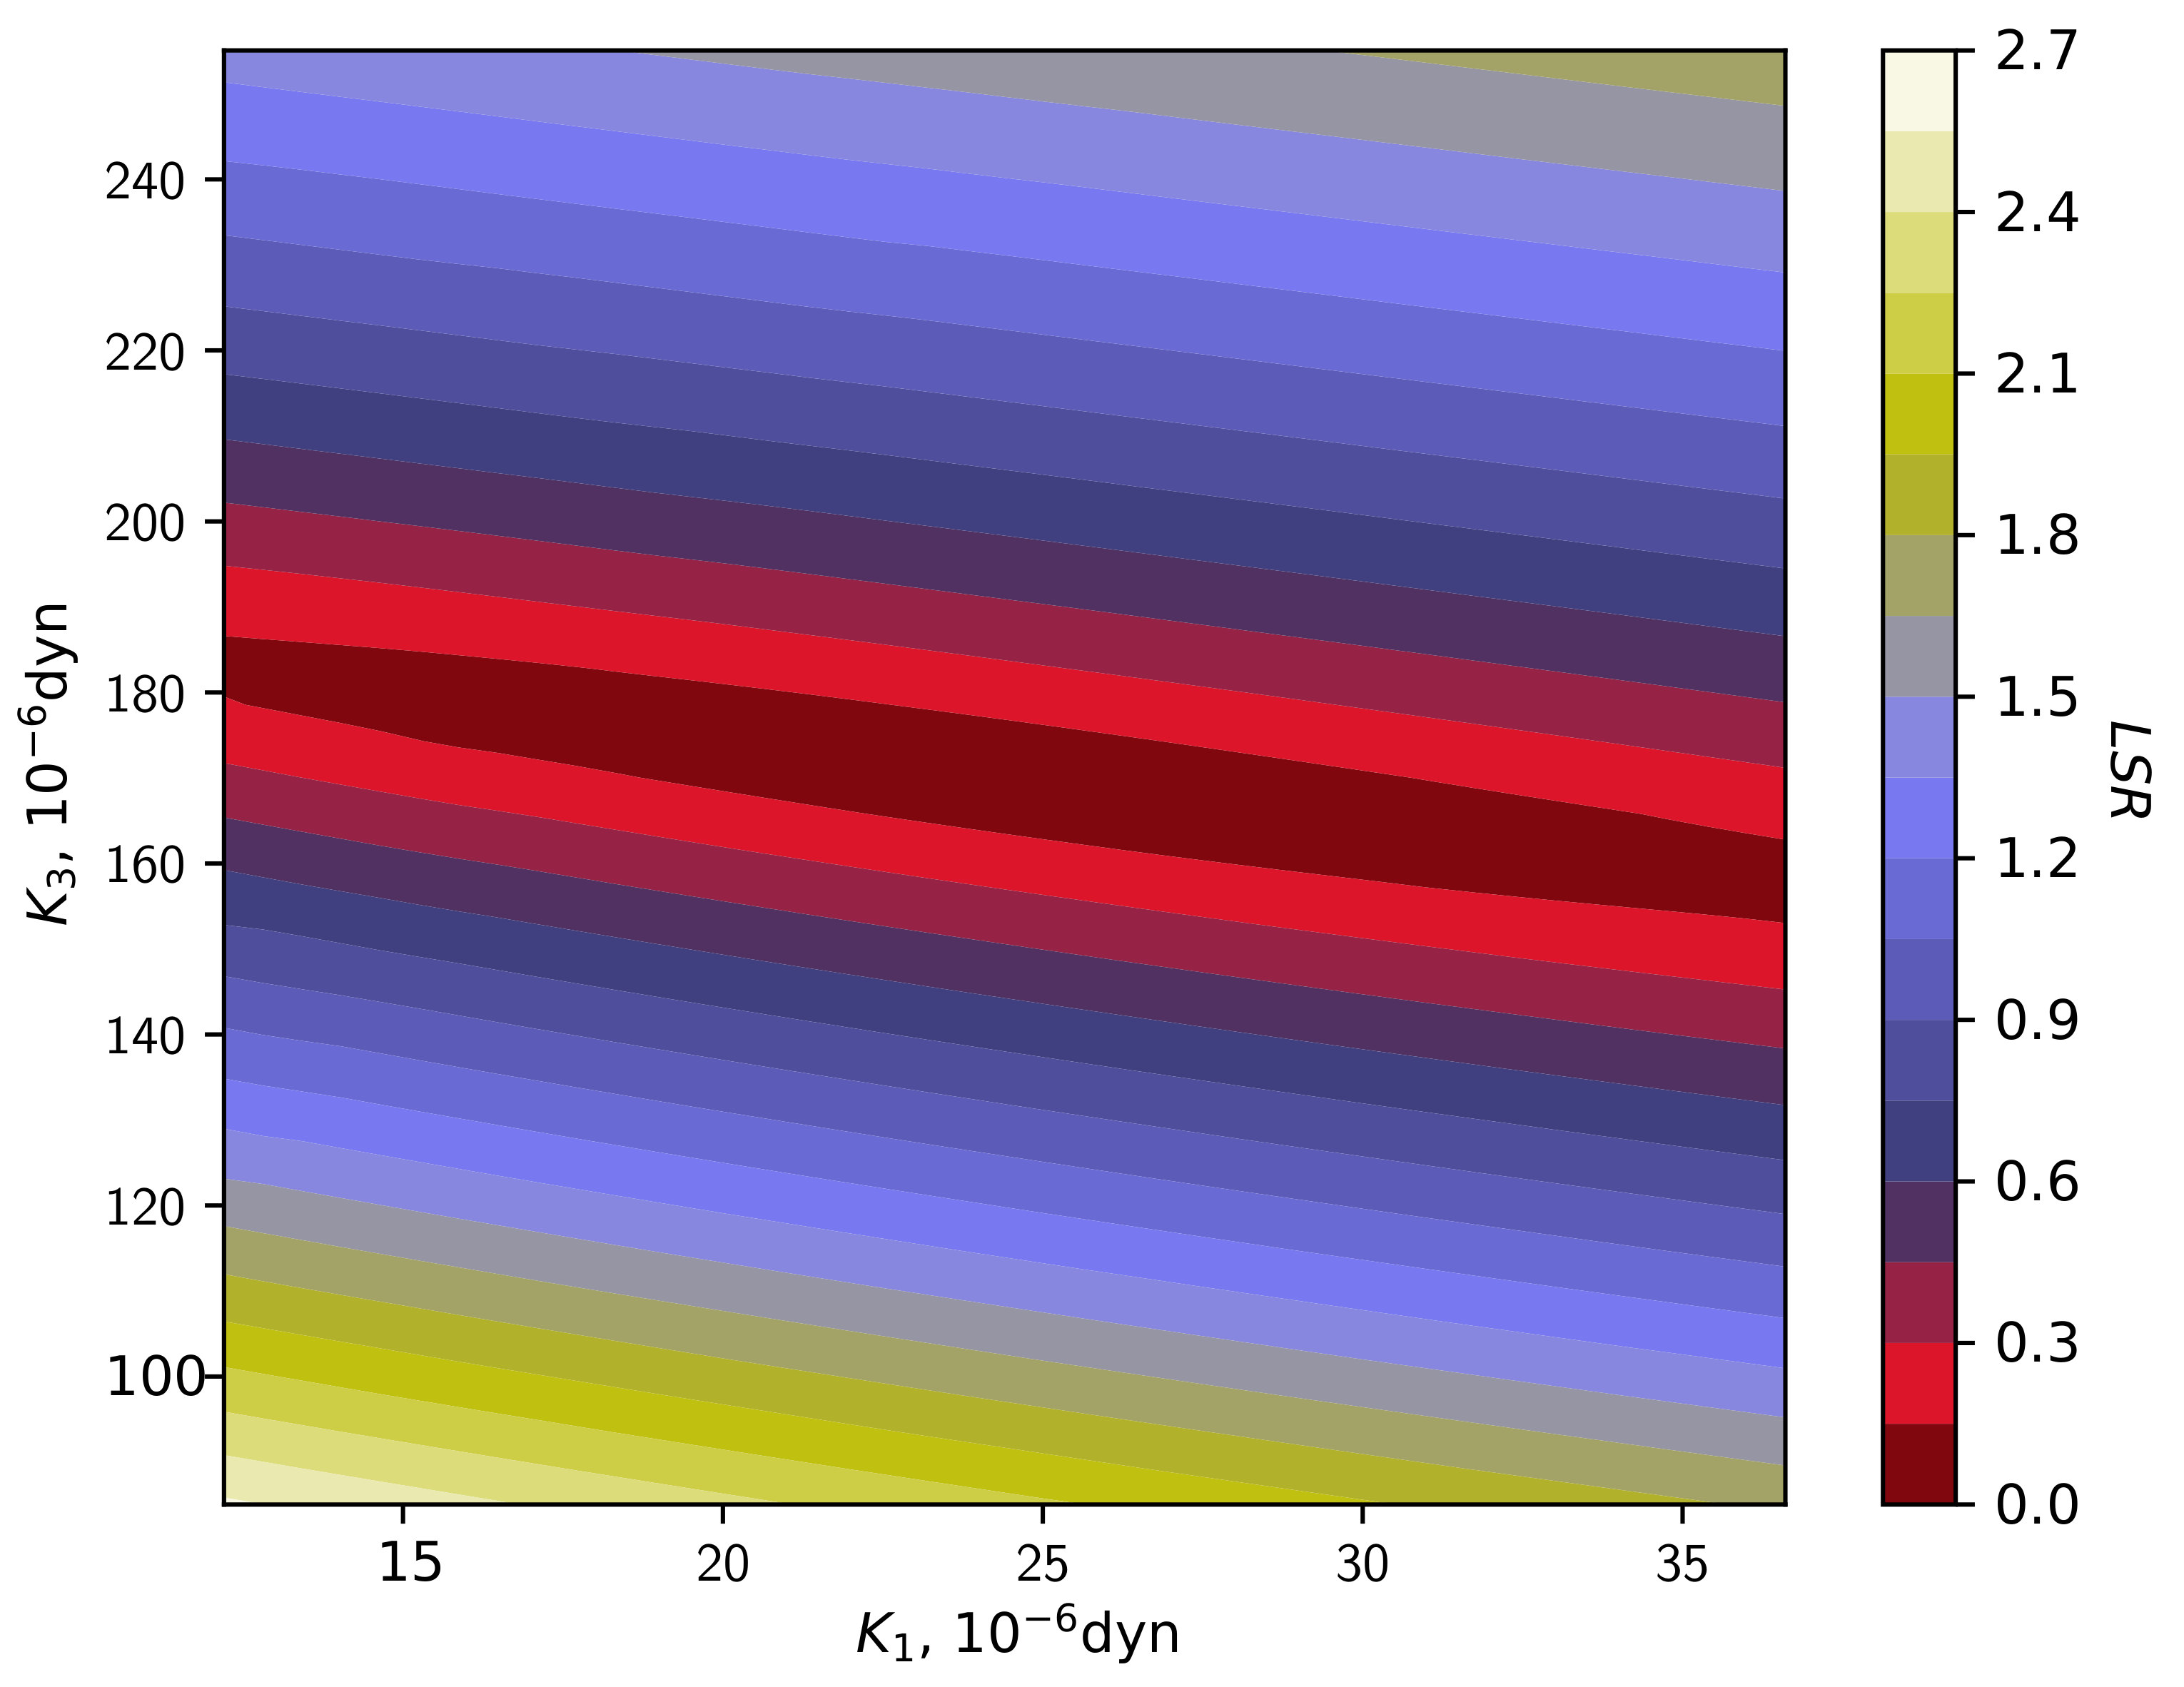
13). The map on
,
obtained under this assumption is given on
Figure 7. One can see, that the minimum takes place at the exact same
,
as it was expected.
From
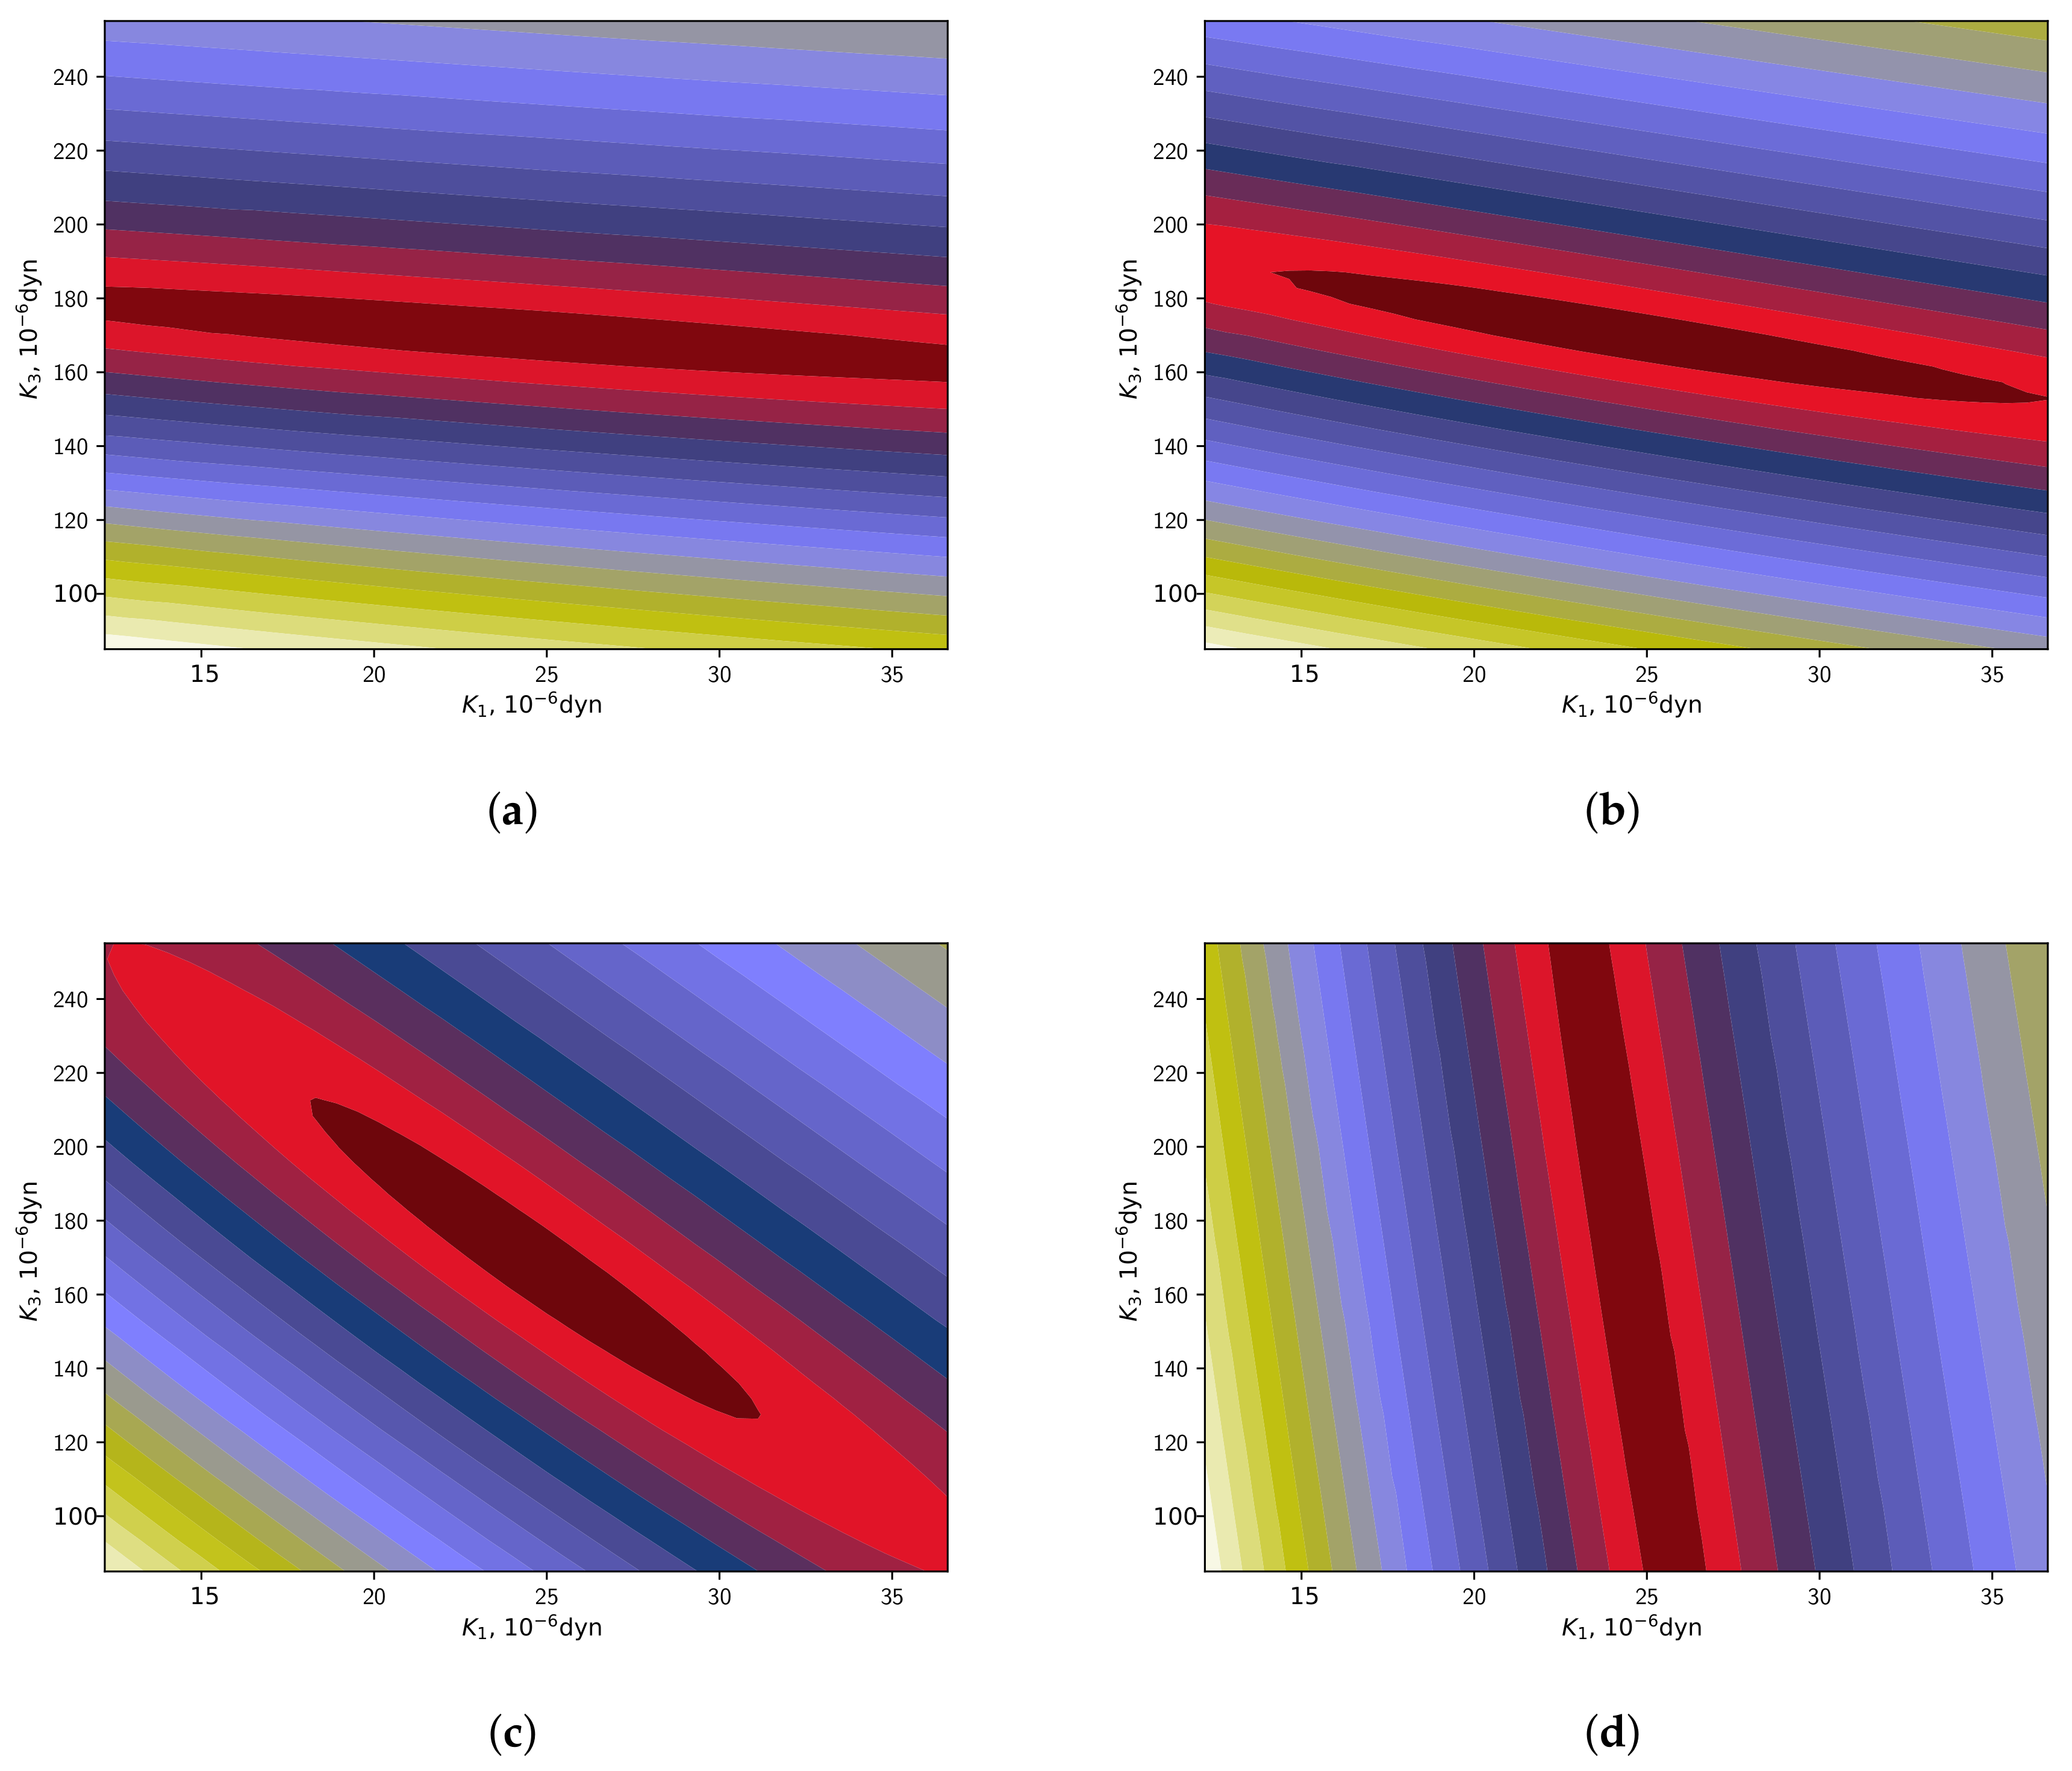
Figure 7 one can see the angle of inclination for the long axis of the ellipses with the constant value of
. This angle is related to the pretilt angle
. To show it we make the maps on
,
for the set of
.
Figure 8 shows these maps. Note, our minimization procedure allows us to estimate the pretilt angle. It can be added to the minimization problem as an additional free parameter. However, in our case, this is not necessary, as we can estimate the pretilt angle by the value of effective permittivity at zero magnetic field.
Another way to make the self check is to perform the same measurements for a well known LC. The well-studied 5CB was taken as such a liquid crystal. The results of the measurements for 5CB for the same cell and the same geometries are presented on
Figure 9.
Then basing on the measurement results only, we have implemented the numerical procedure described in
Section 4. The map for the LSR criterion on
,
for 5CB was calculated (
Figure 10).
The map gives the minimum for
dyn,
dyn. Making the comparison with known values for 5CB [
37]
dyn,
dyn we can see a good matching of the results for the elastic constant
and satisfactory matching for the constant
. The solid lines on
Figure 9 are calculated basing on the values of
and
, obtained from the map for the LSR criterion. One can see a good agreement between experimental data and calculation results.
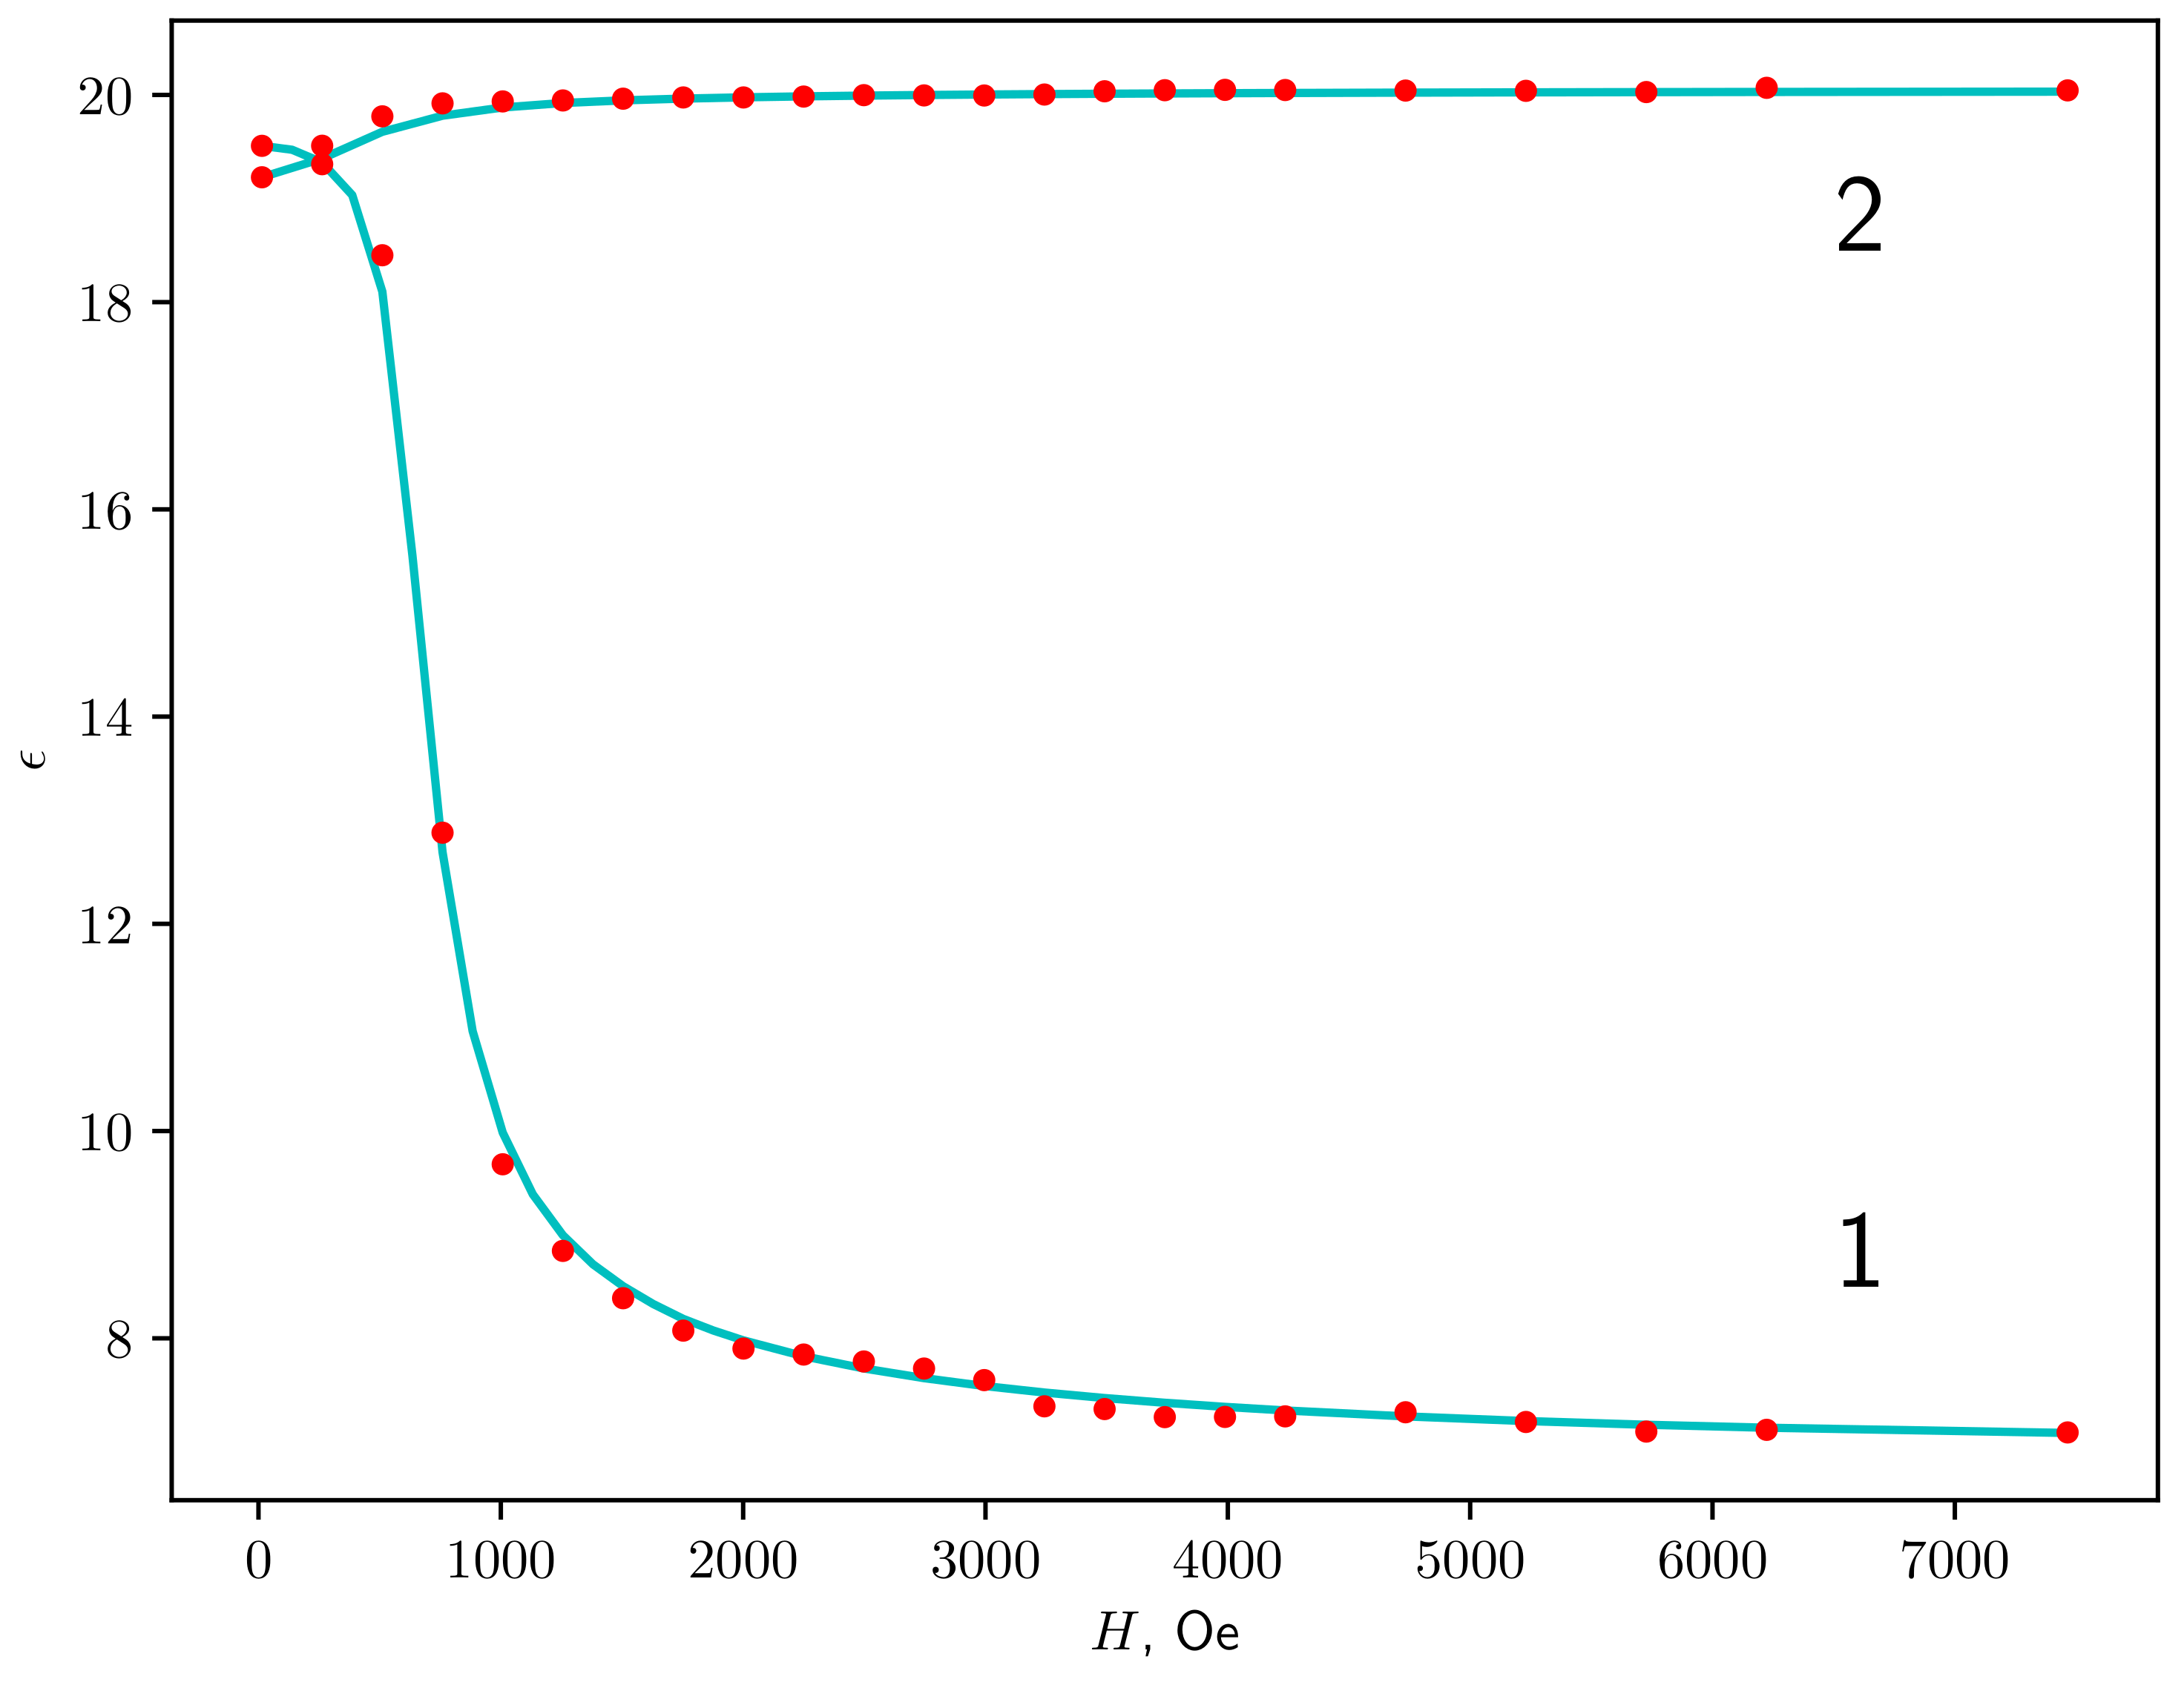
Finally,
Figure 11 shows the experimental data and calculated approximations for the dependencies of
on
H for Gd complex.
Here, the solid lines are calculated based on the values of
and
, obtained from the map for the LSR criterion (
Figure 6). The Frank elastic constants for
was taken as
dyn,
dyn. One can see a good agreement between experimental data and calculation results.
We performed calculations both for the strong boundary conditions and for weak coupling with a series of values for the coefficient
k in Equation (
8). The best match for lanthanidomesogen was achieved for the case of strong boundary conditions.
6. Discussion
In the present paper, we proposed a numerical minimization procedure which allows us to estimate two elastic constants and to obtain a profile of the director which gives a good agreement between experimental data and numerical results. As an experimental sample, we used the gadolinium complex and investigate the magnetic field-induced macroscopic alignment.
The estimated error (LSR criterion) is represented with a set of ellipses inclined at the same angle to the horizontal axis. This angle depends on the pretilt angle of the director and increases with it. Thus, it can be said that some linear combination of and was estimated with rather high accuracy, however, since the values of these coefficients themselves are interesting for practical purposes, the final data obtained by this method is not so accurate. The value of is measured with significantly greater accuracy, since for the selected geometry, assuming there is no pretilt, does not significantly affect the system and its contribution grows with the pretilt angle, and consequently, the inclination angle of the ellipse. It can be noted that the inclination angle of the ellipse on the test map coincides with the inclination angle of the ellipse when using experimental data, which additionally confirms the correctness of the used theoretical model.
As one can see, this method cannot provide accurate information on for lanthanidomesogens, but at least it gives us the information that it is several times smaller than . It is not as accurate as optical methods, but still can be useful for some special cases like this one. It should be noted that the values of the elastic constants for lanthanidomesogen turned out to be quite large in comparison with ordinary LCs.
The revealed dependence of the minimum vicinity on the pretilt angle suggests that the accuracy of determining the value of the elastic constant can be improved by fixing the pretilt angle close to . The proposed numerical method can be generalized to more complex systems, for example, helicoidal LCs or systems with negative magnetic anisotropy. In this case, it will be possible to determine the third elastic constant .
The proposed theoretical model and numerical procedure make it possible to determine Frank elastic constants in a wide temperature range. For these purposes, it is necessary to obtain the dependences of the effective permittivity on the magnitude of the magnetic field at various temperatures and to calculate the Frank constants using the proposed numerical procedure.
It should be noted that the synthesis of lanthanidomesogens of the class under consideration, which have a liquid crystalline state at room temperature, would significantly expand the field of practical applications. However, at the moment we do not have information on the synthesis of such complexes.
