Article

Annealing Control on the Anatase/Rutile Ratio of Nanostructured Titanium Dioxide Obtained by Sol-Gel

by
V. H. Castrejón-Sánchez
1,
Roberto López
1,*,
M. Ramón-González
1,
Ángeles Enríquez-Pérez
1,
M. Camacho-López
2 and
G. Villa-Sánchez
1
1
Tecnológico de Estudios Superiores de Jocotitlán, Carretera Toluca Atlacomulco Km 44.8, Ejido de San Juan y San Agustín, Jocotitlán C.P. 50700, Mexico
2
Laboratorio de Investigación y Desarrollo de Materiales Avanzados, Facultad de Química, Universidad Autónoma del Estado de México, Carretera Toluca-Atlacomulco Km 14.5, Toluca C.P. 50200, Mexico
*
Author to whom correspondence should be addressed.
Crystals 2019, 9(1), 22; https://doi.org/10.3390/cryst9010022
Submission received: 19 November 2018 / Revised: 15 December 2018 / Accepted: 24 December 2018 / Published: 30 December 2018

Abstract

:
According to the different phases at which titanium dioxide (TiO2) crystallizes, previous studies have shown that anatase is more efficient for photocatalysis than rutile. Nowadays, the synergetic effect is well-accepted between anatase and rutile as having an effect in increasing performance in photocatalysis. In the present work, control over the anatase/rutile ratio was performed in three experimental steps. Initially, amorphous-anatase TiO2 powders were synthesized by the sol-gel method. For the crystallization of anatase, the powders were annealed at 250 °C for 2 h in ambient atmosphere. The final step was performed by using different annealing times, ranging from 35 up to 200 min at a temperature of 475 °C. The powders were characterized by Raman spectroscopy, UV–VIS, SEM and TEM techniques to determine the crystalline phase, band gap, morphology, and elemental composition, respectively. It was possible to control the anatase/rutile ratio on the nanostructured TiO2 powders from 100% of anatase until a complete transformation to rutile through the variation of the annealing time. The band gap calculated using the Tauc’s model was found in the range of 2.56 to 2.93 eV. However, no direct relationship between the anatase/rutile ratio, and the band gap was found.

1. Introduction

Photocatalysis is one of the most promising advanced oxidation processes (AOPs), because it has several advantages such as obtaining oxidizing agents from molecular oxygen, the selective/non-selective oxidation of organic compounds, and its total mineralization to non-toxic compounds in the environment, as well as the use of clean and abundant energy sources, such as solar energy [1,2]. In the past few decades, intense research has been devoted to photocatalysts, due to the photocatalytic splitting of water in TiO2, discovered by Fujishima and Honda in 1972 [3]. Titanium dioxide (TiO2) is a semiconductor-based metal oxide with excellent structural, optical, electrical, and chemical properties. These properties allow for its application in several areas, such as energy (hydrogen production, solar cells), environmental (aqueous and gaseous effluents), building (auto-cleaning surfaces), and biomedical (auto-sterilizing surfaces) [4,5,6,7]. Naturally, titanium dioxide occurs in three polymorphs: anatase, rutile, and brookite. Anatase and brookite are metastable polymorphs; while rutile is the most stable polymorph. Five different TiO2 phases of high pressure have been reported; nevertheless, they have minimal importance in the research and development of applications. The two most commonly studied polymorphs of titanium dioxide in photocatalysis are anatase and rutile, where the latter is the least active form [8,9]. Anatase is frequently found in nanostructured TiO2, and it is recognized as being the most active phase in oxidation/detoxification reactions. The presence of mixed phases of anatase/rutile produced interesting effects in charge transference processes, and they improve the photocatalytic performance of TiO2 materials in photocatalytic applications [4,9,10,11]. Recently, a nanostructured photocatalyst (Degussa P25) has been commercialized. It consists of a mixture of phases with an approximated 3:1 ratio of anatase/rutile, and has been proven to possess excellent potential as a photocatalyst [12,13,14,15]. Thus, many researchers have focused their efforts on obtaining nanostructured TiO2 with mixed phases. Sol-gel is a technique that is widely used for synthesizing nanostructured TiO2 powders and thin films. One of the main advantages of this method is the large number of available precursors, and the relatively simple way of synthesizing TiO2 [16,17,18]. In the present work, nanostructured TiO2 powders were prepared in three experimental steps. The time of the second annealing step was used as the controlling parameter over the different anatase/rutile ratios.

2. Experimental Setup

2.1. Synthesis of TiO2

2.1.1. Sol-Gel Synthesis

Nanostructured TiO2 was obtained by the sol-gel method. A solution was prepared by using 1 mL of titanium tetrabutoxide (Sigma-Aldrich, Toluca, Méx., 97% pure), 20 mL of isobutyl alcohol (Sigma-Aldrich, 99% pure), 1 mL of nitric acid (HNO3, from J.T. Baker, Toluca, Méx. 70% purity), and distilled water as an excess reactant (hydrolysis ratio, Rw = 3). Isobutyl alcohol and titanium tetrabutoxide were poured into a beaker, and then heated to 35 °C under constant magnetic stirring for 30 min. Later, HNO3 was slowly added drop-by-drop and stirred for 40 min. Finally, distilled water was slowly added to the solution using a burette, and then magnetic stirring was kept for 120 min. Once this time had passed, a sol was obtained. The sol was aged for 24 h to promote gel formation. The sol-gel was dried in an electric oven at 70 °C to evaporate the residual solvent and water. With this procedure, an amorphous ceramic white powder was obtained, as reported elsewhere [8].

2.1.2. Annealing

The annealing of TiO2 powders was performed in two steps. In the first part, in order to promote crystallization; as-synthesized TiO2 was heated at 250 °C over 2 h under an ambient atmosphere. In the second part, all crystallized powders were annealed at 475 °C under an ambient atmosphere during different times ranging from 35 to 200 min.

2.2. TiO2 Characterization

2.2.1. Raman Spectroscopy

Raman spectra were recorded by using a micro-Raman LabRam HR-800 system (Horiba Jobin Yvon, Kyoto, Japan). A He–Ne laser (λ = 632 nm) was used to induce scattering. The laser beam was focused by using a 50× lens, which also functioned in collecting scattered light. A 600 line/mm grating was employed; 100 acquisitions were averaged with an exposure time of 5 s each.

2.2.2. Diffuse Reflectance Spectroscopy (DRS)

TiO2 powders were milled into a mortar, and they were compacted into a tablet to be analyzed with a PerkinElmer 35 spectrophotometer with an integrating sphere in diffuse reflectance mode. Each spectrum was obtained in the range of 200–1100 nm, with a scan rate of 480 nm/min.

2.2.3. Scanning Electron Microscopy (SEM)

Morphology and elemental composition were studied by using a Jeol IT-100 scanning electron microscope (JEOL, Ltd., Akishima, Japan), coupled to a Bruker X-ray microprobe (Bruker Corporation, Billerica, MA, USA). The SEM was operated in HV mode, with an accelerating voltage of 20 kV; a secondary electron signal was used.

2.2.4. Transmission Electron Microscopy (TEM)

TEM measurements were performed with a Jeol JEM 2010-TH (JEOL, Ltd., Akishima, Japan, punctual resolution of 2.3 Å) transmission electron microscope, with an accelerating voltage of 200 kV, coupled with a Noran electronic microprobe (Thermo Scientific, Whaltam, MA, USA). Sample preparation consisted of powder milling with a mortar. A fraction of powder was dissolved in ethanol and ultrasonically dispersed, and an aliquot was taken with a capillary tube and placed into a Cu grid of 300 mesh with formvar and graphite coating.

3. Results and Discussion

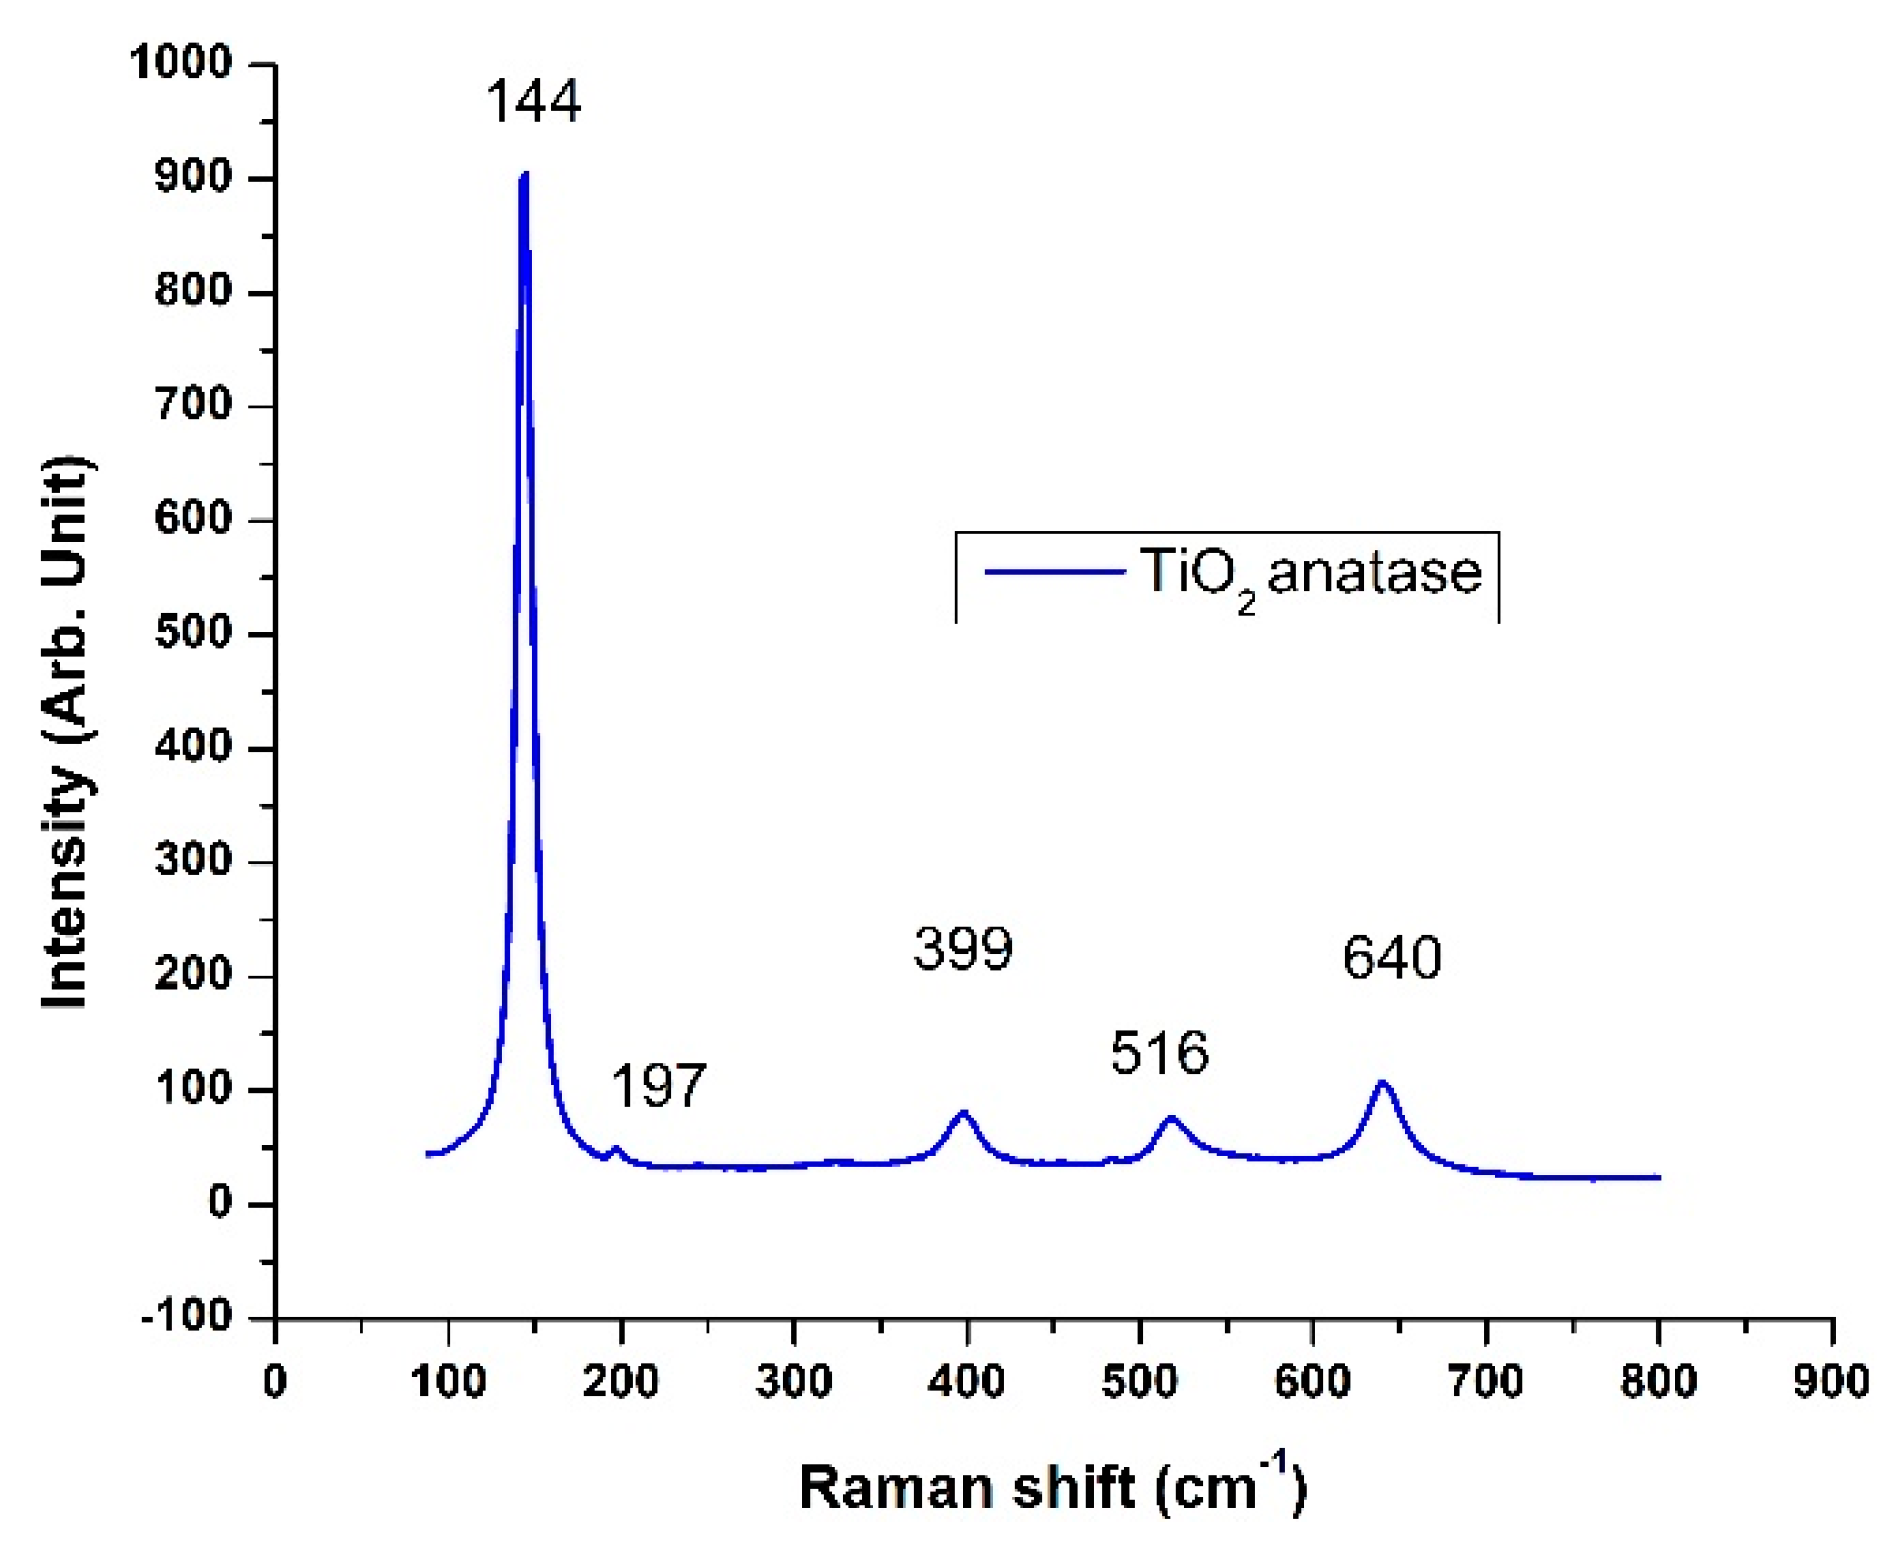
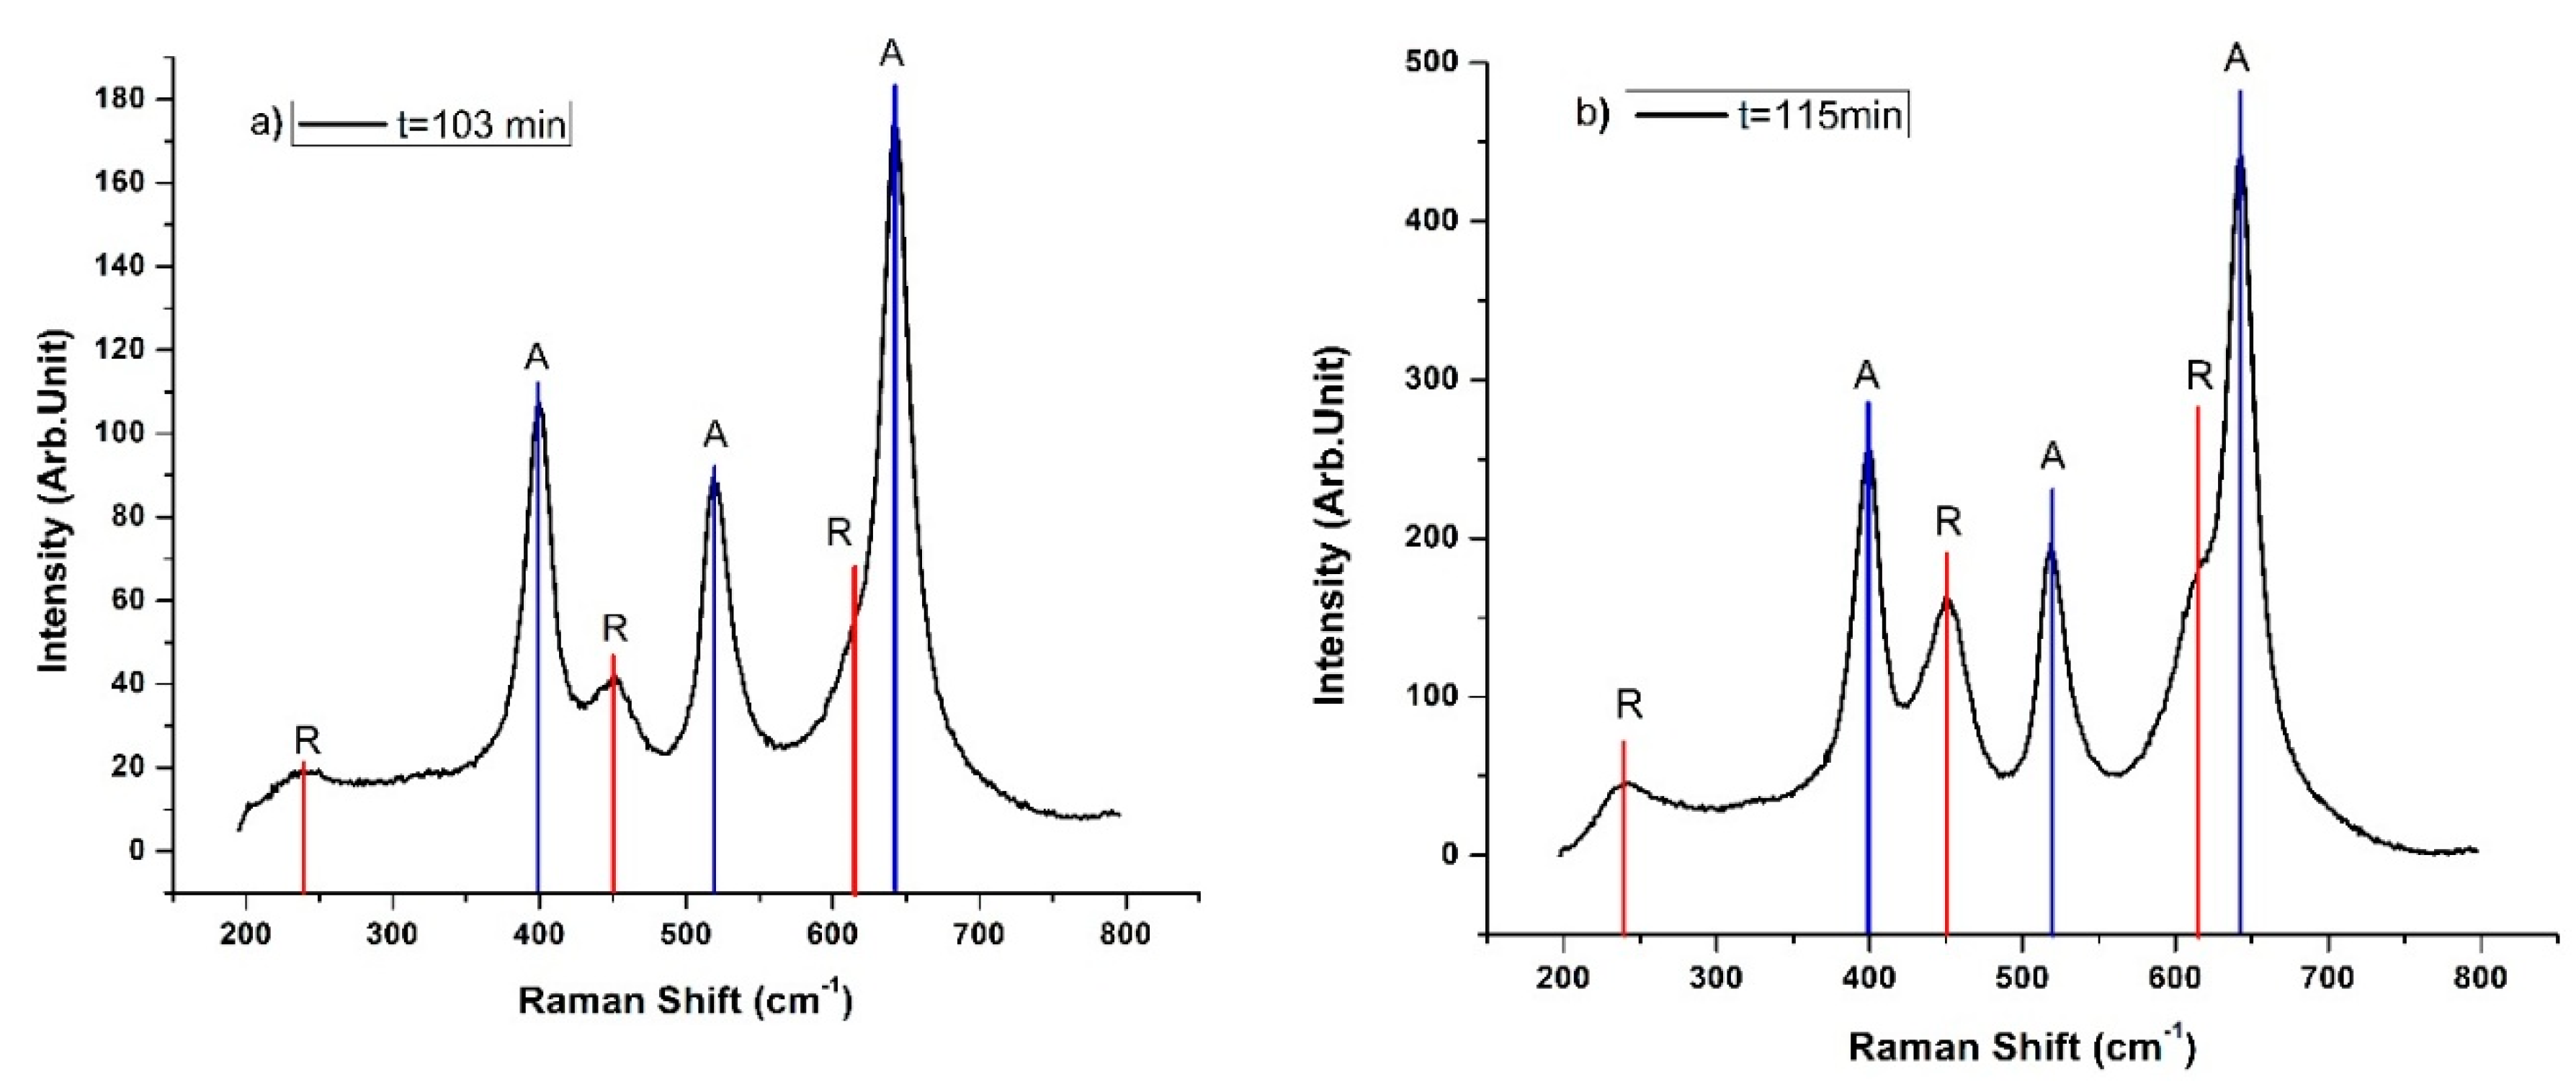
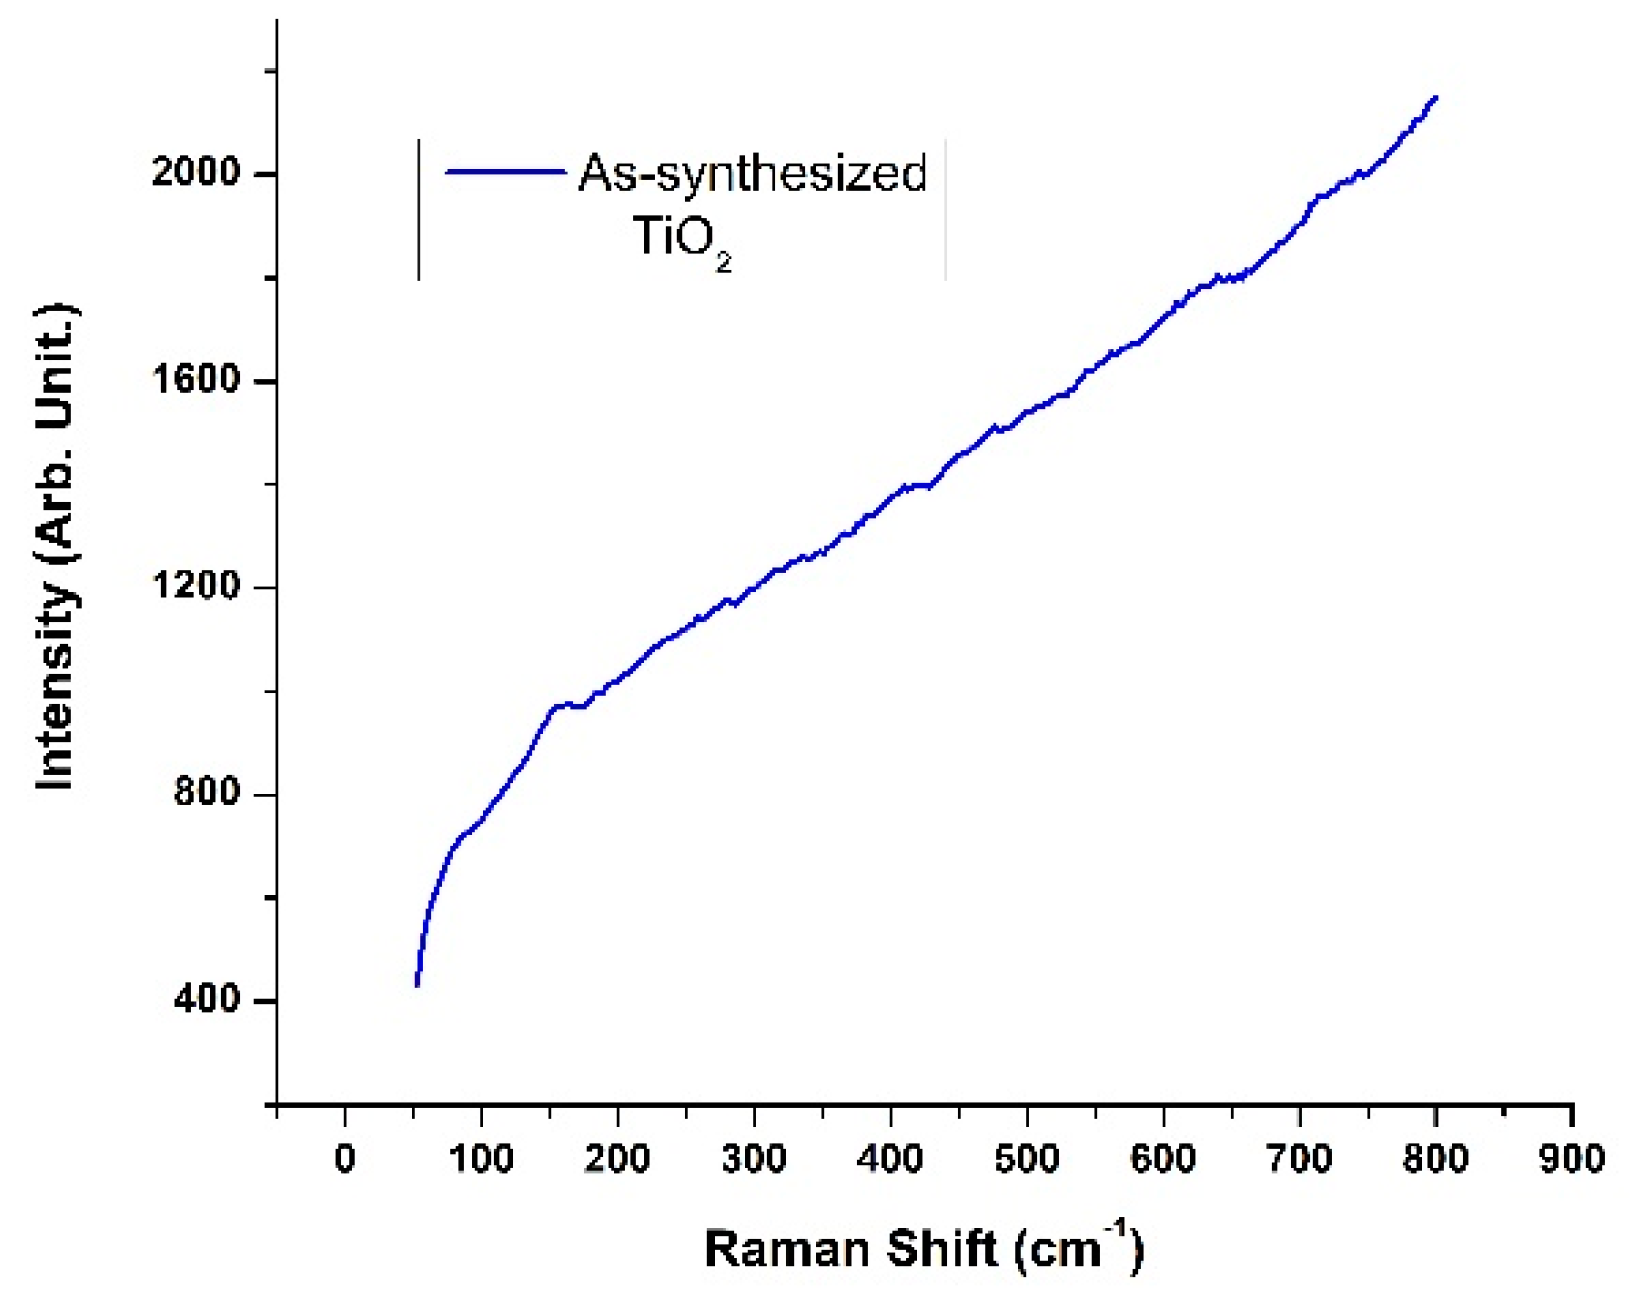
3.1. Raman Spectroscopy

Many methods can be used for synthesizing TiO2, usually by obtaining anatase or an amorphous phase (which can be crystallized into an anatase phase by thermal treatment). This can be explained from two different perspectives, structurally and thermodynamically. In the former, this occurs due to the great ease by which anatase forms octahedral TiO6 arrangements in the short range, which then adjust into a long-range anatase structure. This probably occurs because the molecular construction of anatase is less restrictive than that for rutile [19,20]. In the latter, there is a faster rate of crystallization in anatase that may be caused by its lower surface free energy, in contrast with the higher surface free energy of rutile [21,22,23]. It is important to understand the transformation kinetics of anatase to rutile. Obtaining different phases of TiO2 depends on several factors, such as the particle size, synthesis method, heating rate, etc. All of these factors have a direct effect on the final product. The kinetic transformation of anatase–rutile is usually expressed in terms of time and temperature. It must be borne in mind that the anatase–rutile transformation is not instantaneous, and it depends on time, because it is a reconstructive transformation. Bulk anatase begins to transform irreversibly at around 600 °C, even though temperatures ranging from 400 to 1200 °C have been reported, depending on the synthesis method and the precursors [24,25,26,27].
For the sol-gel method in particular, the hydrolysis ratio is a very important parameter that determines the crystalline structure that can be formed. It has been reported that with varying hydrolysis ratios in the range of 3 < Rw < 20, an amorphous phase will be obtained. For values of Rw > 200, the anatase phase is formed [25,28,29]. For the hydrolysis ratio used in the present study Rw = 3, only amorphous powders (Figure 1) were obtained, in good agreement with the literature.
Figure 2 shows the Raman spectrum of the powders annealed at 250 °C for 2 h in an ambient atmosphere. The bands observed at 144, 197, 399, 516, and 640 cm−1 correspond to the anatase phase of TiO2 [30]. The Raman spectra of TiO2 powders annealed at 475 °C for 103 and 115 min are shown in Figure 3a,b. Besides, there are other bands at 236, 447, and 613 cm−1 that correspond to the rutile phase of TiO2 [30]. The coexistence of anatase and rutile can be observed in the Raman spectra of both samples. However, according to the little increase in the peak intensities of rutile from Figure 3a,b, the change in the annealing time from 103 to 115 min promotes a partial transformation from anatase to rutile. In a previous work [30], a methodology was proposed to calculate the phase content of anatase/rutile, using the signal intensities for anatase (399 cm−1) and rutile (447 cm−1). Some samples were measured by using X-ray diffraction (XRD), and the method proposed by Spurr and Myers [31] was applied in order to determine the anatase and rutile contents. The results obtained with both methods were compared, and a slight difference of approximately 4–6% was found. This difference can be assigned to the very nature of each technique. Moreover, the values obtained were very close, and they presented the same trend. The phase content calculations were made as follows:
IA399/IR447 = 0.33 + 0.99 × WA/WR
W A = W A W R 1 + W A W R × 100
where IA399 is the signal corresponding to anatase phase; IR447 is the signal that belongs to the rutile phase. WA and WR are the weight fractions of the anatase and rutile phases, respectively.
In Figure 4, the temporal evolution of the anatase/rutile mixture is shown through that obtained by the methodology mentioned above. In the second and third column from the left to right of Table 1, the corresponding intensity ratio values for TiO2 and weight fractions of anatase and rutile for phase estimation, based on the relationship for IA399/IR447 showed in Equation (1), are presented. The anatase content (%A) shows a clear decreasing trend with longer annealing times. Previous studies have demonstrated that the presence of small quantities of the rutile phase can be enough to improve the photocatalytic performance and the reactivity of TiO2, compared with pure phases [32,33]. One of the principal theories suggests that enhanced photocatalytic activity for mixed phases arises from a photo-generated electron being transferred from anatase to lower-energy trap sites in rutile. This electron transference increases the recombination times for anatase, through a separation between the holes and electrons, which results in an improvement of the photocatalytic reactivity [34].
The principal advantage of the mixed-phase TiO2 powder over thin films with the same content of mixed phases could be that the powders possess a higher surface area that has direct repercussions on its photocatalytic performance. However, the disadvantage of not having a supported material (powders) in a substrate can cause problems for its recovery after being used in aqueous-phase applications.

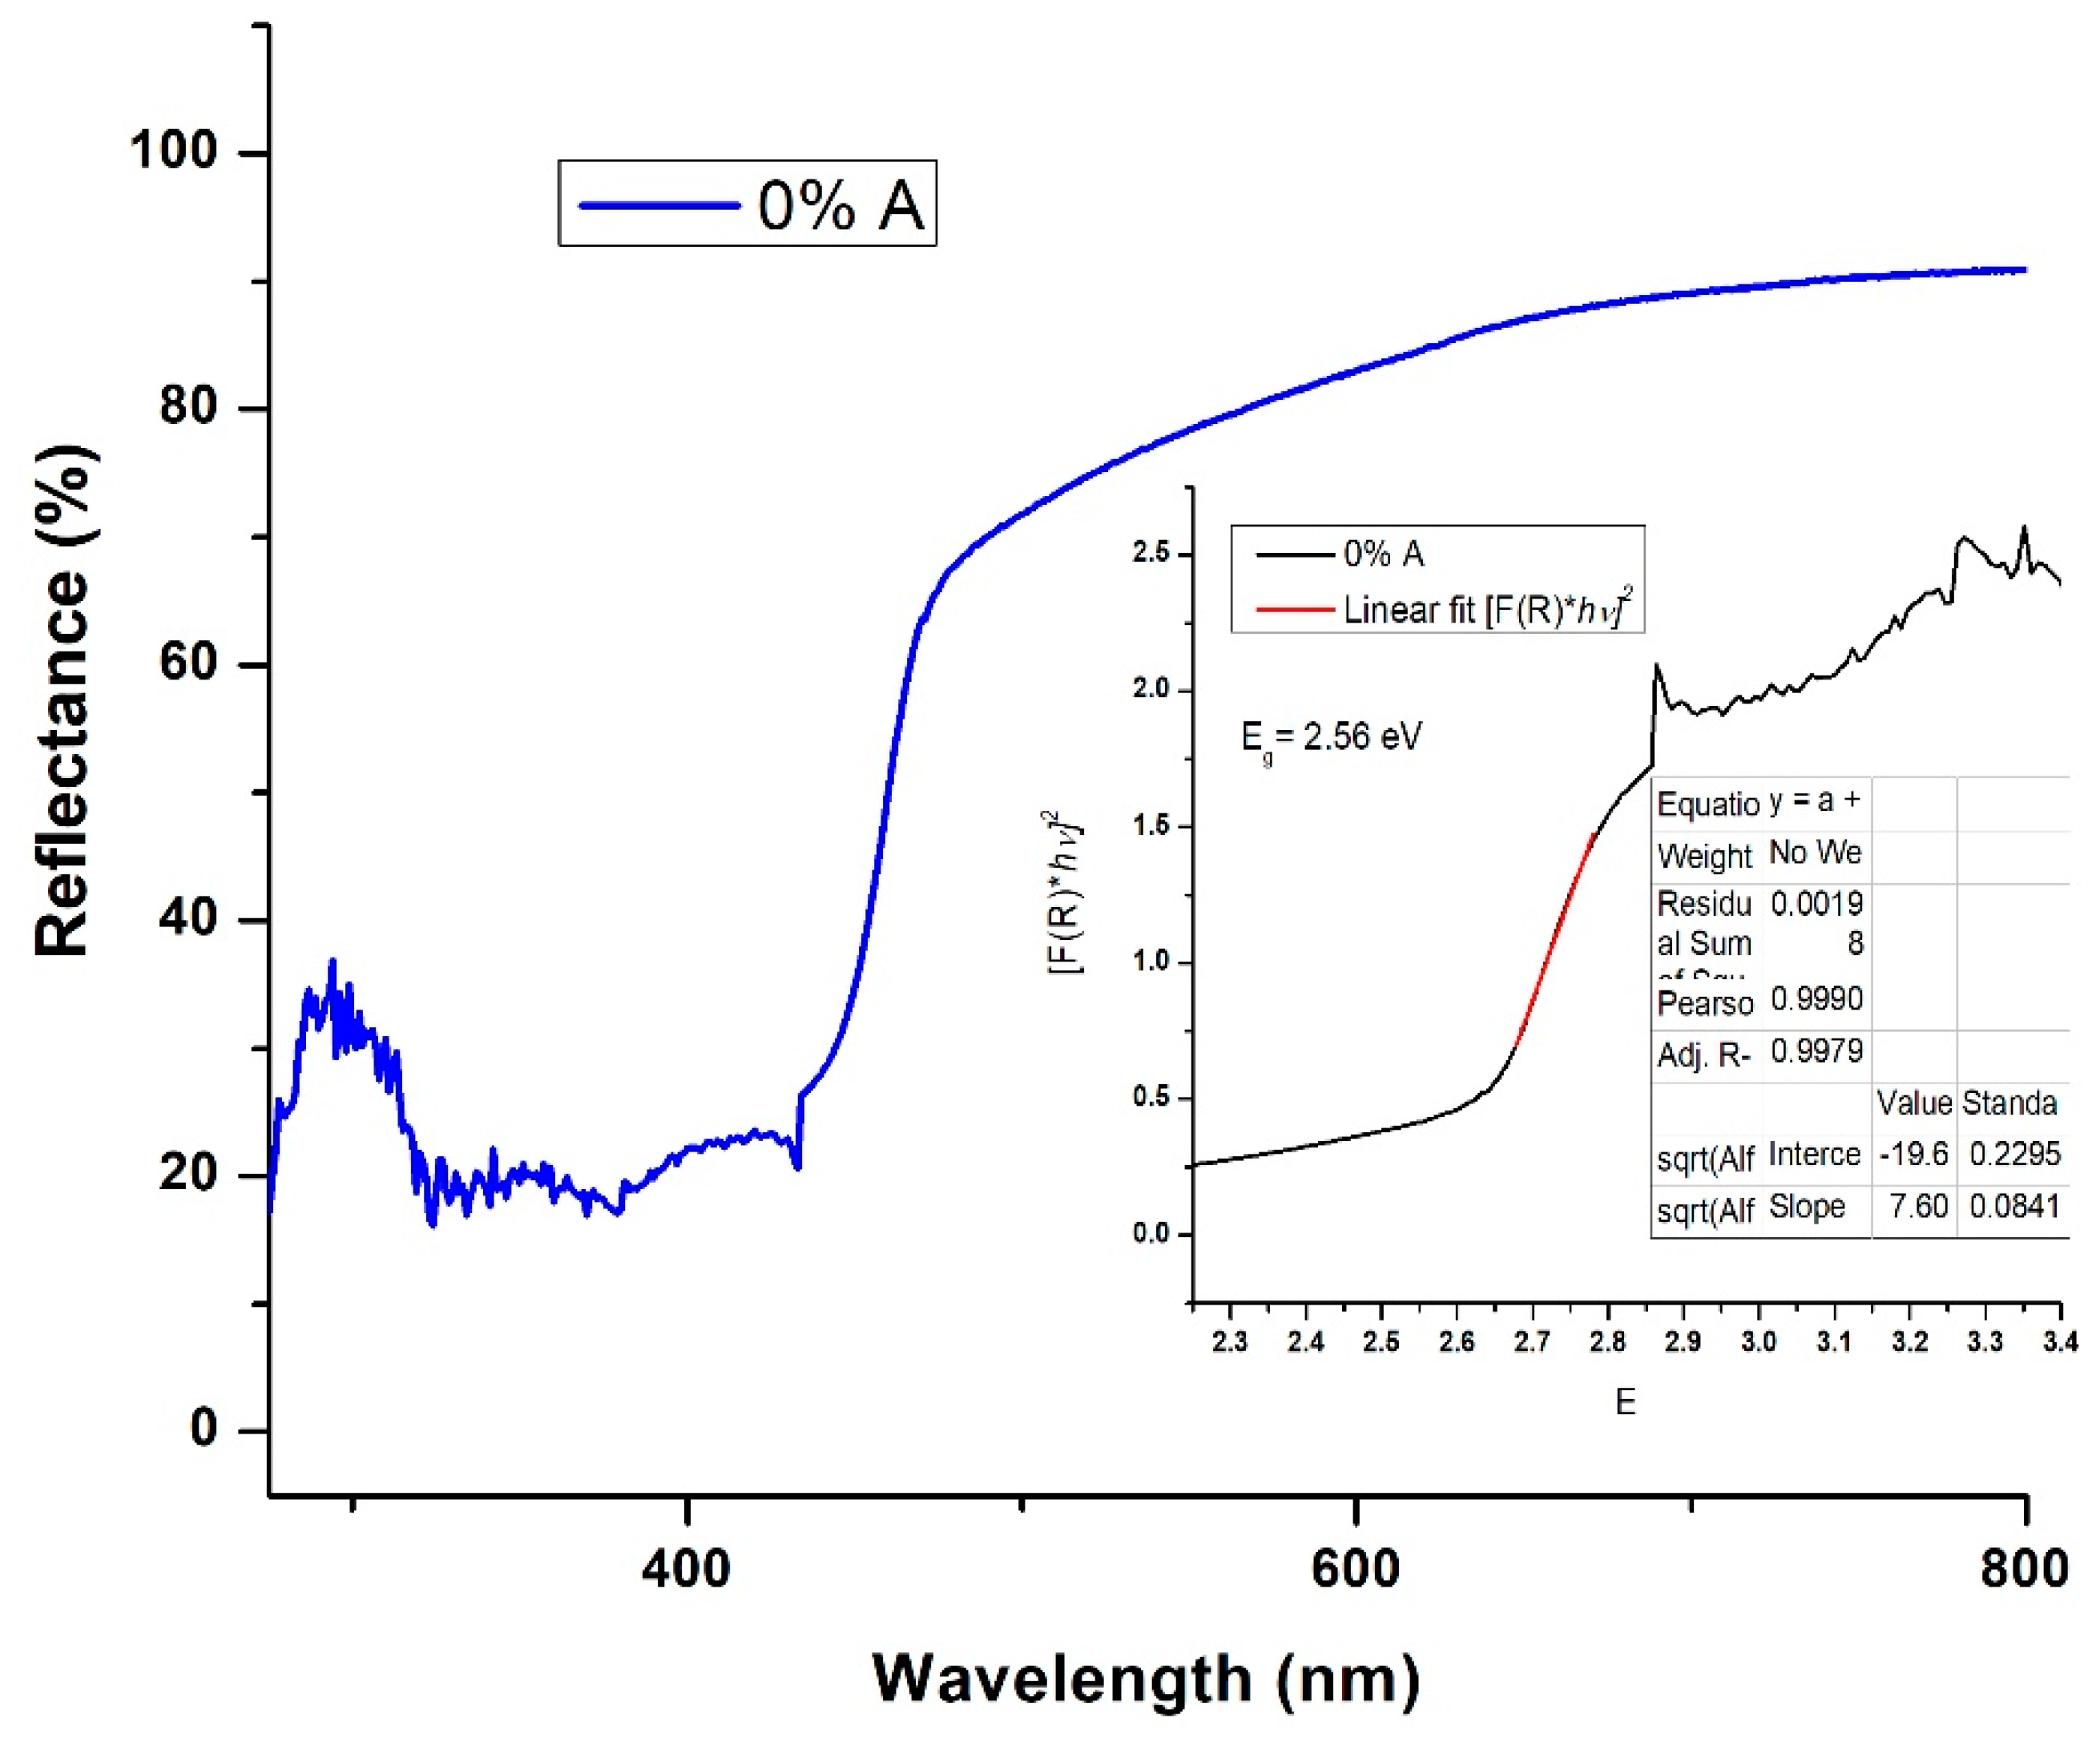
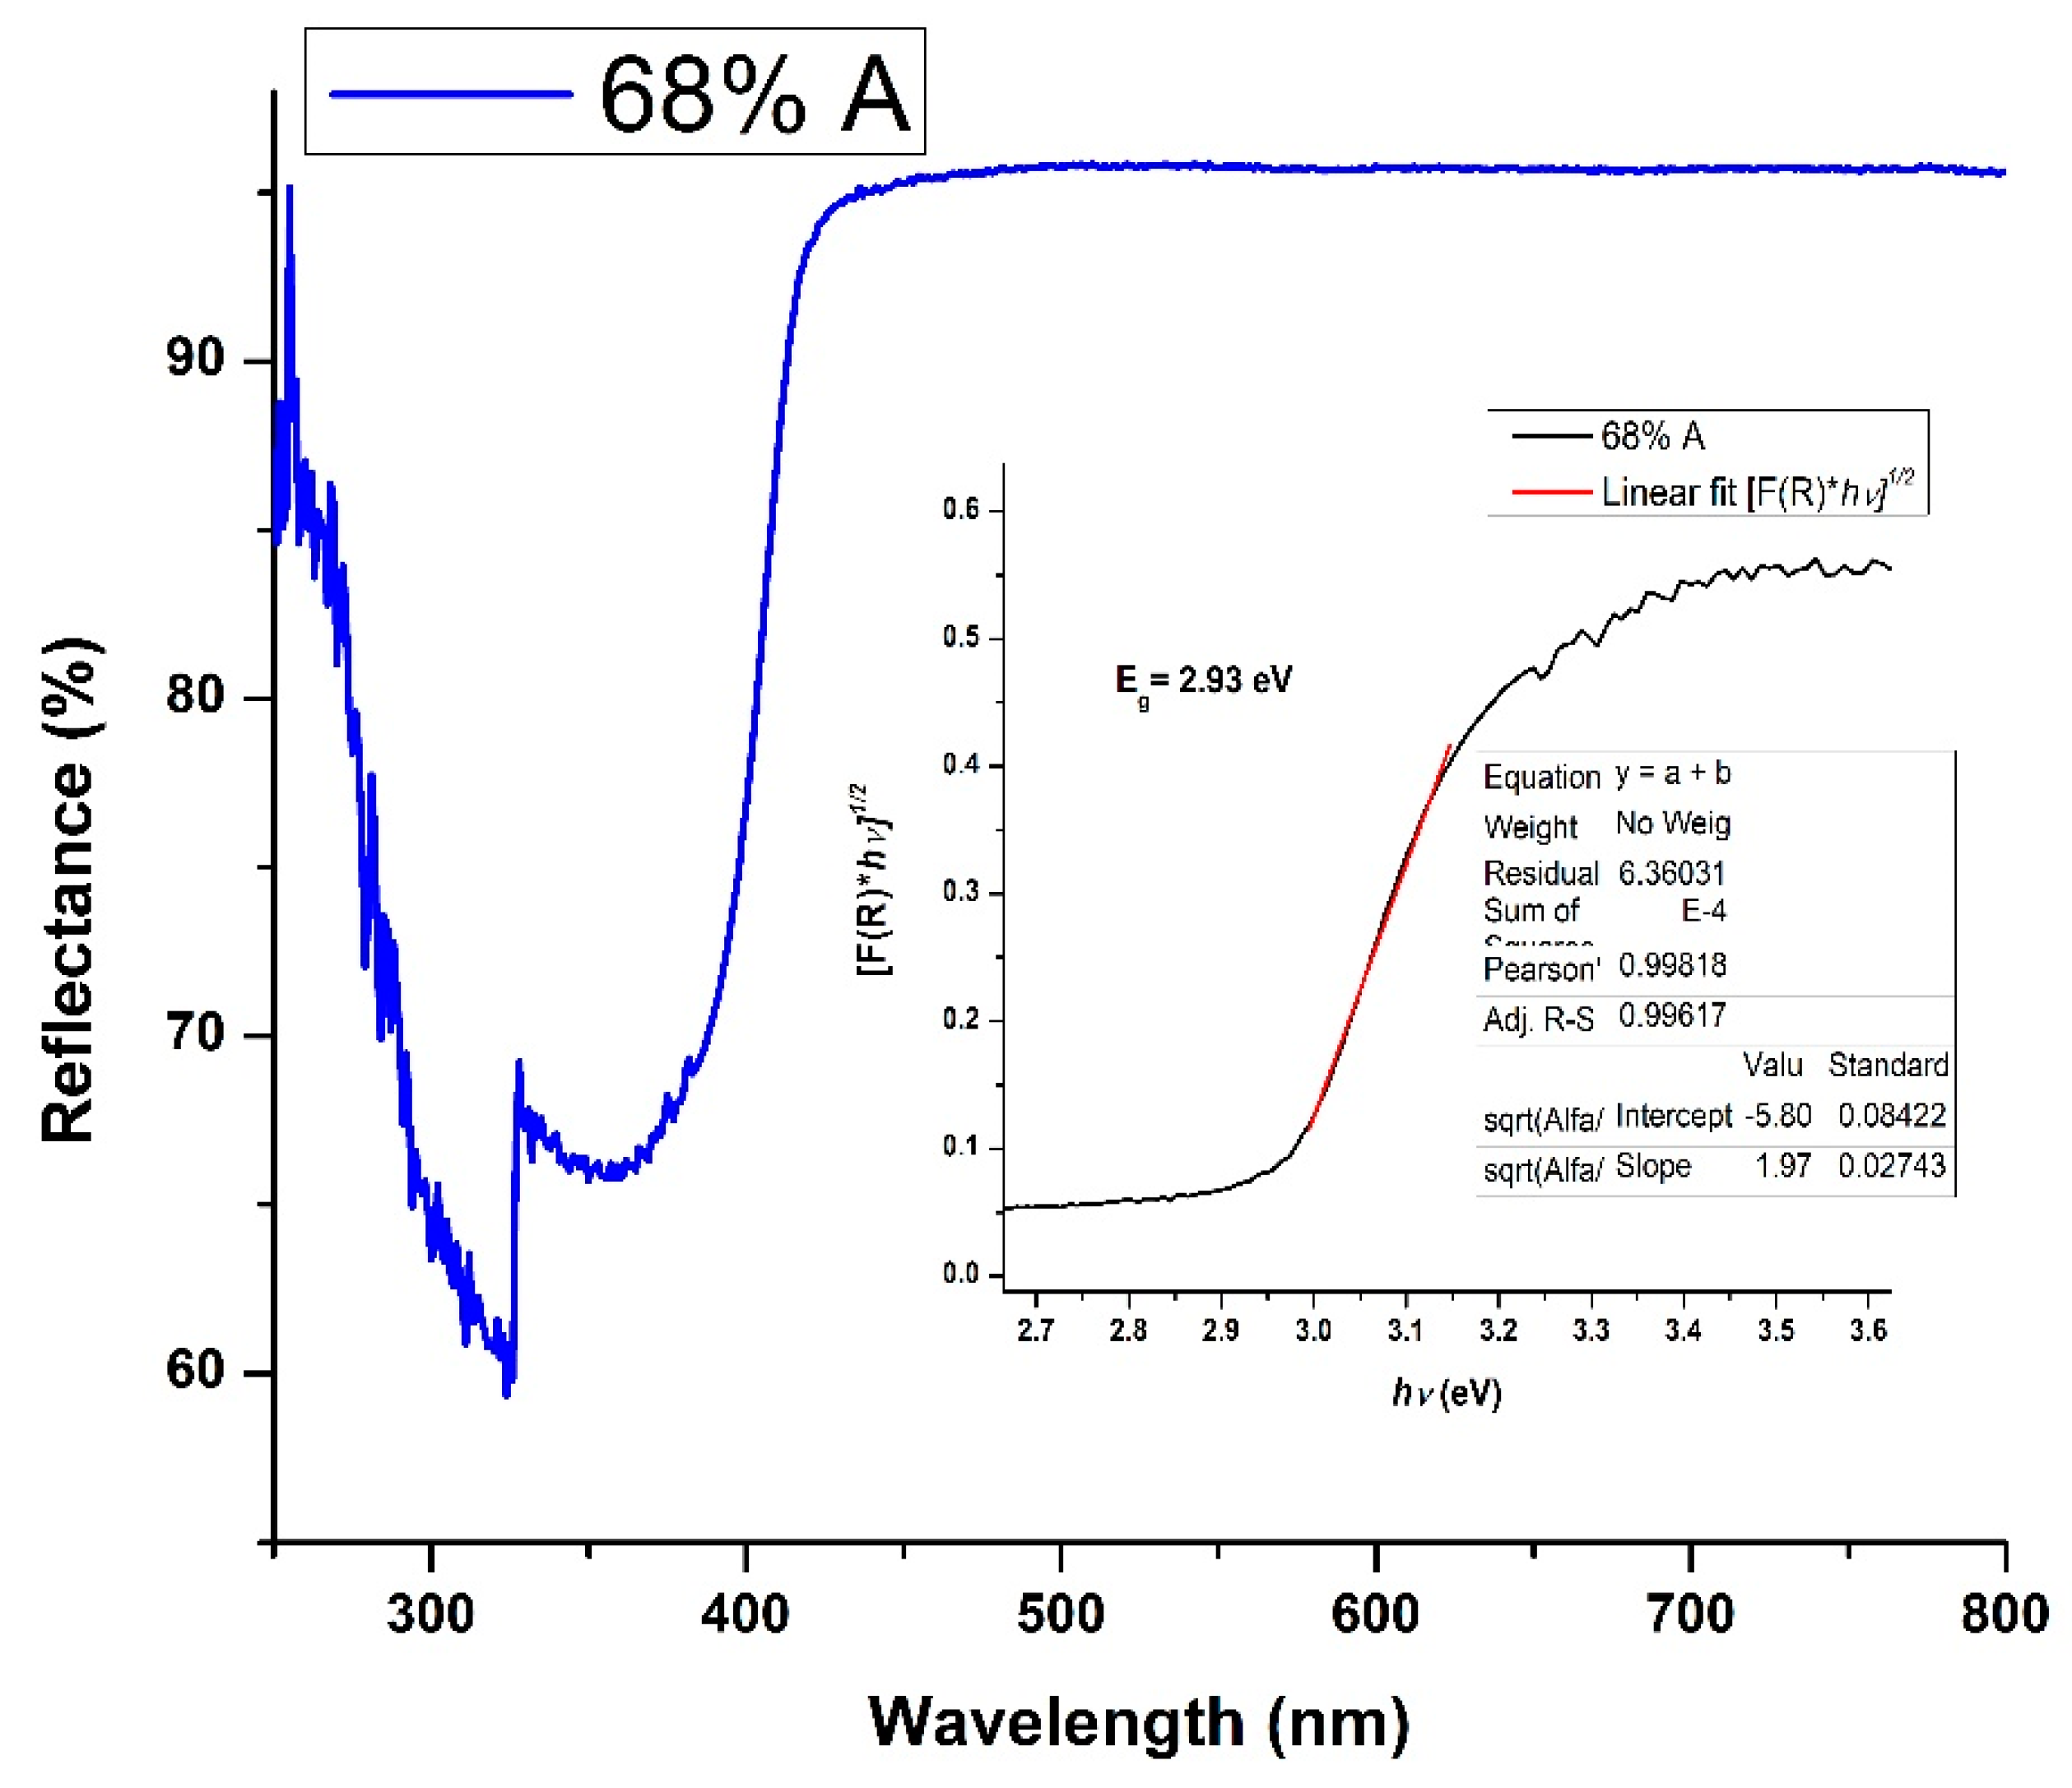
3.2. Diffuse Reflectance Spectroscopy (DRS)

3.2.1. Optical Bandgap

The visible photo-response of all samples were checked by DRS. The spectra shown in Figure 5 and Figure 6 belong to two samples containing 68%A and 0%A, respectively. They were treated with the Kubelka–Munk model in order to obtain the optical bandgap of the material, with the well-known Equation:
[ F ( R ) h ν ] n = C 1 ( h ν E g )
where F(R) = (1 − R)2/2R is the Kubelka–Munk function, is the photon energy, C1 is a constant, and n takes values of ½ or 2, depending on whether the material has indirect or direct transitions, respectively. The bandgap (Eg) is determined by drawing a Tauc plot with [F(R) * hν]n vs. , and fitting the linear portion to [F(R) * hν]n = 0 (insets in Figure 5 and Figure 6). In the sixth column of Table 1, the optical bandgaps for the TiO2 powders with a content from 100% anatase (0% rutile) to 0% anatase (100% rutile), as function of annealing time, are shown.
Titanium dioxide is a wide bandgap semiconductor with 3.0 eV and 3.2 eV for rutile and anatase, respectively. In present work, values of 2.56 eV for rutile and 2.90 eV for anatase were obtained. Generally, the values for all mixed-phase samples lies between these two values, and this lowering in the bandgap can be attributed to the presence of rutile, which induces additional states within the bandgap. The results shown here agree with those reported by other authors [35,36].
Usually, the optical properties of unsupported nanostructures (powders) are determined by dispersing it into a liquid media and performing UV–VIS-NIR spectroscopy in absorbance mode. Even though the absorption band is well defined, a precise determination of bandgap is difficult. However, by using DRS and applying the Kubelka–Munk model, this can be overcome [37].

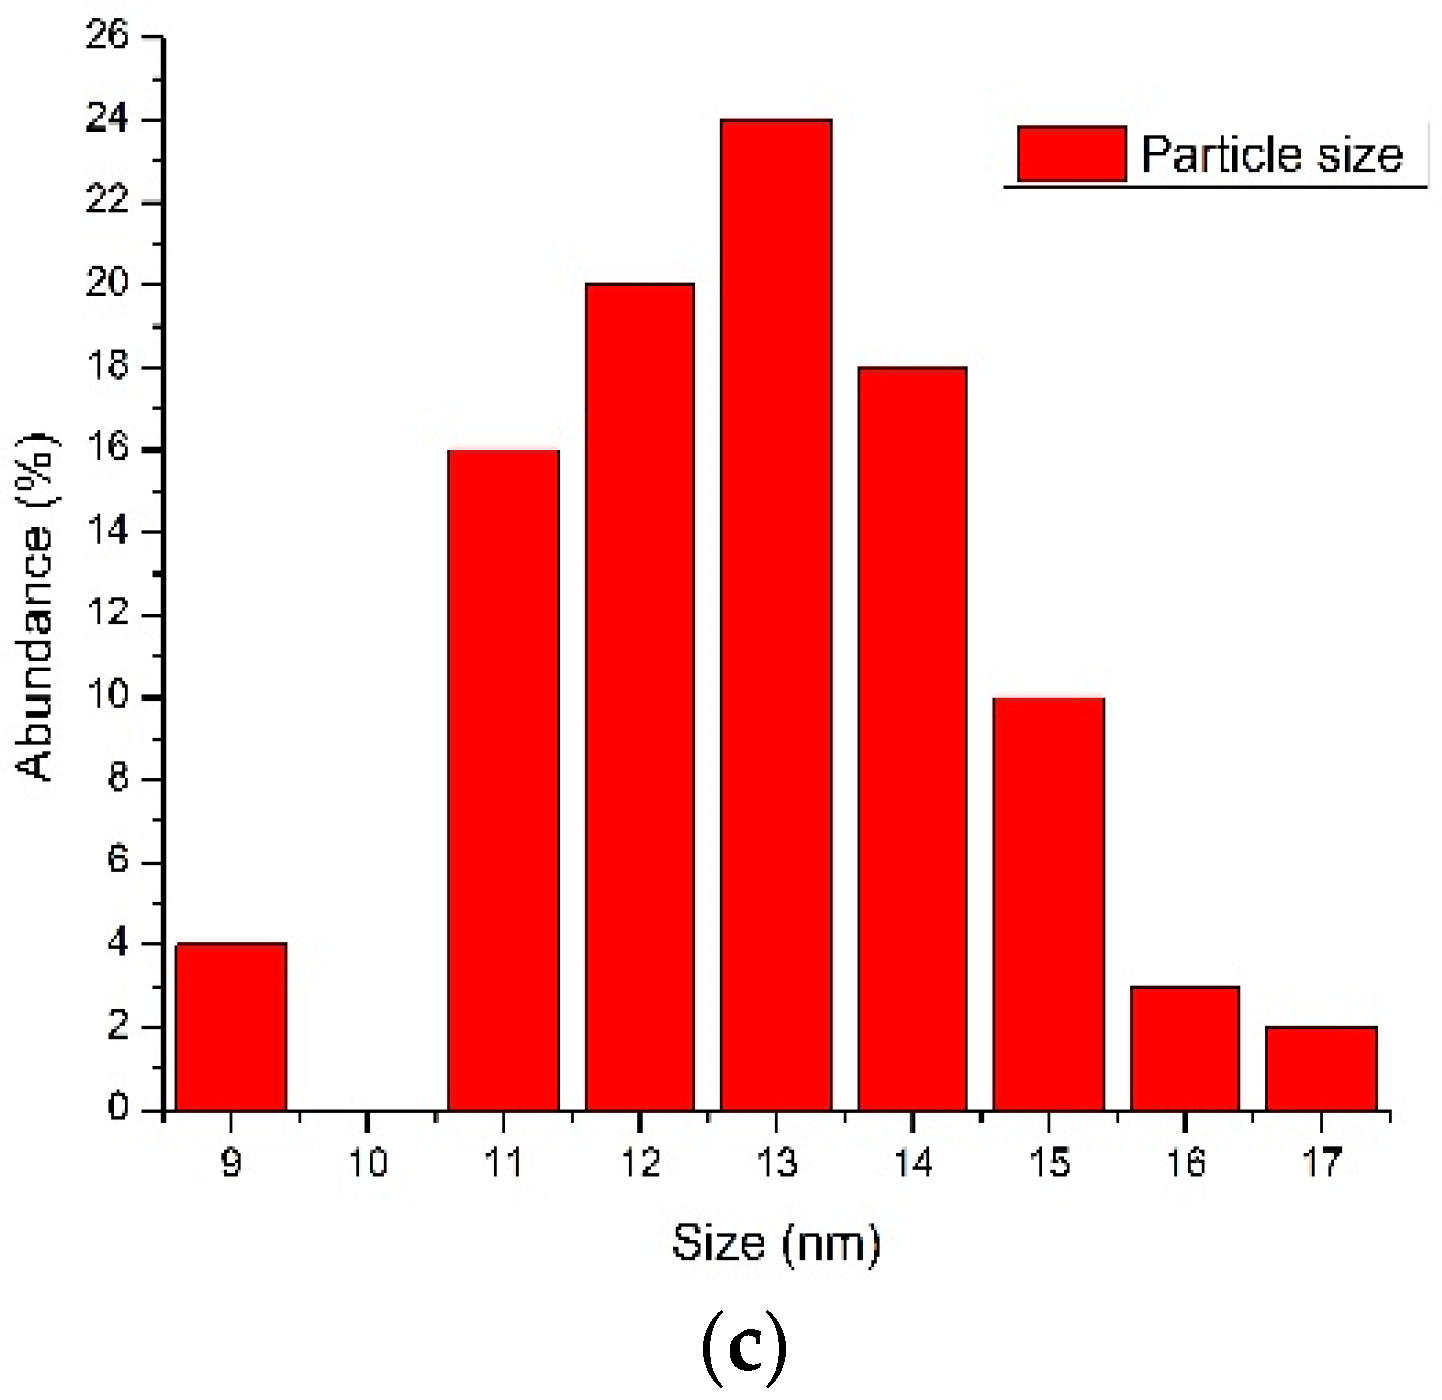
3.2.2. Particle Size Estimation

The particle size was calculated by using a formula proposed by Brus [38], which had been already applied by Lee [39] for estimating the particle size of TiO2-based nanomaterials. Supposing a particle with a spherical shape; the radius of the TiO2 particle can be calculated by Equation (4):
Δ E g = h 2 π 2 2 R 2 μ 1.8 e 2 ε R
where ΔEg the difference between the bulk’s bandgap, and the material’s bandgap, measured experimentally, R is the radius of the nanoparticle, ε is the dielectric constant, μ is the reduced mass of the exciton ( μ 1 = m e 1 + m h 1 ), h is Planck’s constant, and m e y m h are the effective mass of the electron and the hole, respectively. In our case, Eg = 3.2 eV, m e = 0.8 m e , and m h = 10 m e . The particle size (2R) for prepared samples is also given in the last column from left to right of Table 1. The average size for the particles is 13.80 ± 3.05 nm.

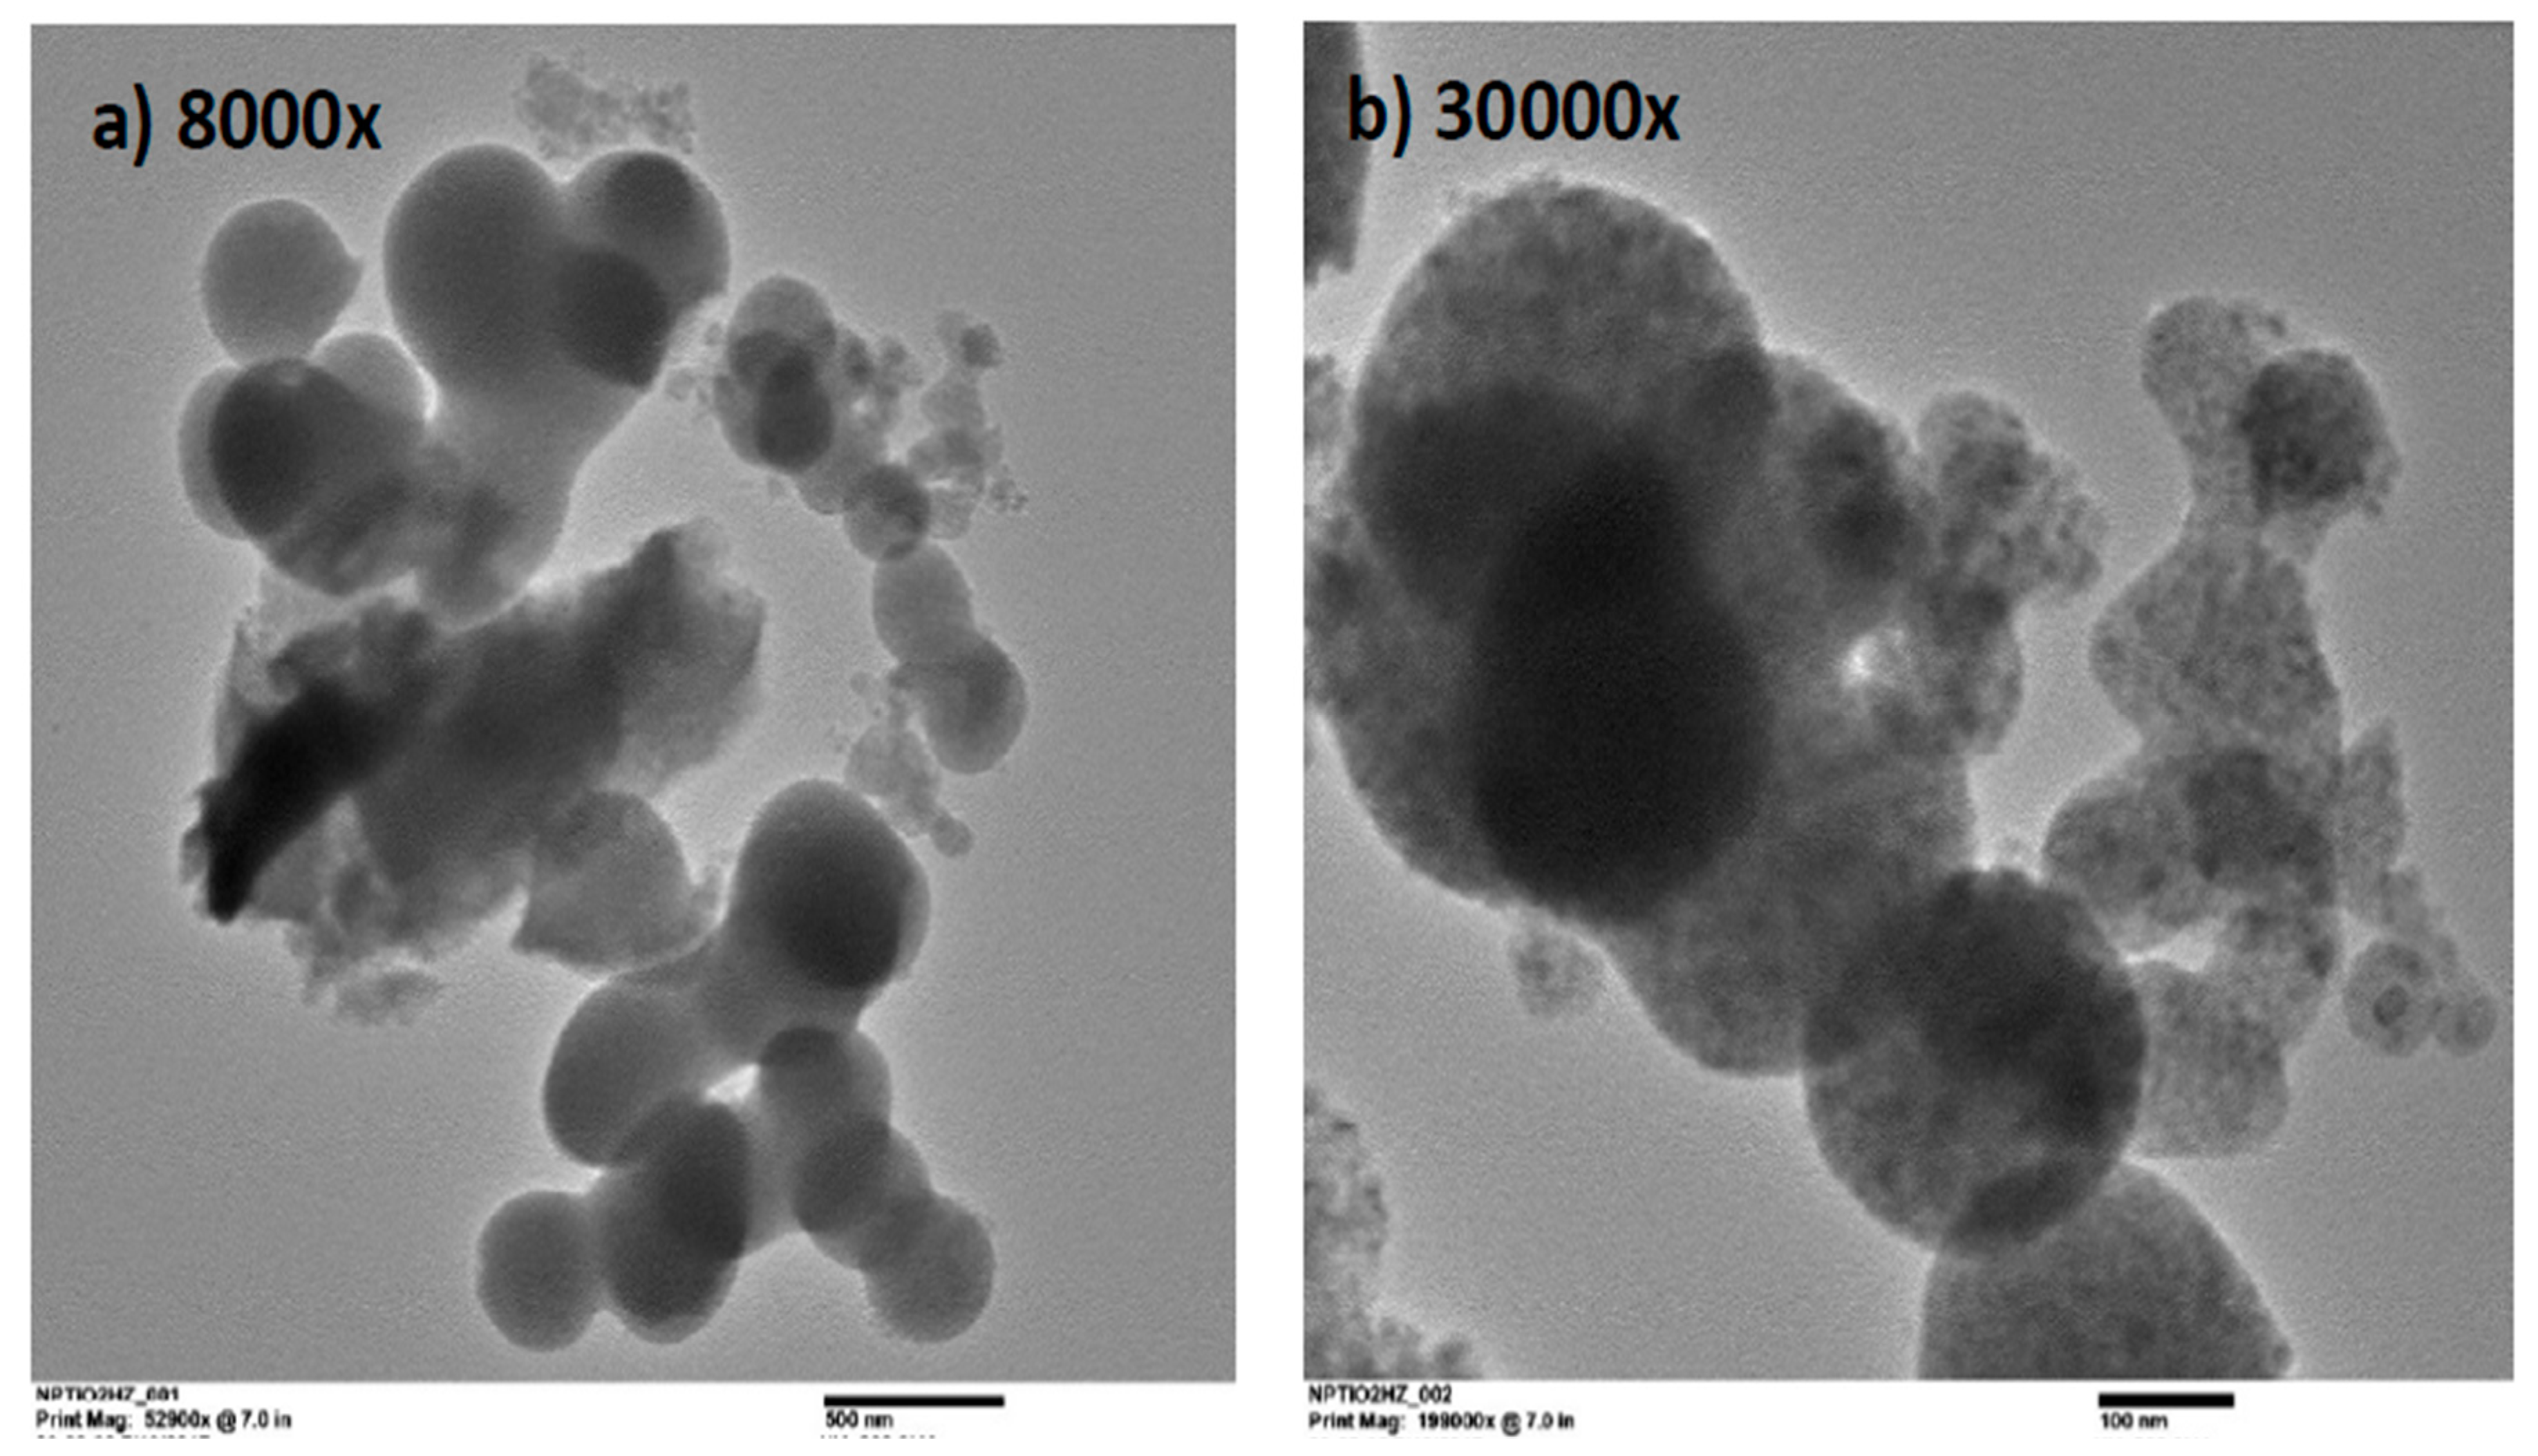
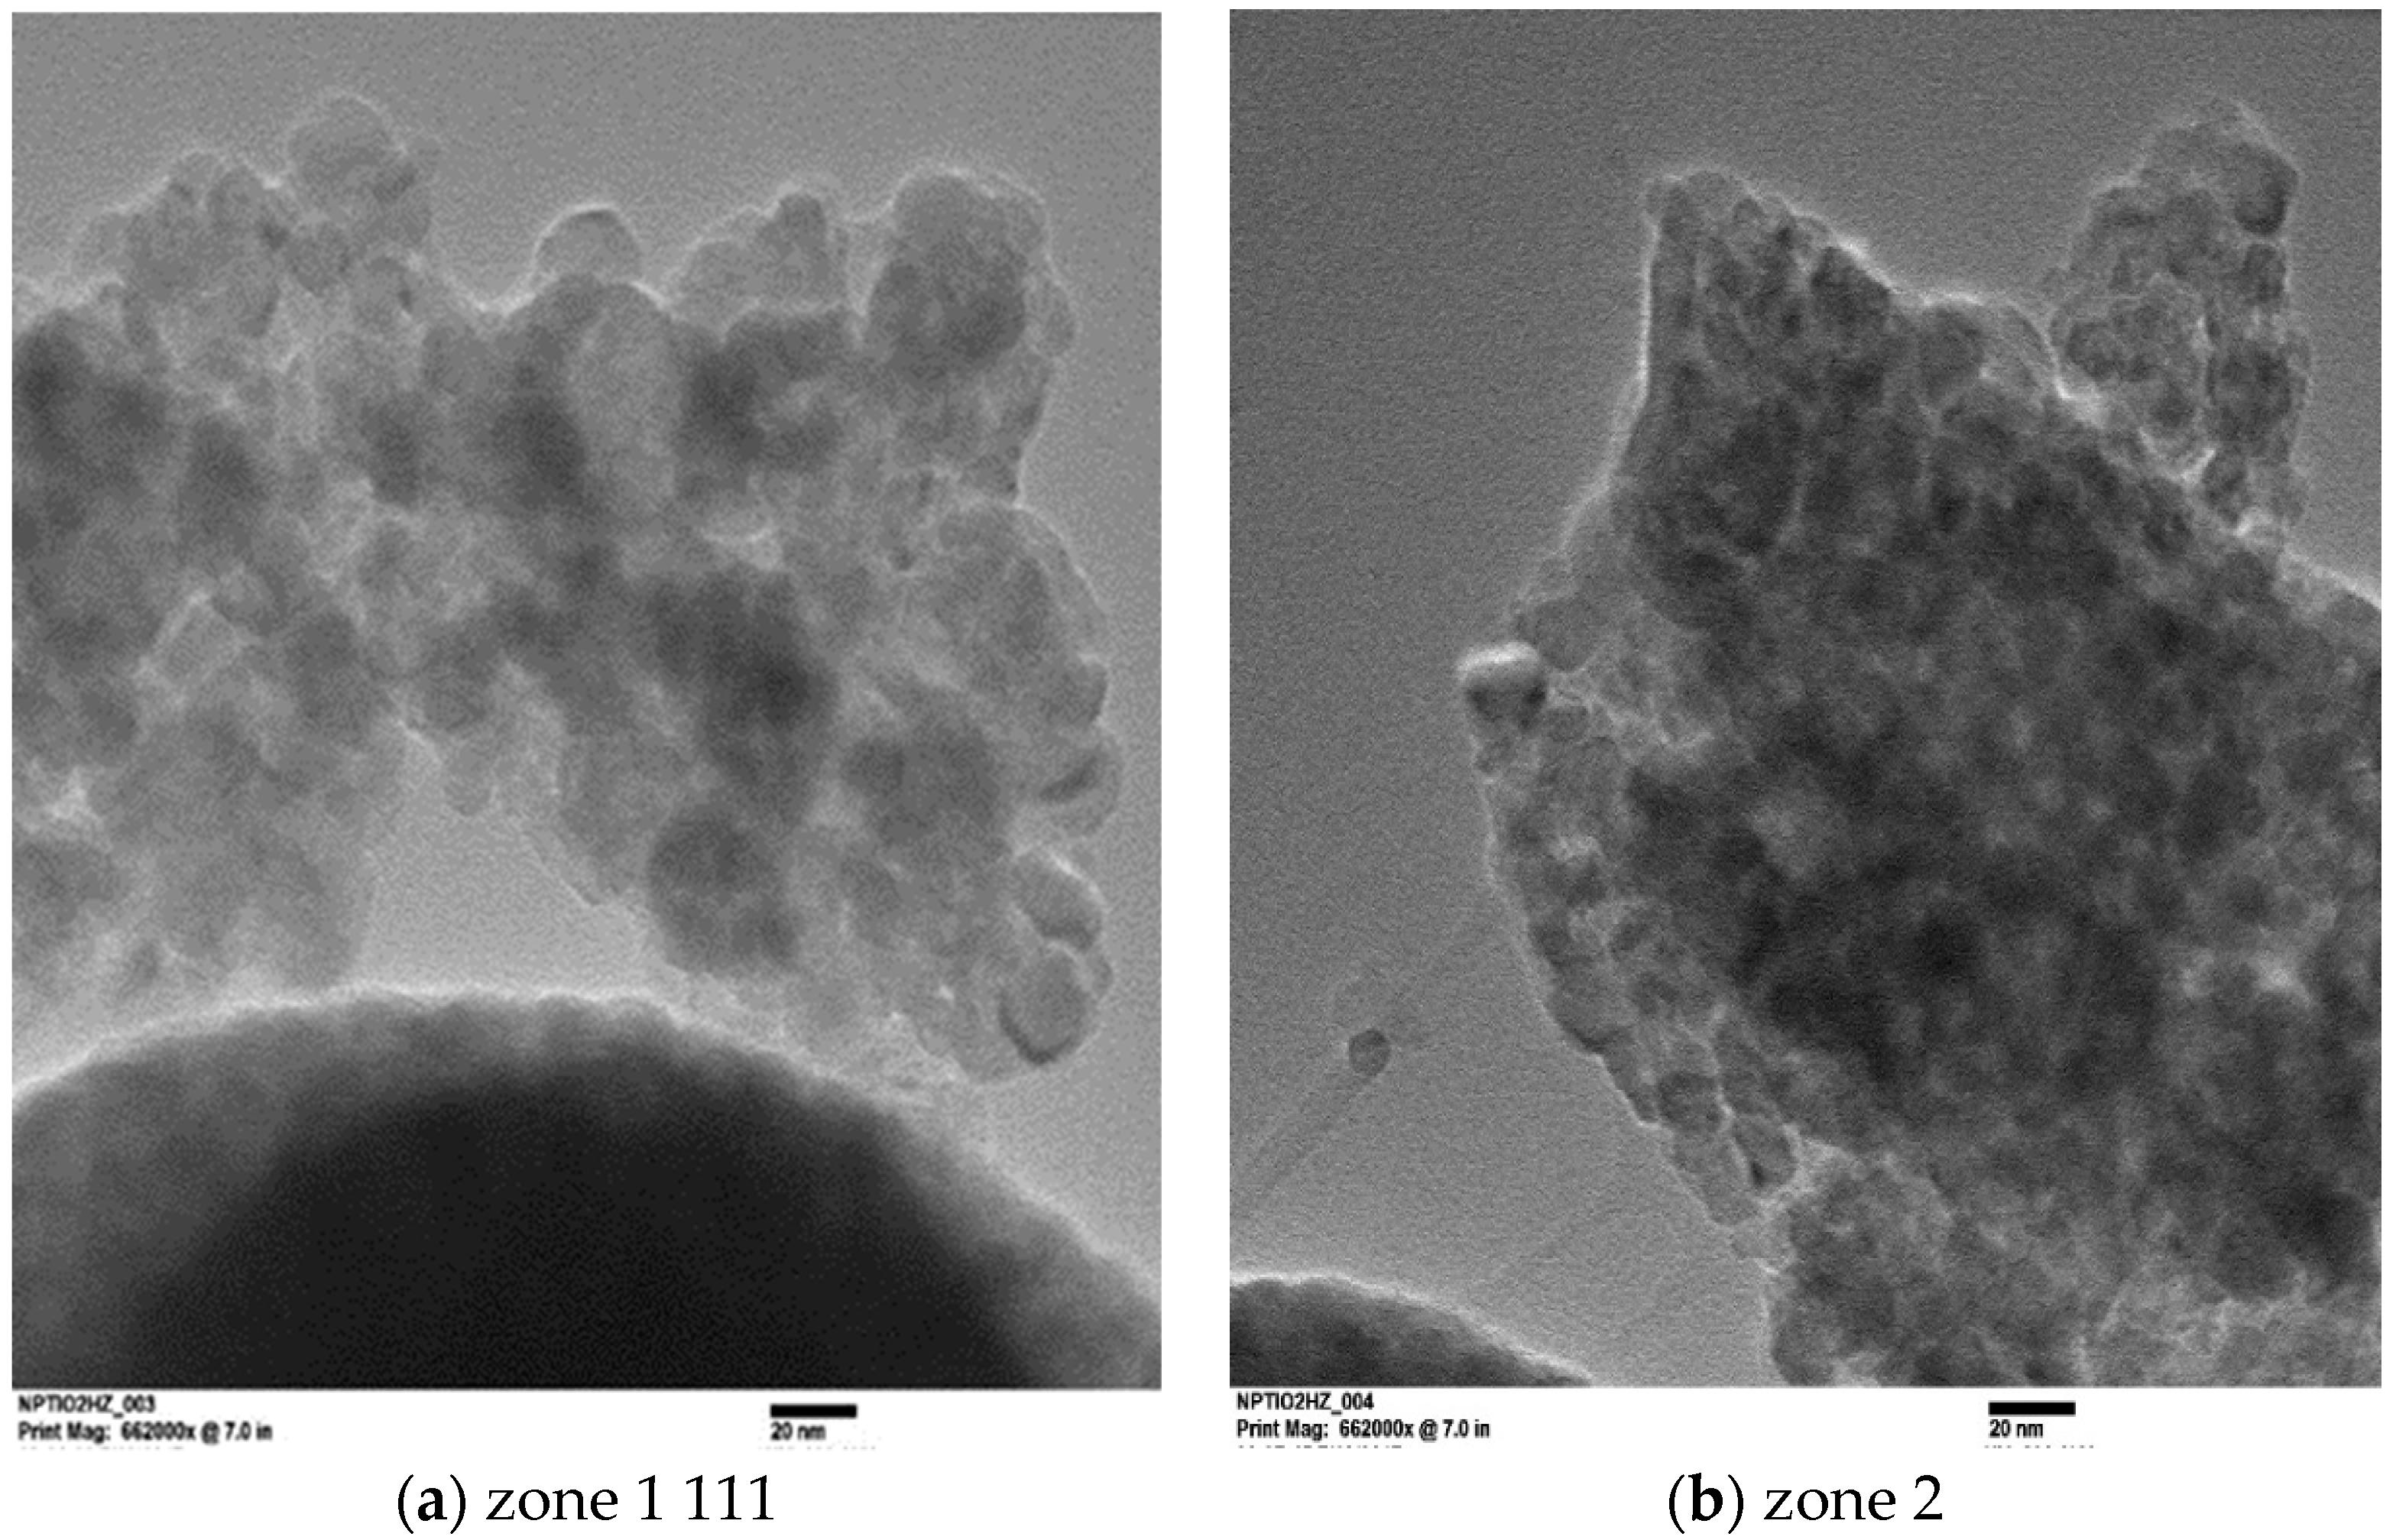
3.3. TiO2 Microstructure

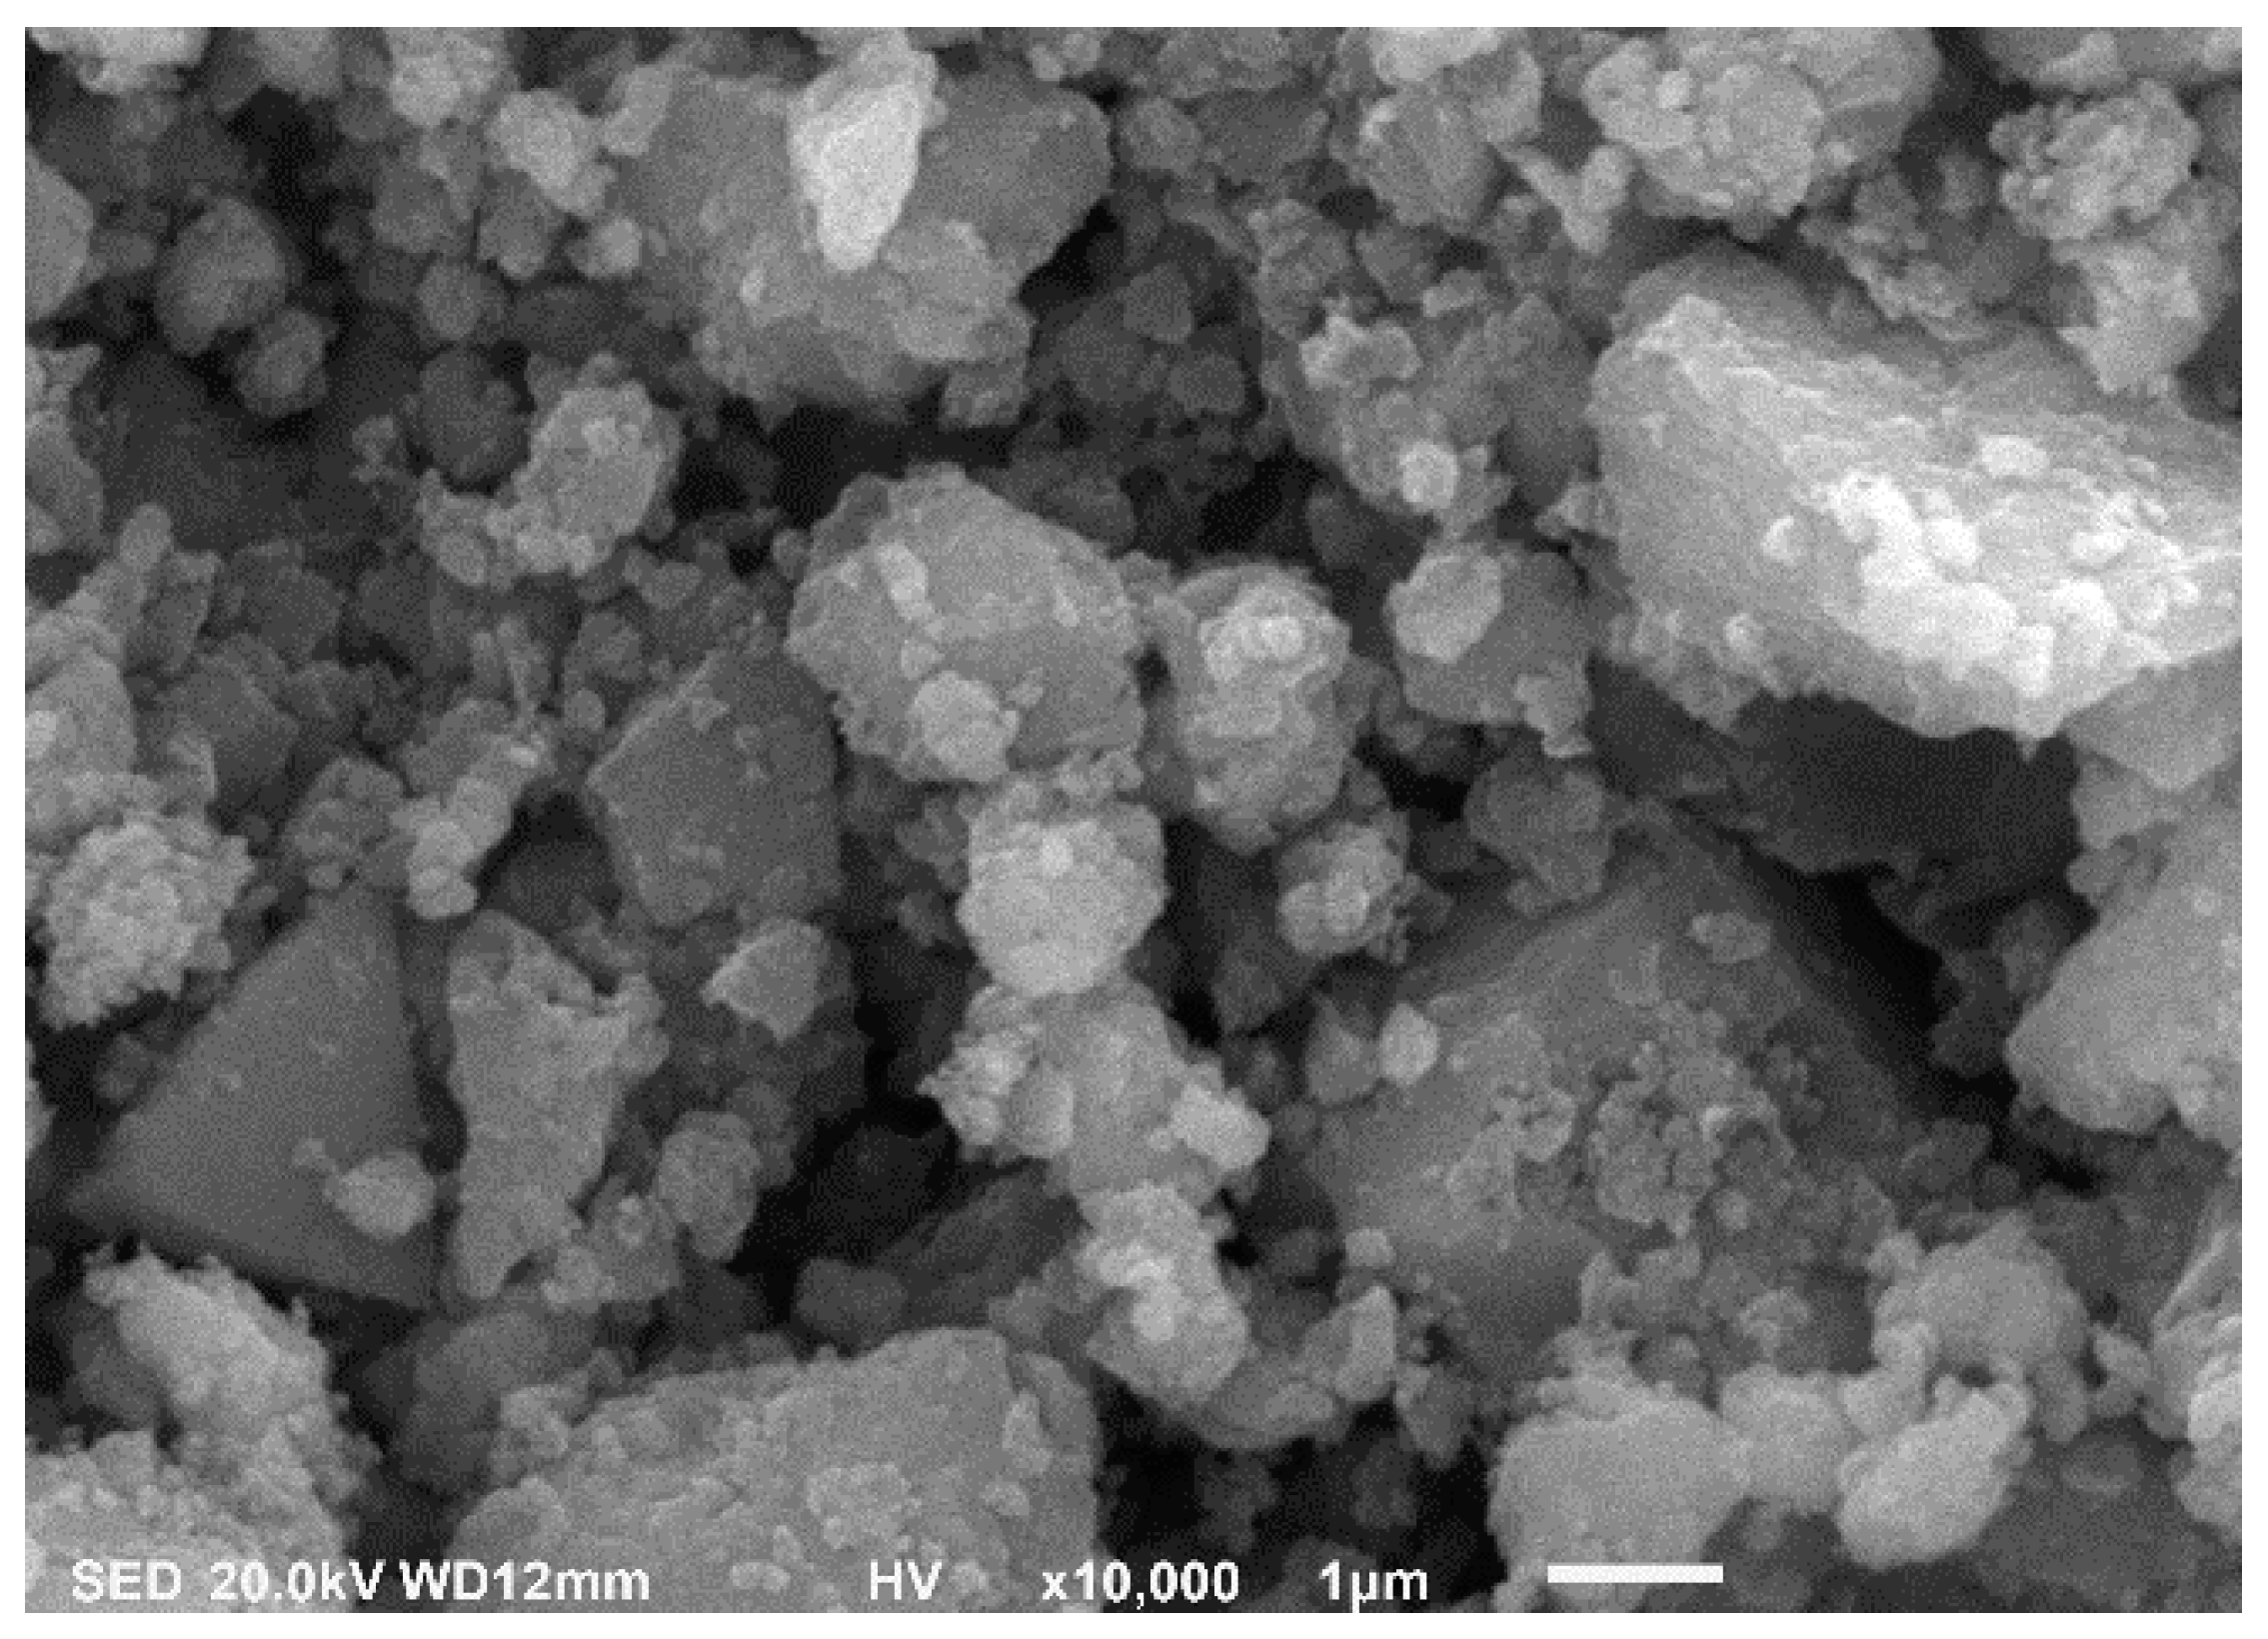
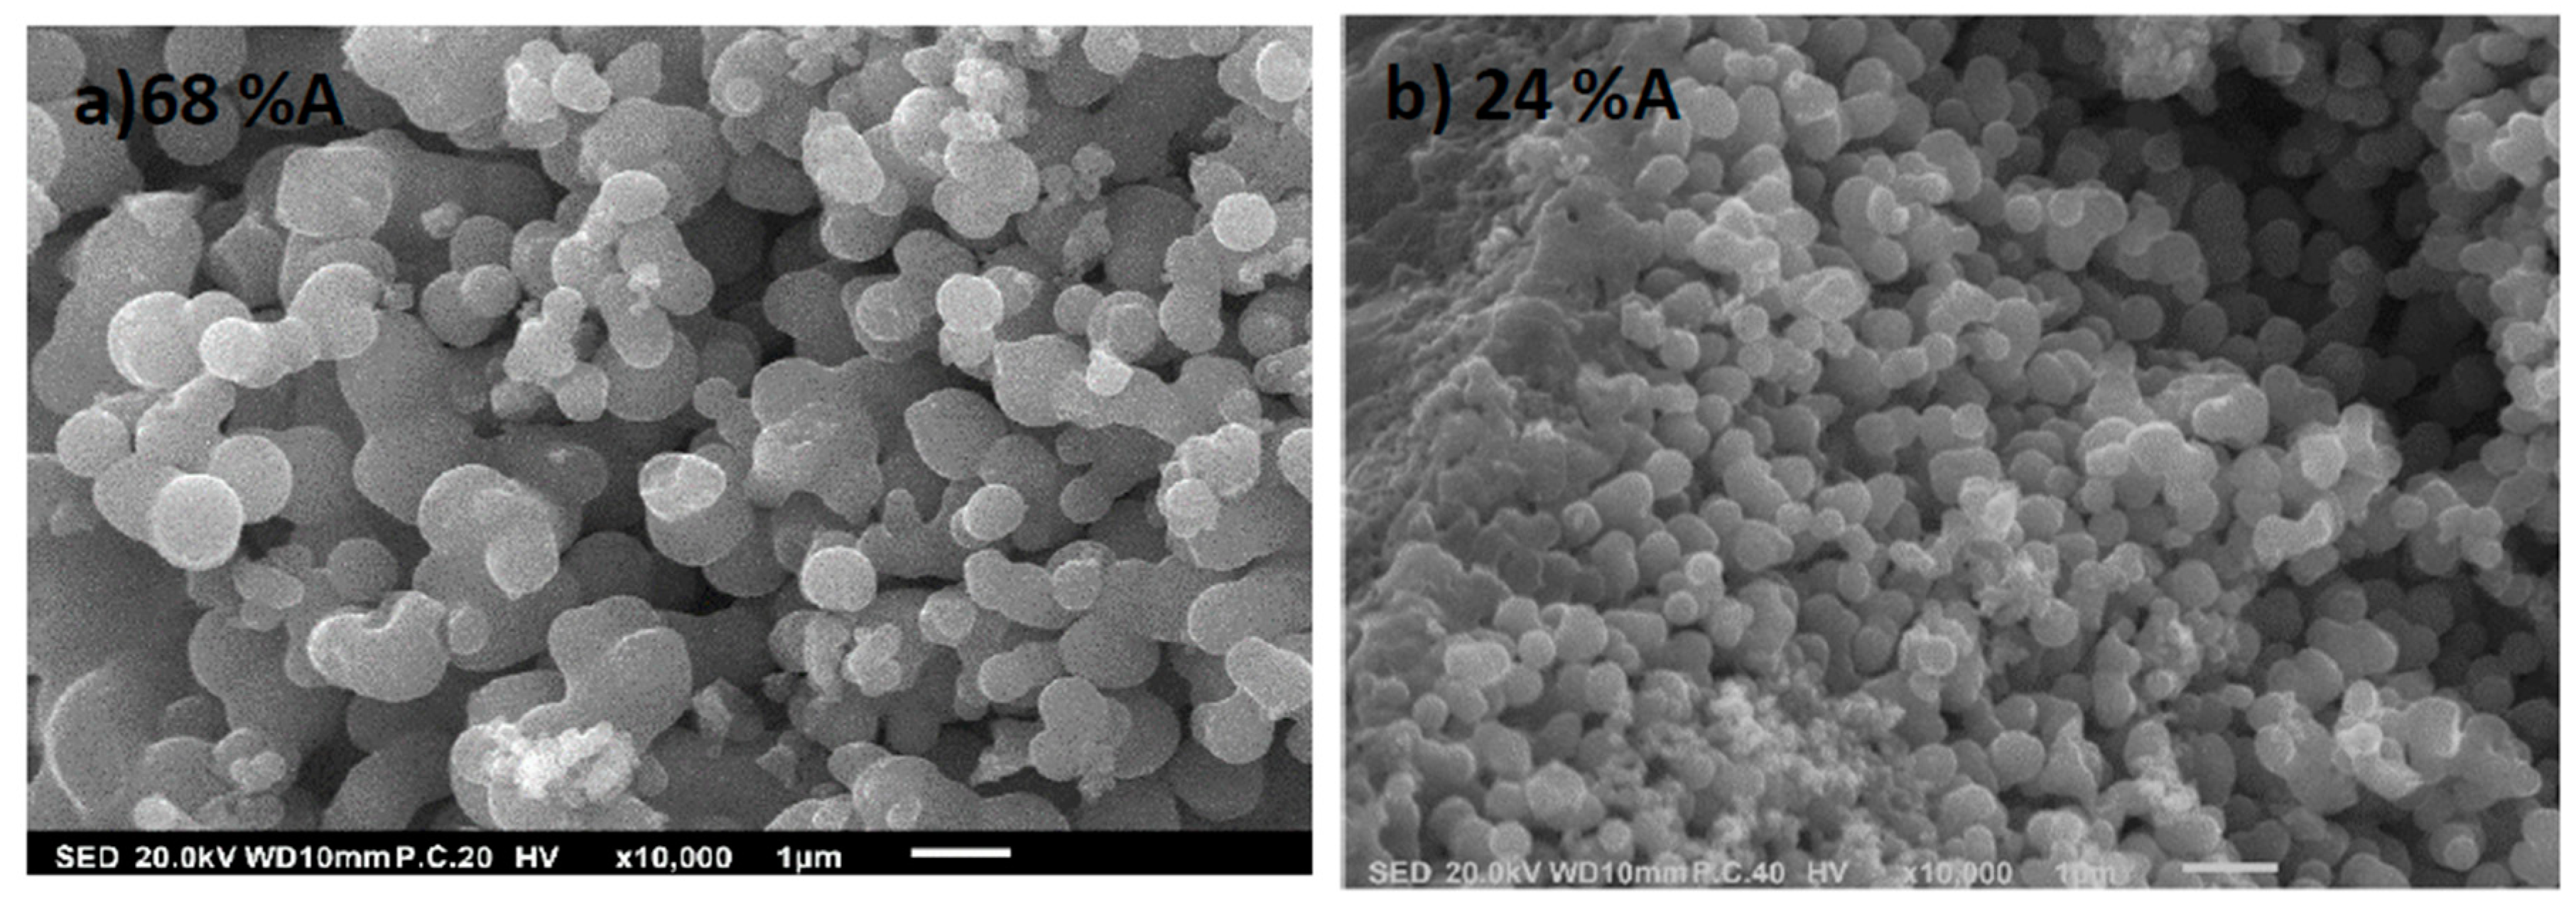
3.3.1. Scanning Electron Microscopy (SEM)

Figure 7 is a representative image of the amorphous TiO2 powders synthesized by sol-gel. As can be seen, there is no trend in morphology, and only irregular agglomerates with different sizes were found. Figure 8 shows the SEM images corresponding to two samples of TiO2 powders with mixed anatase/rutile phases, containing 68% anatase and 32% rutile (Figure 8a), and 24% anatase and 76% rutile (Figure 8b). The morphology is observed to be composed by spherical TiO2 particles with uniform sizes. Such a morphology was also found for other anatase/rutile ratios.
Micrographs analysis allows for corroboration, in that all of the results acquired match with the literature, since the thermal treatment of the TiO2-based materials not only affects the crystalline phases present, but also the material’s morphology [25].

3.3.2. Transmission Electron Microscopy (TEM)

A TiO2 sample containing 24% anatase and 76% rutile was studied by TEM. In Figure 9a (8000×) and 9b (30,000×), the presence of agglomerates composed by spherical particles with nanometer sizes can be observed; which is consistent with observations performed with SEM. Figure 10a,b shows images taken at 100,000× of the same sample. It can be observed that the spherical particles are formed by smaller particles, as was inferred by UV–VIS. The inset in Figure 9 shows a histogram with a size distribution obtained by particle counting. The histogram reveals that the maximum abundance (24%) is located at 13 nm, with a relatively narrow distribution between 9 and 17 nm.
There is a good agreement between the estimated size by UV–VIS–NIR spectroscopy (~13.80 nm), and the real size measured with TEM (~13 nm). This allows for an additional tool in the absence of a TEM.

4. Conclusions

This work shows that it is possible to control the anatase/rutile ratio of nanostructured TiO2, by varying the time in a second annealing step. Different ratios were acquired, ranging from 100% anatase and 0% rutile, to 0% anatase and 100% rutile. The bandgap and the particle size were obtained using DRS, and they are in good agreement with the measurements done by TEM. Using DRS has two advantages: the sample preparation is significantly easier, and this method can be used in the absence of TEM. On the other hand, no direct relationship between the anatase/rutile ratio and the bandgap was found. Thus, photocatalytic activity on the nanostructured TiO2 could be evaluated by using the anatase/rutile ratio, neglecting the relationship between the particle size and the value of the band gap with photocatalysis. Furthermore, it was also shown that is possible to obtain band gaps with values as low as 2.56 eV ( λ = 484 nm), that lie in the visible range. It must be noted that the photocatalytic performance of TiO2 not only depends the bandgap or the crystalline phase present. There are other parameters, such as surface area, chemical species adsorbed, dopants, and particle sizes, which also have an important effect on the photocatalytic performance. Subsequent works will be focused on studying the surface area by the Brunauer-Emmett-Teller theory of mixed-phase powders and its photocatalytic activity, in the degradation of a dye as a model pollutant, using visible light.

Author Contributions

Conceptualization, Á.E.-P.; Formal analysis, M.C.-L. and G.V.-S.; Investigation, V.H.C.-S. and R.L.; Methodology, M.R.-G.; Project administration, R.L.; Writing—review & editing, R.L.

Funding

This research received no external funding.

Acknowledgments

The authors would like to thank Enrique Camps Carvajal from the Instituto Nacional de Investigaciones Nucleares (ININ) for his technical support.

Conflicts of Interest

The authors declare no conflict interest.

References

  1. Haider, A.J.; Al-Anabari, R.H.; Kadhim, G.R.; Salame, T.C. Exploring potential Environmental applications of TiO2 Nanoparticles. Energy Procedia 2017, 119, 332–345. [Google Scholar] [CrossRef]
  2. Fujishima, A.; Zhang, X.; Tryk, D.A. TiO2 photocatalysis and related surface phenomena. Surf. Sci. Rep. 2008, 63, 515–582. [Google Scholar] [CrossRef]
  3. Fujishima, A.; Honda, K. Electrochemical Photolysis of Water at a Semiconductor Electrode. Nature 1972, 238, 37–38. [Google Scholar] [CrossRef] [PubMed]
  4. Qiu, Y.; Ouyang, F.; Zhu, R. A facile nonaqueous route for preparing mixed-phase TiO2 with high activity in photocatalytic hydrogen generation. Int. J. Hydrog. Energy 2017, 42, 11364–11371. [Google Scholar] [CrossRef]
  5. Xiong, J.; Das, S.N.; Kim, S.; Lim, J.; Choi, H.; Myoung, J.M. Photo-induced hydrophilic properties of reactive RF magnetron sputtered TiO2 thin films. Surf. Coat. Technol. 2010, 204, 3436–3442. [Google Scholar] [CrossRef]
  6. Zhang, Y.; Chen, Y.; Li, X. Preparation and Photocatalytic Performance of Anatase/Rutile Mixed-Phase TiO2 Nanotubes. Catal. Lett. 2010, 139, 129–133. [Google Scholar] [CrossRef]
  7. Hashimoto, K.; Irie, H.; Fujishima, A. TiO2 Photocatalysis: A Historical Overview and Future Prospects. Jpn. J. Appl. Phys. 2005, 44, 8269–8285. [Google Scholar] [CrossRef]
  8. Hanaor, D.A.; Sorrel, C.C. Review of the anatase to rutile phase transformation. J. Mater. Sci. 2011, 46, 855–874. [Google Scholar] [CrossRef]
  9. Boehme, M.; Ensinger, W. Mixed Phase Anatase/rutile Titanium Dioxide Nanotubes for Enhanced Photocatalytic Degradation of Methylene-blue. Nano Micro Lett. 2011, 3, 236–241. [Google Scholar] [CrossRef]
  10. Bernardini, C.; Cappelletti, G.; Dozzi, M.V.; Selli, E.J. Photocatalytic degradation of organic molecules in water: photoactivity and reaction paths in relation to TiO2 particles features. Photochem. Photobiol. A Chem. 2010, 211, 185–192. [Google Scholar] [CrossRef]
  11. Hussain, M.; Ceccarelli, R.; Marchisio, D.; Fino, N.R.D.; Geobaldo, F. Synthesis, characterization, and photocatalytic application of novel TiO2 nanoparticles. Chem. Eng. J. 2010, 157, 45–51. [Google Scholar] [CrossRef]
  12. Ohno, T.; Sarukawa, K.; Tokieda, K.; Matsumura, M.J. Morphology of a TiO2 Photocatalyst (Degussa, P-25) Consisting of Anatase and Rutile Crystalline Phases. J. Catal. 2001, 203, 82–86. [Google Scholar] [CrossRef]
  13. Ohtani, B.; Prieto-Mahaney, O.O.; Li, D.; Abe, R.J. What is Degussa (Evonik) P25? Crystalline composition analysis, reconstruction from isolated pure particles and photocatalytic activity test. Photochem. Photobiol. A Chem. 2010, 216, 179–182. [Google Scholar] [CrossRef]
  14. Jiang, X.; Manawan, M.; Feng, T.; Qian, R.; Zhao, T.; Zhou, G.; Kong, F.; Wange, Q.; Dai, S.; Pan, J.H. Anatase and rutile in evonik aeroxide P25: Heterojunctioned or individual nanoparticles? Catal. Today 2018, 300, 12–17. [Google Scholar] [CrossRef]
  15. Markowska-Szczupak, A.; Wang, K.; Rokicka, P.; Endo, M.; Wei, Z.; Ohtani, B.; Morawski, A.W.; Kowalska, E. J. The effect of anatase and rutile crystallites isolated from titania P25 photocatalyst on growth of selected mould fungi. Photochem. Photobiol. B Biol. 2015, 151, 54–62. [Google Scholar] [CrossRef] [PubMed]
  16. Wang, D.-Y.; Lin, H.-C.; Yen, C.-C. Influence of metal plasma ion implantation on photo-sensitivity of anatase TiO2 thin films. Thin Solid Films 2006, 515, 1047–1052. [Google Scholar] [CrossRef]
  17. Fassier, M.; Peyratout, C.; Smith, D.; Ducroquetz, C.; Voland, T. Photocatalytic activity of titanium dioxide coatings: Influence of the firing temperature of the chemical gel. J. Eur. Ceram. Soc. 2010, 30, 2757–2762. [Google Scholar] [CrossRef]
  18. Terabe, K.; Kato, K.; Miyazaki, H.; Yamaguchi, S.; Imai, A.; Iguchi, Y. Microstructure and crystallization behaviour of TiO2 precursor prepared by the sol-gel method using metal alkoxide. J. Mater. Sci. 1994, 29, 1617–1622. [Google Scholar] [CrossRef]
  19. Ohno, T.; Haga, D.; Fujihara, K.; Kaizaki, K.; Matsumara, M.J. Unique Effects of Iron(III) Ions on Photocatalytic and Photoelectrochemical Properties of Titanium Dioxide. Phys. Chem. B 1997, 101, 6415–6419. [Google Scholar] [CrossRef]
  20. Okada, K.; Yamamoto, N.; Kameshima, Y.; Yasumori, A. Effect of Silica Aditive on the Anatase-to-Rutile transition. J. Am. Ceram. Soc. 2001, 84, 1591–1596. [Google Scholar] [CrossRef]
  21. Shin, H.; Jung, H.S.; Hong, K.S.; Lee, J.K. Crystal phase evolution of TiO2 nanoparticles with reaction time in acidic solutions studied via freeze-drying method. J. Solid State Chem. 2005, 178, 15–21. [Google Scholar] [CrossRef]
  22. Ghosh, T.B.; Dhabal, S.J.; Datta, A.K. On crystallite size dependence of phase stability of nanocrystalline TiO2. Appl. Phys. 2003, 94, 4577–4582. [Google Scholar] [CrossRef]
  23. Zhang, H.; Banfield, J.F. Thermodynamic analysis of phase stability of nanocrystalline titania. J. Mater. Chem. 1998, 8, 2073–2076. [Google Scholar] [CrossRef]
  24. Jamieson, J.C.; Olinger, B. Pressure-Temperature studies of anatase, brookite rutile, and TiO2(ii): A discussion. Am. Mineral. 1969, 54, 1447–1481. [Google Scholar]
  25. Kim, J.; Song, K.C.; Fondacillas, S.; Pratsinis, S.E. Dopants for synthesis of stable bimodally porous titania. J. Eur. Ceram. Soc. 2001, 21, 2863–2872. [Google Scholar] [CrossRef]
  26. Shannon, R.D.; Pask, J.A. Kinetics of the anatase-rutile transformation. J. Am. Ceram. Soc. 1969, 48, 391–398. [Google Scholar] [CrossRef]
  27. Zhang, H.; Banfield, J.F. Phase transformation of nanocrystalline anatase-to-rutile via combined interface and surface nucleation. J. Mater. Res. 2000, 15, 437–448. [Google Scholar] [CrossRef]
  28. Mahshid, S.; Askari, M.; Ghamsari, M.S.; Afshr, N.; Lahuti, S. Mixed-phase TiO2 nanoparticles preparation using sol–gel method. J. Alloys Compd. 2009, 478, 586–589. [Google Scholar] [CrossRef]
  29. Barringer, E.A.; Bowen, H.K. Formation, Packing, and Sintering of Monodisperse TiO2 Powders. J. Am. Ceram. Soc. 1982, 65, C-199–C-201. [Google Scholar] [CrossRef]
  30. Castrejón-Sánchez, V.; Camps, E.; Camacho-López, M. Quantification of phase content in TiO2 thin films by Raman spectroscopy. Superf. Vacío 2014, 27, 88–92. [Google Scholar]
  31. Spurr, R.A.; Myers, H. Quantitative Analysis of Anatase-Rutile Mixtures with an X-Ray Diffractometer. Anal. Chem. 1957, 29, 760–762. [Google Scholar] [CrossRef]
  32. Boukrouh, S.; Bensaha, R.; Bourgeois, S.; Finot, E.; Marcos de Lucas, M.C. Reactive direct current magnetron sputtered TiO2 thin films with amorphous to crystalline structures. Thin Solid Films 2008, 516, 6353–6358. [Google Scholar] [CrossRef]
  33. Schulte, K.L.; DeSario, P.A.; Gray, K.A. Effect of crystal phase composition on the reductive and oxidative abilities of TiO2 nanotubes under UV and visible light. Appl. Catal. B Environ. 2010, 97, 354–360. [Google Scholar] [CrossRef]
  34. Hurum, D.; Agrios, A.; Crist, S.; Gray, K.; Rajh, T.; Thurnauer, M.J. Probing reaction mechanisms in mixed phase TiO2 by EPR. Electron. Spectros. Relat. Phenom. 2006, 150, 155–163. [Google Scholar] [CrossRef]
  35. Luis, A.M.; Neves, M.C.; Mendoça, M.H.; Monteiro, O.C. Influence of calcination parameters on the TiO2 photocatalytic properties. Mater. Chem. Phys. 2011, 125, 20–25. [Google Scholar] [CrossRef]
  36. Paul, S.; Choudhury, A.A. Investigation of the optical property and photocatalytic activity of mixed phase nanocrystalline titania. Appl. Nanosci. 2014, 4, 839–847. [Google Scholar] [CrossRef]
  37. Escobedo-Morales, A.; Sánchez-Mora, E.; Pal, U. Use of diffuse reflectance spectroscopy for optical characterization of un-supported nanostructures. Rev. Mex. Física 2007, 53, 18–22. [Google Scholar]
  38. Brus, L. Electronic wave functions in semiconductor clusters: experiment and theory. J. Phys. Chem. 1986, 90, 2555–2560. [Google Scholar] [CrossRef]
  39. Lee, H.S.; Woo, C.S.; Youn, B.K.; Kim, S.; Oh, S.; Sung, Y.; Lee, H. Bandgap modulation of TiO2 and its effect on the activity in photocatalytic oxidation of 2-isopropyl-6-methyl-4-pyrimidinol. Top. Catal. 2005, 35, 255–260. [Google Scholar] [CrossRef]
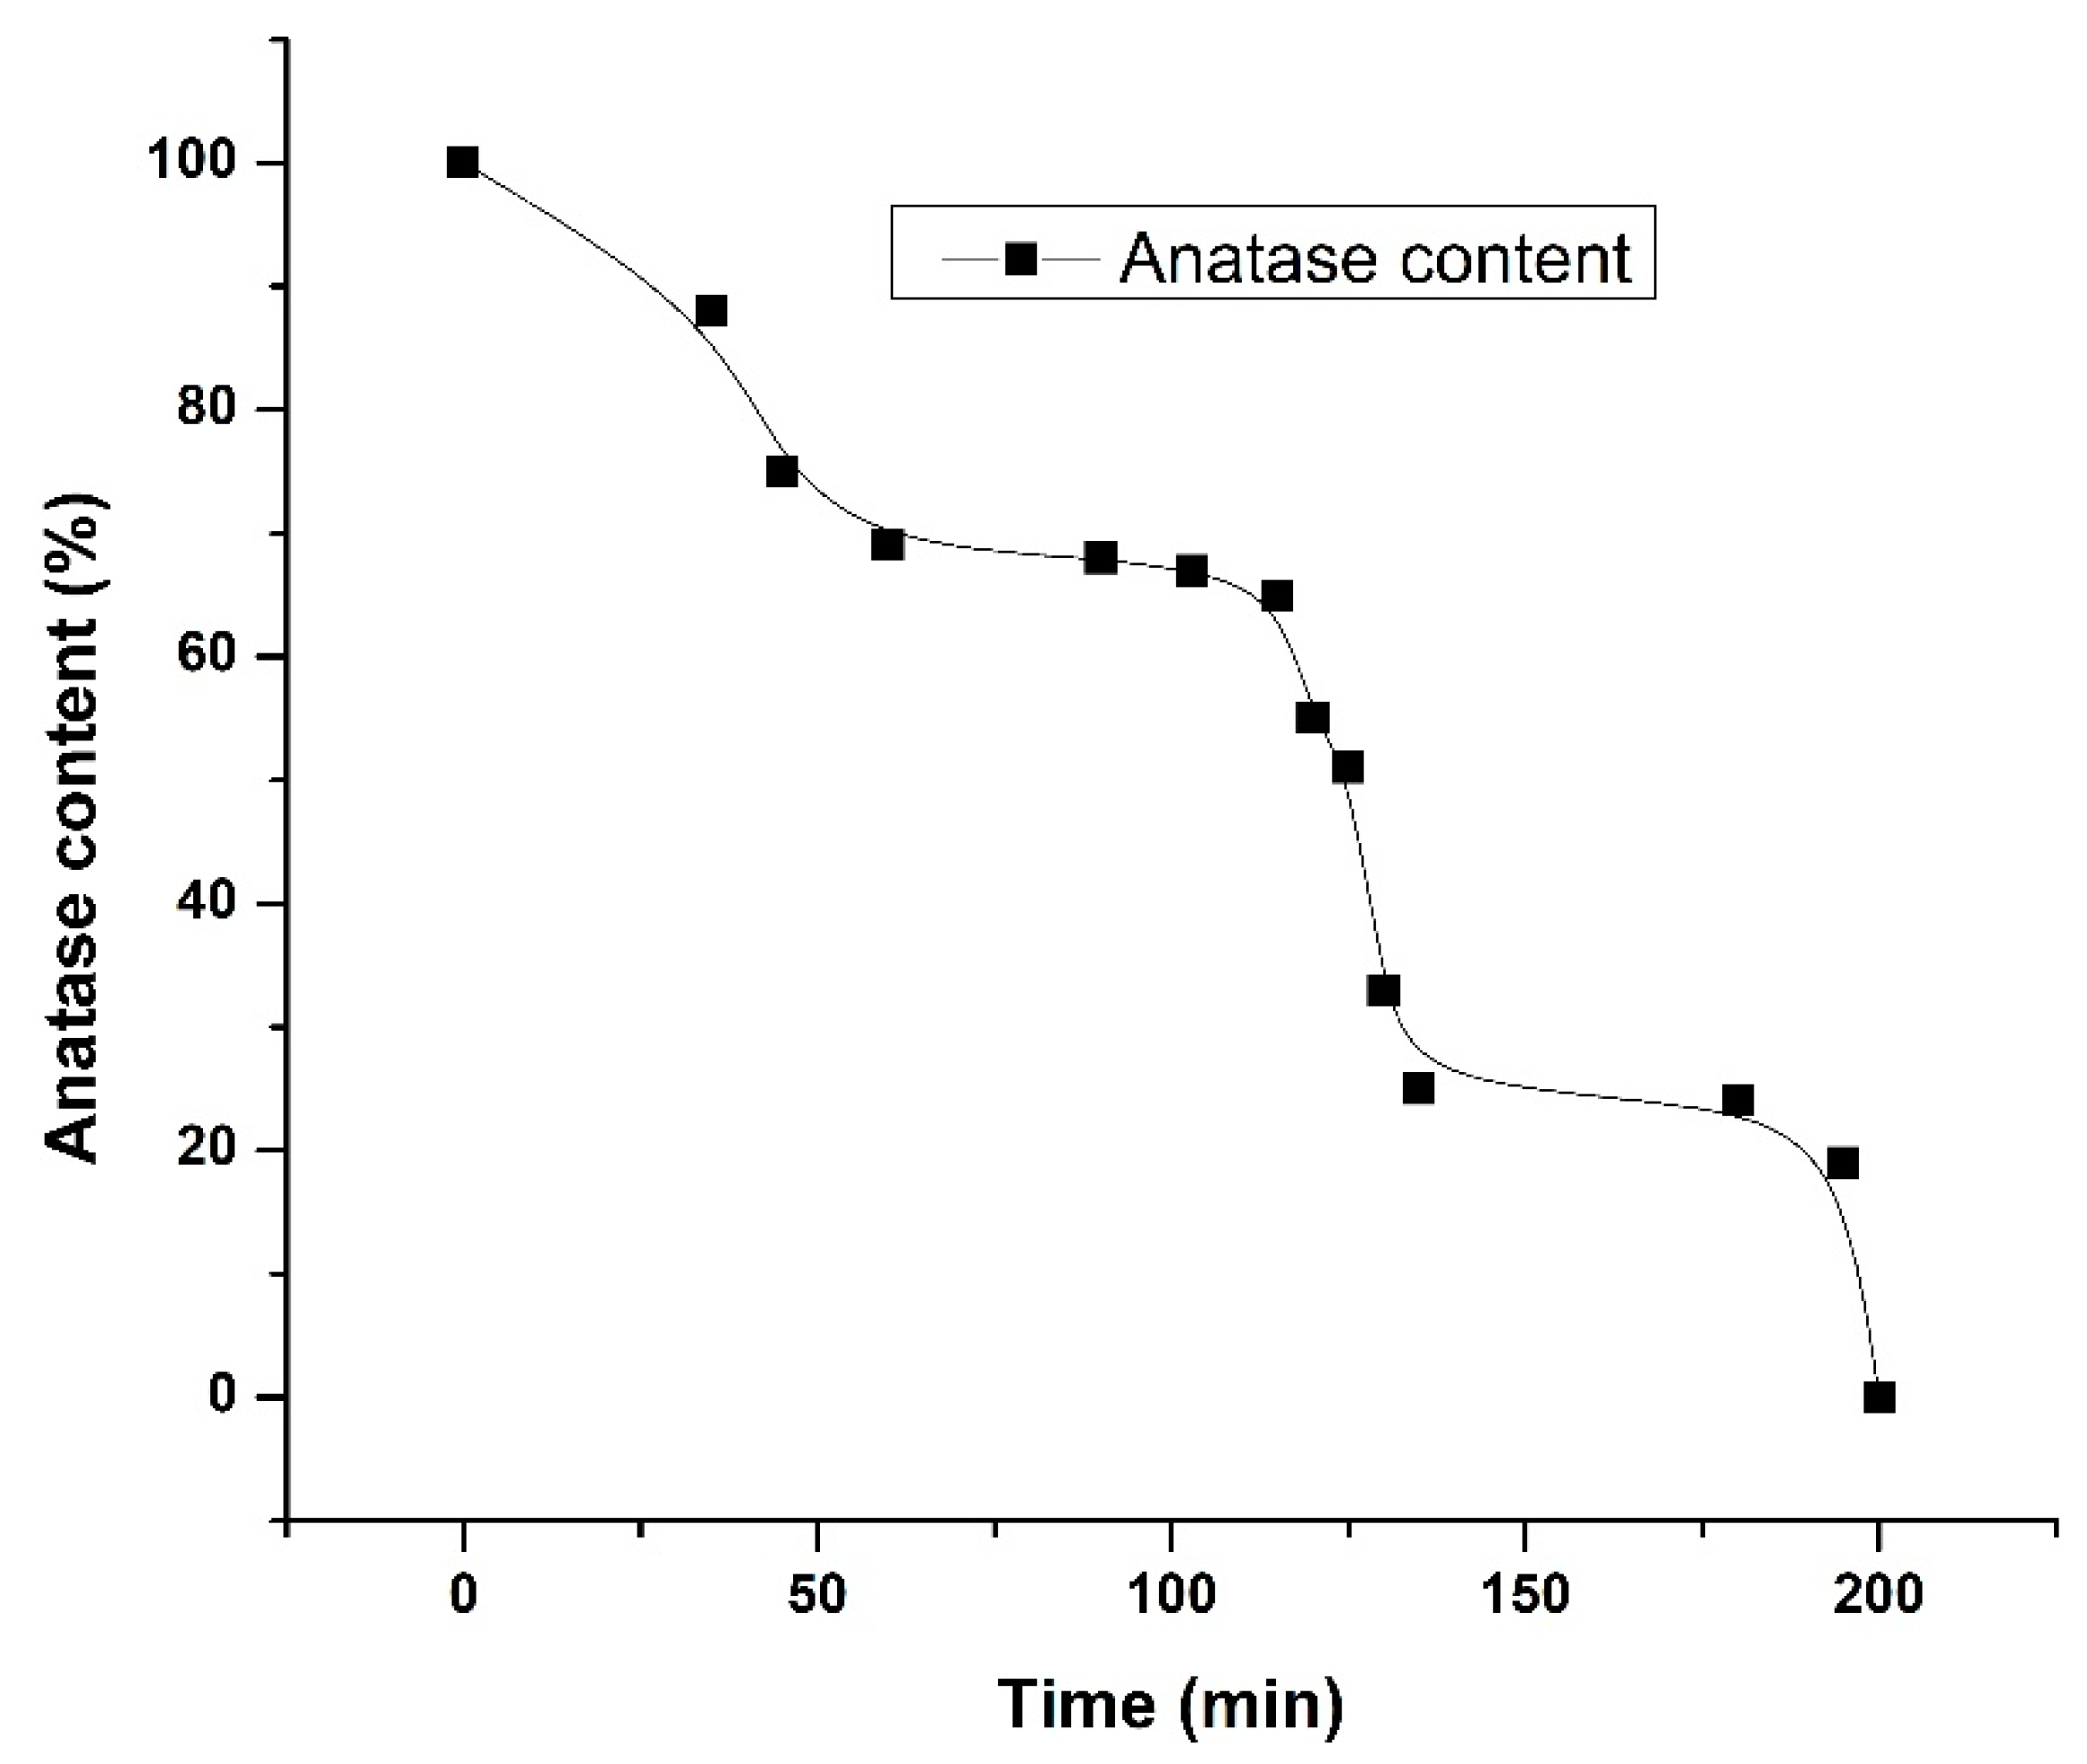
Figure 1. Raman spectra for as-synthesized TiO2 powders.
Crystals 09 00022 g001
Figure 2. Raman spectrum after the first annealing at 250 °C for 2 h under an ambient atmosphere.
Crystals 09 00022 g002
Figure 3. Raman spectra for samples annealed at 475 °C for (a) 103 min and (b) 115 min.
Crystals 09 00022 g003
Figure 4. Anatase content as a function of annealing time for TiO2 powders.
Crystals 09 00022 g004
Figure 5. Diffuse reflectance spectrum for a sample containing 68% of anatase.
Crystals 09 00022 g005
Figure 6. Reflectance spectrum for a sample containing 0% anatase.
Crystals 09 00022 g006
Figure 7. Scanning electron microscopy (SEM) image for TiO2 powders synthesized by sol-gel.
Crystals 09 00022 g007
Figure 8. SEM images for annealing times of (a) 60 min and (b) 180 min.
Crystals 09 00022 g008
Figure 9. TEM images for a TiO2 sample with 24% anatase and amplified by (a) 8000× and (b) 30,000×.
Crystals 09 00022 g009
Figure 10. Transmission electron microscopy (TEM) at 100,000× for TiO2 sample containing 24% A in two different zones (a,b) and (c) shows the particle size distribution for these two zone.
Crystals 09 00022 g010aCrystals 09 00022 g010b
Table 1. Phase content, optical bandgap, and particle size as a function of the annealing time.
Time (min)IA399/IR447WA/WR% Anatase% RutileΔEg (eV)2R (nm)
0--10002.9020.35
357.487.2288122.7815.02
453.353.0575252.8815.37
602.542.2469312.8614.26
902.412.1068322.9315.89
1032.382.0767332.7817.20
1152.141.8365352.7714.82
1201.531.2155452.8012.02
1251.381.0651492.8312.21
1300.810.4833672.8511.46
1350.670.3425752.8110.48
1800.640.3124762.9011.90
1950.560.2419812.8614.91
200--01002.567.43

