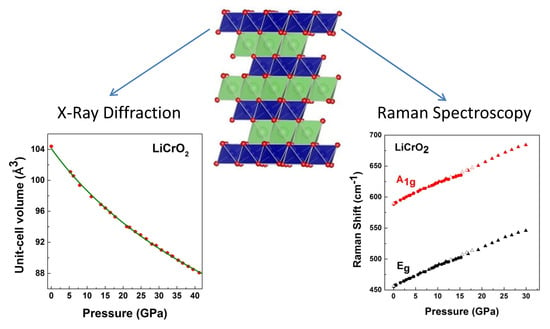
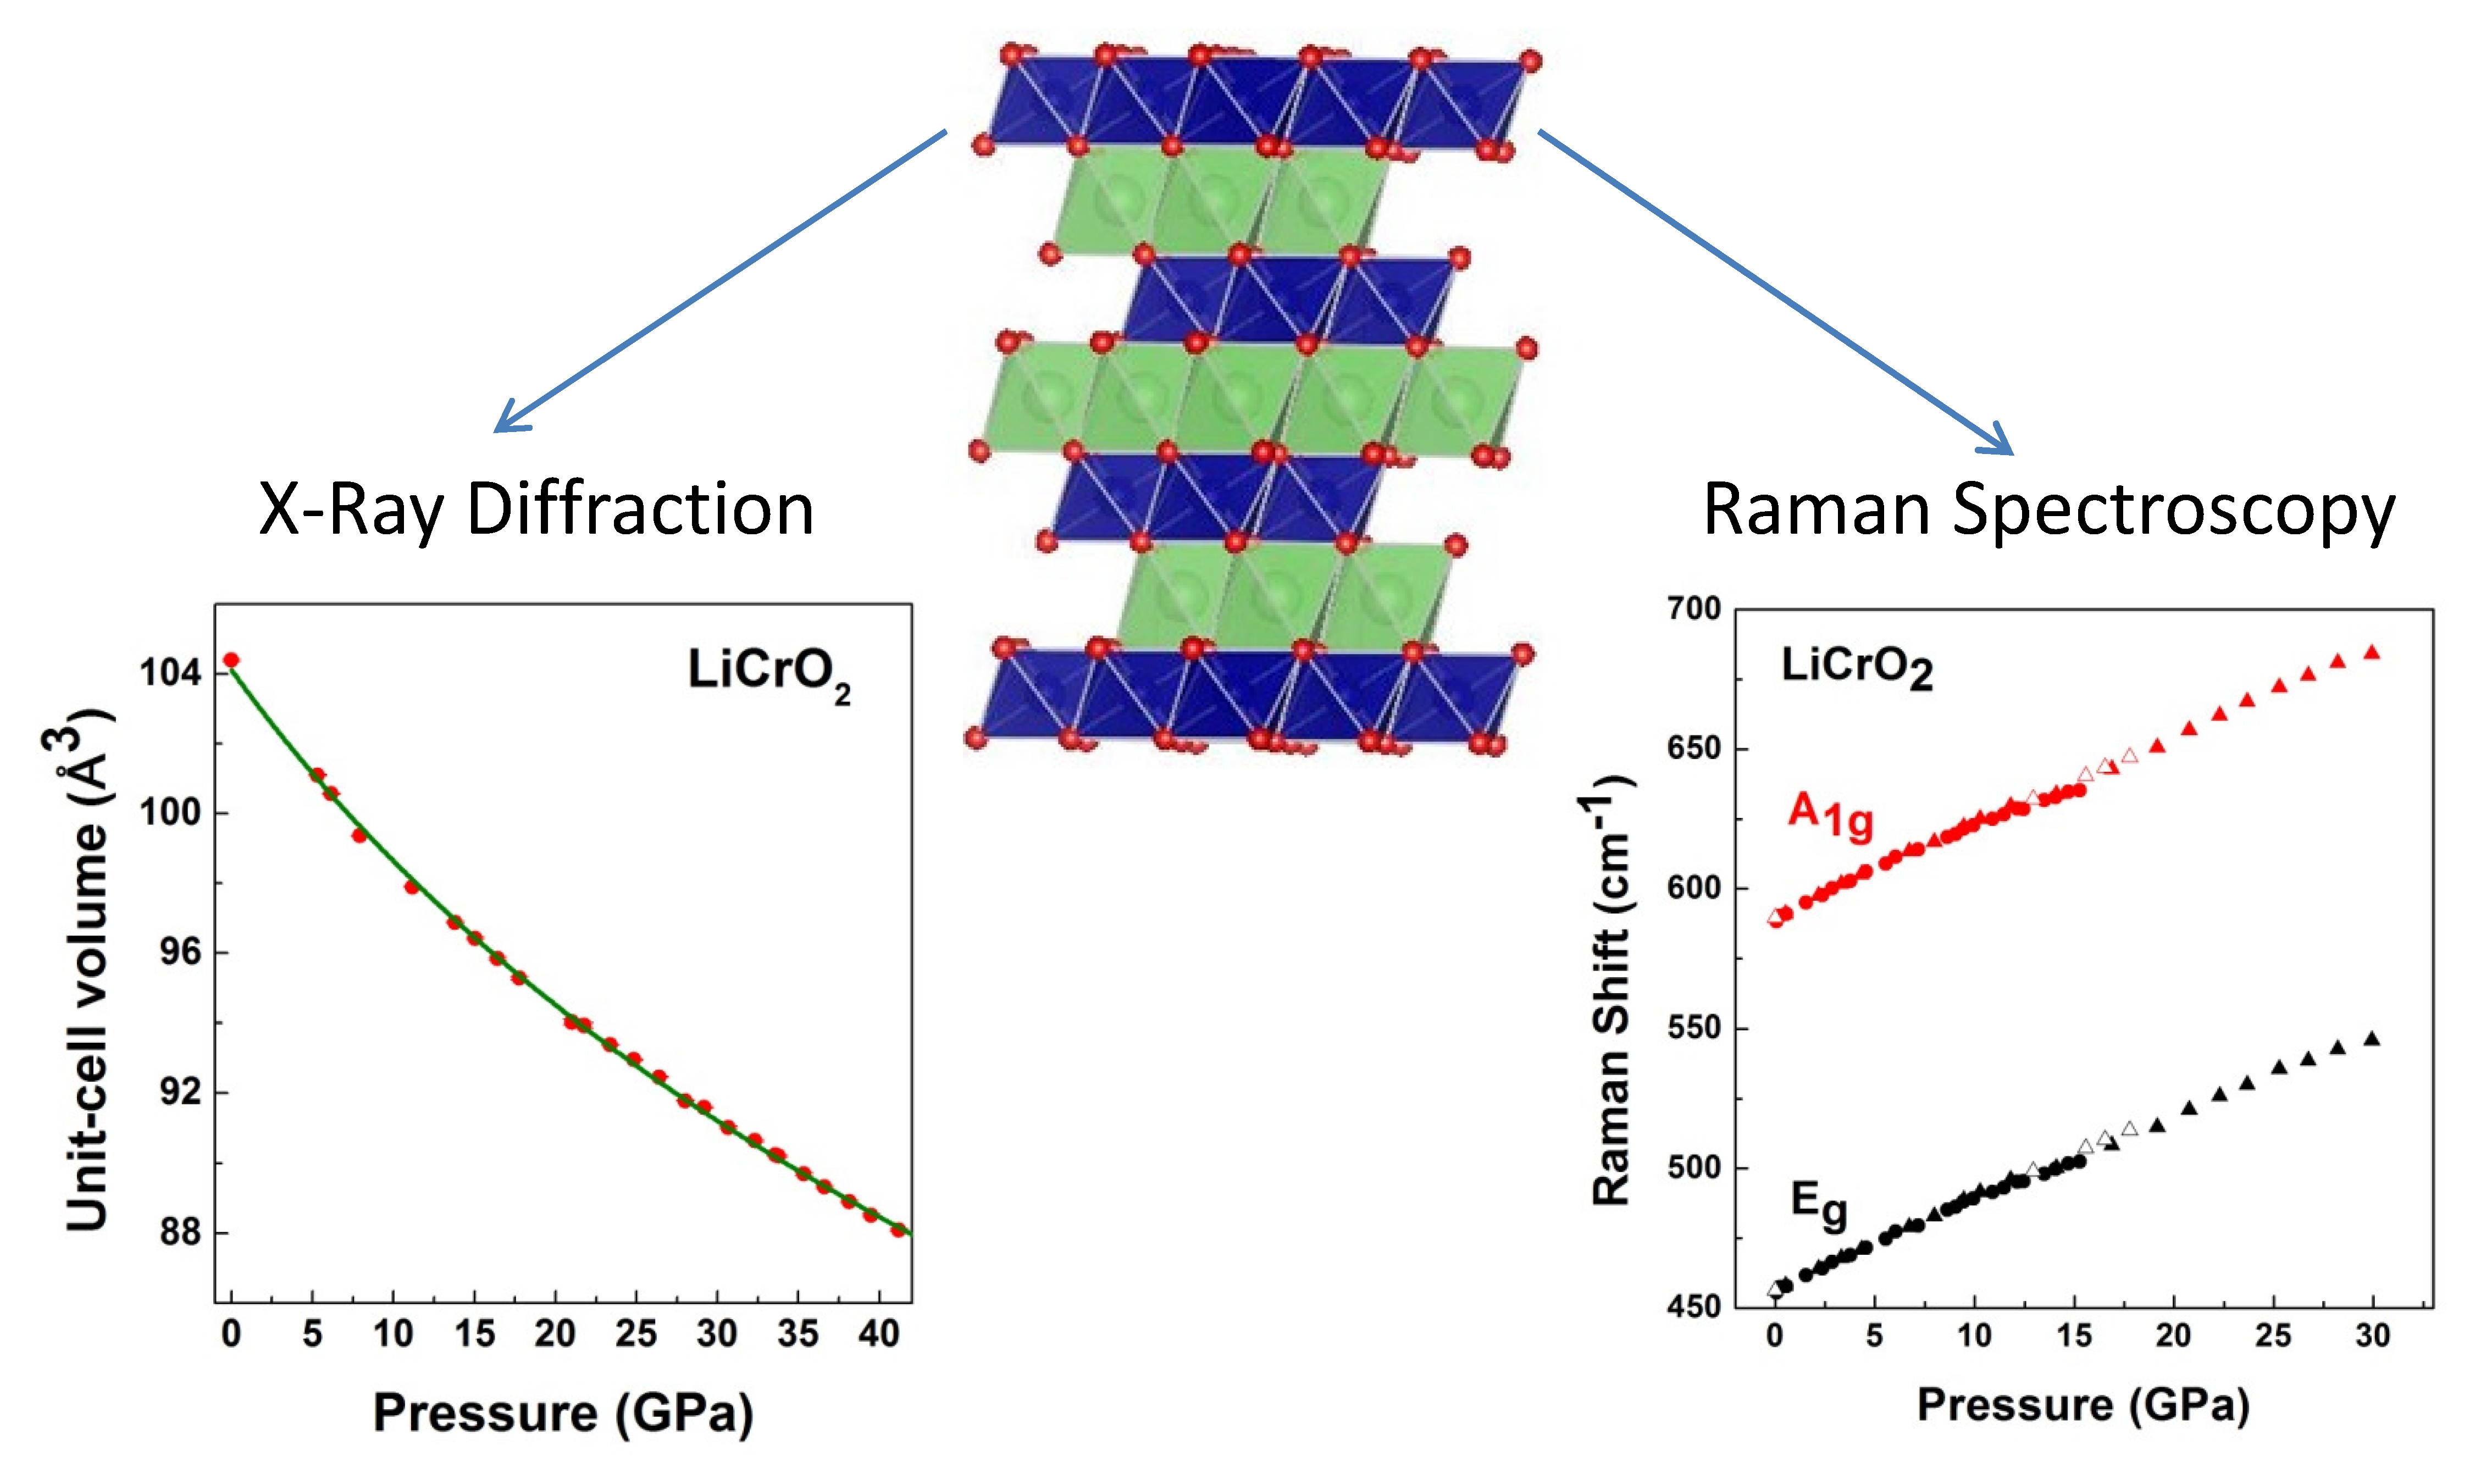
LiCrO2 Under Pressure: In-Situ Structural and Vibrational Studies

 , , ,
, , ,  and
and
Abstract
1. Introduction
2. Experimental Section
2.1. Sample Synthesis and Characterization
2.2. High Pressure Measurements
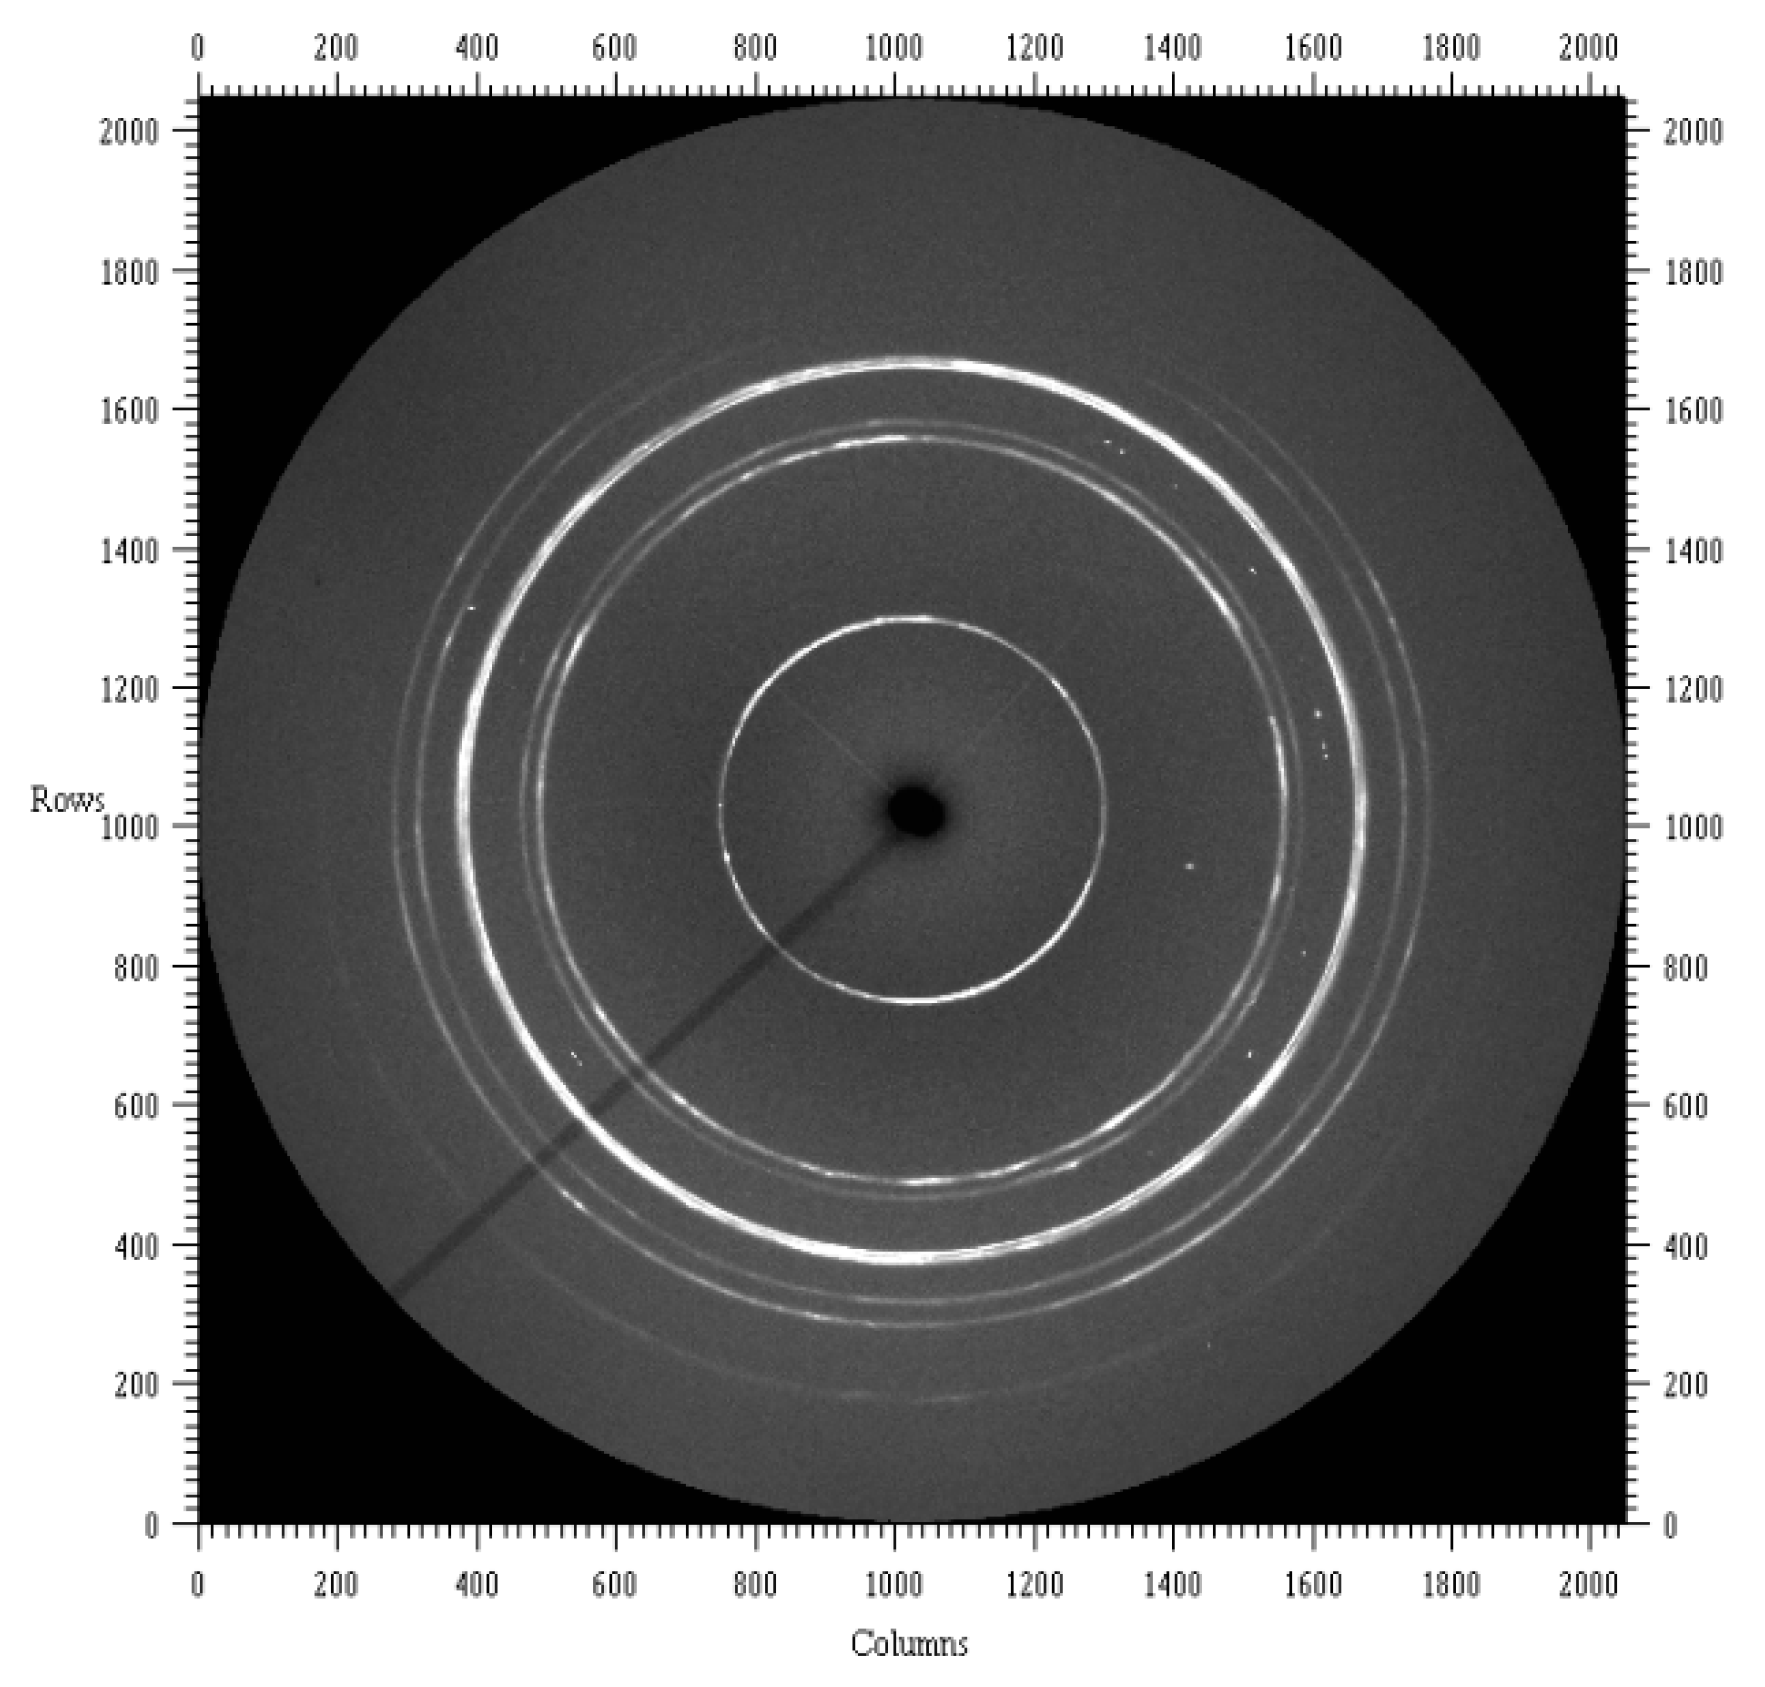
2.2.1. X-ray Diffraction
2.2.2. Raman Spectroscopy
2.2.3. Electrical Resistance
3. Results and Discussion
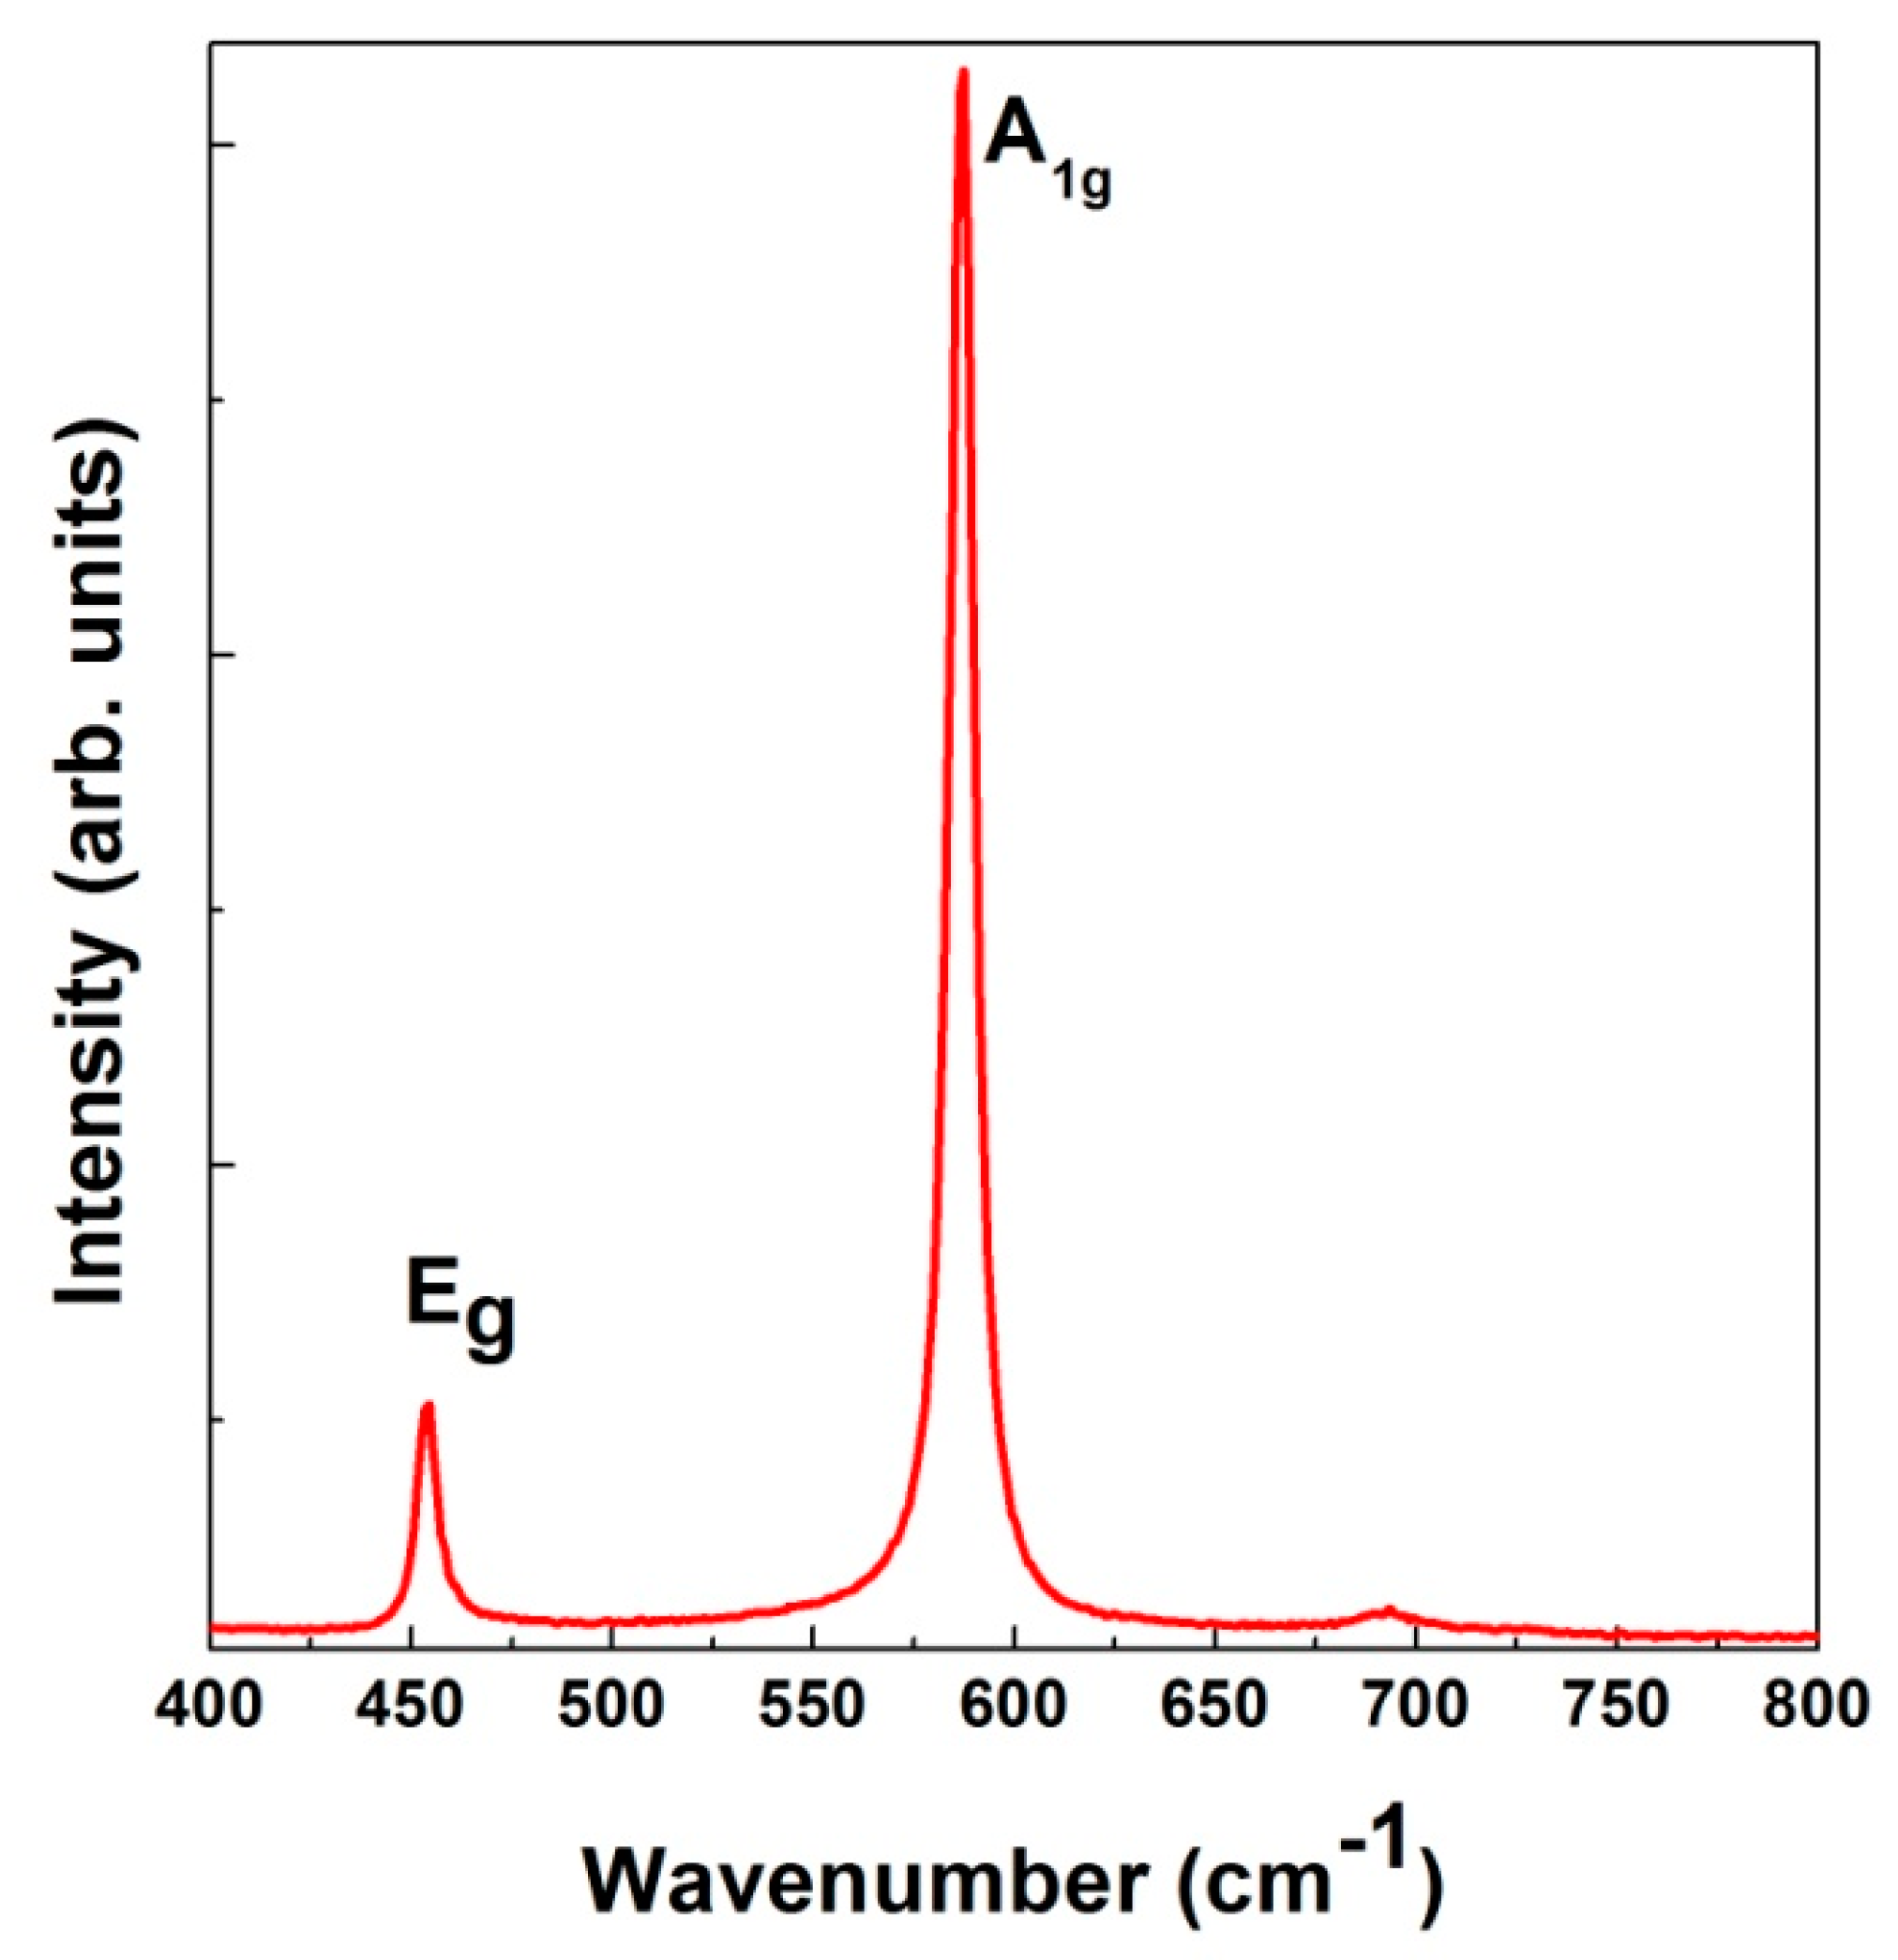
3.1. Ambient Pressure
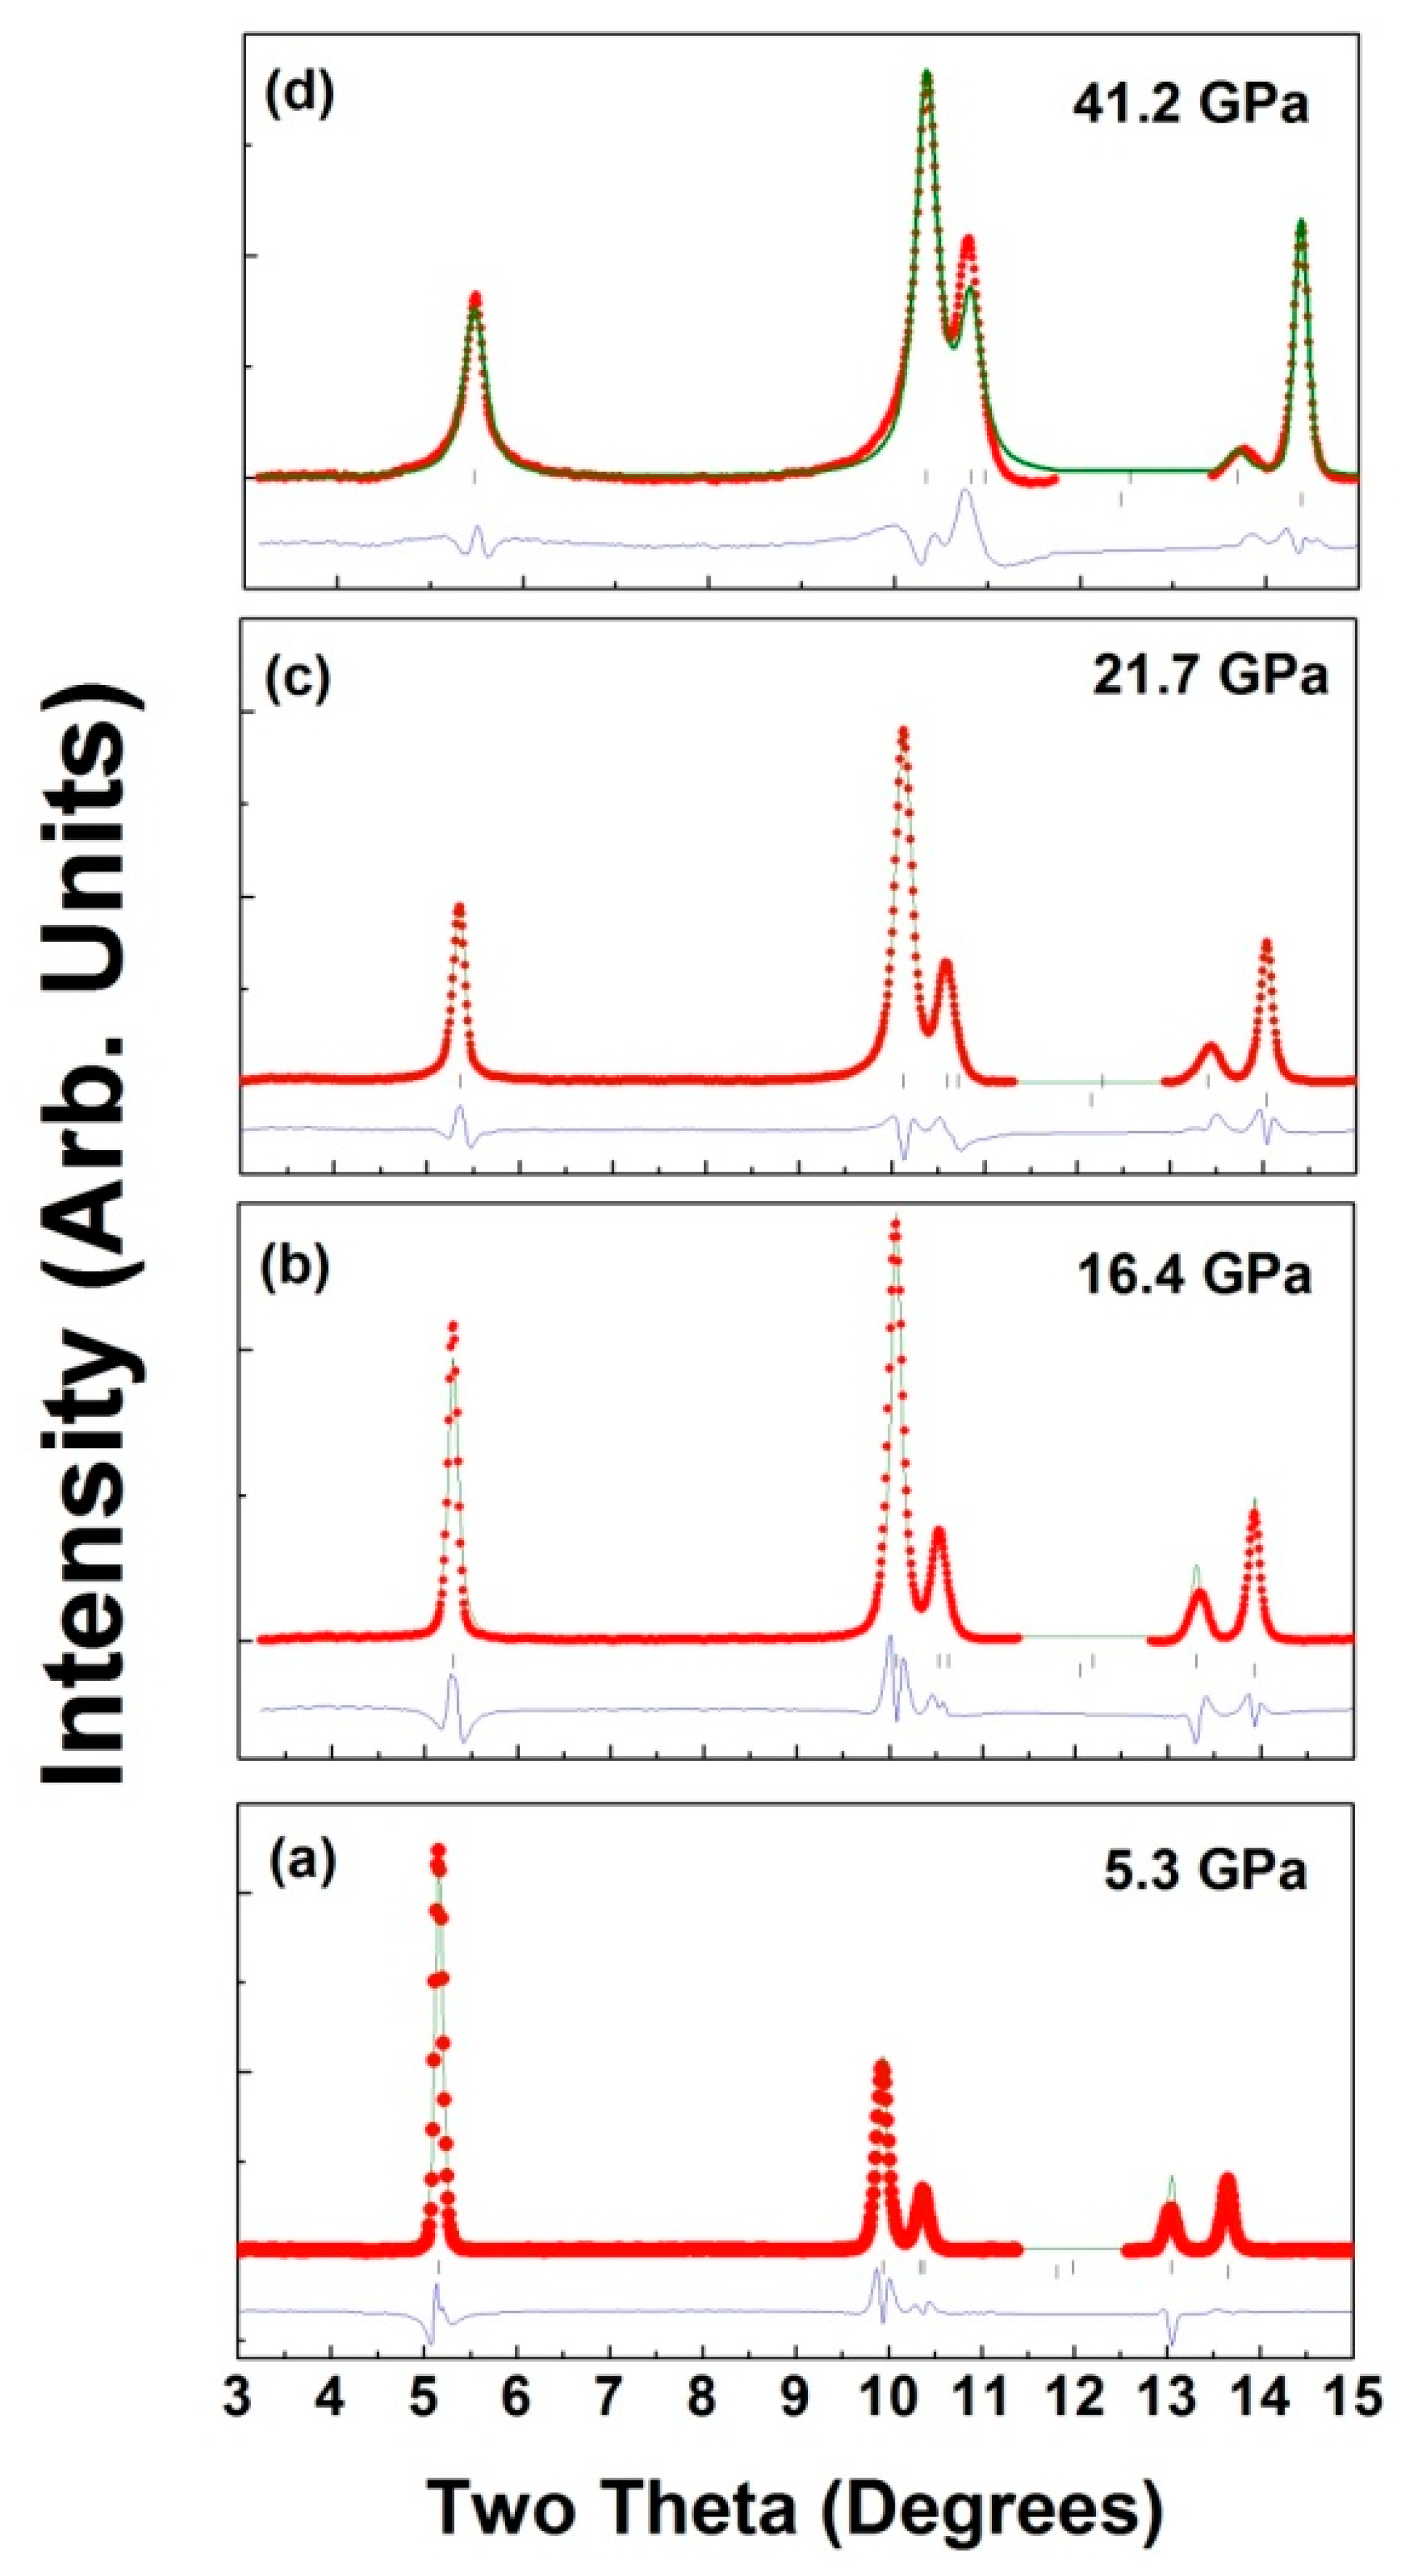
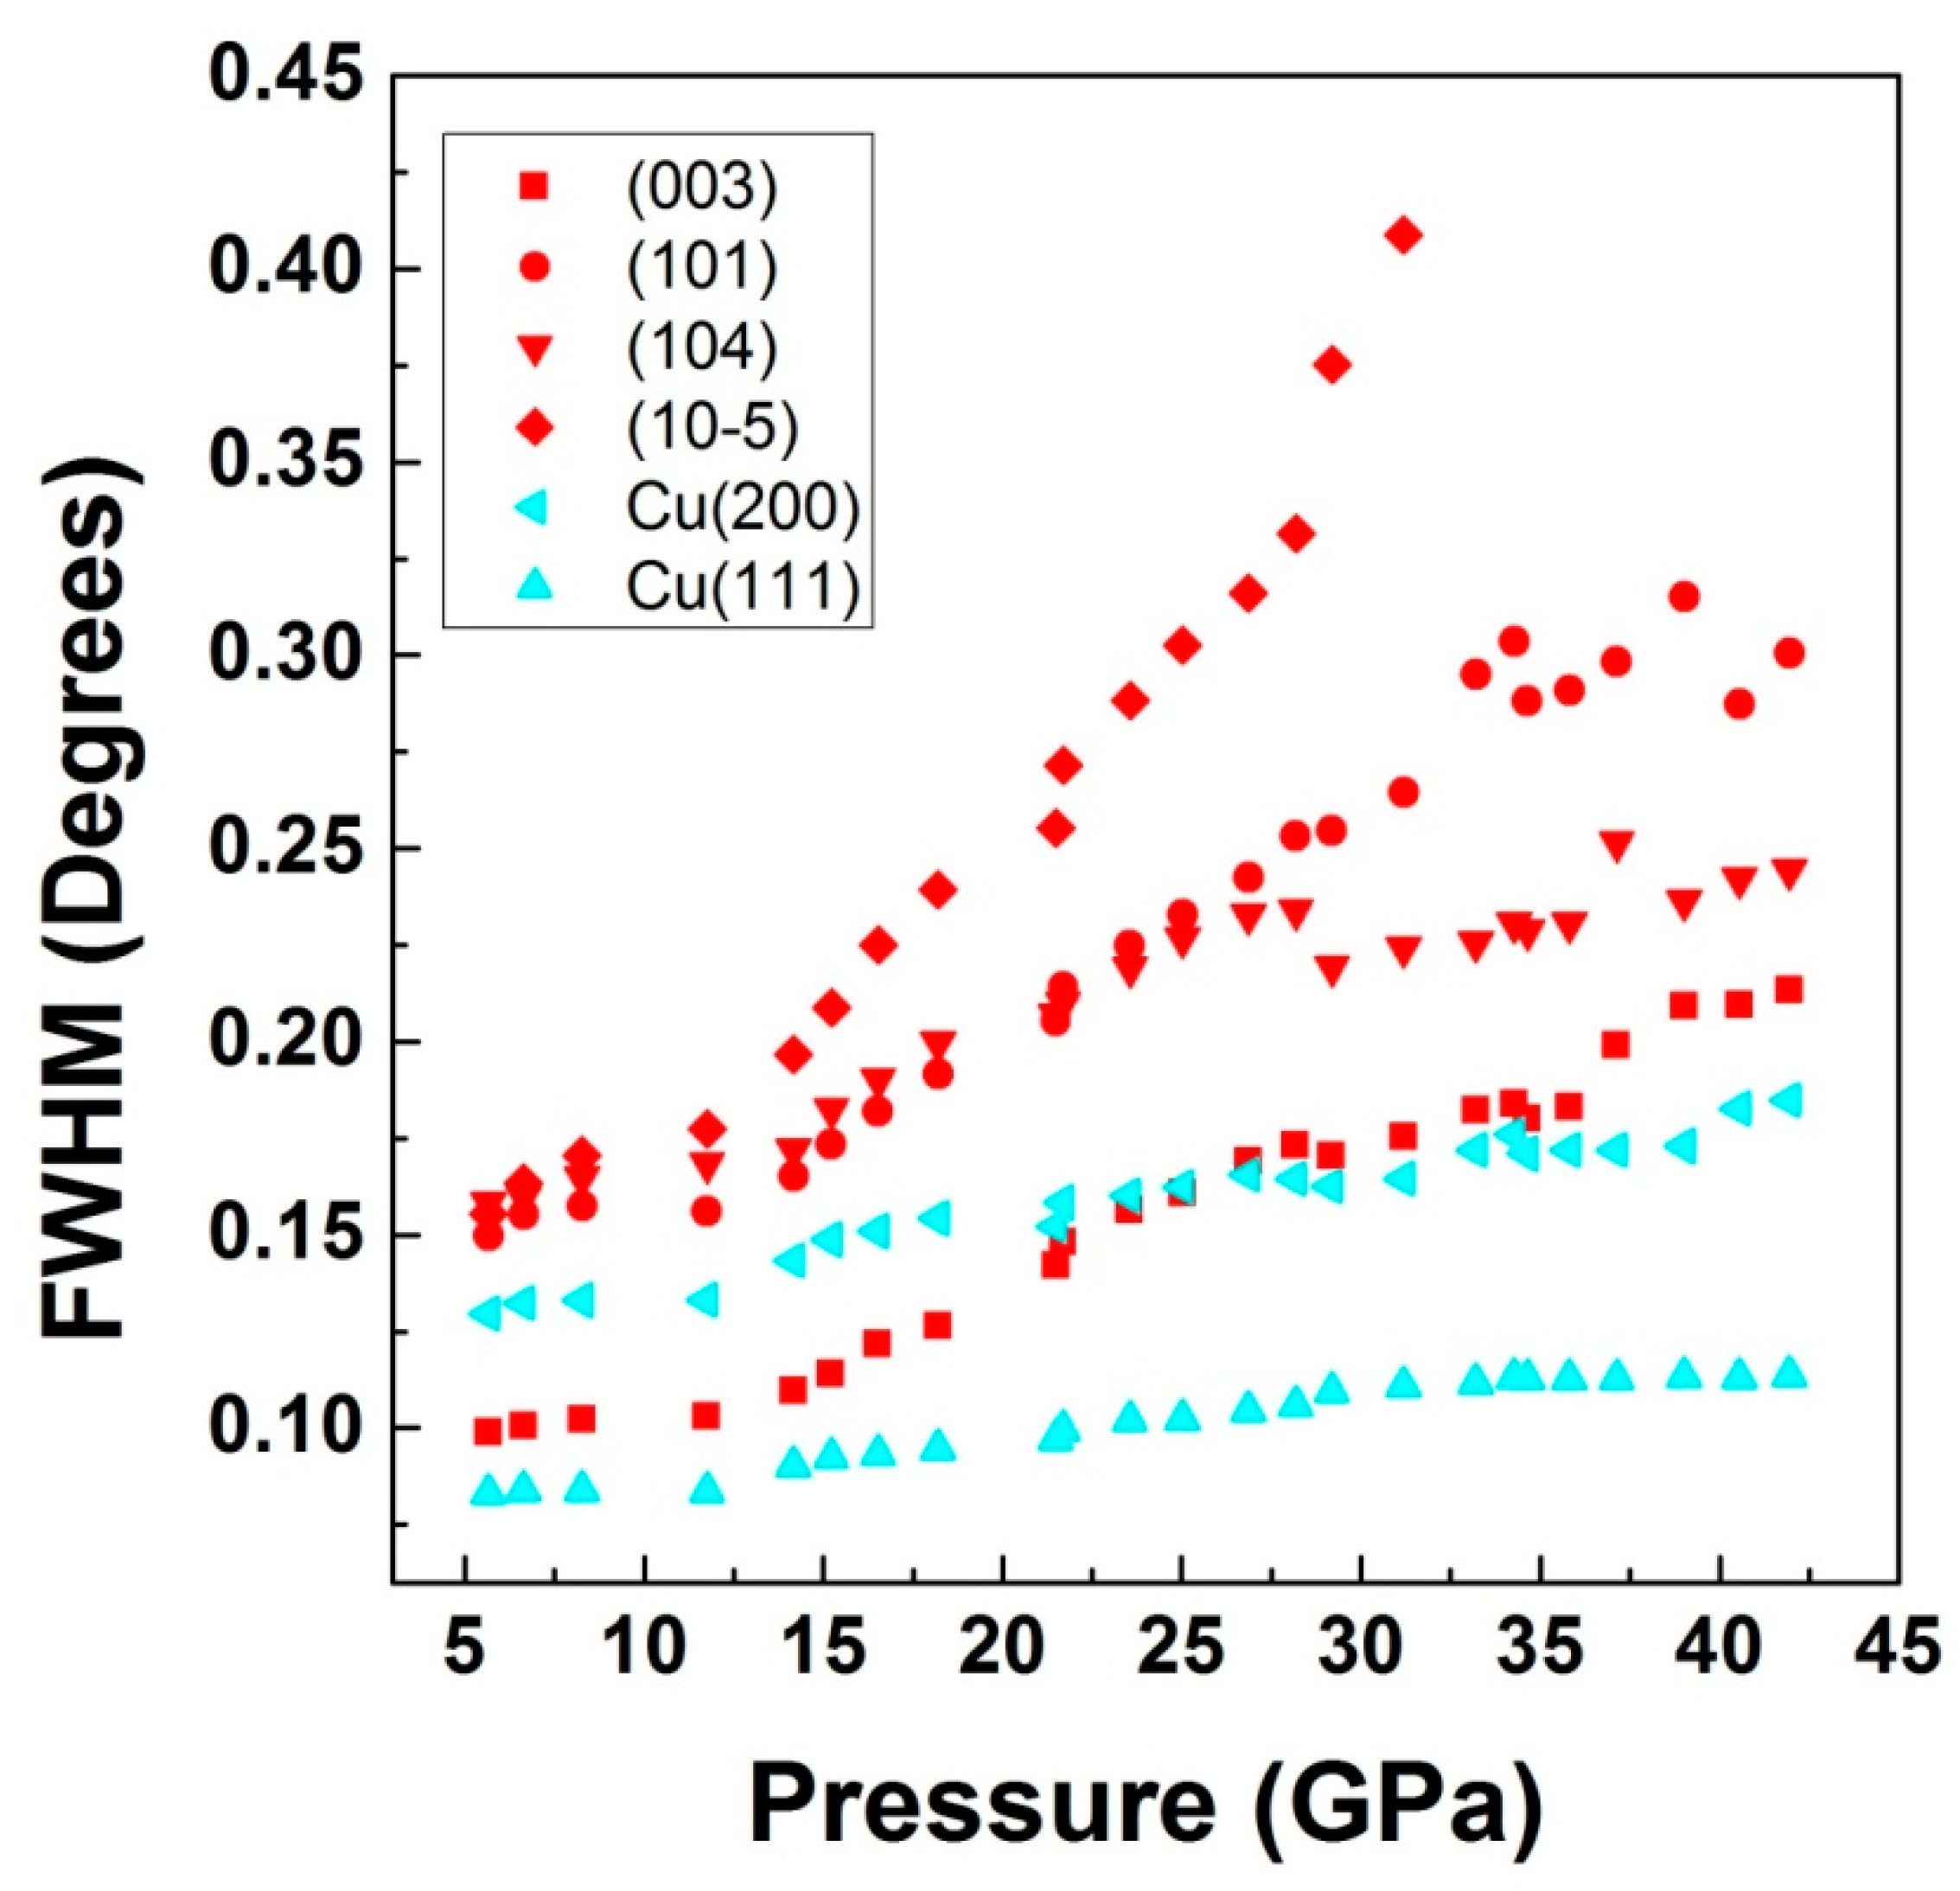
3.2. High-Pressure Studies
4. Summary
Author Contributions
Funding
Acknowledgments
Conflicts of Interest
References
- Mackenzie, A.P. The properties of ultrapure delafossite metals. Rep. Prog. Phys. 2017, 80, 032501. [Google Scholar] [CrossRef] [PubMed]
- Maignan, A.; Martin, C.; Singh, K.; Simon, C.; Lebedev, O.I.; Turner, S. From spin induced ferroelectricity to dipolar glasses: Spinel chromites and mixed delafossites. J. Solid State Chem. 2012, 195, 41–49. [Google Scholar] [CrossRef]
- Julien, C.; Mauger, A.; Zaghib, K.; Groult, H. Optimization of layered cathode materials for lithium-ion batteries. Materials 2016, 9, 595. [Google Scholar] [CrossRef]
- Julien, C. Local cationic environment in lithium nickel–cobalt oxides used as cathode materials for lithium batteries. Solid State Ionics 2000, 136–137, 887–896. [Google Scholar] [CrossRef]
- Seki, S.; Onose, Y.; Tokura, Y. Spin-driven ferroelectricity in triangular lattice antiferromagnets ACrO2 (A = Cu, Ag, Li, or Na). Phys. Rev. Lett. 2008, 101, 067204. [Google Scholar] [CrossRef] [PubMed]
- Sinnarasa, I.; Thimont, Y.; Presmanes, L.; Barnabé, A.; Tailhades, P. Thermoelectric and transport properties of delafossite CuCrO2: Mg thin films prepared by rfmagnetron sputtering. Nanomaterials 2017, 7, 157. [Google Scholar] [CrossRef] [PubMed]
- Walsh, A.; Da Silva, J.L.F.; Wei, S.-H. Multi-component transparent conducting oxides: Progress in materials modelling. J. Phys. Condens. Matter 2011, 23, 334210. [Google Scholar] [CrossRef]
- Yu, M.; Natu, G.; Ji, Z.; Wu, J.Y. P-type dye-sensitized solar cells based on delafossite CuGaO2 nanoplates with saturation photovoltages exceeding 460 mv. Phys. Chem. Lett. 2012, 3, 1074–1078. [Google Scholar] [CrossRef]
- Ling, B.; Zhao, J.L.; Sun, X.W.; Tan, S.T.; Kyaw, A.K.K.; Divayana, Y.; Dong, Z.L. Color tunable light-emitting diodes based on p+-Si/p-CuAlO2/n-ZnO nano rod array hetero junctions. Appl. Phys. Lett. 2010, 97. [Google Scholar] [CrossRef]
- Chae, G.S.A. Modified transparent conducting oxide for flat panel displays only. Jpn. J. Appl. Phys. Part 1 2001, 40, 3A. [Google Scholar] [CrossRef]
- Komaba, S.; Takei, C.; Nakayama, T.; Ogata, A.; Yabuuchi, N. Electrochemical intercalation activity of layered NaCrO2 vs. LiCrO2. Electrochem. Commun. 2010, 12, 355–358. [Google Scholar] [CrossRef]
- Chen, C.-Y.; Matsumoto, K.; Nohira, T.; Hagiwara, R.; Fukunag, A.; Sakai, S.; Nitta, K.; Inazawa, S. Electrochemical and structural investigation of NaCrO2 as a positive electrode for sodium secondary battery using inorganic ionic liquid NaFSA–KFSA. J. Power Sources 2013, 237, 52–57. [Google Scholar] [CrossRef]
- Hou, P.; Chu, G.; Gao, J.; Zhang, Y.; Zhang, L. Li-ion batteries: Phase transition. Chin. Phys. B 2016, 25, 016104. [Google Scholar] [CrossRef]
- Song, H.-K.; Lee, K.T.; Kim, M.G.; Nazar, L.F.; Cho, J. Recent progress in nanostructured cathode materials for lithium secondary batteries. Adv. Funct. Mater. 2010, 20, 3818–3834. [Google Scholar] [CrossRef]
- Kalluri, S.; Yoon, M.; Jo, M.; Park, S.; Myeong, S.; Kim, J.; Dou, S.X.; Guo, Z.; Cho, J. Li-ion cells: Surface engineering strategies of layered LiCoO2 cathode material to realize high-energy and high-voltage Li-ion cells. Adv. Energy Mater. 2017, 7, 1601507–1601521. [Google Scholar] [CrossRef]
- Cao, Q.; Zhang, H.P.; Wang, G.J.; Xia, Q.; Wu, Y.P.; Wu, H.Q. A novel carbon-coated LiCoO2, as cathode material for lithium ion battery. Electrochem. Commun. 2007, 9, 1228–1232. [Google Scholar] [CrossRef]
- Mizushima, K.; Jones, P.C.; Wiseman, P.J.; Goodenough, J.B. LixCoO2 (0 < x < −1): A new cathode materialforbatteries of high energy density. Mater. Res. Bull. 1980, 15, 783–789. [Google Scholar]
- Lyu, Y.; Ben, L.; Sun, Y.; Tang, D.; Xu, K.; Gu, L.; Xiao, R.; Li, H.; Chen, L.; Huang, X. Atomic insight into electrochemical inactivity of lithium chromate (LiCrO2): Irreversible migration of chromium into lithium layers in surface regions. J. Power Sources 2015, 273, 1218–1225. [Google Scholar] [CrossRef]
- Pan, C.; Lee, Y.J.; Ammundsen, B.; Grey, C.P. 6Li MAS NMR studies of the local structure and electrochemical properties of Cr-doped lithium manganese and lithium cobalt oxide cathode materials for lithium-ion batteries. Chem. Mater. 2002, 14, 2289–2299. [Google Scholar] [CrossRef]
- Tang, W.; Liu, L.L.; Tian, S.; Li, L.; Yue, Y.B.; Wu, Y.P.; Guan, S.Y.; Zhu, K. Nano-LiCoO2 as cathode material of large capacity and high rate capability for aqueous rechargeable lithium batteries. Electrochem. Commun. 2010, 12, 1524–1526. [Google Scholar] [CrossRef]
- Lyu, Y.; Liu, Y.; Gu, L. Surface structure evolution of cathode materials for Li-ion batteries. Chin. Phys. B 2016, 25, 018209. [Google Scholar] [CrossRef]
- Olariu, A.; Mendels, P.; Bert, F.; Ueland, B.G.; Schiffer, P.; Berger, R.F.; Cava, R.J. Unconventional dynamics in triangular Heisenberg antiferromagnet NaCrO. Phys. Rev. Lett. 2006, 97, 167203. [Google Scholar] [CrossRef] [PubMed]
- Kemp, J.P.; Cox, P.A.; Hodby, J.W. Magnetic susceptibility studies of LiNiO2 and NaNiO2. J. Phys. Condens. Matter 1990, 2, 31. [Google Scholar] [CrossRef]
- de Brion, S.; Bonda, M.; Darie, C.; Bordet, P.; Sheikin, I. Magnetic phase diagram of the S = 1/2 triangular layered compound NaNiO2: A single crystal study. J. Phys. Condens. Matter 2010, 22, 126001. [Google Scholar] [CrossRef] [PubMed]
- Soubeyroux, J.L.; Fruchart, D.; Delmas, C.; Le Flem, G. Neutron powder diffraction studies of two-dimensional magnetic oxides. J. Magn. Magn. Mater. 1979, 14, 159–162. [Google Scholar] [CrossRef]
- Bandiello, E.; Errandonea, D.; Pellicer-Porres, J.; Garg, A.B.; Rodriguez-Hernandez, P.; Muñoz, A.; Martinez-Garcia, D.; Rao, R.; Popescu, C. Effect of High Pressure on the Crystal Structure and Vibrational Properties of Olivine-Type LiNiPO4. Inorg. Chem. 2018, 57, 10265–10276. [Google Scholar] [CrossRef] [PubMed]
- Garg, A.B.; Mishra, A.K.; Pandey, K.K.; Sharma, S.M. Multiferroic CuCrO2 under high pressure: In situ X-ray diffraction and Raman spectroscopic studies. J. Appl. Phys. 2014, 116, 133514. [Google Scholar] [CrossRef]
- Salke, N.P.; Garg, A.B.; Rao, R.; Achary, S.N.; Gupta, M.K.; Mittal, R.; Tyagi, A.K. Phase transitions in delafossite CuLaO2 at high pressures. J. Appl. Phys. 2014, 115, 133507. [Google Scholar] [CrossRef]
- Pellicer-Porres, J.; Segura, A.; Martinez, E.; Saitta, A.M.; Polian, A.; Chervin, J.C.; Canny, B. Vibrational properties of delafossite CuGaO2 at ambient and high pressures. Phys. Rev. B 2005, 72, 064301. [Google Scholar] [CrossRef]
- Pellicer-Porres, J.; Segura, A.; Ferrer-Roca, C.; Polian, A.; Munsch, P.; Kim, D. XRD and XAS structural study of CuAlO2 under high pressure. J. Phys. Condens. Mater. 2013, 25, 115406. [Google Scholar] [CrossRef]
- Garg, A.B.; Rao, R. Copper Delafossites under High Pressure—A Brief Review of XRD and Raman Spectroscopic Studies. Crystals 2018, 8, 255. [Google Scholar] [CrossRef]
- Wolverton, C.; Zunger, A. Prediction of Li intercalation and battery voltages in layered vs. cubic LixCoO2. J. Electrochem. Soc. 1998, 145, 2424–2431. [Google Scholar] [CrossRef]
- Wang, X.; Loa, I.; Kunc, K.; Syassen, K.; Amboage, M. Effect of pressure on the structural properties and Raman modes of LiCoO2. Phys. Rev. B 2005, 72, 224102. [Google Scholar] [CrossRef]
- Huang, Y.; He, Y.; Sheng, H.; Lu, X.; Dong, H.; Samanta, S.; Dong, H.; Li, X.; Kim, D.Y.; Mao, H.-K.; et al. Li-ion battery material under high pressure: Amorphization and enhanced conductivity of Li4Ti5O12. Natl. Sci. Rev. 2018. [Google Scholar] [CrossRef]
- Dewaele, A.; Loubeyre, P.; Mezouar, M. Equations of state of six metals above 94 GPa. Phys. Rev. B 2004, 70, 094112. [Google Scholar] [CrossRef]
- Garg, A.B.; Errandonea, D.; Rodríguez-Hernández, P.; López-Moreno, S.; Muñoz, A.; Popescu, C. High-pressure structural behaviour of HoVO4: Combined XRD experiments and ab-initio calculations. J. Phys. Condens. Matter 2014, 26, 265402. [Google Scholar] [CrossRef] [PubMed]
- Garg, A.B.; Errandonea, D.; Rodríguez-Hernández, P.; Muñoz, A. ScVO4 under non-hydrostatic compression: A new metastable polymorph. J. Phys. Condens. Matter 2017, 29, 055401. [Google Scholar] [CrossRef] [PubMed]
- Hammersley, A.P.; Svensson, S.O.; Hanfland, M.; Fitch, A.N.; Häusermann, D. Two-dimensional detector software: From real detector to idealised image or two-theta scan. High Pressure Res. 1996, 14, 235–248. [Google Scholar] [CrossRef]
- Larson, A.C.; von Dreele, R.B. General Structure Analysis System; LANL Report; Los Alamos National Laboratory: Los Alamos, NM, USA, 2004; pp. 86–748. [Google Scholar]
- Syassen, K. Ruby under pressure. High Press. Res. 2008, 28, 75–126. [Google Scholar] [CrossRef]
- Garg, A.B.; Verma, A.K.; Vijayakumar, V.; Rao, R.S.; Godwal, B.K. High-pressure experimental and theoretical investigations on the fluorite structured compound AuAl2. Phys. Rev. B 2005, 72, 024112. [Google Scholar] [CrossRef]
- Errandonea, D.; Segura, A.; Martínez-García, D.; Muñoz-San Jose, V. Hall-effect and resistivity measurements in CdTe and ZnTe at high pressure: Electronic structure of impurities in the zinc-blende phase and the semimetallic or metallic character of the high-pressure phases. Phys. Rev. B 2009, 79, 125203. [Google Scholar] [CrossRef]
- Chen, H.; Freeman, C.L.; Harding, J.H. Charge disproportionation and Jahn-Teller distortion in LiNiO2 and NaNiO2: A density functional theory study. Phys. Rev. B 2011, 84, 085108. [Google Scholar] [CrossRef]
- Soubeyroux, J.L.; Fruchart, D.; Marmeggi, J.C.; Fitzgerald, W.J.; Delmas, C.; Le Flem, G. Structure magnetique de LiCrO2. Phys. Status Solidi A 1981, 67, 633–642. [Google Scholar] [CrossRef]
- Inaba, M.; Iriyama, Y.; Ogumi, Z.; Todzuka, Y.; Tasaka, A. Raman study of layered rock-salt LiCoO2 and its electrochemical lithium deintercalation. J. Raman Spectrosc. 1997, 28, 613–617. [Google Scholar] [CrossRef]
- Suzuki, M.; Yamada, I.; Kadowaki, H.; Takei, F. A Raman scattering investigation of the magnetic ordering in the two-dimensional triangular lattice antiferromagnet LiCrO2. J. Phys. Condens. Matter 1993, 5, 4225. [Google Scholar] [CrossRef]
- Yang, H.X.; Xia, Y.; Shi, Y.G.; Tian, H.F.; Xiao, R.J.; Liu, X.; Liu, Y.L.; Li, J.Q. Raman spectroscopy study of α-,β-,γ-NaxCoO2 and γ-(Ca,Sr)xCoO2. Phys. Rev. B 2006, 74, 094301. [Google Scholar] [CrossRef]
- Kalyani, P.; Kalaiselvi, N. Various aspects of LiNiO2 chemistry: A review. Sci. Technol. Adv. Mater. 2005, 6, 689–703. [Google Scholar] [CrossRef]
- Pellicer-Porres, J.; Segura, A.; Ferrer-Roca, C.; Martínez-García, D.; Sans, J.A.; Martínez, E.; Itié, J.P.; Polian, A.; Baudelet, F.; Muñoz, A.; et al. Structural evolution of the CuGaO2 delafossite under high pressure. Phys. Rev. B 2004, 69, 024109. [Google Scholar] [CrossRef]
- Gomis, O.; Lavina, B.; Rodriguez-Hernandez, P.; Muñoz, A.; Errandonea, R.; Errandonea, D.; Bettinelli, M. High-pressure structural, elastic, and thermodynamic properties of zircon-type HoPO4 and TmPO4. J. Phys.: Condens. Matter 2017, 29, 095401. [Google Scholar]
- Lazicki, A.; Yoo, C.-S.; Evans, W.J.; Pickett, W.E. Pressure-induced antifluorite-to-anticotunnite phase transition in lithium oxide. Phys. Rev. B 2006, 73, 184120. [Google Scholar] [CrossRef]
- Dymshits, A.M.; Dorogokupets, P.I.; Sharygin, I.S.; Litasov, K.D.; Shatskiy, A.; Rashchenko, S.V.; Ohtani, E.; Suzuki, A.; Higo, Y. Thermoelastic properties of chromium oxide Cr2O3 (eskolaite) at high pressures and temperature. Phys. Chem. Miner. 2016, 43, 447–458. [Google Scholar] [CrossRef]
- Birch, F. Elasticity and constitution of the Earth’s interior. J. Geophys. Res. 1952, 57, 227–286. [Google Scholar] [CrossRef]
- Errandonea, D.; Meng, Y.; Somayazulu, M.; Hausermann, D. Pressure induced alpha-omega transition in titanium metal: A systematic study of the effects of uniaxial stress. Physica B 2005, 355, 116. [Google Scholar] [CrossRef]
- Heinz, D.L.; Jeanloz, R. The equation of state of the gold calibration standard. J. Appl. Phys. 1984, 55, 885. [Google Scholar] [CrossRef]
- Angel, R.J.; Bujak, M.; Zhao, J.; Gatta, G.D.; Jacobsen, S.D. Effective hydrostatic limits of pressure media for high-pressure crystallographic studies. J. Appl. Cryst. 2007, 40, 26–32. [Google Scholar] [CrossRef]
- Errandonea, D.; Muñoz, A.; Gonzalez-Platas, J. Comment on “High-pressure X-ray diffraction study of YBO3/Eu3+, GdBO3, and EuBO3: Pressure-induced amorphization in GdBO3”. J. Appl. Phys. 2014, 115, 216101. [Google Scholar] [CrossRef]


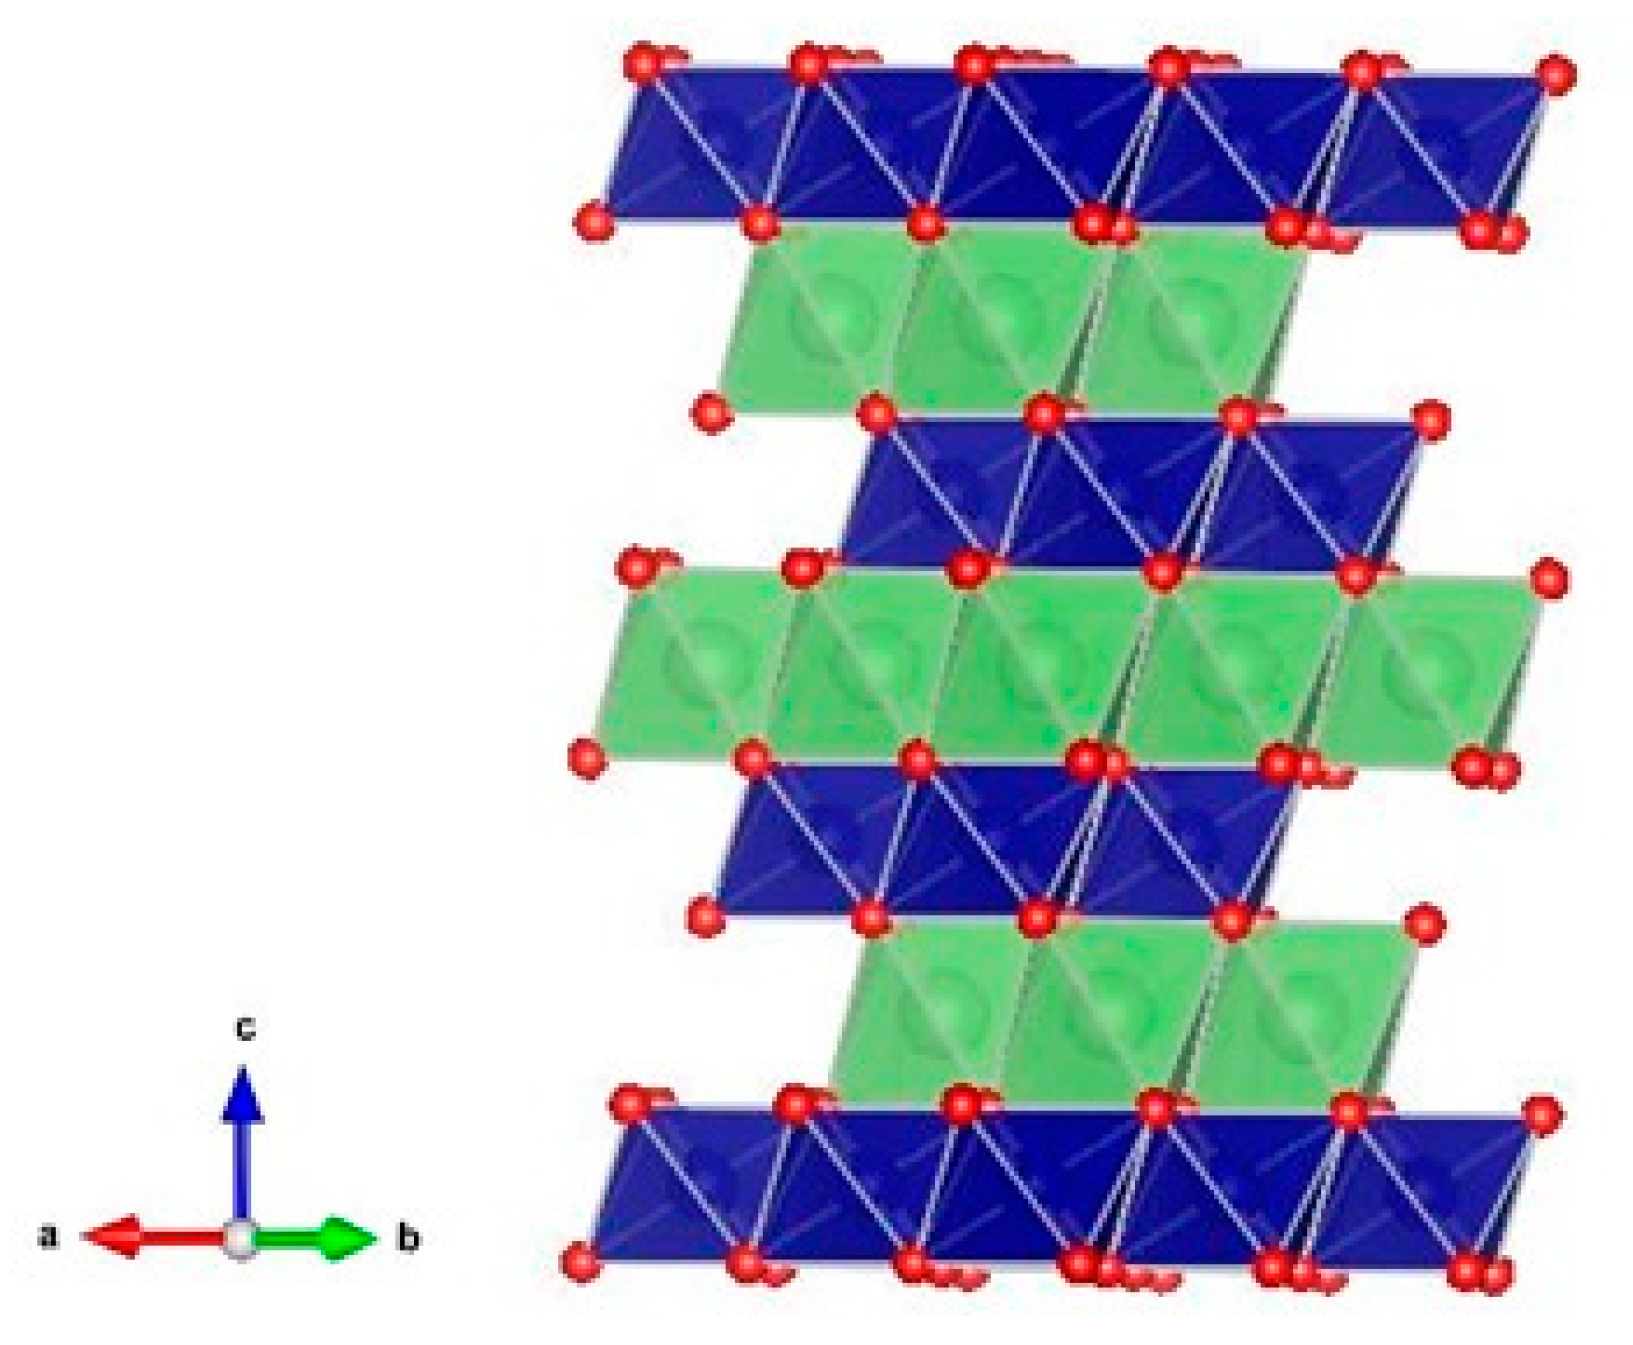
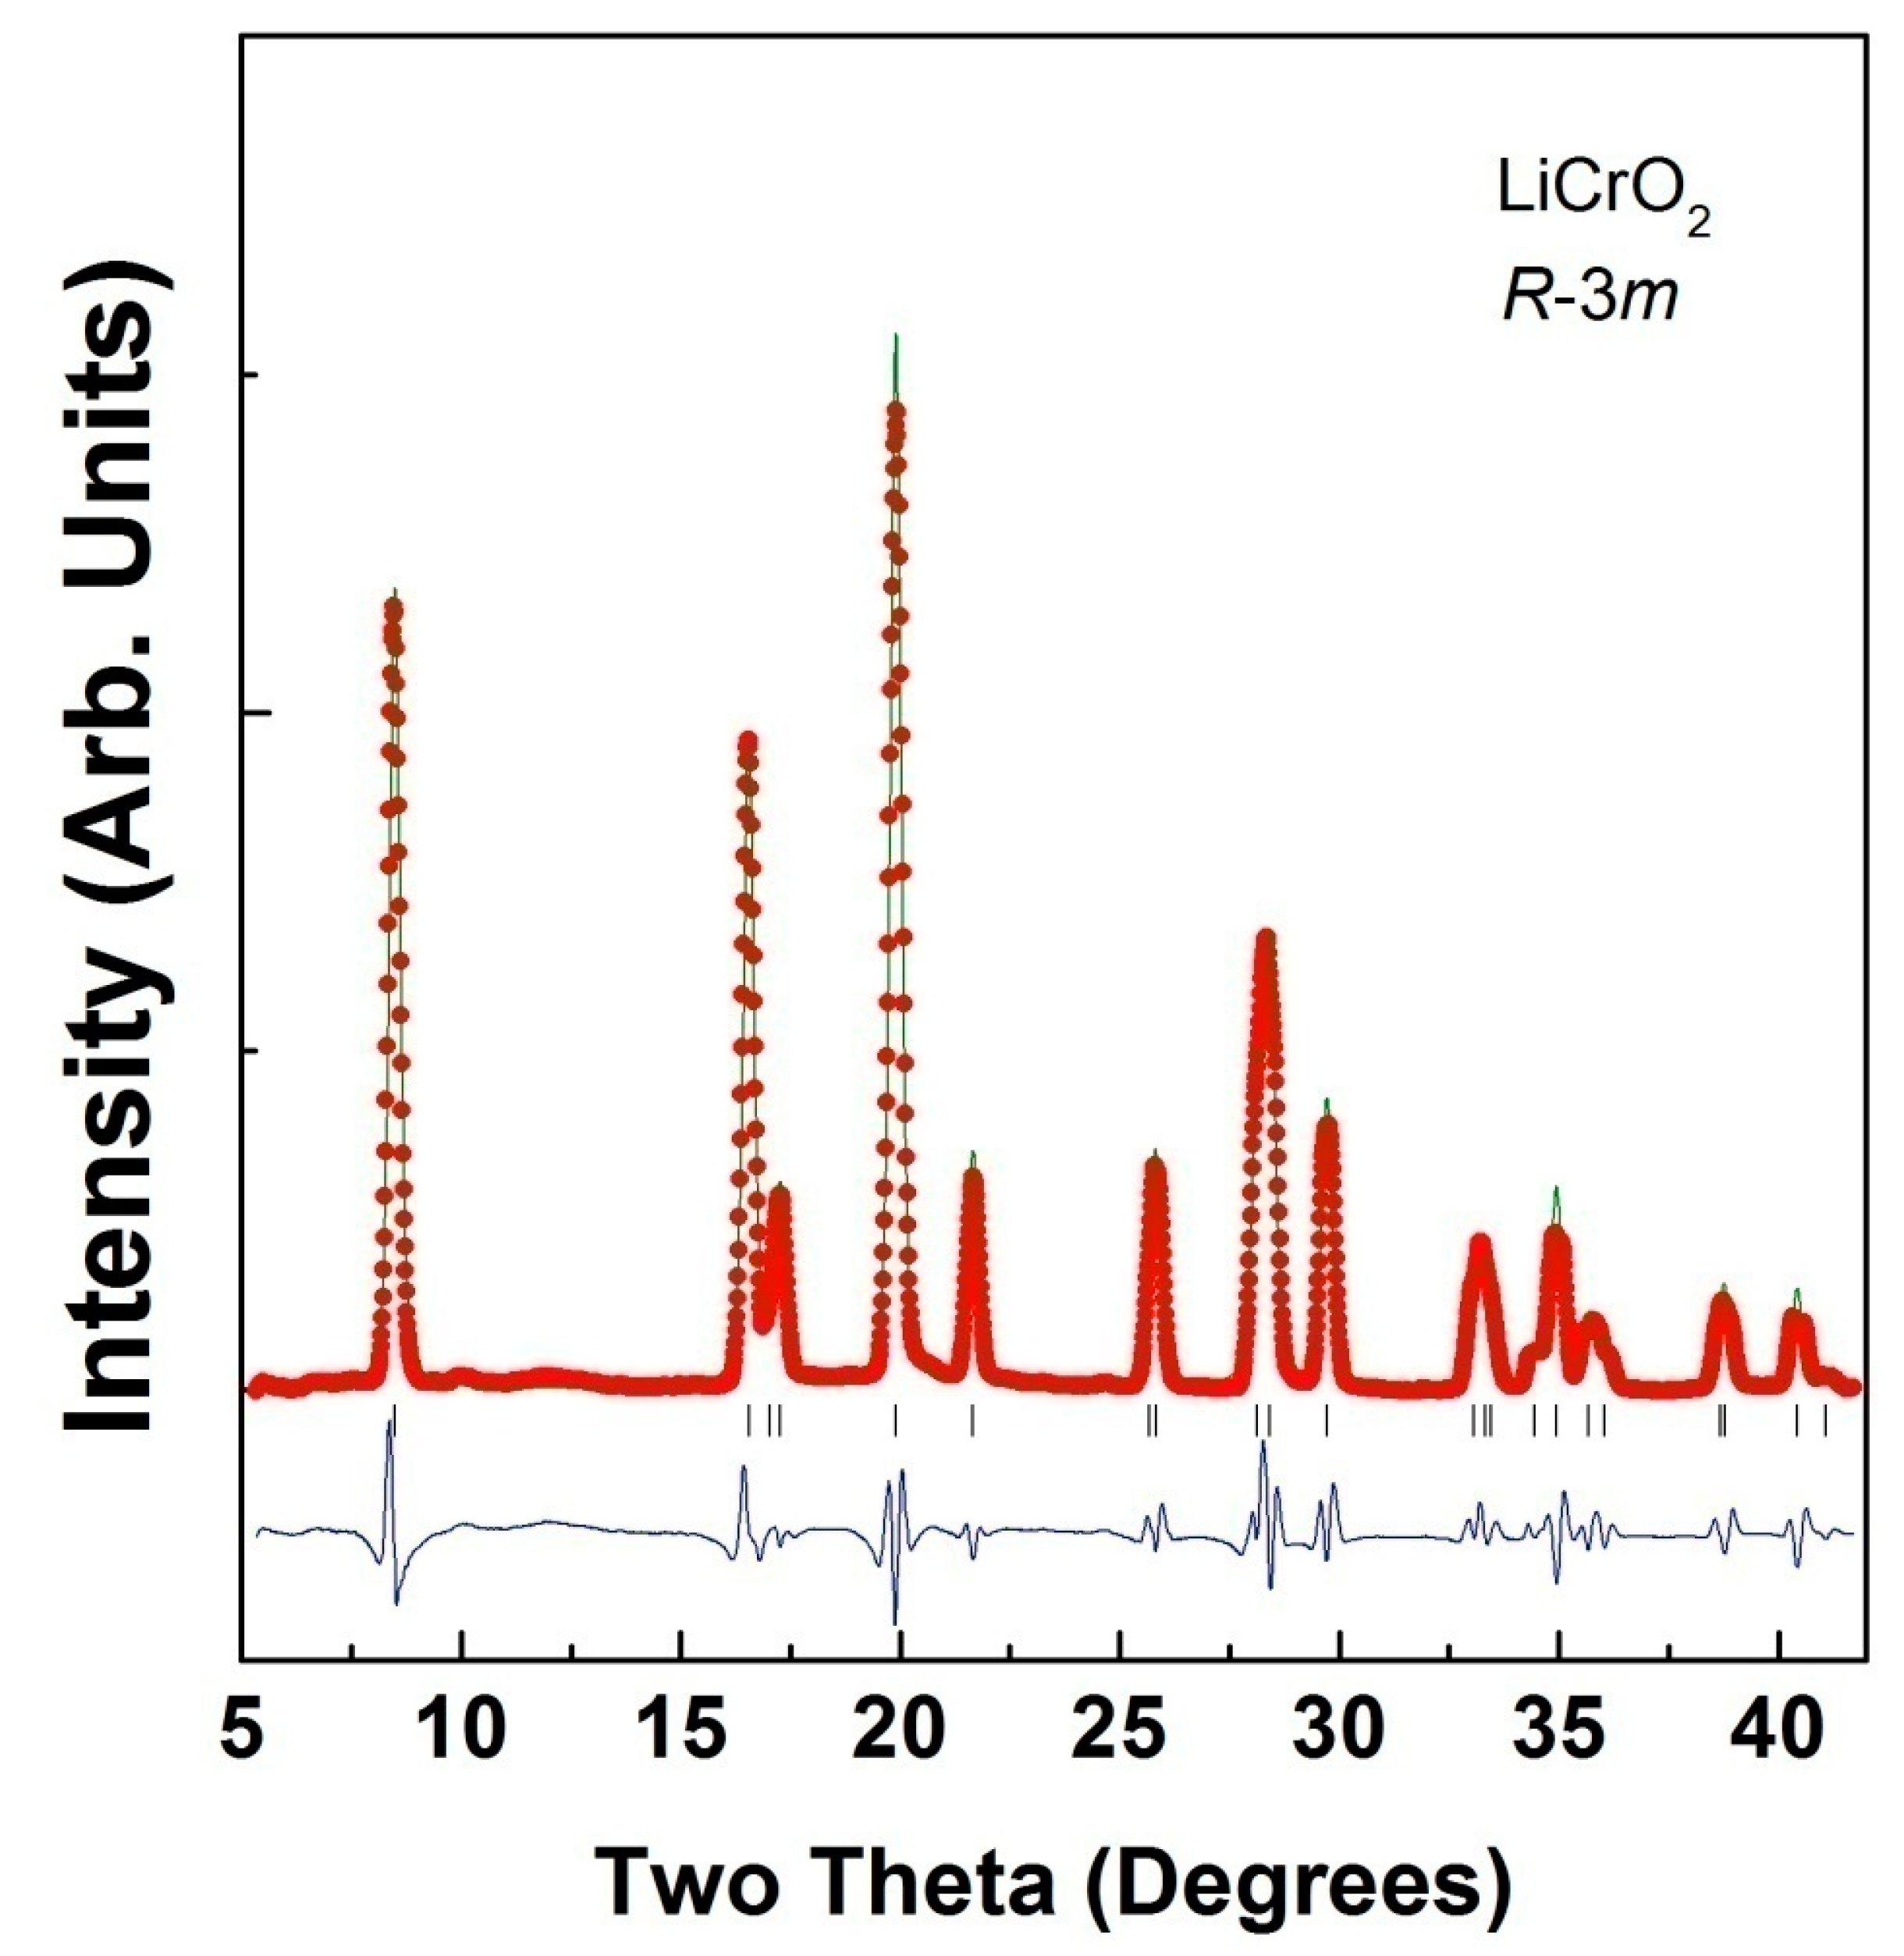
| Ambient Pressure; a = 2.8941 (3)Å; c = 14.391 (3) Å, Rp = 4.5% and wRp = 6.2%. | ||||
| Atom | Site | x | Y | Z |
| Li | 3b | 0 | 0 | 0.5 |
| Cr | 3a | 0 | 0 | 0 |
| O | 6c | 0 | 0 | 0.7433(4) |
| Bond length (Å) | Li-O | Cr-O | Cr-Cr/Li-Li | Li-Cr |
| 2.1134 | 2.0032 | 2.9231 | 2.8941 | |
| 5.3 GPa; a = 2.8736 (3)Å; c = 14.1367 (2) Å, Rp = 2.65% and wRp = 4.92% | ||||
| O | 6c | 0 | 0 | 0.7496 (4) |
| Bond length (Å) | Li-O | Cr-O | Cr-Cr/Li-Li | Li-Cr |
| 2.0353 | 2.0288 | 2.8736 | 2.8816 | |
| 16.4 GPa: a = 2.8367 (7) Å; c = 13.753 (5) Å, Rp = 3.85% and wRP = 5.82% | ||||
| O | 6c | 0 | 0 | 0.7662 |
| Bond length (Å) | Li-O | Cr-O | Cr-Cr/Li-Li | Li-Cr |
| 1.8779 | 2.1316 | 2.8367 | 2.8172 | |
| 21.8 GPa: a = 2.8199 (8) Å; 13.640 (8) Å, Rp = 3.56 % and wRP = 5.82% | ||||
| O | 6c | 0 | 0 | 0.7736 (4) |
| Bond length (Å) | Li-O | Cr-O | Cr-Cr/Li-Li | Li-Cr |
| 1.8185 | 2.1828 | 2.8199 | 2.7961 | |
| Compounds | B Cationic Radii | Raman Mode Assignment | Raman Frequency (ω) (cm−1) | Gruneisen Parameter (γ) |
|---|---|---|---|---|
| [32] LiCoO2 | 0.545 Å | Eg | 486(1) | 1.15 |
| A1g | 595(1) | 0.79 | ||
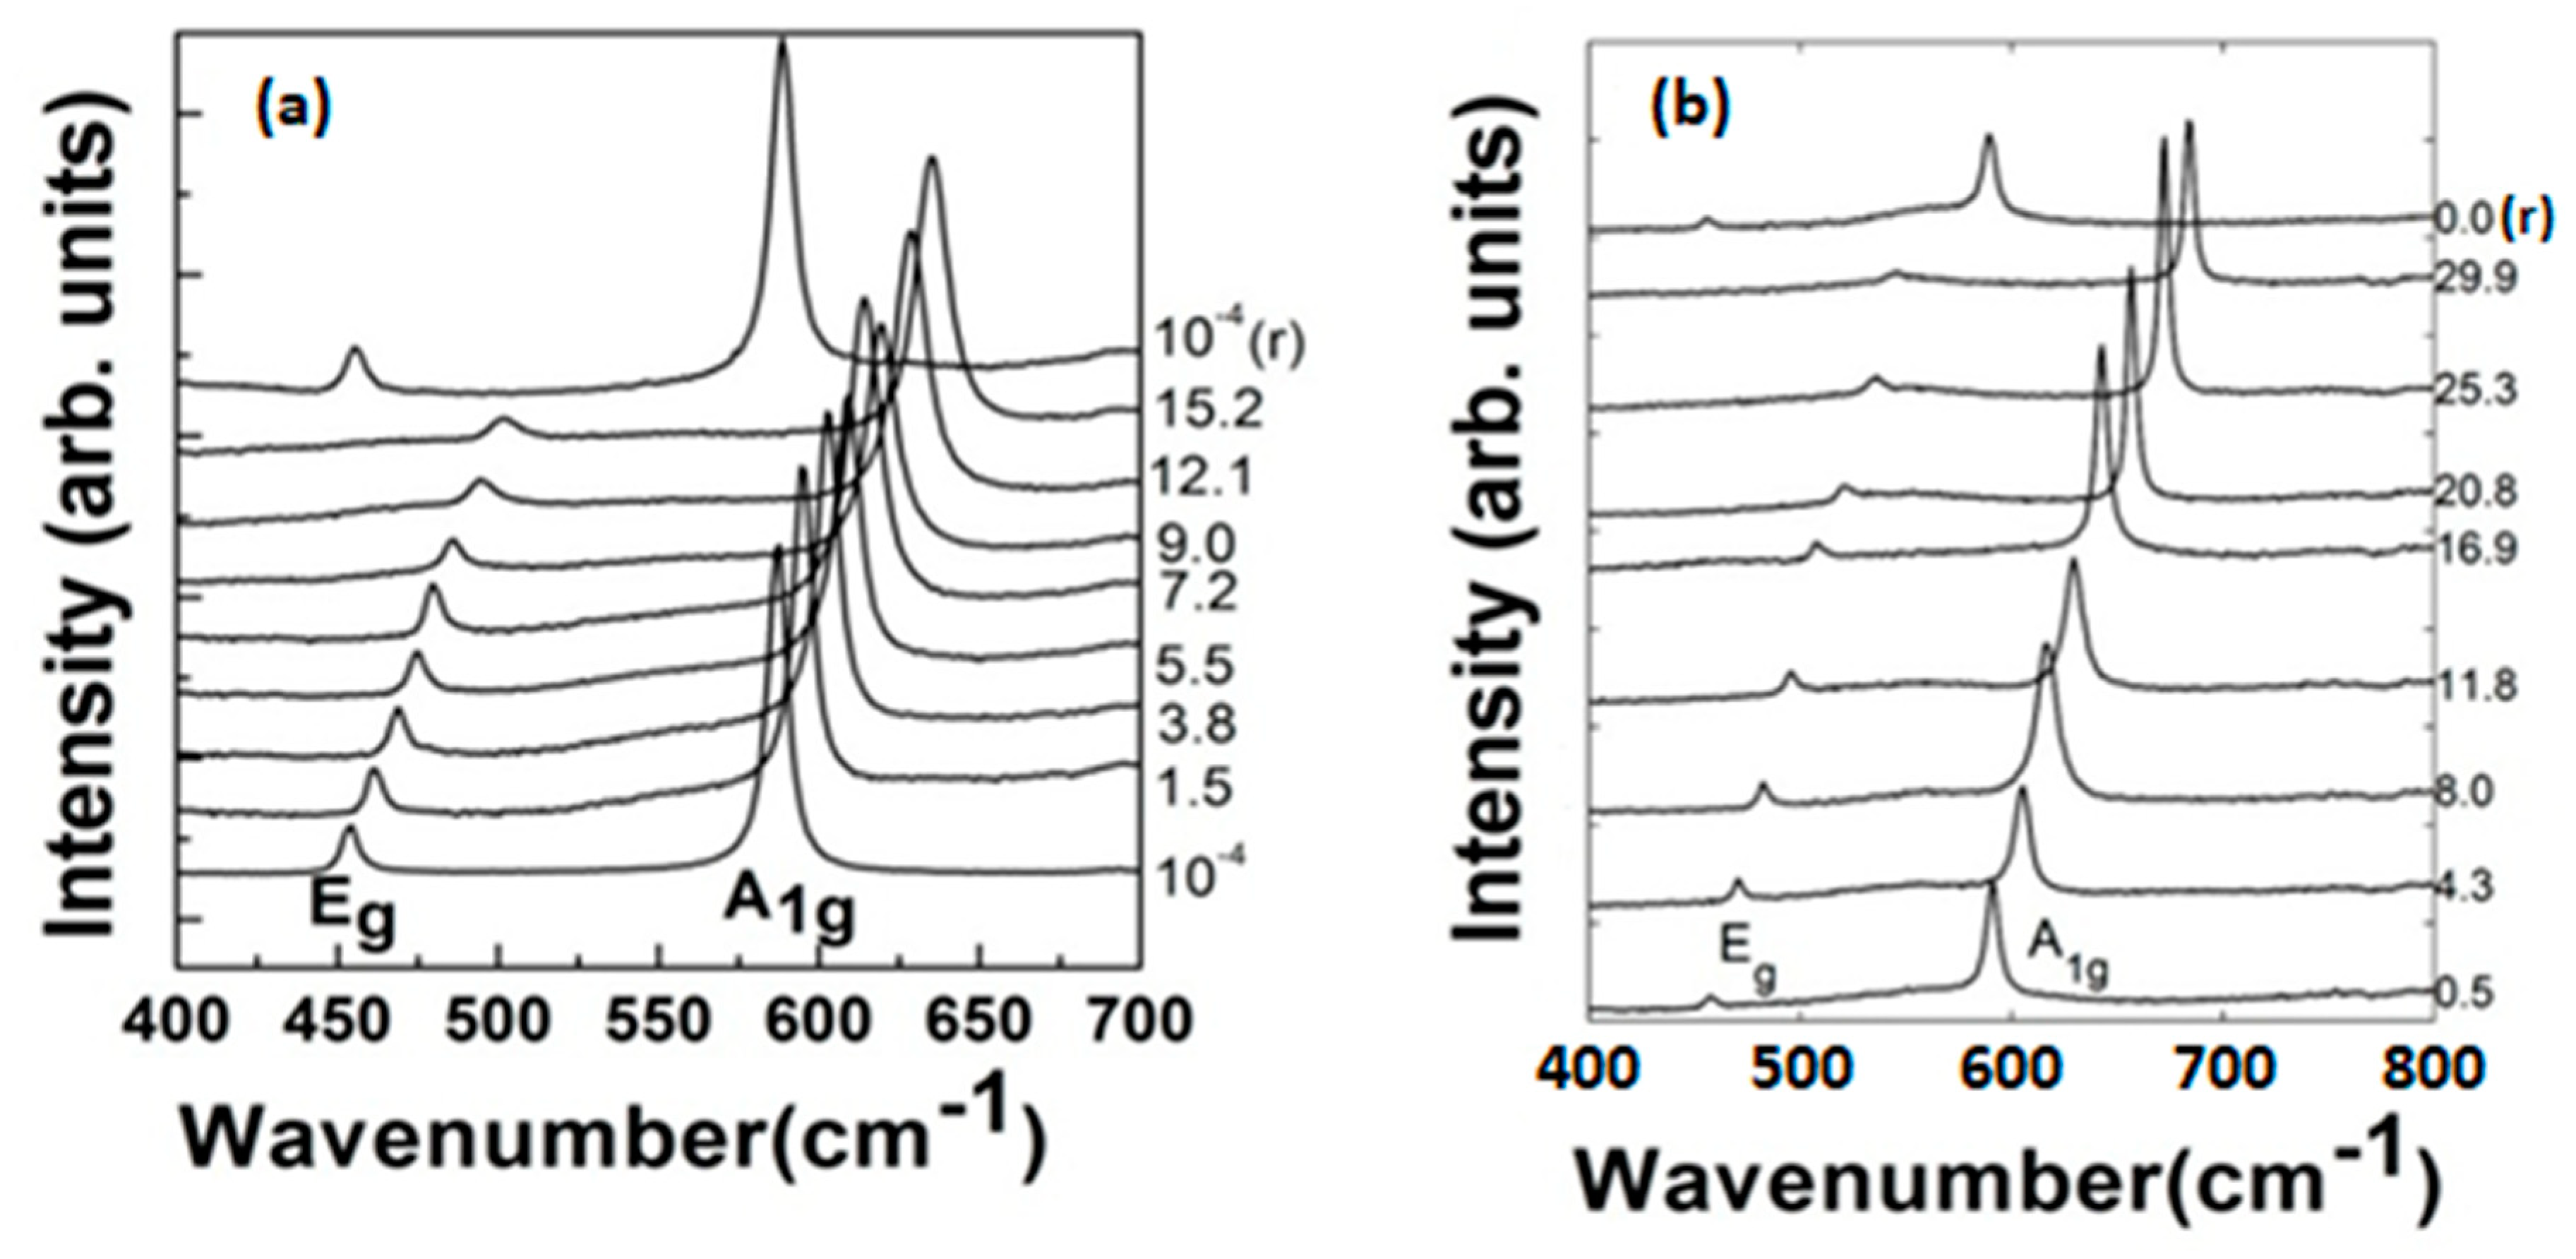
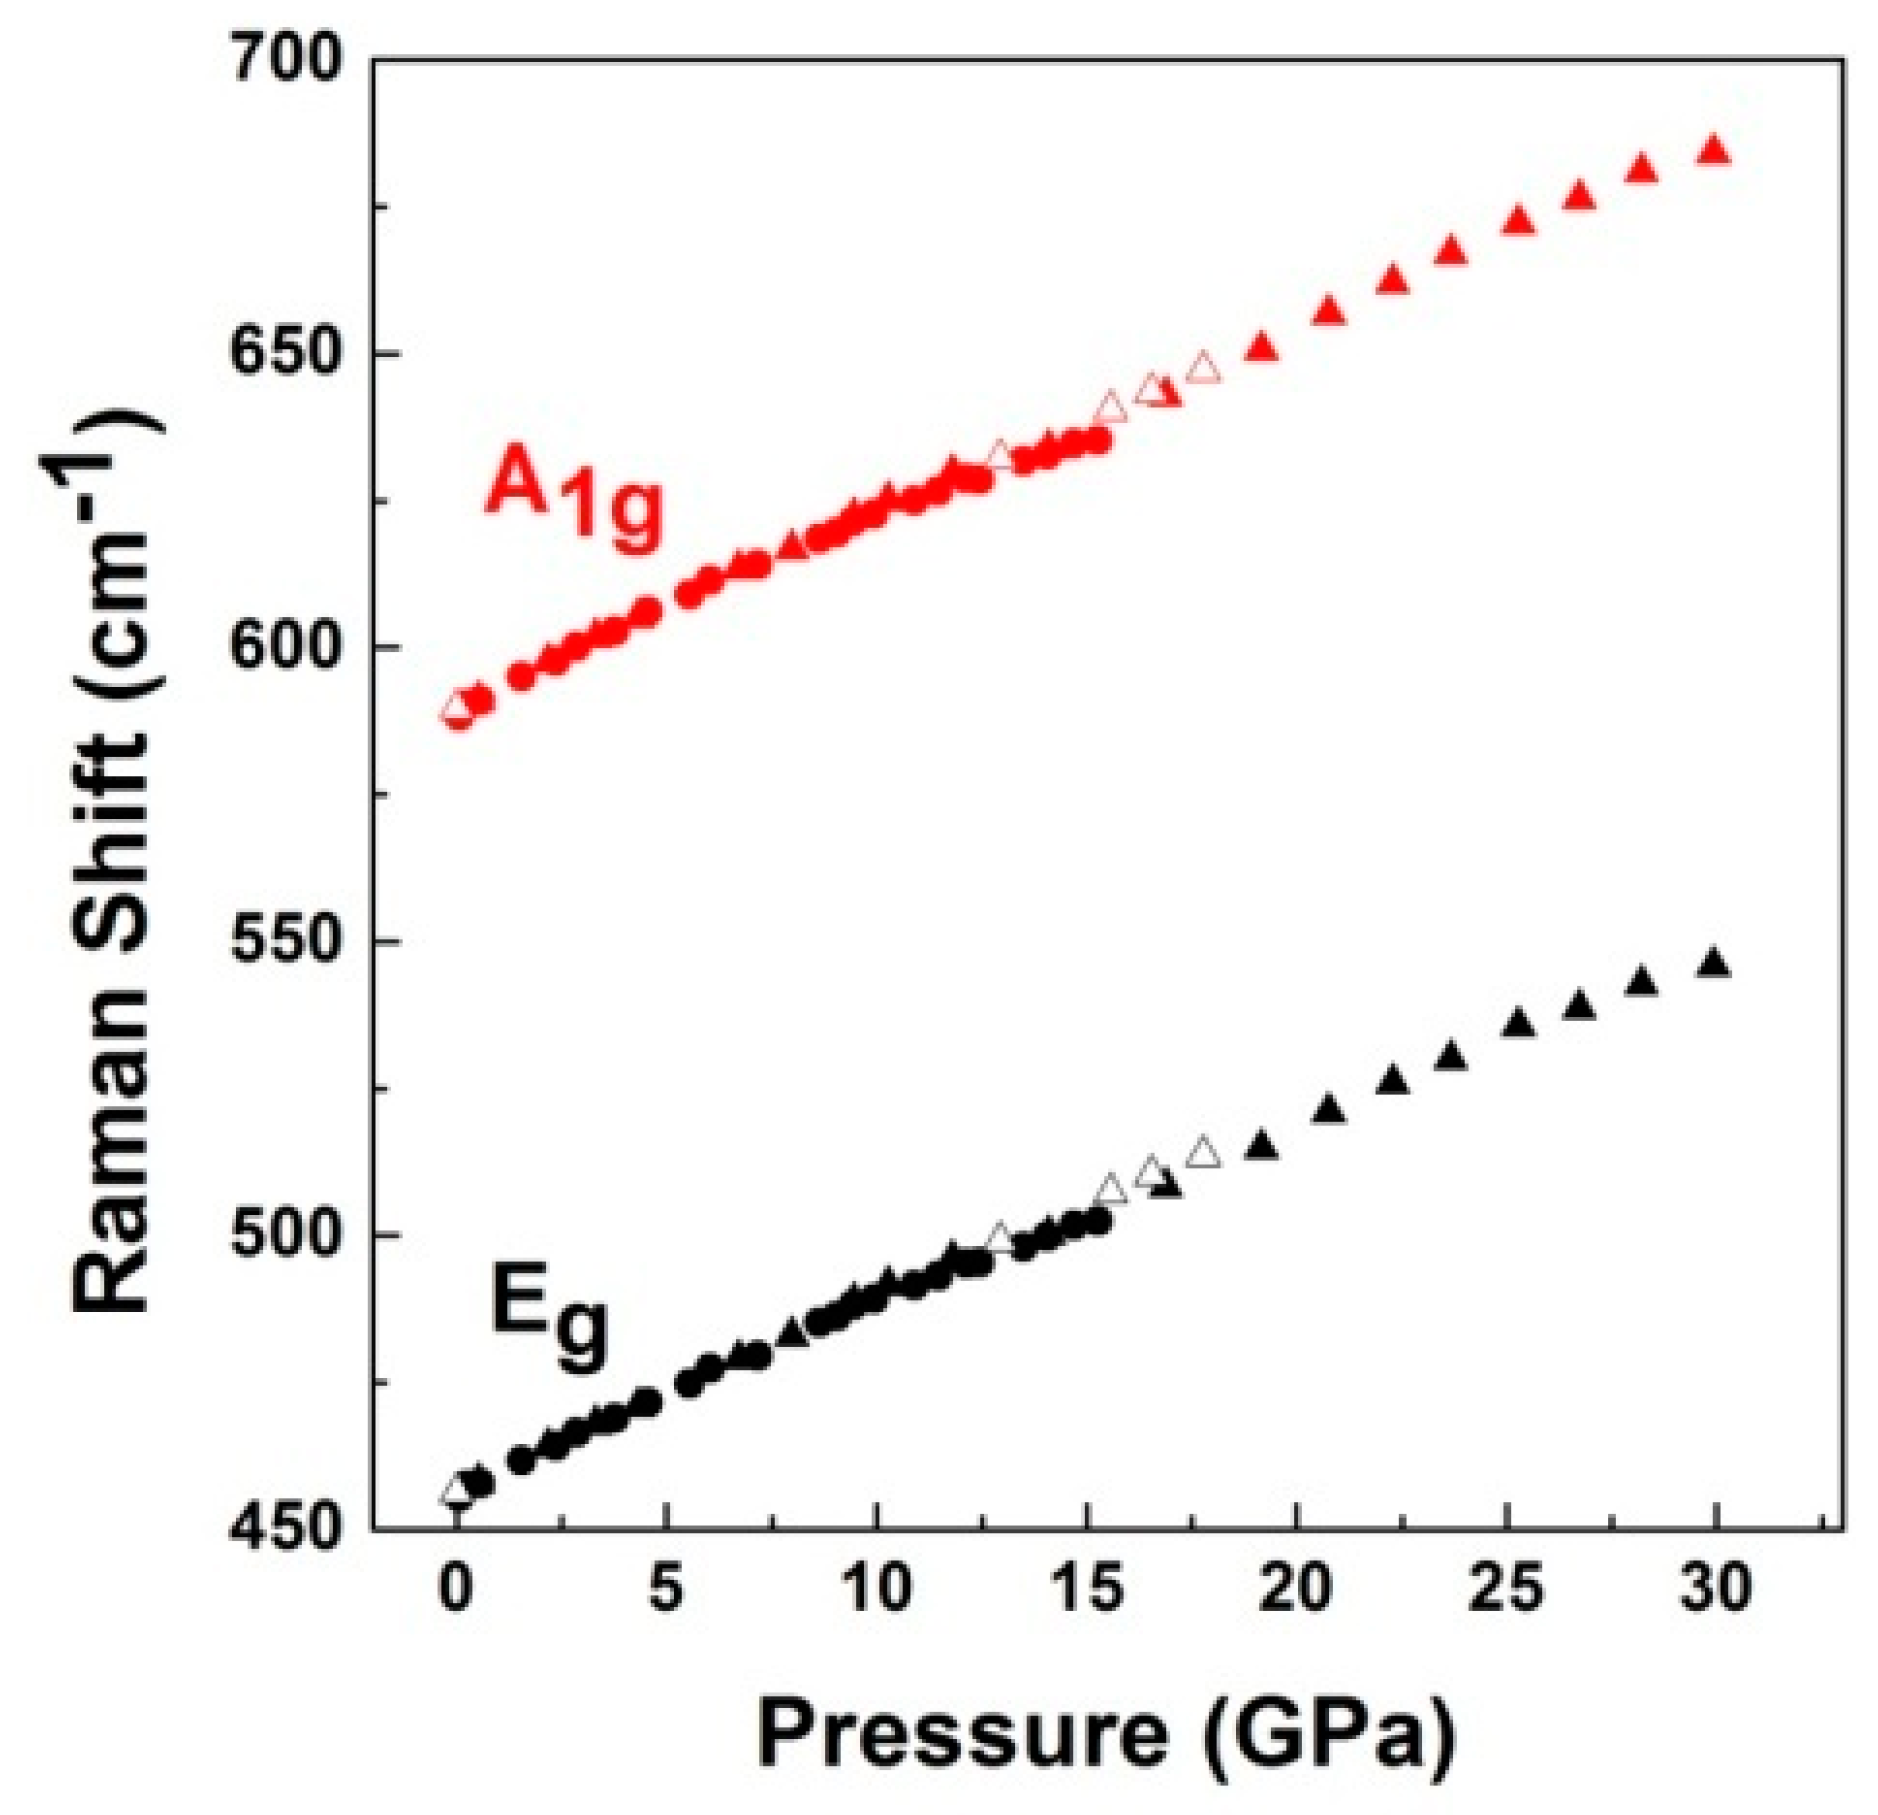
| [this work] LiCrO2 | 0.615 Å | Eg | 456(2) | 1.07(2) |
| A1g | 589(2) | 1.18(2) | ||
| [47] NaCoO2 | 0.545 Å | Eg | 486 | |
| A1g | 586 | |||
| [48] LiNiO2 | 0.56 Å | Eg | 465 | |
| A1g | 545 |
| Compounds | a axis | c/a | V0 | B0 (GPa) | B0′ | κa (10−3 GPa−1) | κc (10−3 GPa−1) | |
|---|---|---|---|---|---|---|---|---|
| [32] LiCoO2 | Exp | 2.8155 | 4.992 | 96.48 | 149(2) | 4.1(3) | ||
| LDA | 2.7921 | 4.849 | 91.413 | 168.5 | 4.67 | |||
| GGA | 2.8559 | 4.899 | 98.838 | 142.9 | 4.51 | |||
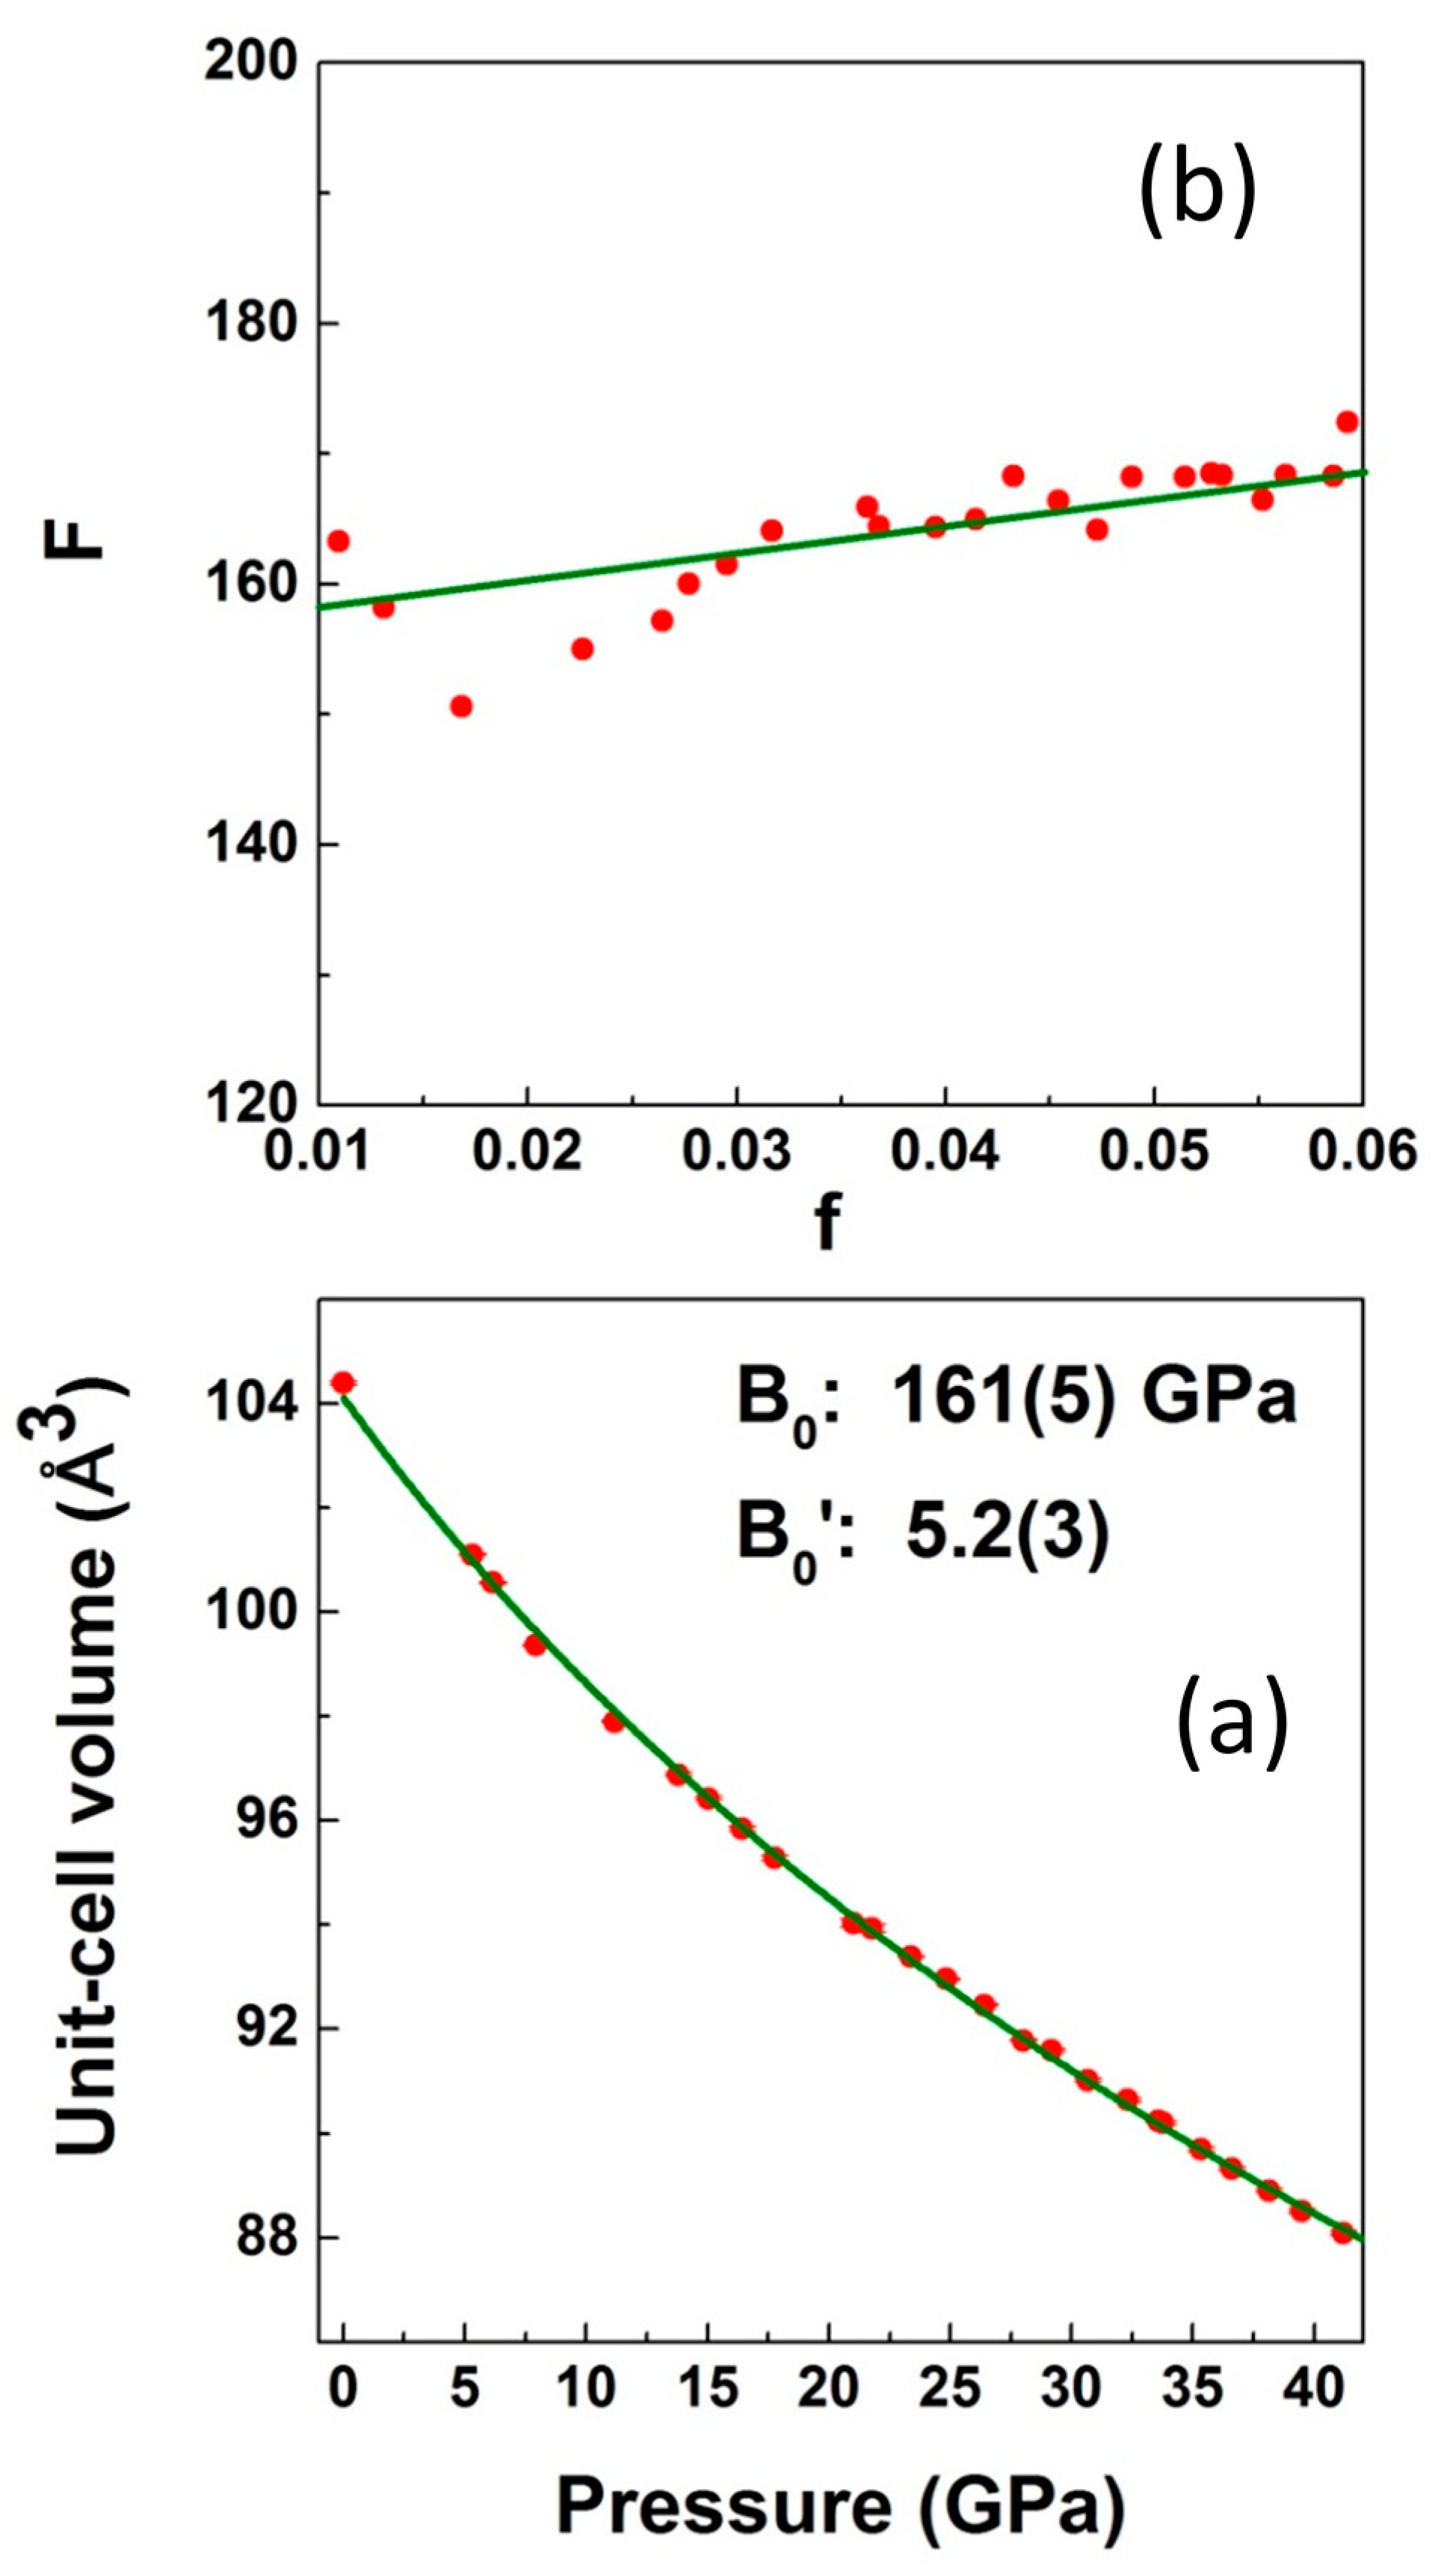
| [this work] LiCrO2 | Exp | 2.8941(3) | 4.9725 | 104.38(2) | 161(5) | 5.2(3) | 1.34 | 4.78 |
© 2018 by the authors. Licensee MDPI, Basel, Switzerland. This article is an open access article distributed under the terms and conditions of the Creative Commons Attribution (CC BY) license (http://creativecommons.org/licenses/by/4.0/).
Share and Cite
Garg, A.B.; Errandonea, D.; Pellicer-Porres, J.; Martinez-Garcia, D.; Kesari, S.; Rao, R.; Popescu, C.; Bettinelli, M. LiCrO2 Under Pressure: In-Situ Structural and Vibrational Studies. Crystals 2019, 9, 2. https://doi.org/10.3390/cryst9010002
Garg AB, Errandonea D, Pellicer-Porres J, Martinez-Garcia D, Kesari S, Rao R, Popescu C, Bettinelli M. LiCrO2 Under Pressure: In-Situ Structural and Vibrational Studies. Crystals. 2019; 9(1):2. https://doi.org/10.3390/cryst9010002
Chicago/Turabian StyleGarg, Alka B., Daniel Errandonea, Julio Pellicer-Porres, Domingo Martinez-Garcia, Swayam Kesari, Rekha Rao, Catalin Popescu, and Marco Bettinelli. 2019. "LiCrO2 Under Pressure: In-Situ Structural and Vibrational Studies" Crystals 9, no. 1: 2. https://doi.org/10.3390/cryst9010002
APA StyleGarg, A. B., Errandonea, D., Pellicer-Porres, J., Martinez-Garcia, D., Kesari, S., Rao, R., Popescu, C., & Bettinelli, M. (2019). LiCrO2 Under Pressure: In-Situ Structural and Vibrational Studies. Crystals, 9(1), 2. https://doi.org/10.3390/cryst9010002