Article

Synthesis and Adsorbing Properties of Tabular {001} Calcite Crystals

1
Laboratory for Precipitation Processes, Division of Materials Chemistry, Ruđer Bošković Institute, P. O. Box 180, HR-10002 Zagreb, Croatia
2
Dipartimento di Chimica “Giacomo Ciamician”, Alma Mater Studiorum-Universitá di Bologna, via Selmi 2, 40126 Bologna, Italy
*
Author to whom correspondence should be addressed.
Crystals 2019, 9(1), 16; https://doi.org/10.3390/cryst9010016
Submission received: 12 November 2018 / Revised: 20 December 2018 / Accepted: 22 December 2018 / Published: 27 December 2018
(This article belongs to the Special Issue Biological Crystallization)

Abstract

:
One of the most common crystal habits of the thermodynamically stable polymorph of calcium carbonate, calcite, is the rhombohedral one, which exposes {10.4} faces. When calcite is precipitated in the presence of Li+ ions, dominantly {00.1} faces appear together with the {10.4}, thus generating truncated rhombohedrons. This well-known phenomenon is explored in this work, with the aim of obtaining calcite crystals with smooth {00.1} faces. In order to achieve this objective, the formation of calcite was examined in precipitation systems with different c(Ca2+)/c(Li+) ratios and by performing an initial high-power sonication. At the optimal conditions, a precipitate consisting of thin, tabular {001} calcite crystals and very low content of incorporated Li+ has been obtained. The adsorption properties of the tabular crystals, in which the energetically unstable {00.1} faces represent almost all of the exposed surface, were tested with model dye molecules, calcein and crystal violet, and compared to predominantly rhombohedral crystals. It was found that the {00.1} crystals showed a lower adsorption capability when compared to the {10.4} crystals for calcein, while the adsorption of crystal violet was similar for both crystal morphologies. The obtained results open new routes for the usage of calcite as adsorbing substrates and are relevant for the understanding of biomineralization processes in which the {00.1} faces often interact with organic macromolecules.

1. Introduction

Investigation of precipitation mechanisms of calcium carbonates (CaCO3) and their interactions with additives and surface chemistry, has attracted growing interest, due to promising technological applications [1,2,3] and the crucial role of this mineral in biomineralization [4,5,6]. Among CaCO3 polymorphs, calcite is the most frequently studied, since it is in a thermodynamically-favored phase at ambient conditions and in the absence of additives. Calcite is an important product in the pharmaceutical, chemical, paper, and glass industries, and is also used as a sorbent for exhaust gasses and for the determination of the quality of drinking water [7,8,9]. Moreover, several organisms possess tissues mineralized with calcite that perform vital functions, like skeletal protection and support, light perception, or storage of calcium ions [10,11,12,13].
The morphology of calcite crystals produced in vitro is largely controlled by experimental conditions, such as pH, temperature, and supersaturation, as well as by the presence of impurities or additives that typically exert significant influence on the crystallization process [7,14,15,16,17]. The addition of inorganic additives such as Mg2+ and Li+ causes selective stabilization of calcite crystals with different morphologies [18,19]. Thus, when precipitated in the presence of a Li+-containing solution undersaturated with respect to Li2CO3, calcite shows {00.1} faces in addition to the {10.4} ones, which are typically obtained without additives. The extension of {00.1} faces depends on the c(Ca2+)/c(Li+) ratio [19,20,21,22,23,24,25,26,27,28]. In silico experiments on the calcite surface energy have shown that the rhombohedral {10.4} faces are the most stable, while the {00.1} faces have lower stability in the absence of additives [29]. The substitution of the surface Ca2+ with Li+ destabilizes {10.4} faces, making the {00.1} ones the most stable and causing the formation of tabular crystals with {00.1} basal and {10.4} side faces [23,29].
Calcite has been used in experimental and theoretical studies as a model substrate for the investigation of the interactions occurring at organic-inorganic interfaces. Different classes of compounds have been tested, ranging from those with small molecular mass, such as water [30,31], alcohols [32], carboxylic [33,34] or amino acids [35,36], to bigger ones, such as polypeptides [37,38,39], proteins [40], or polysaccharides [41]. Most of these studies focus on the interaction of molecules on the calcite {10.4} surface, as this face is typically exposed by synthetic crystals, while the investigations of adsorption processes on other faces are relatively unexplored. Indeed, the structure of the monoatomic growing step on the {10.4} surface corresponds to {00.1} faces. Therefore, the study of the adsorption process on the well exposed and dominant {00.1} faces is also relevant. because the diffusion of additives along the {10.4} steps of calcite crystals occurs on them. Furthermore, this is a position of strong interfacial interactions with non-constituent molecules and organic matrix in biomineralization.
This study reports an optimized procedure for the preparation of size-uniform, thin, tabular calcite crystals with well-developed {00.1} faces ({00.1} calcite). In addition, the adsorption of model organic molecules, calcein and crystal violet, on {00.1} calcite is examined and compared to their adsorption on stable {10.4} faces. Besides the basic understanding of the specific {00.1} interactions with organic molecules, the knowledge gained from this research may be relevant to technology in which the presence of different crystal faces may tune the adsorbing capacities of a substrate. In addition, these data can contribute to the understanding of the processes of biomineralization, since the mineral interactions with intra-mineral macromolecules often occur exactly at {00.1} faces.

2. Materials and Methods

The reactant solutions were prepared by using the analytical grade chemicals, CaCl2∙2H2O, LiCl, and NaHCO3 and deionized water (conductivity <0.055 µS·cm1). Calcium carbonate precipitation was initiated by mixing equal volumes (200 cm3) of CaCl2/LiCl solution with NaHCO3 solution. All solutions were freshly prepared and the initial concentrations of CaCl2 and NaHCO3 were identical, c = 0.1 mol·dm−3, while the concentration of LiCl varied in the range from 0 to 1.0 mol·dm−3. The initial supersaturation, expressed with respect to calcite, was Sc ≈ 23. Calcite supersaturation, S, was defined as a square root of the activity product quotient, S = [(aCa × aCO3)/Ksp]1/2, where a indicates the species activity and the Ksp is the calcite solubility product. The reference experiments were performed in the absence of LiCl (reference system).
The sonication was initiated in NaHCO3 solution before mixing with CaCl2/LiCl solution. The systems were sonicated for 10 min and the pH was continuously measured. After that period, the mixture was left without stirring for 5 days. The ultrasonic irradiation was performed by using the Branson Sonifier 250 (20 kHz frequency). The ultrasound power output used in the experiments and set at 20% was 40 W. In order to avoid overheating the system, the pulsed mode was applied (60 cycles per minute, t = 0.2 s). The horn diameter was 5 mm and it was immersed in the center of the reaction vessel, 5 cm above the bottom. The crystal samples were collected by filtering 10 cm3 of suspension through a 0.22 µm membrane filter. The precipitates were washed with small portions of water and dried at 90 °C for 2 h.
The polymorphic composition of the dried samples was determined by FT-IR spectroscopy (FT-IR TENSOR II, Bruker, Billerica, MA, USA), using the KBr pellets technique. X-ray powder diffraction, XRD (Philips X’Celerator diffractometer, Philips, Amsterdam, The Netherlands) was made in the angular range 20° ≤ 2θ ≤ 70°, setting a step size 2θ = 0.05° and measuring time of 120 s per step. The crystal morphology was determined by scanning electron microscopy (FEG SEM Hitachi 6400 (Hitachi, Tokyo, Japan), JEOL JSM-7000F (JEOL, Tokyo, Japan) and Phenom model G2, (Phenom-World BV, Eindhoven, The Netherlands)), operating in low-voltage mode. The SEM samples were placed on carbon tape without any coating. The calcium and Li+ ion content in the crystals was determined by an ion chromatography system (ICS-1100, Dionex, Sunnyvale, CA, USA) fitted with a SC16 Analytical Column and using 30 mM MSA eluent. The specific surface area was determined by the multiple BET method (Micromeritics, Gemini), using liquid nitrogen.
For adsorption measurements the solutions of respective dye (c = 10 µmol·dm−3) were diluted in HEPES buffer (c = 0.1 mol·dm−3, pH 8.0). The buffer was pre-saturated with excess of rhombohedral calcite crystals, by mixing the suspension for 1 h and filtering by means of 0.2 μm membrane filter. Exactly 4 mg of calcite crystals (tabular or rhombohedral) were suspended in 2 mL of dye solution and stirred for 24 h, after which the crystals were separated by centrifugation. The quantity of residual dye in the solution was determined by UV-Vis spectroscopy (Cary UV-Vis 300Bio, Agilent Technologies, Santa Clara, CA, USA), measuring the absorbance at λ = 495 nm (calcein) and λ = 594 nm (crystal violet). The kinetics of adsorption was determined by the same protocol, by sampling at predetermined time intervals.

3. Results and Discussion

3.1. Synthesis and Characterization of Thin Tabular {00.1} Calcite Crystals

The first objective of this research was to identify the optimal conditions for the preparation of thin tabular calcite crystals, exposing predominantly the {00.1}, over the {10.4} faces. A series of CaCO3 precipitation systems having high initial supersaturation, ci(CaCl2) = ci(NaHCO3) = 0.1 mol·dm−3; Sc ≈ 23, and different c(Li+), were initially irradiated by high-power ultrasound for 10 minutes and the precipitates were left to age in the mother solutions without stirring for 5 days (Table 1).
The precipitates were sampled and characterized immediately after the sonication process, continuously during the aging of precipitate, and finally after the equilibrating of the process, which typically lasted for 5 days (Figures SI1–SI6, Table SI1). The addition of Li+ was supposed to stabilize {00.1} calcite crystals, while the ultrasound irradiation was applied in order to influence the nucleation and crystal growth processes, which may cause the changes of polymorphic composition, the morphology, or the size distribution of the precipitate. Indeed, in order to test a critical role of high-power ultrasound irradiation in the synthesis of {00.1} calcite, different types of stirring of the solutions during the nucleation period have been applied. Thus, either a mechanical propeller, Teflon-coated magnetic stirrer, or ultrasonic irradiation has been used during the first 10 minutes of the precipitation process. In Figure SI7, typical progress curves, pH vs time, of the systems (ci(CaCl2) = ci(NaHCO3) = 0.1 mol·dm−3; c(Li+) = 0.3 mol·dm−3, or c(Li+) = 0), stirred by different devices, are shown. Since the initial supersaturation was relatively high in all systems, precipitation started immediately after mixing the reactants (pH drop from 8.3 to 7.3, not shown). However, a shortening of the induction time for vaterite formation, caused by applying more intensive agitation and seen as a pH drop, can be observed (ultrasonic < magnetic < mechanical). At that, the most likely mechanism of the promotion of nucleation in the case of sonication is a collapse of cavitation bubbles, which caused localized high pressure and temperature spots, while the literature data indicated that the energetic collisions among particles may enhance the transition of metastable vaterite to calcite as well [42,43,44,45]. In addition, the SEMs of the respective samples isolated after 5 days of aging (Figure SI8) showed significantly different morphologies of calcite crystals. Thus, only a partial truncation of {10.4} calcite faces occurred when magnetic or mechanical stirring were applied, while in the case of ultrasonication, relatively uniform, thin, and hexagonal tabular crystals could be observed. Consequently, it can be concluded that in this particular system, the morphology of calcite can be assigned to the both parameters, initial mode of mixing and the LiCl addition.
The results of analysis of the polymorphic distribution of the precipitates from the different systems are reported in Table 1 and showed in Figure 1.
It can be seen that during the early stages of the precipitation process, vaterite always co-precipitates with calcite, and its relative amount increases by increasing the c(Li+) in solution. Since vaterite is thermodynamically metastable, it converts into calcite during the time, with a transition time proportional to the c(Li+). Indeed, after 5 days of aging, vaterite completely transformed into calcite at all examined conditions, with differences obtained in the system of the highest c(Li+) applied, in which just 1.89 wt % of vaterite still persists. Aquilano et al. [27] showed that Li+ is sporadically adsorbed on growing calcite crystals and that Li+ is not homogeneously distributed in the crystals. On the other hand, no data reporting Li+ distribution into the vaterite crystals are available, to the best of our knowledge. Therefore, we hypothesize that in the systems with higher Li+ content, the increasing adsorption onto the vaterite surface cause its slower dissolution and kinetic stabilization, which consequently postpone the formation of calcite, as already reported for organic molecules [46]. However, the adsorption of Li+ onto the calcite can also inhibit its growth, which influences the overall course of transformation.
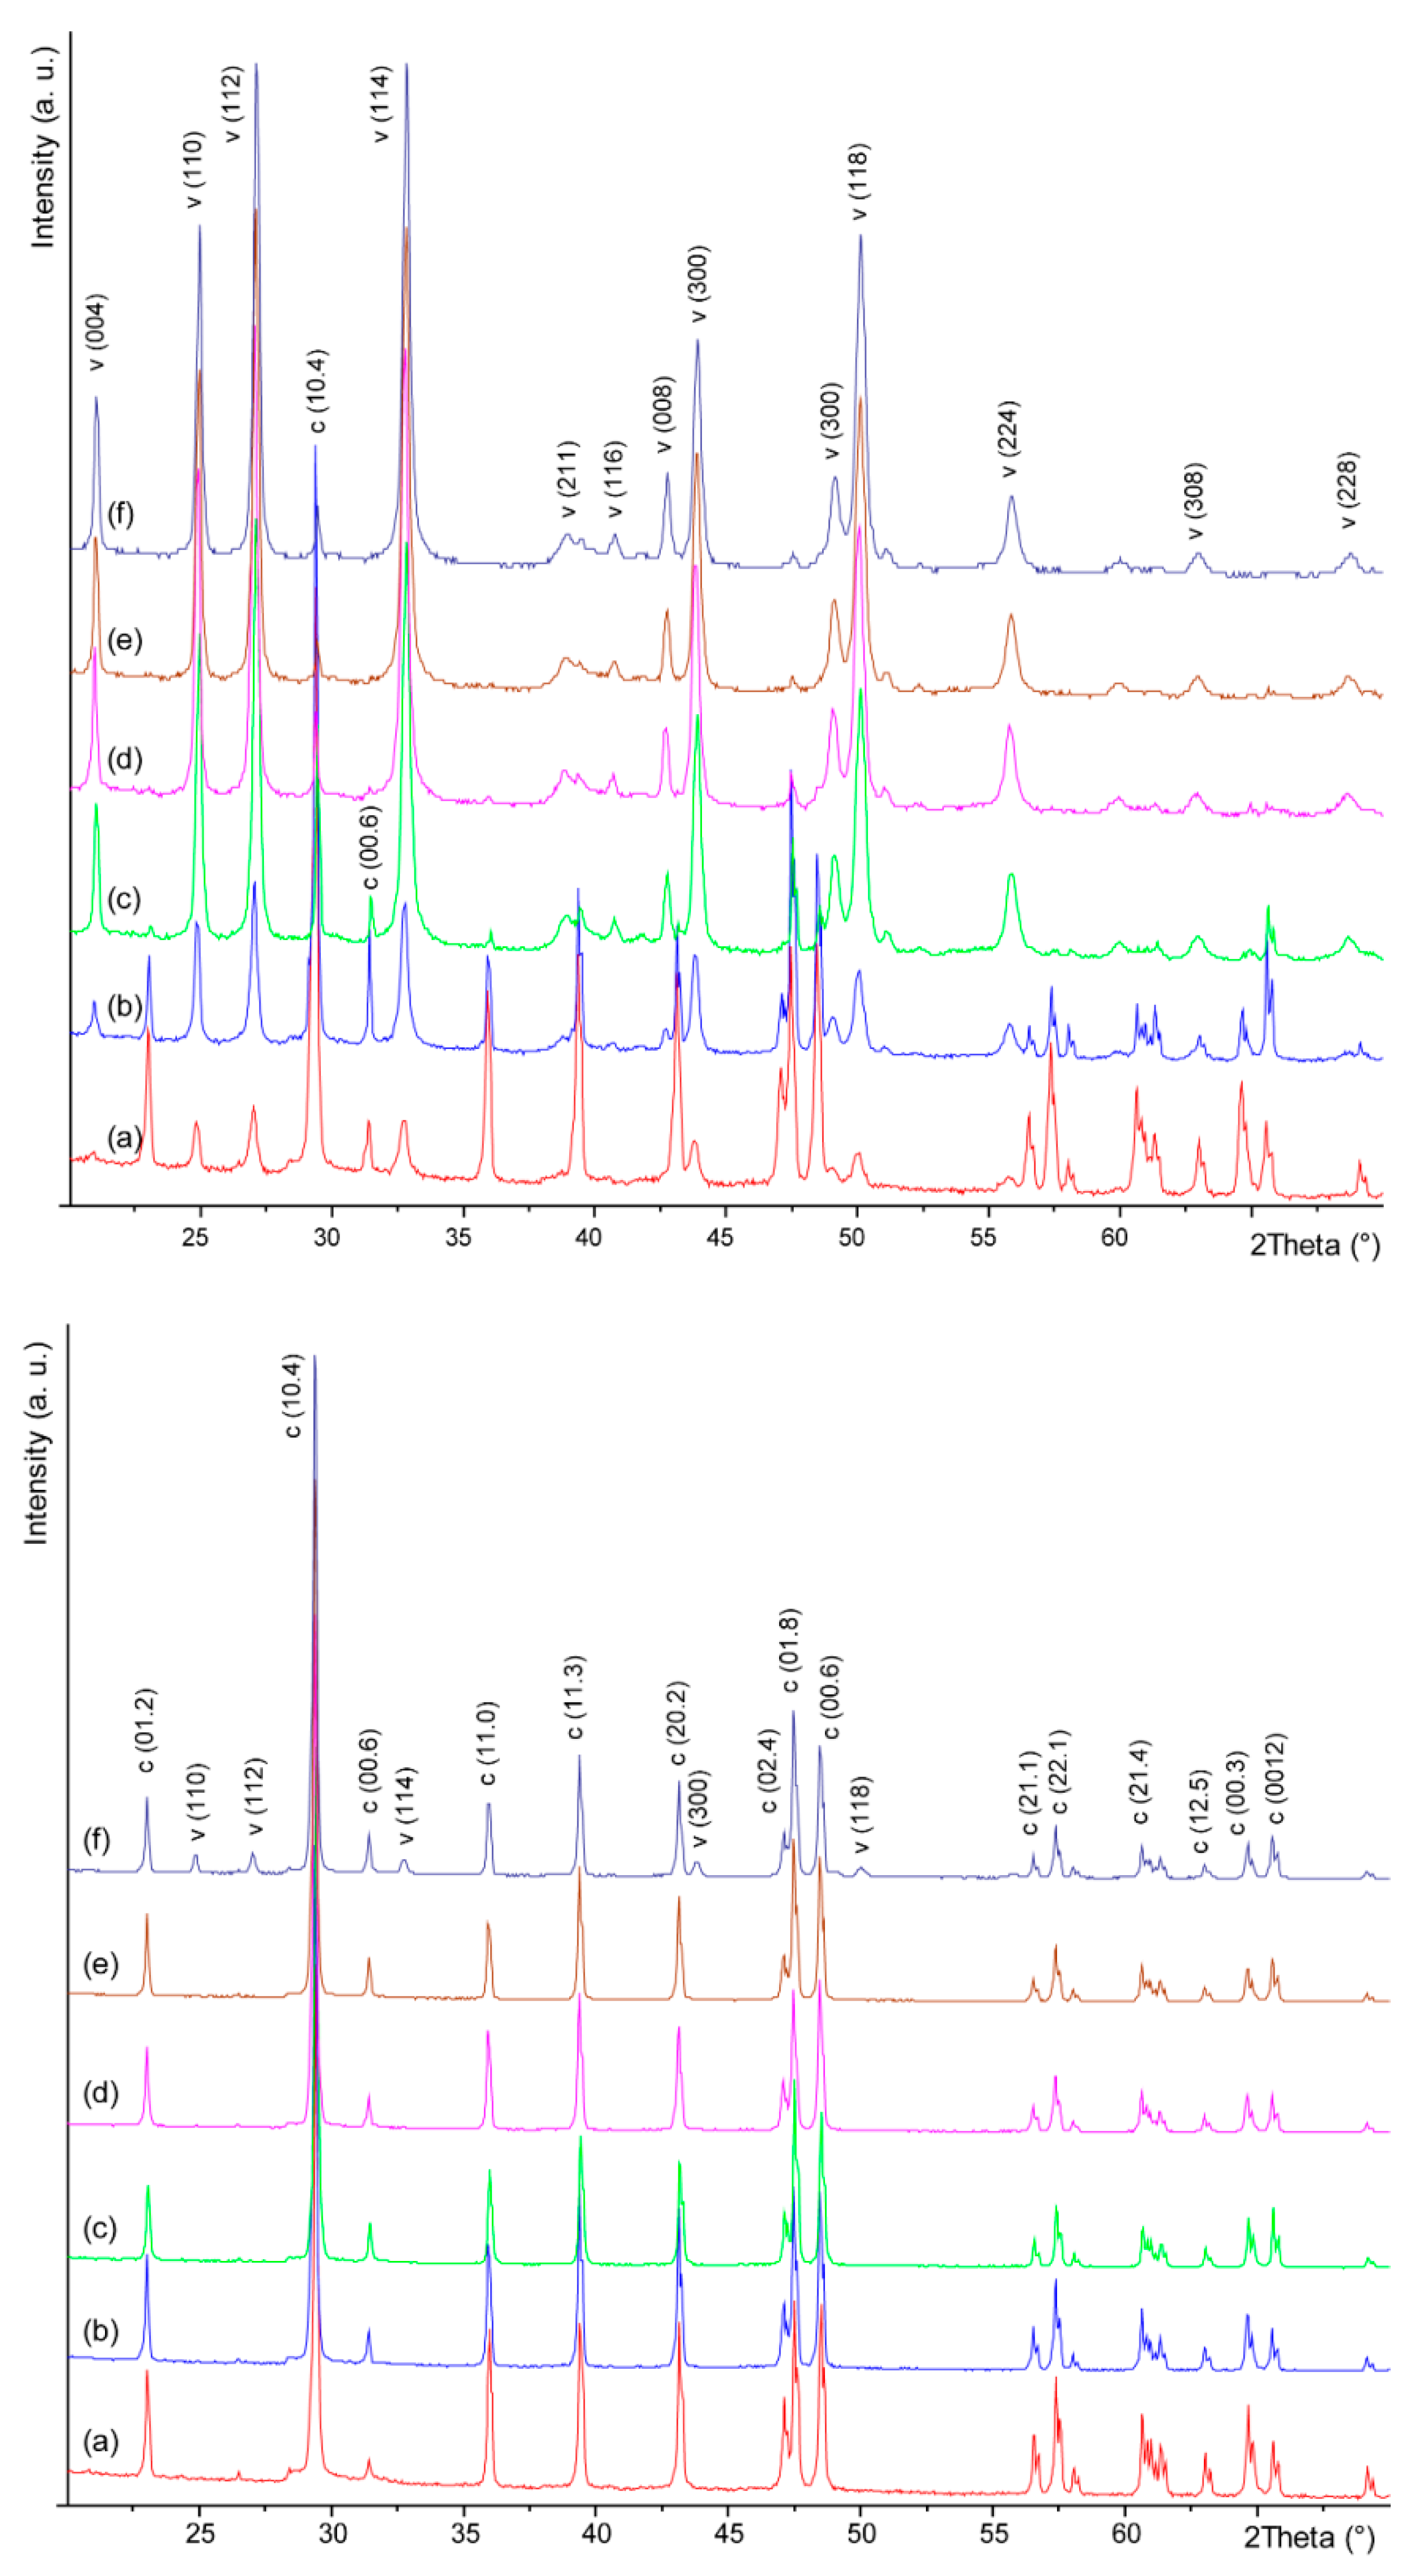
The analysis of X-ray powder diffraction XRPD patterns during the transformation process in all systems showed only diffraction peaks of vaterite and calcite (Figure 2 and Figures SI9–SI14, Table SI2), indicating that the formation of Li2CO3 does not occur at conditions studied in this work. On the contrary, in the systems described in the literature, which were supersaturated with respect to Li2CO3, the precipitation of this phase has been detected on calcite surface [25].
Shape and morphology of crystals were monitored during the progress of precipitation (Figure 3 and Figures SI15–SI17) and the obtained morphometric data are reported in Table 1. Thus, in the absence of Li+, a mixture of hollow spherical vaterite and rhombohedral calcite crystals was obtained after 10 min of ultrasonic irradiation (Figure SI15). The comparison of higher-magnification SEM of the vaterite samples, prepared in the presence (0.3 mol·dm−3) or in the absence of Li+ (Figure SI17), indicates that the lithium ions do not significantly change the morphology of spherulites. However, after 5 days, only calcite crystals were detected, homogeneous in size and with surface pits, truncations, and ragged edges (Figure 3a and Figure SI15), which can be attributed to the etching caused by the atmospheric CO2 dissolved in the mother solution during the aging [47,48].
In the system with c(Li+) = 0.1 mol·dm−3, after 10 min of sonication, hollow spherulitic vaterite and rhombohedral calcite were observed as well. However, after 5 days the calcite crystals exhibited triangular faces, intergrowth, and crystal aggregation (Figure 3b and Figure SI15). In addition, the smooth {10.4} crystal faces were truncated with {001} faces. Rajam and Mann [19] showed that calcite crystals truncation depends on Li+/Ca2+ molar ratio, and that at low ratios the truncations are triangular, owing to growth of {00.1} and partial truncation of three {10.4} faces.
The system with c(Li+) = 0.3 mol·dm−3, after 10 min of ultrasonic irradiation contained mainly spherical vaterite particles agglomerated into 3 μm structures, as well as tabular calcite crystals and calcite crystals with triangular truncations (Figure 3c inset and Figure SI15). After 5 days of aging, only thin hexagonal tabular calcite crystals, with well-developed basal {00.1} faces and {10.4} side faces, were obtained (Figure 3c and Figure SI15). The hexagonal crystal truncations, formed by partial truncation of all six {10.4} calcite faces, are promoted by the adsorption of Li+ and followed by absorption of Li2CO3 into growing calcite crystals, as showed by Aquilano [27].
At the highest Li+ concentrations applied, c(Li+) = 0.5 mol·dm−3 and 1.0 mol·dm−3, and after 10 min of ultrasonic irradiation a mixture of vaterite particles, together with small amounts of tabular calcite with well-developed {00.1} faces (Figure 3d–f insets and Figure SI16), was obtained. The vaterite particles were aggregated in structures larger than those in the systems containing lower content of Li+ (6–10 μm). At the end of the process, the remained vaterite particles converted into hollow particles (Figure 3f inset and Figure SI16). Tabular hexagonal crystals obtained in the same systems, contained macro-steps on the {00.1} faces, which were not observed at lower c(Li+) (Figure 3d–f and Figure SI16).
The aspect ratios of the calcite crystal were evaluated by analyzing the respective SEM images of the samples prepared in the systems with different Li+ concentrations and isolated after 5 days of aging (Figures SI15 and SI16). At the same time, the ratios of relative intensities, I10.4/I00.1, were estimated from the XRPD patterns (Figures SI9–SI14). The data shown in the Table 1 and in Figure SI18 indicates that the aspect ratio increased with increasing the Li+ content for each crystal population obtained in the respective system. Also, the ratios of relative intensities, I10.4/I00.1, decrease with increasing Li+ content. Indeed, the aspect ratio values of two classes of the crystals obtained in the final precipitate pointed to two nucleation events, which imply that the conditions in the solutions during these two events (S, Li/Ca) were not completely identical. However, these findings are consistent with SEM observations (Figure 3, Figures SI15 and SI16) which showed that in the system containing c(Li+) = 0.3 mol·dm−3, crystals were plate-like with well-developed {001} faces and without macro-steps. On other hand, in the systems with higher c(Li+), the crystals were larger, but contained macro-steps with expressed {104} side faces.
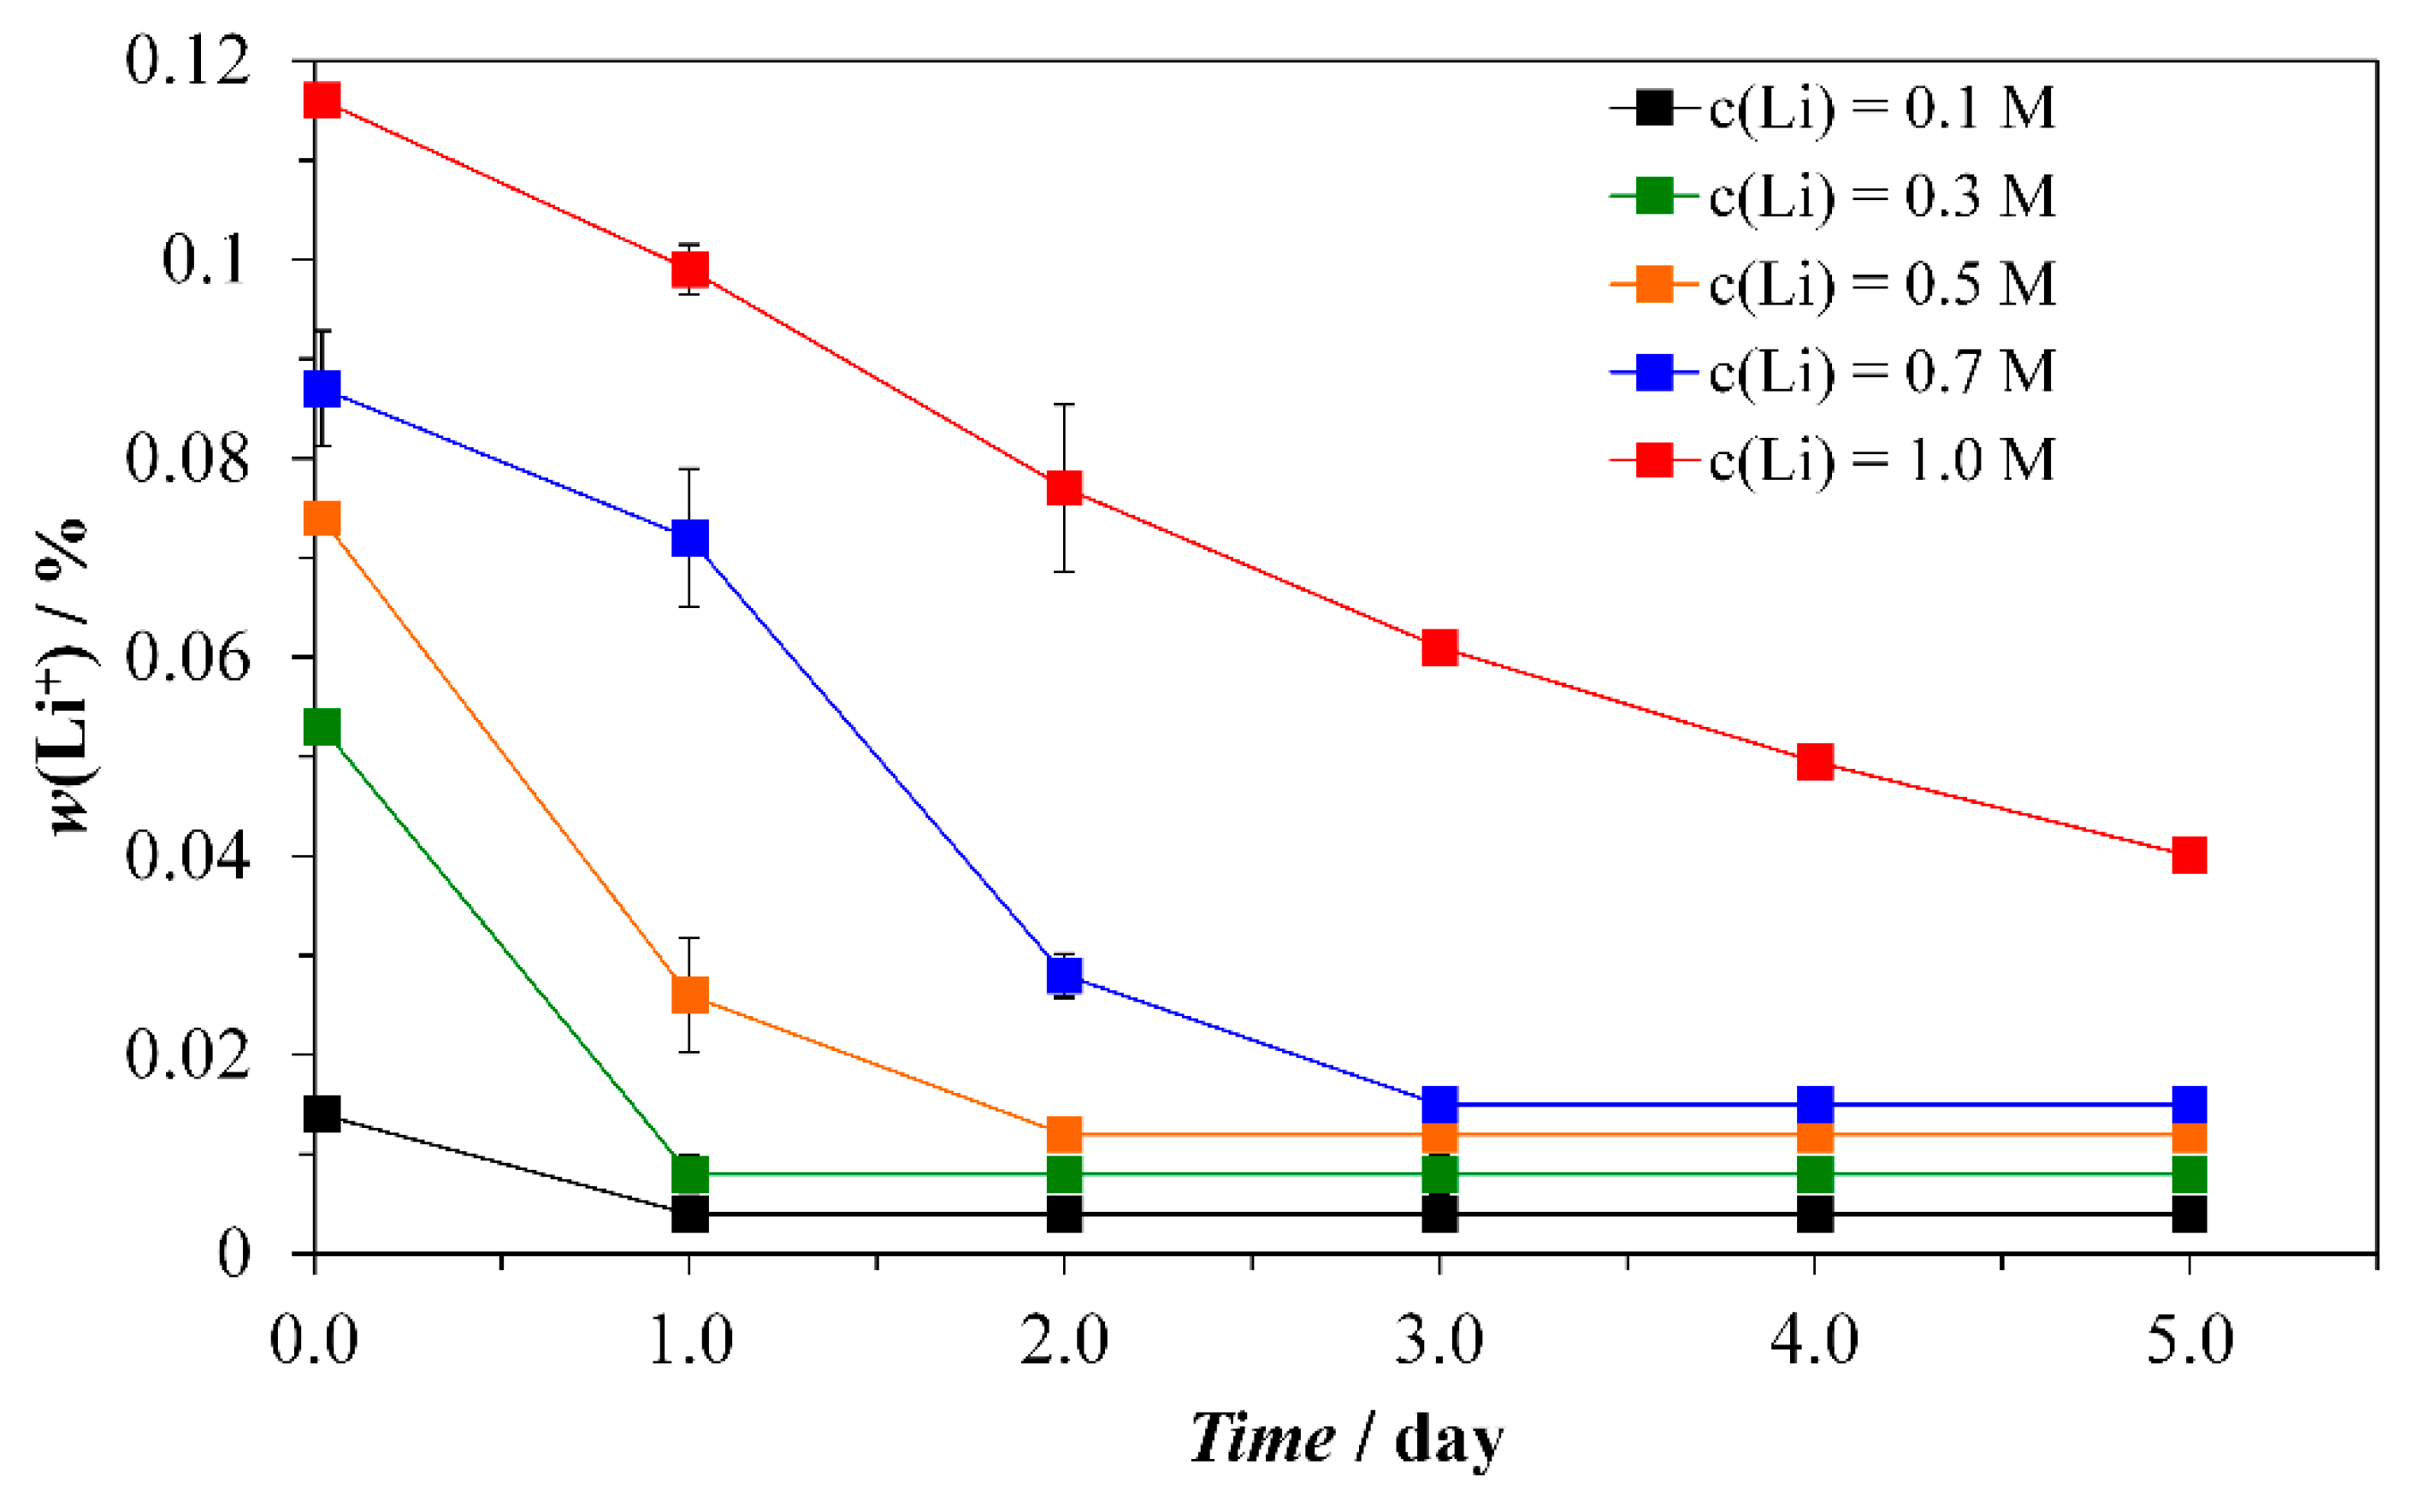
The content of Li+ incorporated into the CaCO3 samples prepared in different chemical environments (different additions of Li+) and isolated during the aging of precipitate was determined by ion chromatography. Thus, Figure 4 shows that the Li+ content in the precipitate continuously decreased during the progress of transformation in each precipitation system.
The highest incorporation determined immediately after 10 minutes of sonication (t = 0 days) was found in the system with c(Li+) = 1.0 mol·dm−3 (w(Li+) = 0.116 wt %), while in the systems with lower initial Li+ concentrations, the content was in the range from 0.087 to 0.014 wt % (SI19). The amount of Li+ incorporated into the precipitate and determined at the end of the aging process was found to vary in the very narrow range between 0.004 and 0.04 wt %. Again, the Li+ incorporation increased almost linearly with increasing the initial Li+ up to the c = 0.7 mol·dm−3 (SI19), so the obtained values may be considered as typical for distribution between solution and tabular calcite crystals with dominant expression of {00.1} crystal planes. On the other hand, in the systems in which vaterite was still present, the measured incorporation of Li+ was significantly higher, which implicate different mechanisms of Li+ uptake. Thus, it can be concluded that, besides the adsorption, the calcite incorporates the Li+ in the crystal structure, while vaterite particles can additionally entrap the Li-containing solution into the pores. Indeed, at the applied supersaturation level, vaterite spherulites are most probably formed by fast spherulitic growth, which is characterized exactly by the increased trapping of dissolved impurities, like Li+ in this particular case [45,49,50].
The results of structural, morphological, and chemical analyses of calcium carbonate precipitate formed in the Li+ containing solutions pointed out that the calcite crystals obtained in the system with c(Li+) = 0.3 mol·dm−3 are appropriate for use in adsorption experiments, in which the {00.1} crystal faces should be investigated. Namely, the prepared crystals are relatively uniform in size, without expressed macro-steps and {10.4} faces, as well as the content of incorporated Li+, is relatively low (Figure SI19)

3.2. Adsorption of Model Molecules

The adsorption proprieties of {00.1} calcite prepared in the system c(Li+) = 0.3 mol·dm−3 were compared with the {104} calcite obtained by the same procedure but in the absence of Li+. The specific surface area of the {00.1} calcite used for the adsorption experiments was, s = 0.38 m2·g−1, while of the {10.4} calcite was, s = 0.34 m2·g−1. At that, calcein and crystal violet (CV) have been selected as representative organic molecules (Figure SI20), due to their different chemical properties and strong molar extinction coefficients. Calcein possess 4 carboxyl groups are negatively charged at pH 8.0 and can chelate Ca2+, while CV possesses terminal amine groups, which are positively charged at pH 8.0.
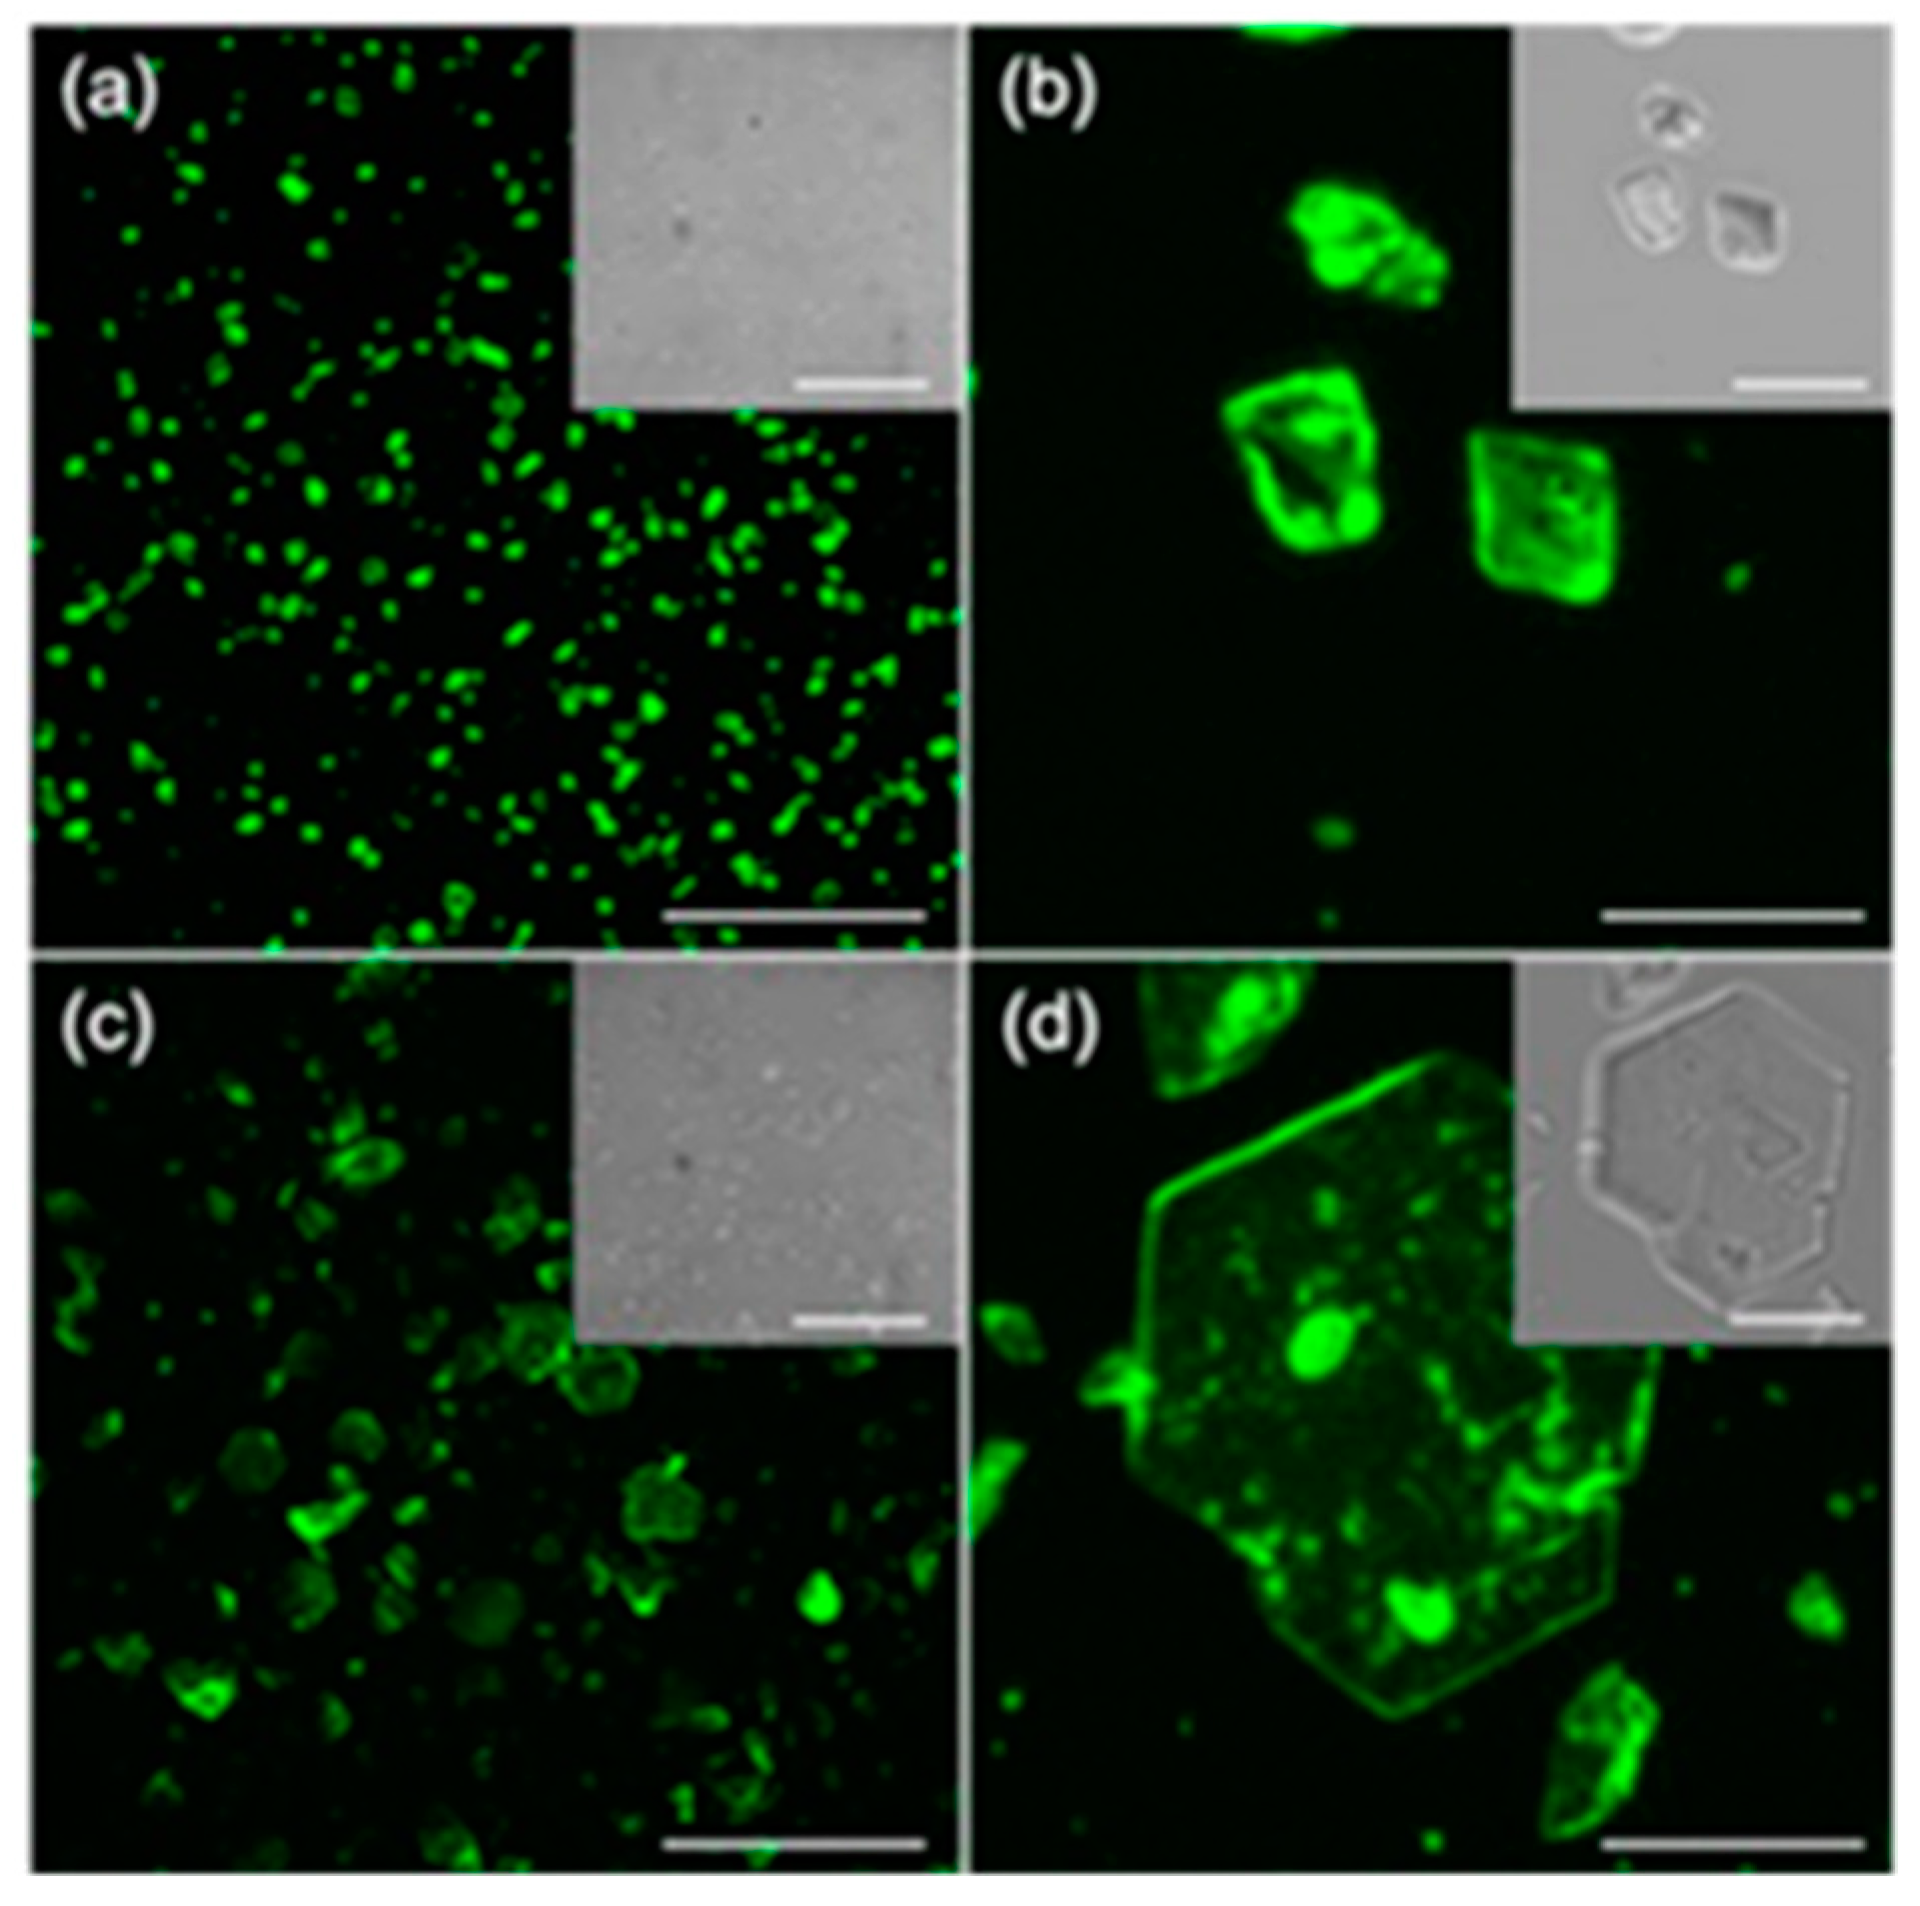
The actual adsorption of the selected dye molecules on the surface of the calcite crystals with different dominant crystal faces has been visualized by confocal microscopy. Figure 5 shows typical microphotographs of the plate-like and rhombohedral calcite crystals labeled with calcein. It can be seen that, within the limits of the resolution of the technique, calcein only partially covers the {00.1} faces, while a more intense fluorescence is observed on the {10.4} planes. The respective confocal images showing the consecutive crystal sections of the same motif are shown in Figure SI21.
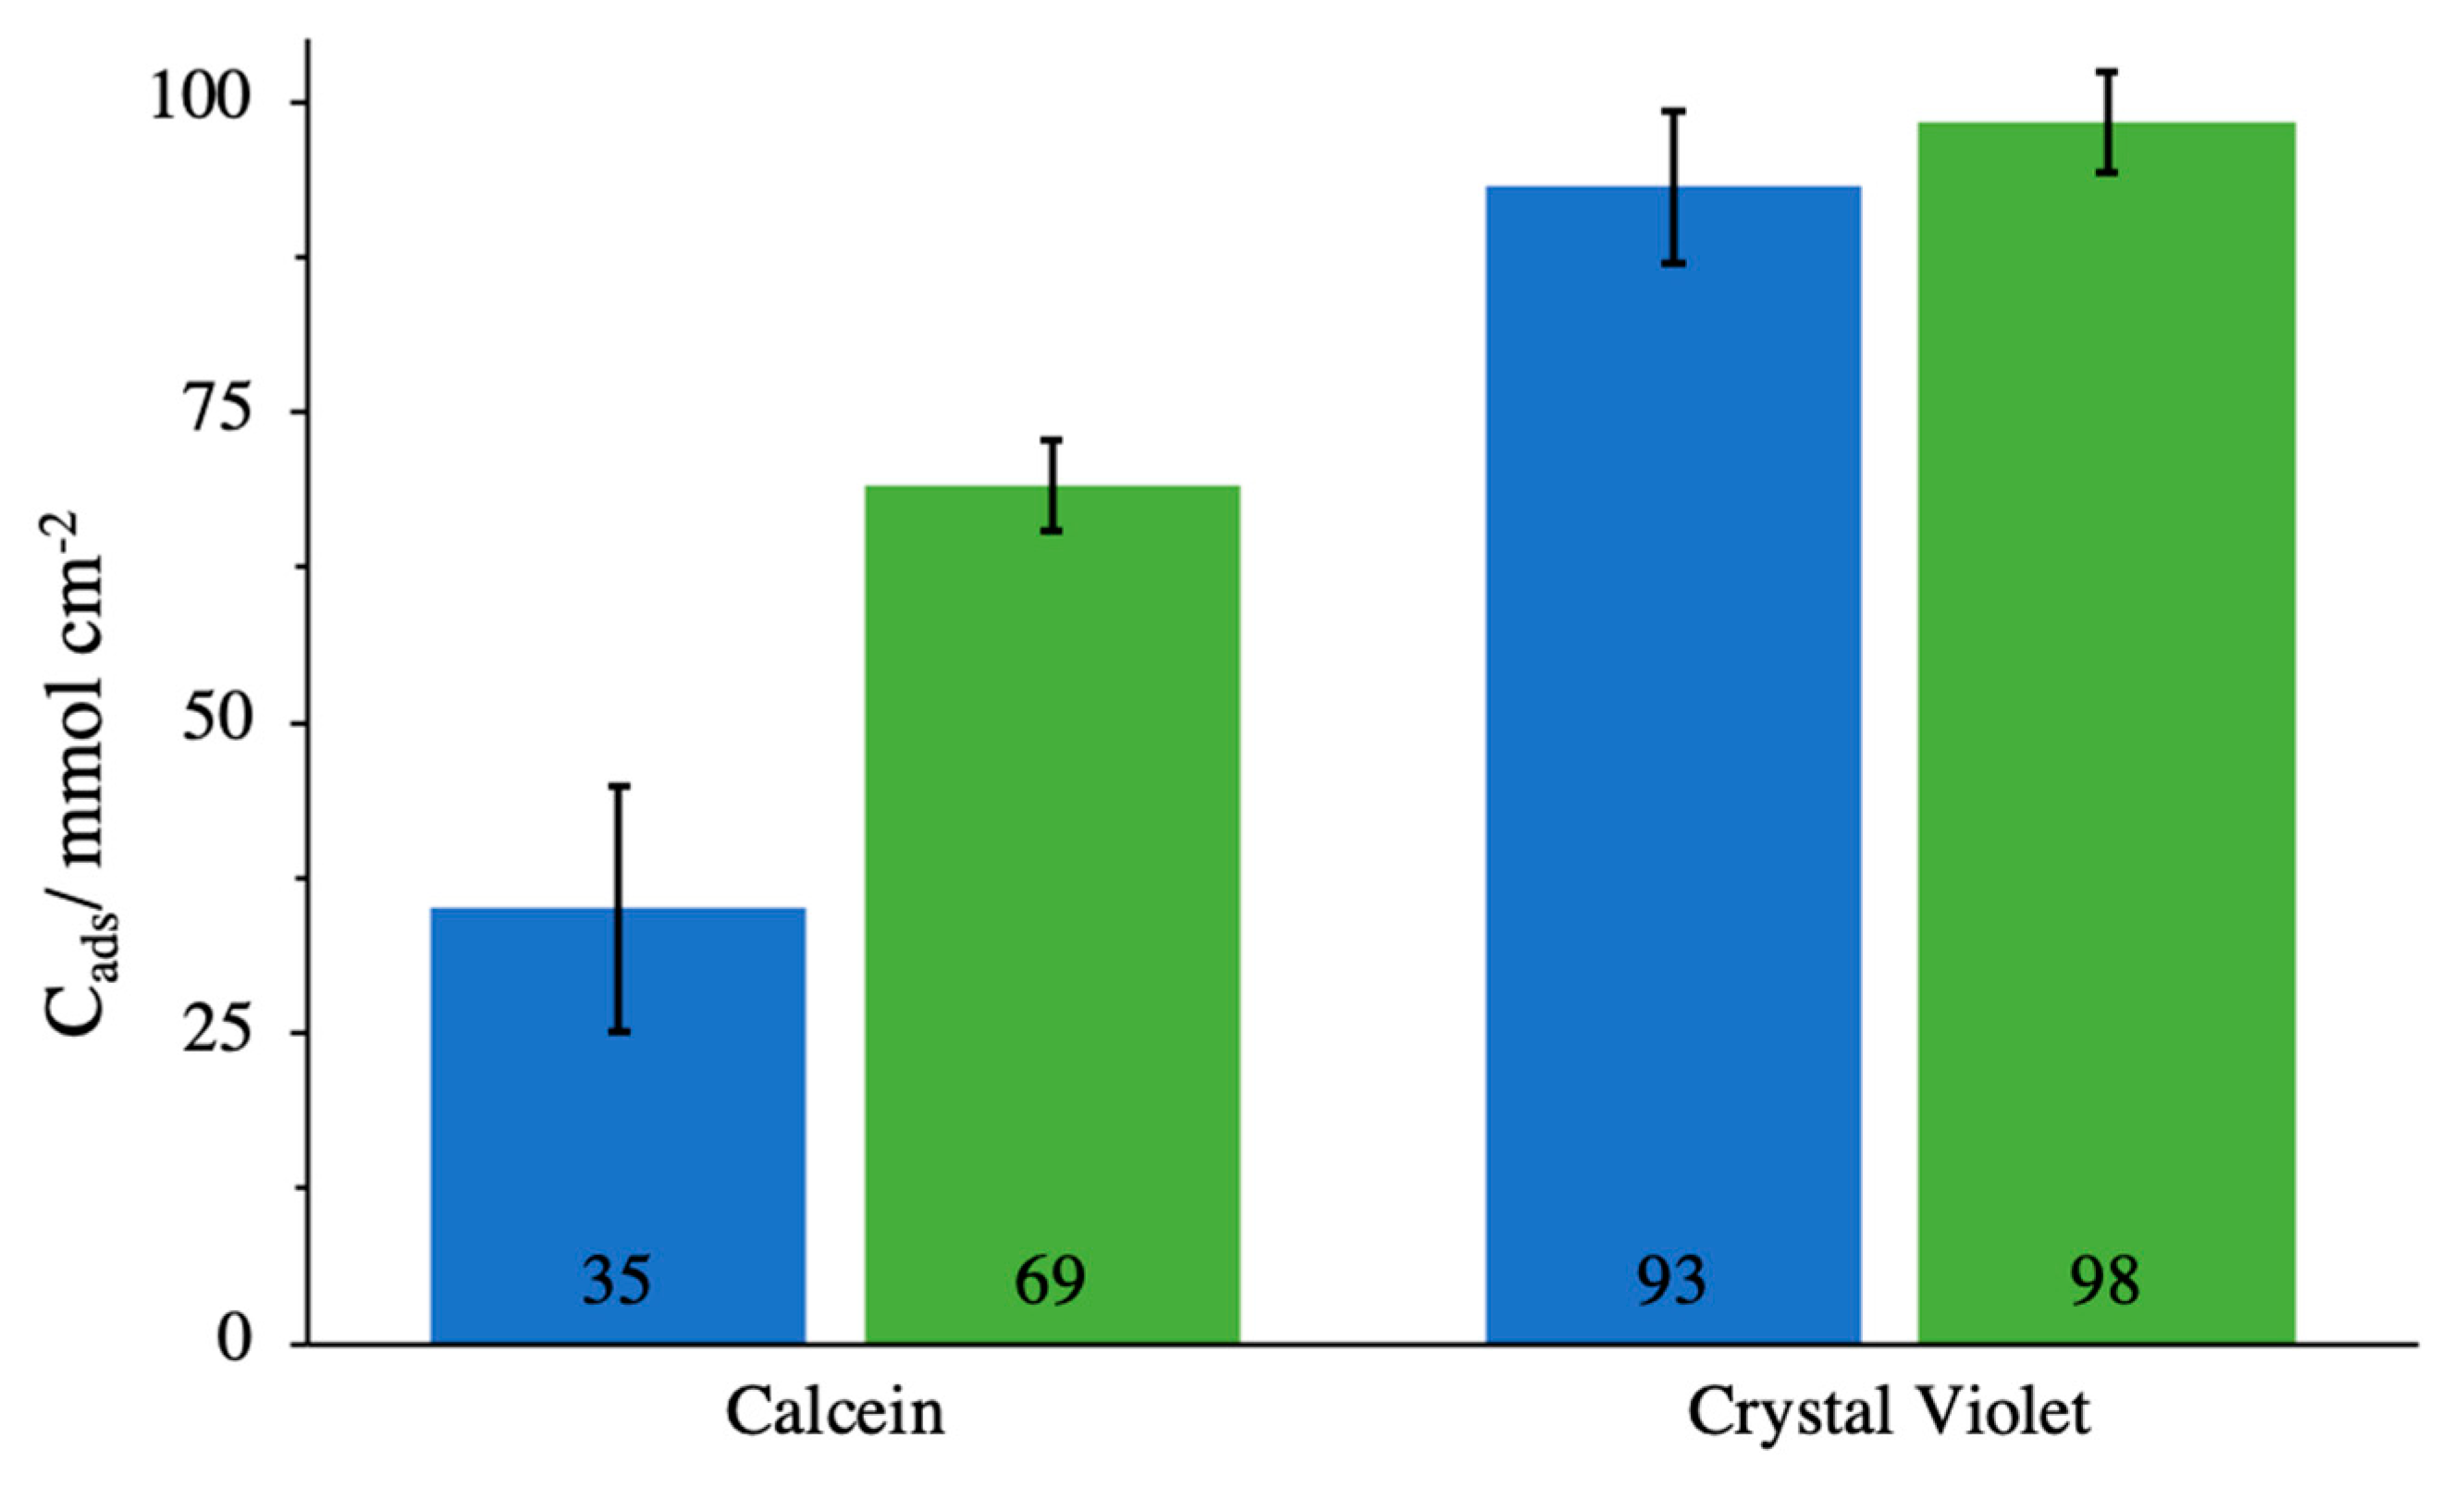
The adsorption properties of the calcite crystals of different morphologies have been determined by equilibrating them in solutions containing respective dye molecules for 24 h and by measuring the residual concentration after the crystals have been separated. No further adsorption was observed after 24 h. The kinetics of the adsorption have been determined as well (Figures SI22 and SI23), and it could be seen that the concentration of adsorbed CV is much higher in comparison to calcein and for both crystal morphologies. In order to additionally understand a mode of specific molecule/surface interactions, the experiments designed in a different way will be performed. The equilibrium concentration of dye adsorbed on the surfaces of different calcite crystals is presented in Figure 6, which shows stronger interactions of CV with both morphologies, while the adsorption of calcein on {10.4} faces is about twice as strong as the adsorption on {00.1} faces.
The obtained results and different abilities for adsorption can be ascribed either to the different structure of the crystal planes, or to the chemical nature of the adsorbate molecule. {00.1} calcite exposes alternating planes of Ca2+ and CO32− ions, with a preference for the latter [27], while the {10.4} face exposes both ions. The different chemical structure, and the net charge which exists at the conditions applied, are responsible for the observed different adsorption properties. Thus, positively charged CV is more likely to adsorb on calcite crystals, which typically possesses a net negative charge at wide range of solution composition and pH, as determined previously by the zeta potential measurements [15]. The interactions of calcein are significantly stronger with the {10.4} than with the {00.1} calcite surfaces, which is consistent with previous studies in which a Langmuir isotherm was proposed to describe the process [51]. On the other hand, it is known that the surface of {00.1} faces exposes the incorporated Li+ in the form of lithium carbonate islands [25,26], so the surface complexation of calcein molecules, which interact by their carboxylate groups with Ca2+, is limited or even suppressed. It follows that on the tabular {00.1} faces, the interaction with the calcein can predominantly happen on the steps and kinks exposed by the {00.1} faces. The interaction between the CV and the surface of calcite crystals is purely electrostatic, unlike calcein which requires the complexion of Ca2+, and is therefore less selective with regards to the structure and coordination of surfaces. Indeed, as shown in the Figure 6, the amount of adsorbed CV was similar for both calcite morphologies.

4. Conclusions

A procedure for the preparation of uniform and thin tabular {001} calcite was proposed. Tabular calcite, which exhibited triangular and hexagonal faces, was precipitated from the Li+-doped systems. In addition, the kinetics of formation of calcite crystals with a specific tabular morphology were demonstrated during the solution-mediated transformation process, in which predominantly vaterite initially appeared. With that, it was shown that higher Li+ concentrations caused a slower conversion to calcite. The tabular {001} calcite, optimal for investigation of adsorption, was obtained at moderate Li+ concentration, c(Li+) = 0.3 mol·dm−3: the crystals were relatively uniform in size and {00.1} predominated over the other faces.
The adsorption properties of the tabular {001} calcite was investigated by using two model organic dye molecules. The results of adsorption of calcein and crystal violet were compared to their adsorption on more common {10.4} calcite morphologies, in order to understand their interfacial dynamic and reactivity. It was found that the adsorption capability of the tabular {001} calcite is lower than the capability of pure {104} faced crystals and that the adsorption of the selected organic molecules depends on their functional groups and charge.
Since it is known that dissolved organic molecules play an important role in the regulation of crystal growth during the biomineralization process, which is a consequence of their adsorption and absorption on/in crystal face, this research contributes to understanding a mode and extent of interfacial interactions at different crystal planes.

Supplementary Materials

The following are available online at https://www.mdpi.com/2073-4352/9/1/16/s1, Figures SI1–SI6: FTIR spectra of the precipitates obtained in the system with different concentration of Li+; Table SI1: Assignment of IR bands in FTIR spectra in all systems during the transformation; Figure SI7: The progress curves of different precipitation systems; Figure SI8: SEM images of calcite samples obtained in differently agitated systems; Figures SI9–SI14: PXRD patterns of the precipitates obtained in the system with different concentrations of Li+; Table SI2: Assignment of peaks in PXRD patterns in all systems during the transformation; Figures SI15–SI16: Scanning electron micrographs of calcite samples obtained in the systems with different Li+ addition; SI17: Vaterite samples prepared in the systems with different Li+ addition; Figure SI18: Relative intensities of {00.1} with respect to the {10.4} calcite diffraction peaks and the aspect ratios, shown as a function of solution concentration of Li+; Figure SI19: Amount of lithium in precipitate separated from the solution after 10 minutes of sonication and after 5 days of aging; Figure SI20: Molecular structure of calcein and crystal violet; Figure SI21: Consecutive confocal images of calcite crystals labeled with calceine; Figure SI22: The kinetics of adsorption of calcein and crystal violet on rhombohedral calcite crystals; Figure SI23: The kinetics of adsorption of calcein and crystal violet on tabular calcite crystals.

Author Contributions

Conceptualization, D.K. and G.F.; investigation, N.M., G.M., F.S. and S.F.; formal analysis, N.M., G.M., F.S. and S.F.; writing–original draft preparation, G.F. and D.K.; writing–review and editing, D.K. and G.F.

Funding

This work has been supported in part (N.M. and D.K.) by Croatian Science Foundation under the project (IP-2013-11-5055) and from the European Social Fund under Call number HR.3.2.01 for the project “Networks for professional training of young scientists in interdisciplinary research of innovative surfaces and material”, MIPoMaT, (D.K.).

Conflicts of Interest

The authors declare no conflict of interest.

References

  1. Magnabosco, G.; Giosia, M.D.; Polishchuk, I.; Weber, E.; Fermani, S.; Bottoni, A.; Zerbetto, F.; Pelicci, P.G.; Pokroy, B.; Rapino, S.; et al. Calcite Single Crystals as Hosts for Atomic-Scale Entrapment and Slow Release of Drugs. Adv. Healthc. Mater. 2015, 4, 1510–1516. [Google Scholar] [CrossRef] [PubMed] [Green Version]
  2. Nudelman, F.; Sommerdijk, N.A. Biomineralization as an inspiration for materials chemistry. Angew. Chem. Int. Ed. 2012, 51, 6582–6596. [Google Scholar] [CrossRef] [PubMed]
  3. Green, D.C.; Ihli, J.; Thornton, P.D.; Holden, M.A.; Marzec, B.; Kim, Y.Y.; Kulak, A.N.; Levenstein, M.A.; Tang, C.; Lynch, C.; et al. 3D visualization of additive occlusion and tunable full-spectrum fluorescence in calcite. Nat. Commun. 2016, 7, 13524. [Google Scholar] [CrossRef] [PubMed] [Green Version]
  4. Weiner, S.; Addadi, L. Crystallization pathways in biomineralization. Annu. Rev. Mater. Res. 2011, 41, 21–40. [Google Scholar] [CrossRef]
  5. Addadi, L.; Weiner, S. Interactions between acidic proteins and crystals: Stereochemical requirements in biomineralization. Proc. Natl. Acad. Sci. USA 1985, 82, 4110–4114. [Google Scholar] [CrossRef]
  6. Magnabosco, G.; Polishchuk, I.; Erez, J.; Fermani, S.; Pokroy, B.; Falini, G. Insights on the interaction of calcein with calcium carbonate and its implications in biomineralization studies. CrystEngComm 2018, 20, 4221–4224. [Google Scholar] [CrossRef]
  7. Ukrainczyk, M.; Stelling, J.; Vučak, M.; Neumann, T. Influence of etidronic acid and tartaric acid on the growth of different calcite morphologies. J. Cryst. Growth 2013, 369, 21–31. [Google Scholar] [CrossRef]
  8. Wang, L.; Ruiz-Agudo, E.; Putnis, C.V.; Putnis, A. Direct observations of the modification of calcite growth morphology by Li+through selectively stabilizing an energetically unfavourable face. CrystEngComm 2011, 13, 3962–3966. [Google Scholar] [CrossRef]
  9. Njegić-Džakula, B.; Falini, G.; Brečević, L.; Skoko, Ž.; Kralj, D. Effects of initial supersaturation on spontaneous precipitation of calcium carbonate in the presence of charged poly-l-amino acids. J. Colloid Interface Sci. 2010, 343, 553–563. [Google Scholar] [CrossRef]
  10. Lowenstam, H.A.; Weiner, S. On Biomineralization; Oxford University Press: Oxford, UK, 1989; ISBN 0195364198. [Google Scholar]
  11. Falini, G.; Fermani, S.; Goffredo, S. Coral biomineralization: A focus on intra-skeletal organic matrix and calcification. Semin. Cell Dev. Biol. 2015, 46, 17–26. [Google Scholar] [CrossRef]
  12. Aizenberg, J.; Tkachenko, A.; Weiner, S.; Addadi, L.; Hendler, G. Calcitic microlenses as part of the photoreceptor system in brittlestars. Nature 2001, 412, 819–822. [Google Scholar] [CrossRef] [PubMed]
  13. Addadi, L.; Raz, S.; Weiner, S. Taking advantage of disorder: Amorphous calcium carbonate and its roles in biomineralization. Adv. Mater. 2003, 15, 959–970. [Google Scholar] [CrossRef]
  14. Ukrainczyk, M.; Kontrec, J.; Kralj, D. Precipitation of different calcite crystal morphologies in the presence of sodium stearate. J. Colloid Interface Sci. 2009, 329, 89–96. [Google Scholar] [CrossRef] [PubMed]
  15. Njegić-Džakula, B.; Brečević, L.; Falini, G.; Kralj, D. Calcite Crystal Growth Kinetics in the Presence of Charged Synthetic Polypeptides. Cryst. Growth Des. 2009, 9, 2425–2434. [Google Scholar] [CrossRef]
  16. Njegić-Džakula, B.; Brečević, L.; Falini, G.; Kralj, D. Kinetic Approach to Biomineralization: Interactions of Synthetic Polypeptides with Calcium Carbonate Polymorphs. Croat. Chem. Acta 2011, 84, 301–314. [Google Scholar] [CrossRef]
  17. Magnabosco, G.; Polishchuk, I.; Pokroy, B.; Rosenberg, R.; Cölfen, H.; Falini, G. Synthesis of calcium carbonate in trace water environments. Chem. Commun. 2017, 53, 4811–4814. [Google Scholar] [CrossRef] [PubMed] [Green Version]
  18. Davis, K.J.; Dove, P.M.; Wasylenki, L.E.; De Yoreo, J.J. Morphological consequences of differential Mg2+incorporation at structurally distinct steps on calcite. Am. Mineral. 2004, 89, 714–720. [Google Scholar] [CrossRef]
  19. Rajam, S.; Mann, S. Selective stabilization of the (001) face of calcite in the presence of lithium. J. Chem. Soc. Chem. Commun. 1990, 0, 1789–1791. [Google Scholar] [CrossRef]
  20. Song, R.Q.; Cölfen, H. Additive controlled crystallization. CrystEngComm 2011, 13, 1249–1276. [Google Scholar] [CrossRef]
  21. Titiloye, J.O.; Parker, S.C.; Osguthorpe, D.J.; Mann, S. Predicting the influence of growth additives on the morphology of ionic crystals. J. Chem. Soc. Chem. Commun. 1991, 1494–1496. [Google Scholar] [CrossRef]
  22. Kitano, Y. The Behavior of Various Inorganic Ions in the Separation of Calcium Carbonate from a Bicarbonate Solution. Bull. Chem. Soc. Jpn. 1962, 35, 1973–1980. [Google Scholar] [CrossRef] [Green Version]
  23. Bruno, M.; Massaro, F.R.; Prencipe, M.; Aquilano, D. Surface reconstructions and relaxation effects in a centre-symmetrical crystal: The {00.1} form of calcite (CaCO3). CrystEngComm 2010, 12, 3626–3633. [Google Scholar] [CrossRef]
  24. Pastero, L.; Costa, E.; Bruno, M.; Rubbo, M.; Sgualdino, G.; Aquilano, D. Morphology of calcite (CaCO3) crystals growing from aqueous solutions in the presence of Li+ ions. Surface behavior of the {0001} form. Cryst. Growth Des. 2004, 4, 485–490. [Google Scholar] [CrossRef]
  25. Pastero, L.; Aquilano, D. CaCO3 (Calcite)/Li2CO3 (zabuyelite) anomalous mixed crystals. Sector zoning and growth mechanisms. Cryst. Growth Des. 2008, 8, 3451–3460. [Google Scholar] [CrossRef]
  26. Massaro, F.R.; Pastero, L.; Costa, E.; Sgualdino, G.; Aquilano, D. Single and twinned Li2CO3 crystals (zabuyelite) epitaxially grown on {0001} and {101̄4} forms of CaCO3 (calcite) crystals. Cryst. Growth Des. 2008, 8, 2041–2046. [Google Scholar] [CrossRef]
  27. Aquilano, D.; Pastero, L. Anomalous mixed crystals: A peculiar case of adsorption/absorption. Cryst. Res. Technol. 2013, 48, 819–839. [Google Scholar] [CrossRef]
  28. Pastero, L.; Aquilano, D.; Costa, E.; Rubbo, M. 2D epitaxy of lithium carbonate inducing growth mechanism transitions on {0 0 0 1}-K and {0 1 1̄ 8}-S forms of calcite crystals. J. Cryst. Growth 2005, 275, 1625–1630. [Google Scholar] [CrossRef]
  29. Titiloye, J.O.; Parker, S.C.; Mann, S. Atomistic simulation of calcite surfaces and the influence of growth additives on their morphology. J. Cryst. Growth 1993, 131, 533–545. [Google Scholar] [CrossRef]
  30. Bohr, J.; Wogelius, R.A.; Morris, P.M.; Stipp, S.L.S. Thickness and structure of the water film deposited from vapour on calcite surfaces. Geochim. Cosmochim. Acta 2010, 74, 5985–5999. [Google Scholar] [CrossRef]
  31. Sand, K.K.; Yang, M.; Makovicky, E.; Cooke, D.J.; Hassenkam, T.; Bechgaard, K.; Stipp, S.L.S. Binding of Ethanol on Calcite: The Role of the OH Bond and Its Relevance to Biomineralization. Langmuir 2010, 26, 15239–15247. [Google Scholar] [CrossRef] [PubMed]
  32. Bovet, N.; Yang, M.; Javadi, M.S.; Stipp, S.L.S. Interaction of alcohols with the calcite surface. Phys. Chem. Chem. Phys. 2015, 17, 3490–3496. [Google Scholar] [CrossRef] [PubMed]
  33. Aschauer, U.; Spagnoli, D.; Bowen, P.; Parker, S.C. Growth modification of seeded calcite using carboxylic acids: Atomistic simulations. J. Colloid Interface Sci. 2010, 346, 226–231. [Google Scholar] [CrossRef] [PubMed] [Green Version]
  34. Mureşan, L.; Sinha, P.; Maroni, P.; Borkovec, M. Adsorption and surface-induced precipitation of poly(acrylic acid) on calcite revealed with atomic force microscopy. Colloids Surf. A Physicochem. Eng. Asp. 2011, 390, 225–230. [Google Scholar] [CrossRef]
  35. Hazen, R.M.; Filley, T.R.; Goodfriend, G.A. Selective adsorption of l- and d-amino acids on calcite: Implications for biochemical homochirality. Proc. Natl. Acad. Sci. USA 2001, 98, 5487–5490. [Google Scholar] [CrossRef] [PubMed]
  36. Orme, C.A.; Noy, A.; Wierzbicki, A.; Mcbride, M.T.; Grantham, M.; Teng, H.H.; Dove, P.M.; Deyoreo, J.J. Formation of chiral morphologies through selective binding of amino acids to calcite surface steps. Nature 2001, 411, 775–779. [Google Scholar] [CrossRef] [PubMed]
  37. Wierzbicki, A.; Sikes, C.S.; Madura, J.D.; Drake, B. Atomic force microscopy and molecular modeling of protein and peptide binding to calcite. Calcif. Tissue Int. 1994, 54, 133–141. [Google Scholar] [CrossRef]
  38. Sonnenberg, L.; Luo, Y.; Schlaad, H.; Seitz, M.; Cölfen, H.; Gaub, H.E. Quantitative single molecule measurements on the interaction forces of poly(l-glutamic acid) with calcite crystals. J. Am. Chem. Soc. 2007, 129, 15364–15371. [Google Scholar] [CrossRef] [PubMed]
  39. Yang, M.; Mark Rodger, P.; Harding, J.H.; Stipp, S.L.S. Molecular dynamics simulations of peptides on calcite surface. Mol. Simul. 2009, 35, 547–553. [Google Scholar] [CrossRef] [Green Version]
  40. Freeman, C.L.; Harding, J.H.; Quigley, D.; Rodger, P.M. Simulations of ovocleidin-17 binding to calcite surfaces and its implications for eggshell formation. J. Phys. Chem. C 2011, 115, 8175–8183. [Google Scholar] [CrossRef]
  41. Yang, M.; Stipp, S.L.S.; Harding, J. Biological control on calcite crystallization by polysaccharides. Cryst. Growth Des. 2008, 8, 4066–4074. [Google Scholar] [CrossRef]
  42. Dalas, E. The effect of ultrasonic field on calcium carbonate scale formation. J. Cryst. Growth 2001, 222, 287–292. [Google Scholar] [CrossRef]
  43. Nishida, I. Precipitation of calcium carbonate by ultrasonic irradiation. Ultrason. Sonochem. 2004, 11, 423–428. [Google Scholar] [CrossRef] [PubMed]
  44. Berdonosov, S.S.; Znamenskaya, I.V.; Melikhov, I.V. Mechanism of the vaterite-to-calcite phase transition under sonication. Inorg. Mater. 2005, 41, 1308–1312. [Google Scholar] [CrossRef]
  45. Njegić Džakula, B.; Kontrec, J.; Ukrainczyk, M.; Sviben, S.; Kralj, D. Polymorphic composition and morphology of calcium carbonate as a function of ultrasonic irradiation. Cryst. Res. Technol. 2014, 49, 244–256. [Google Scholar] [CrossRef]
  46. Luo, J.; Kong, F.; Ma, X. Role of Aspartic Acid in the Synthesis of Spherical Vaterite by the Ca(OH)2–CO2 Reaction. Cryst. Growth Des. 2016, 16, 728–736. [Google Scholar] [CrossRef]
  47. Arvidson, R.S.; Ertan, I.E.; Amonette, J.E.; Luttge, A. Variation in calcite dissolution rates: A fundamental problem? Geochim. Cosmochim. Acta 2003, 67, 1623–1634. [Google Scholar] [CrossRef]
  48. De Giudici, G. Surface control vs. diffusion control during calcite dissolution: Dependence of step-edge velocity upon solution pH. Am. Mineral. 2002, 87, 1279–1285. [Google Scholar] [CrossRef]
  49. Beck, R.; Andreassen, J.P. Spherulitic growth of calcium carbonate. Cryst. Growth Des. 2010, 10, 2934–2947. [Google Scholar] [CrossRef]
  50. Andreassen, J.P. Formation mechanism and morphology in precipitation of vaterite—Nano-aggregation or crystal growth? J. Cryst. Growth 2005, 274, 256–264. [Google Scholar] [CrossRef]
  51. Atun, G.; Acar, E.T. Competitive adsorption of basic dyes onto calcite in single and binary component systems. Sep. Sci. Technol. 2010, 45, 1471–1481. [Google Scholar] [CrossRef]
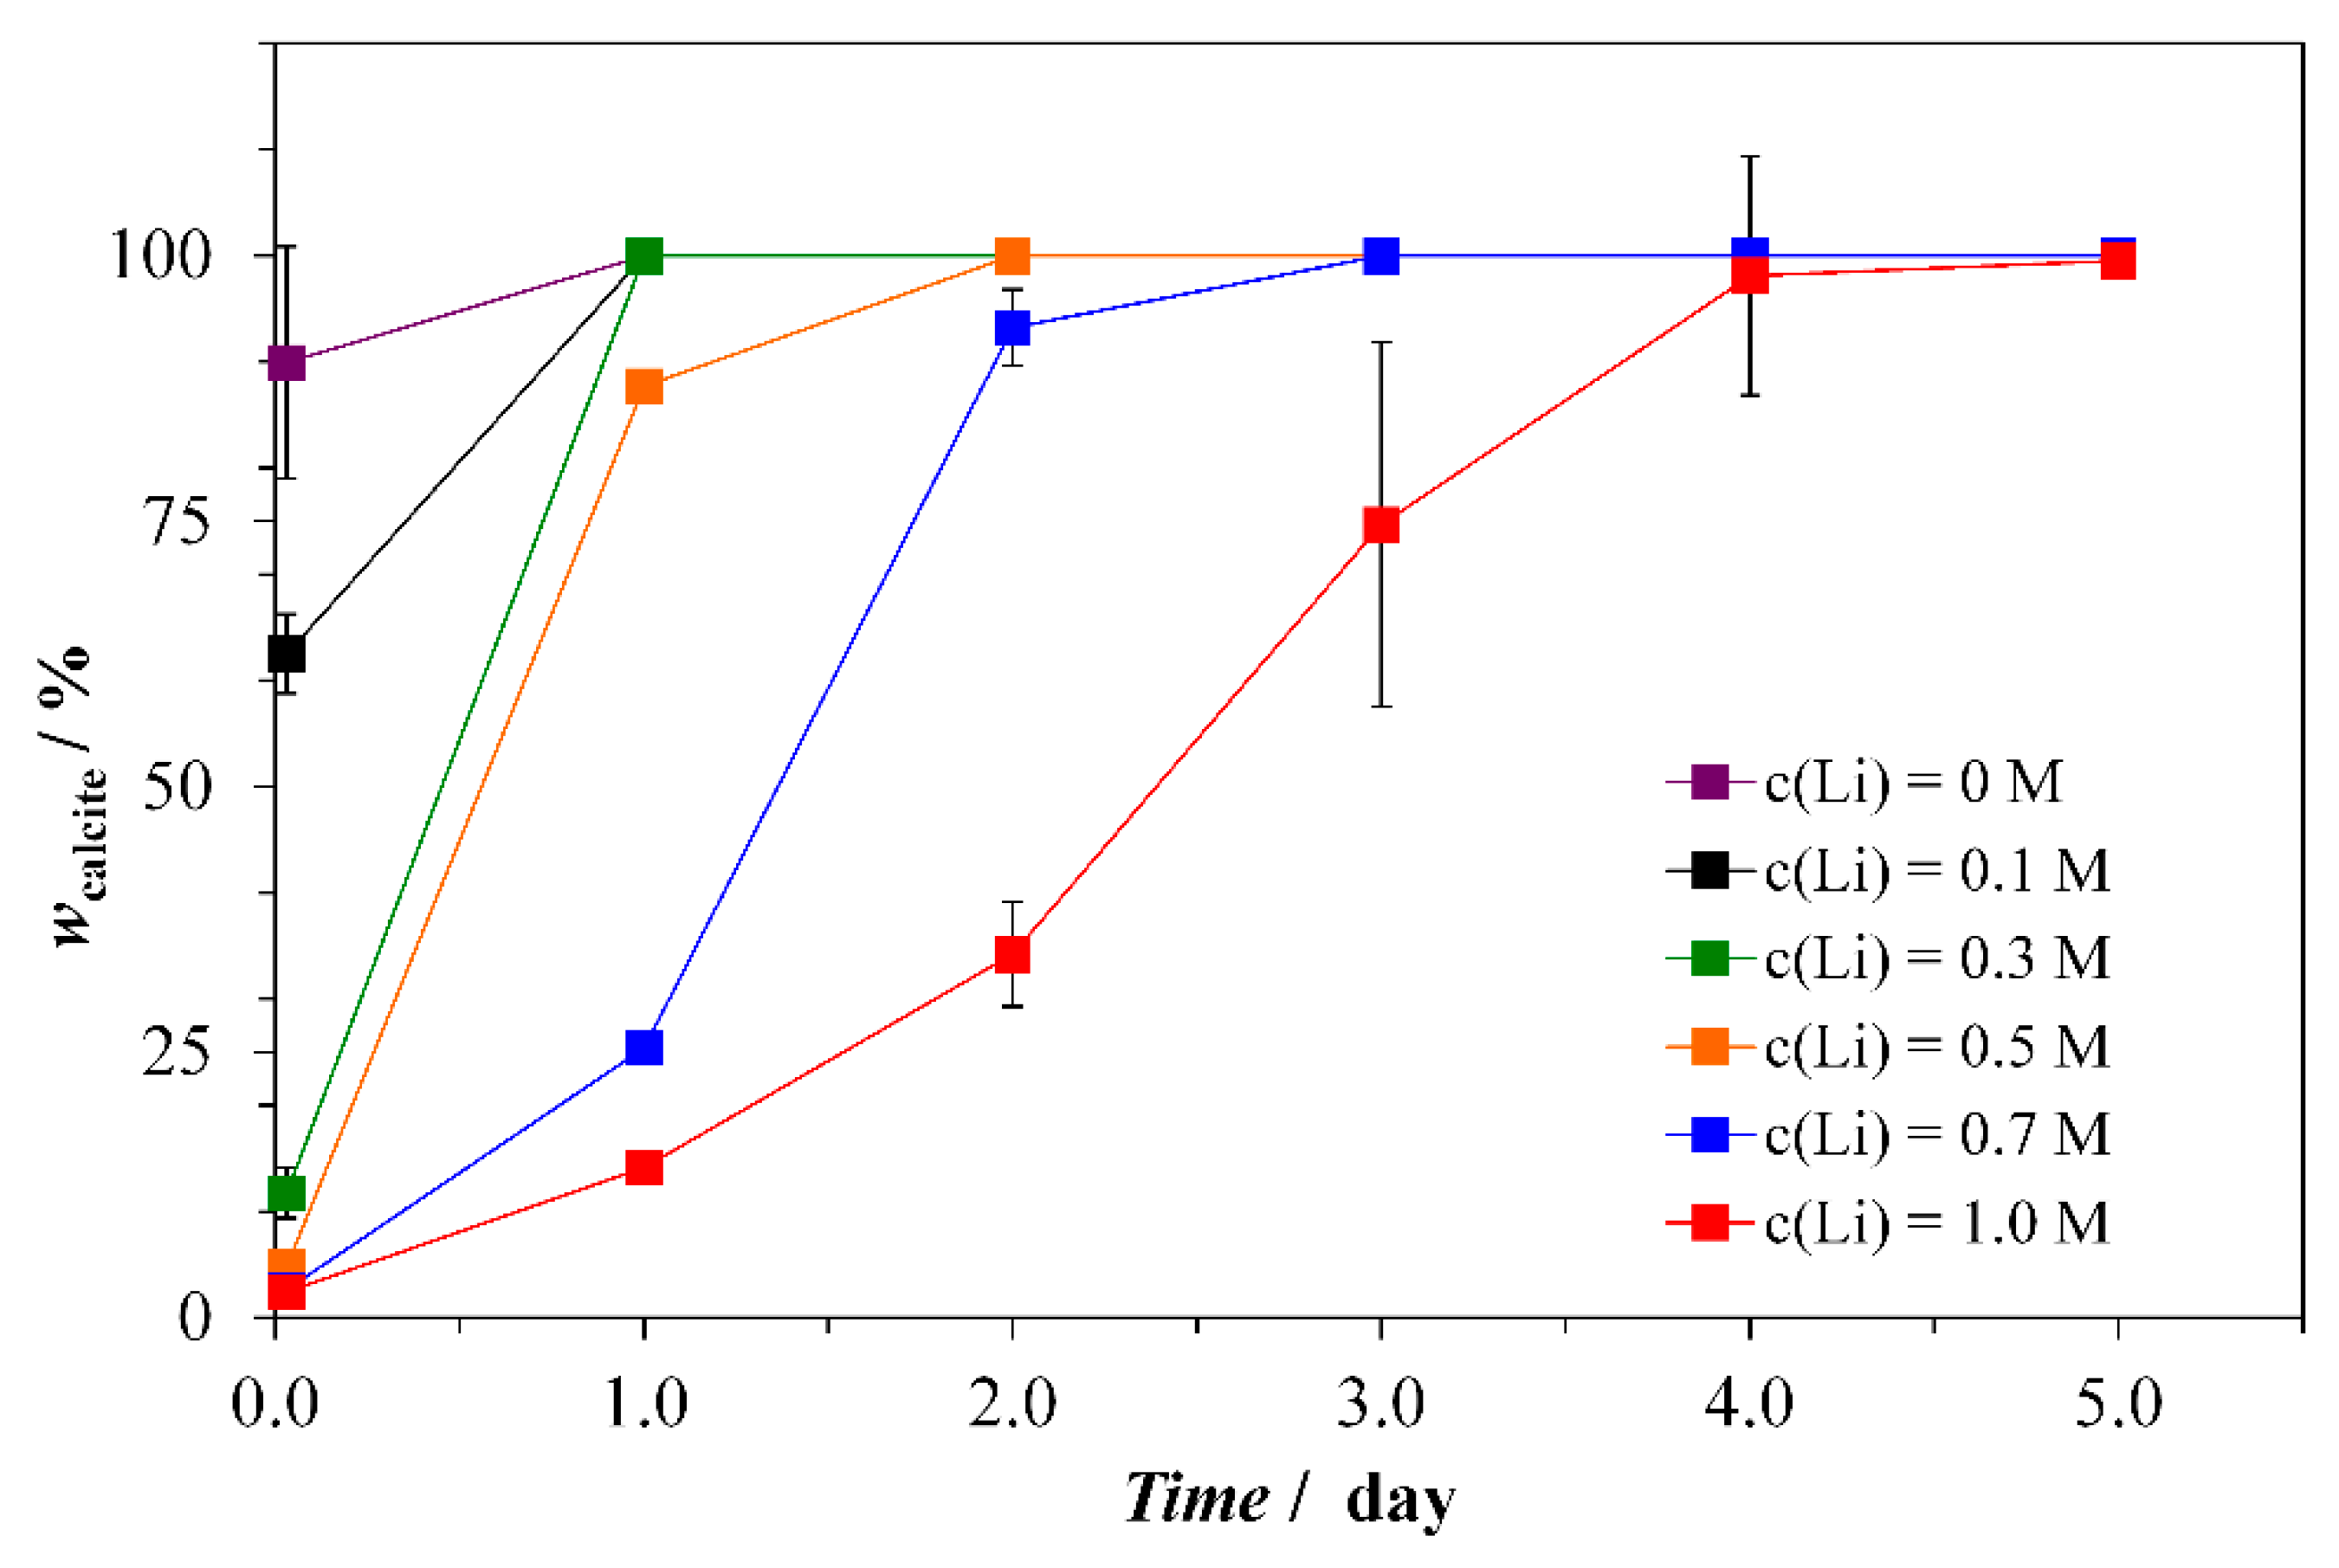
Figure 1. Content of calcite in a mixture with vaterite during the transformation process in the precipitation systems, ci(CaCl2) = ci(NaHCO3) = 0.1 mol·dm–3, with different initial concentrations of Li+. In the reference system, c(Li+) = 0. The initial concentrations of Li+ are indicated: M correspond to mol·dm−3.
Crystals 09 00016 g001
Figure 2. X-ray powder diffraction patterns of the precipitates obtained in the precipitation systems, ci(CaCl2) = ci(NaHCO3) = 0.1 mol·dm–3, after 10 min (top) and 5 days of aging (bottom), in the presence of Li+ at the concentration of (a) 0.0 mol·dm–3, (b) 0.1 mol·dm–3, (c) 0.3 mol·dm–3, (d) 0.5 mol·dm–3, (e) 0.7 mol·dm–3 or (f) 1.0 mol·dm–3. The diffraction patterns were indexed accordingly to the PDF 00-005-0586 for calcite and PDF 00-033-0268 for vaterite PDF. In all systems only calcite and vaterite have been detected.
Crystals 09 00016 g002
Figure 3. Scanning electron images of calcium carbonate samples obtained after 5 days of aging in the reference system, c(Li+) = 0 (a) and in the systems with c(Li+) = 0.1 mol·dm–3 (b), c(Li+) = 0.3 mol·dm–3 (c), c(Li+) = 0.5 mol·dm–3 (d), c(Li+) = 0.7 mol·dm–3 (e) and c(Li+) = 1.0 mol·dm–3 (f). The inset shows the precipitates obtained after 10 min of ultrasonic irradiation at P = 40 W and at room temperature. Scale bars: 20 μm.
Crystals 09 00016 g003
Figure 4. The content of Li+ incorporated into the crystals during the transformation process in the precipitation systems, ci(CaCl2) = ci(NaHCO3) = 0.1 mol·dm−3, with different initial concentration of Li+. The initial concentrations of Li+ in solution are indicated: M correspond to mol·dm−3.
Crystals 09 00016 g004
Figure 5. Confocal microscopy images of calcite crystals with adsorbed calcein. (a, b) {10.4} calcite, (c, d) {00.1} calcite. The insets show the corresponding transmission optical microscopy images. The scale bars are 50 μm (a,c) and 10 μm (b,d).
Crystals 09 00016 g005
Figure 6. The concentration of respective dye molecules adsorbed after 24 h at the surface of {00.1} (blue) or {104} (green) calcite crystals.
Crystals 09 00016 g006
Table 1. Properties of the precipitate and the calcite crystal obtained after initial sonication and 5 days of aging in mother solutions, containing different concentrations of Li+ ions. In the system with c(Li+) = 1.0 mol·dm−3, about 2 wt % of vaterite has been obtained as well (d ≈ 3 μm).
c(Li+)/mol·dm−3w(calcite)/wt %Particle Size */μmAspect Ratio #I(10.4)/I(00.1)w(Li)/wt %
01009-680
0.110011/2711:1
27:1
390.004 ± 0.00017
0.310012/3212:1
32:1
250.008 ± 0.00011
0.510023/4323:1
43:1
300.012 ± 0.00015
0.710023/4023:1
40:1
230.015 ± 0.00023
1.098 ± 0.05530/4830:1
48:1
210.049 ± 0.00037
* Two values indicate two different population of crystals. # The aspect ratio indicates the ratio between the longest axis of (00.1) planes and the thickness of the crystals: values of two different populations are shown.