Theoretical and Experimental Investigations into Novel Oxynitride Discovery in the GaN-TiO2 System at High Pressure

 ,
,
Abstract
1. Introduction
2. Results
2.1. Theoretical Predictions Using USPEX
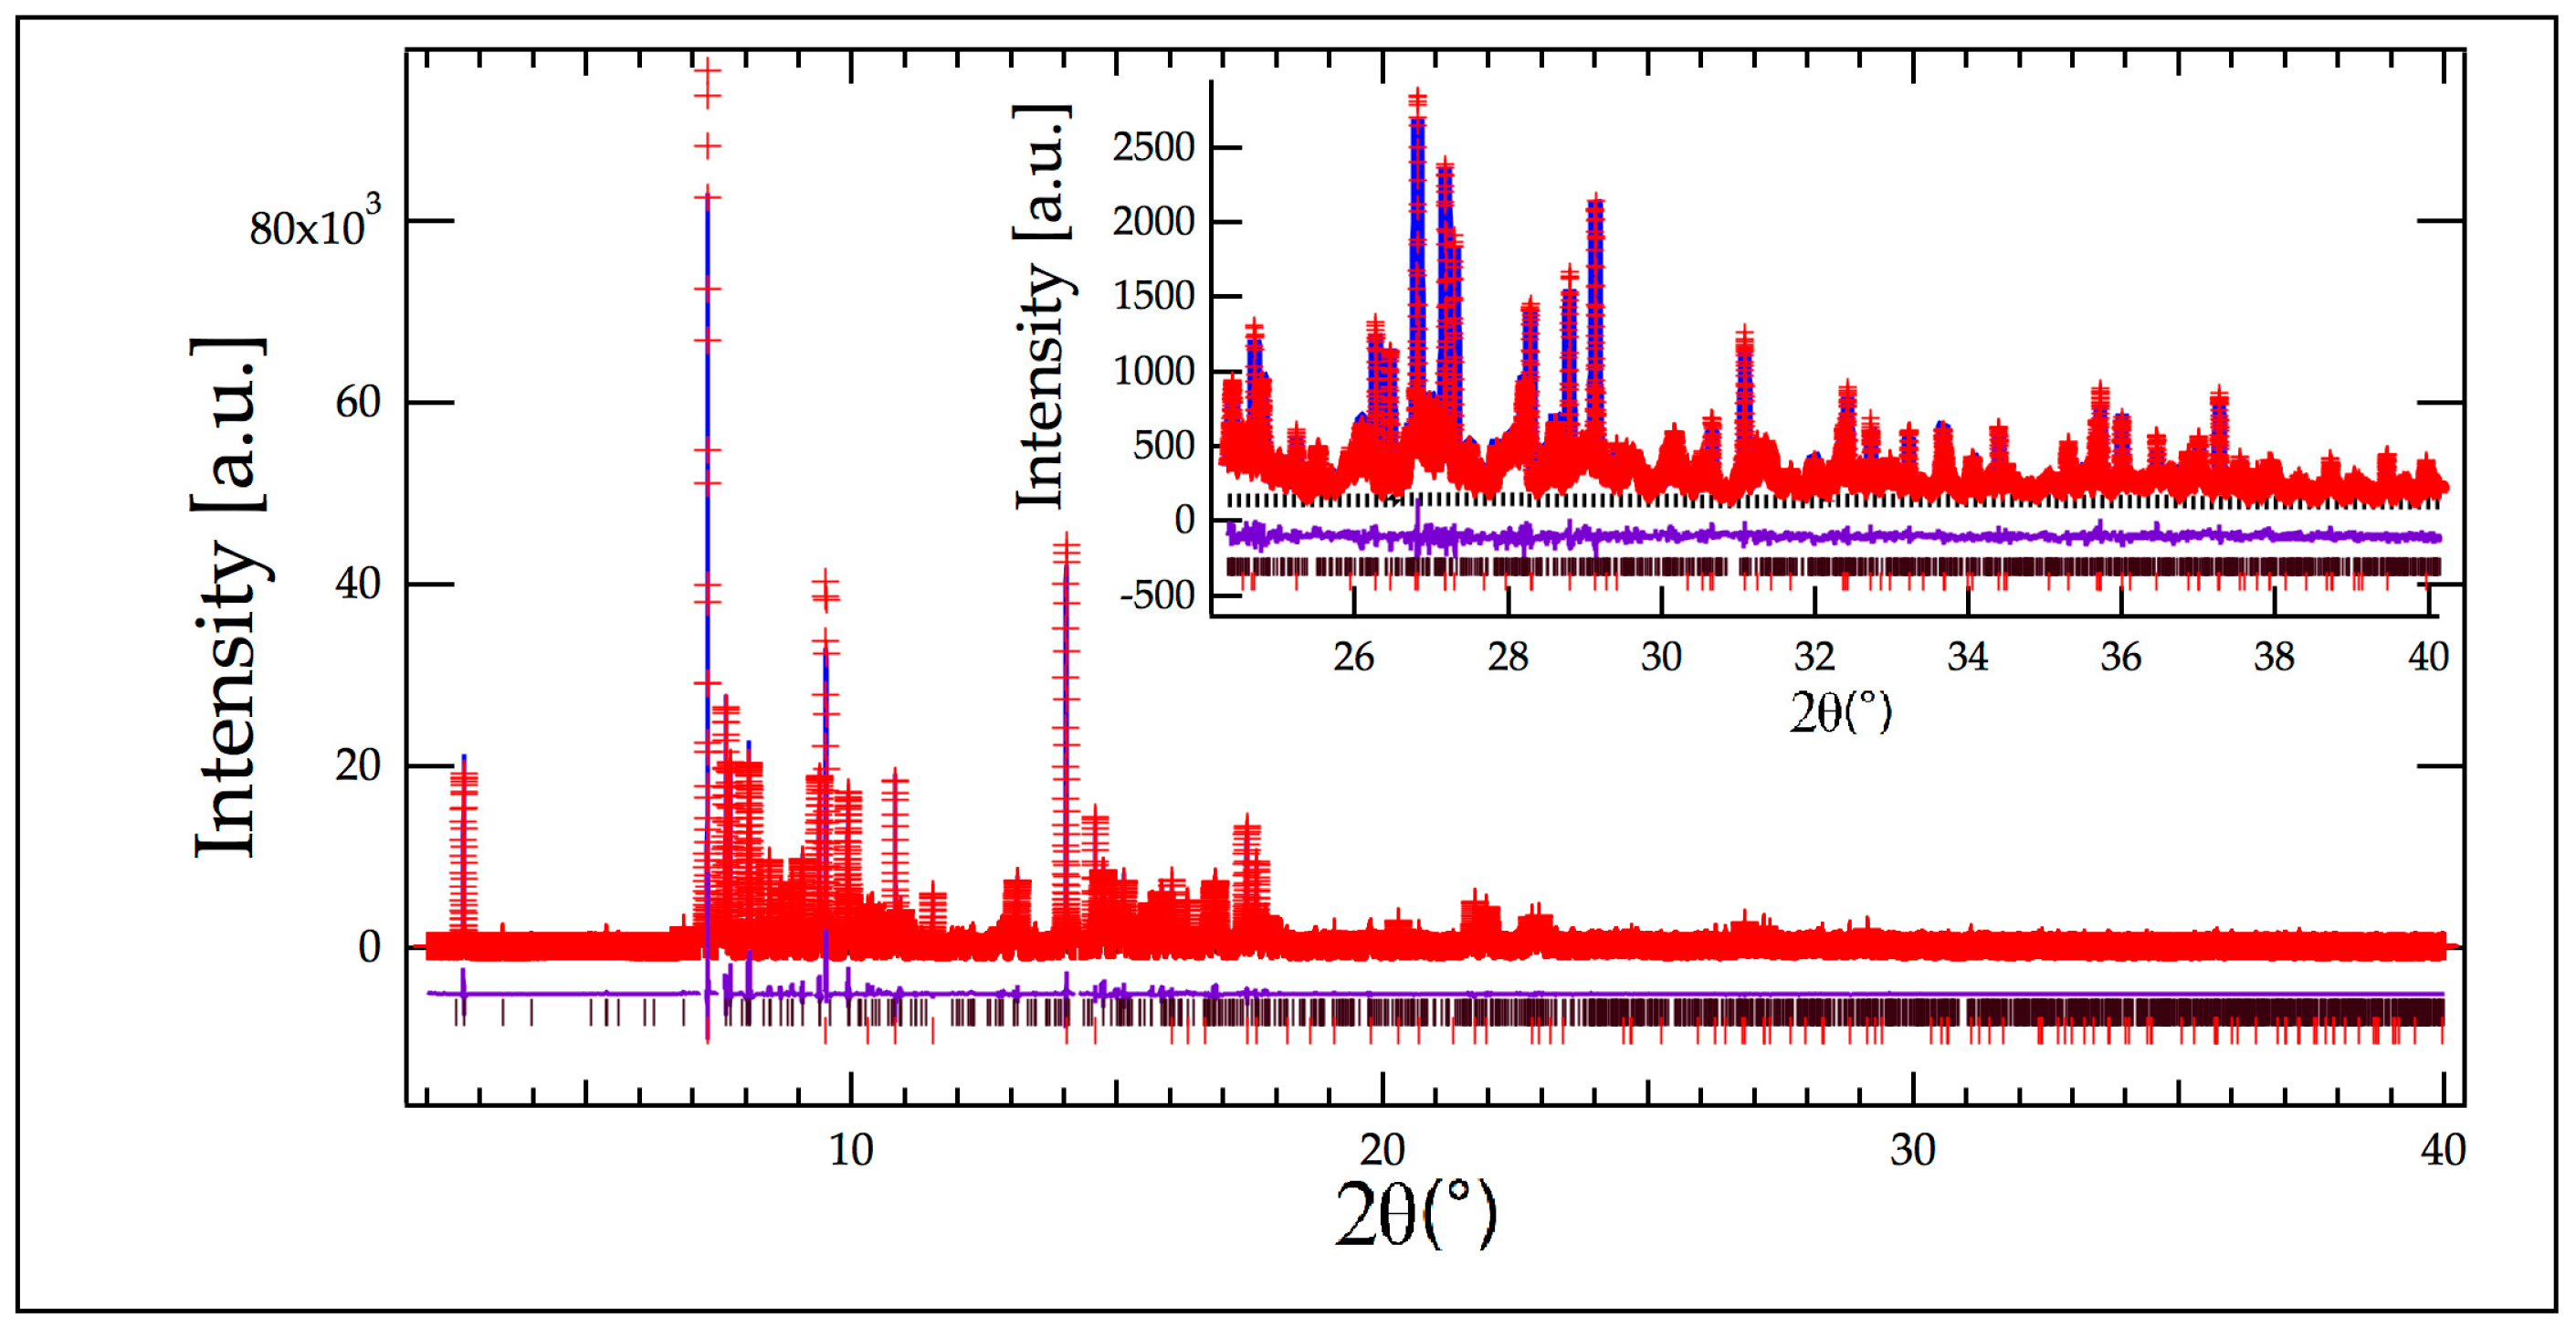
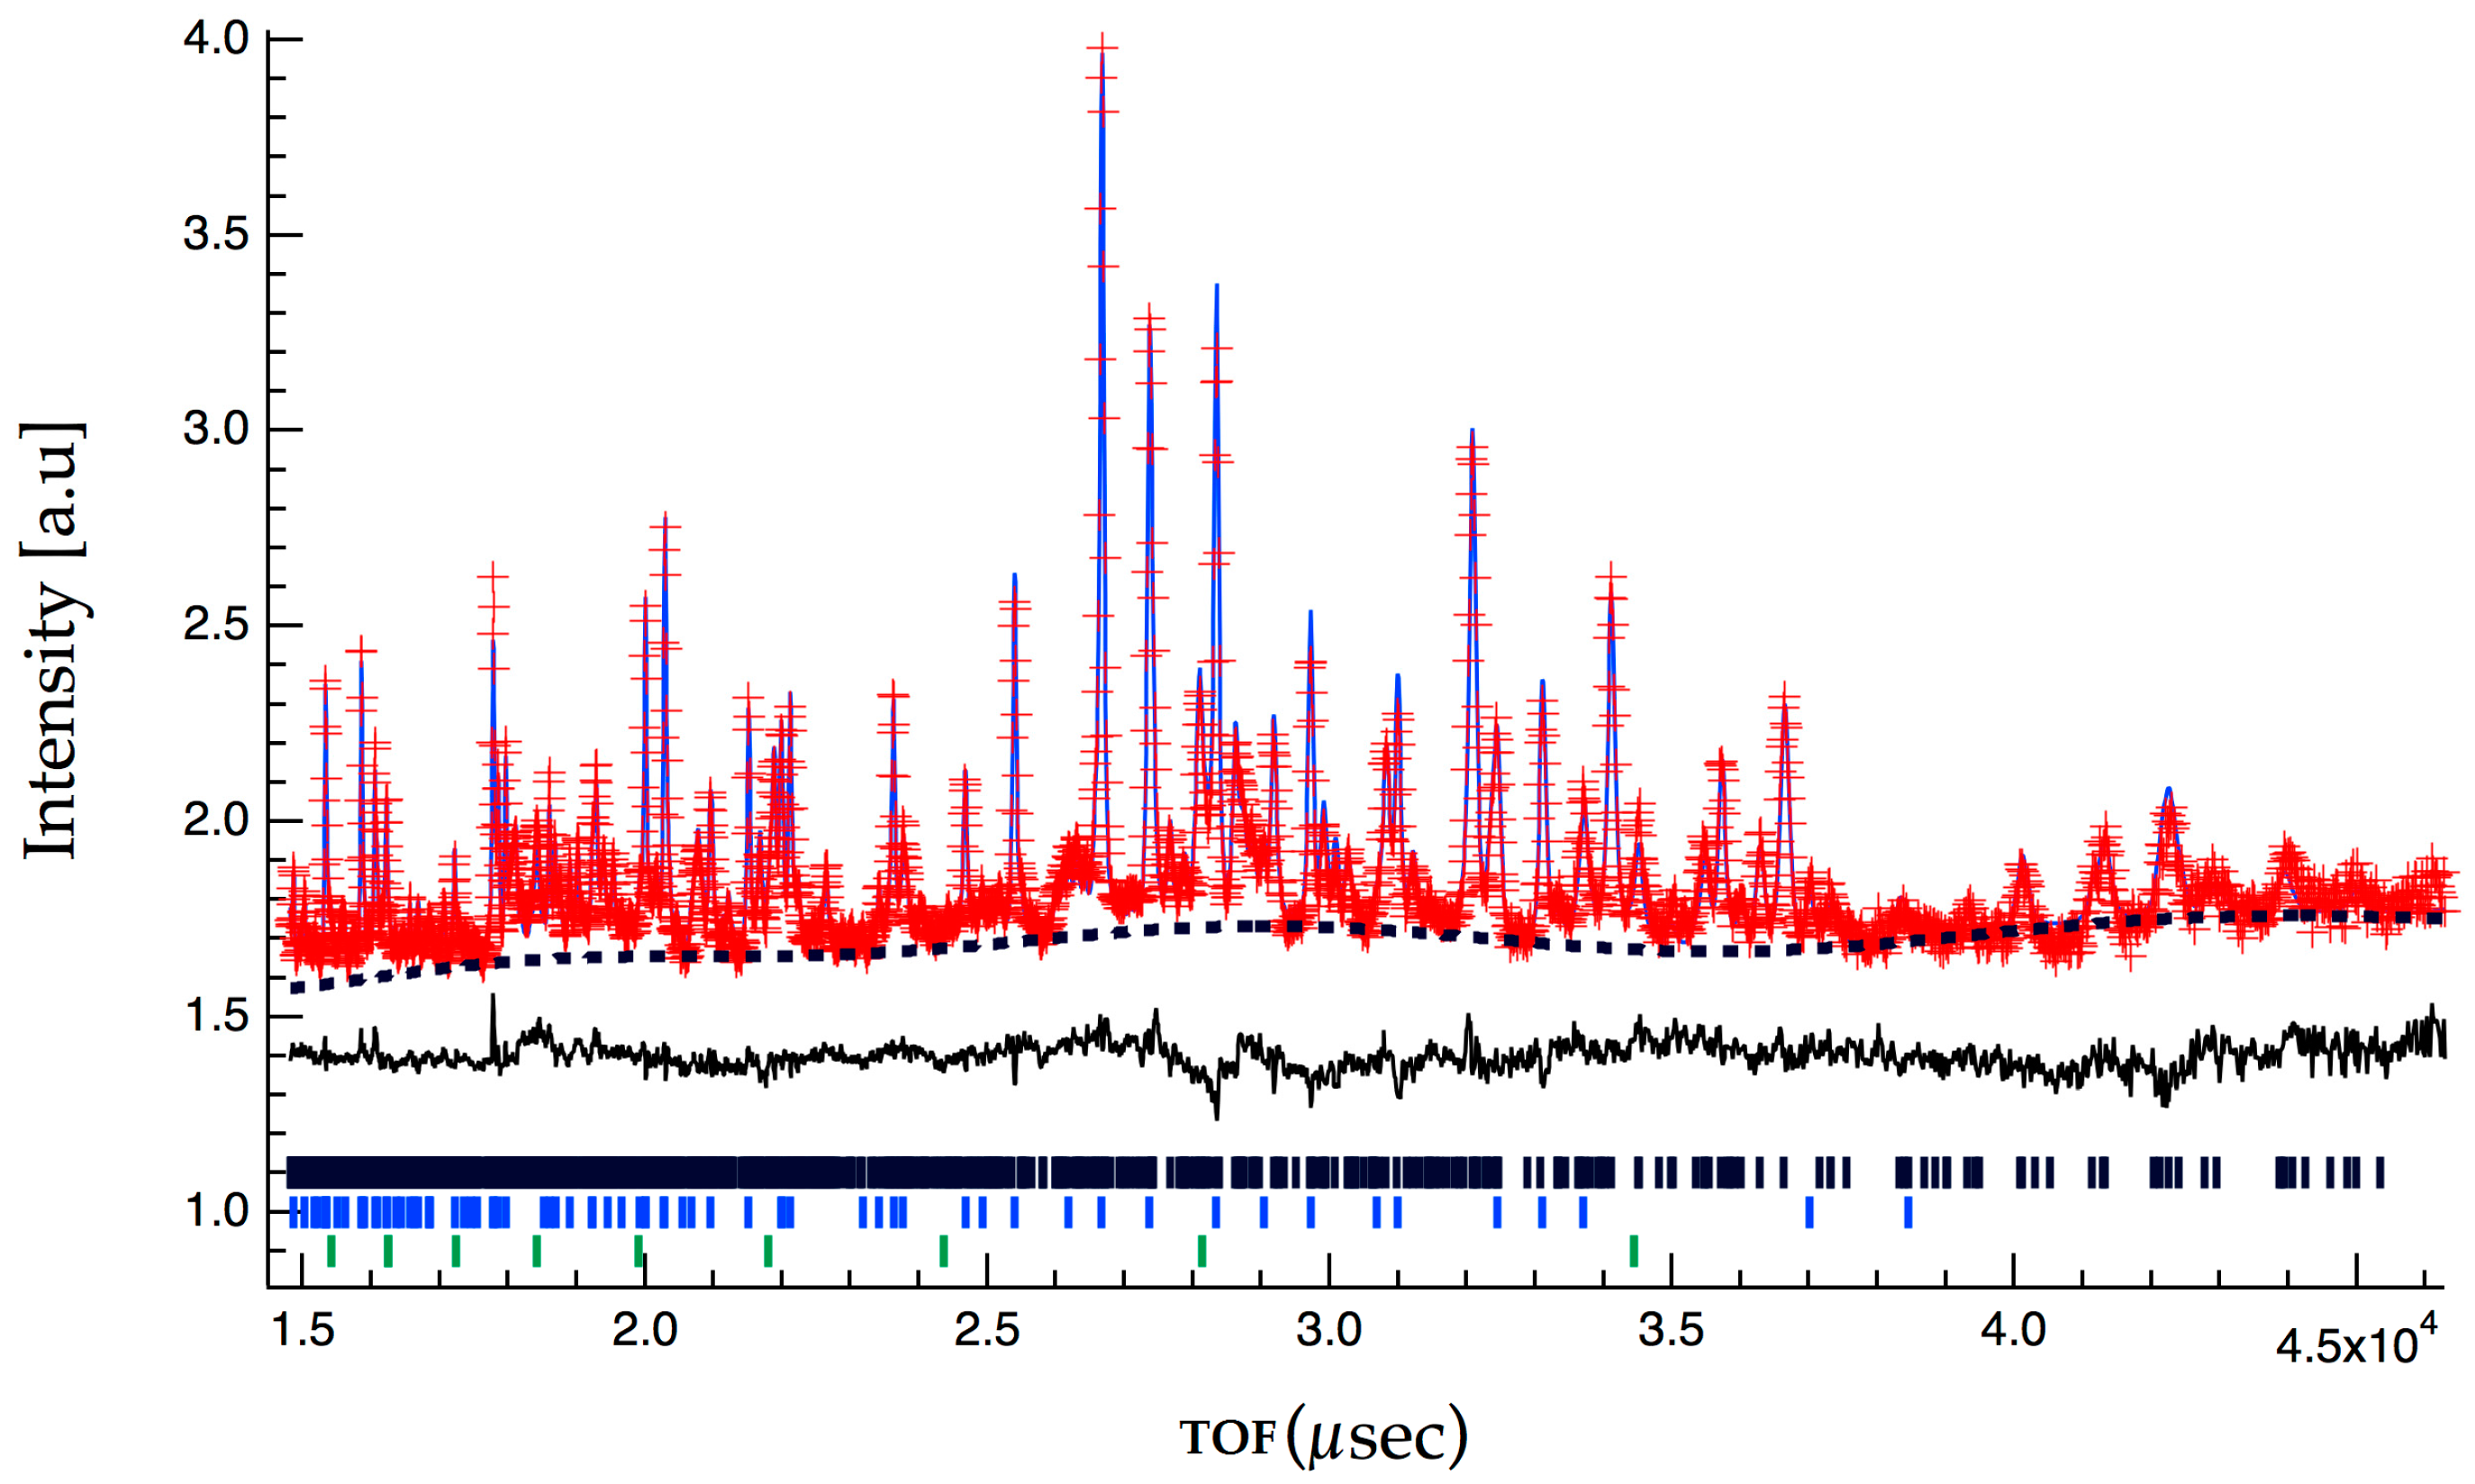
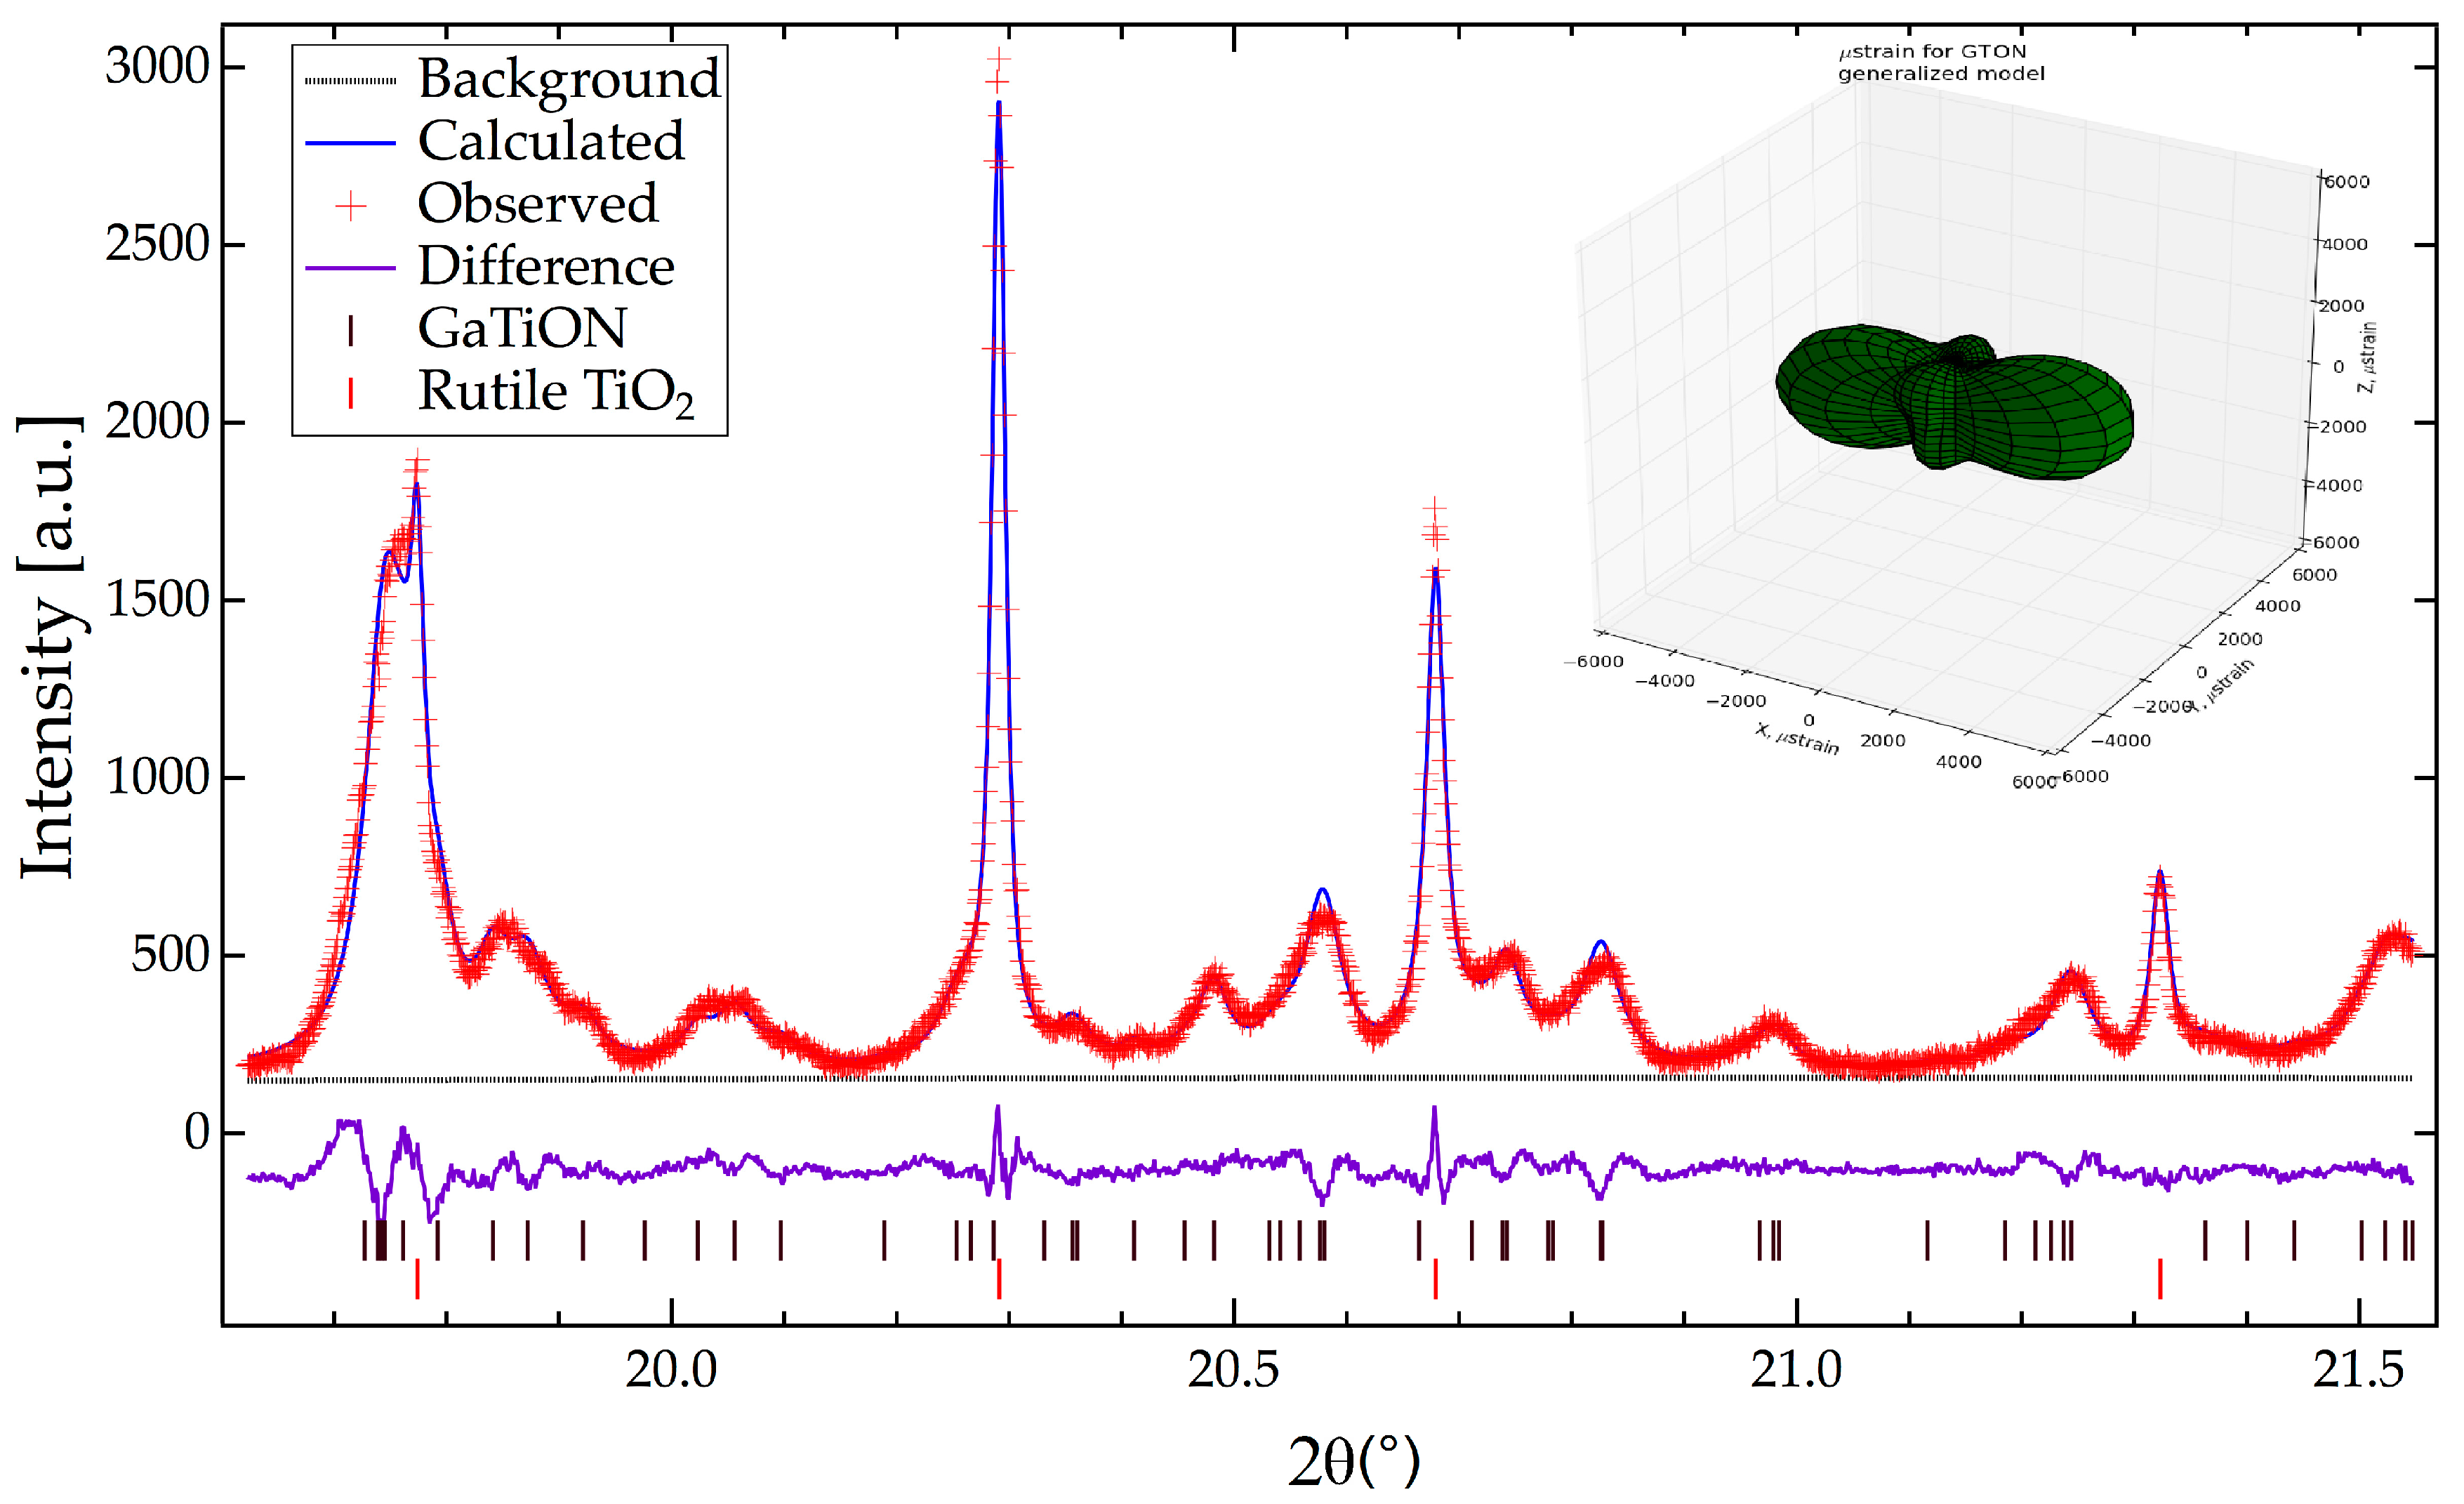
2.2. Crystallographic Characterization
3. Discussion
3.1. Composition
3.2. Implications and Future Work
4. Materials and Methods
4.1. Theoretical Prediction Methods
4.2. High Pressure Synthesis
Supplementary Materials
Acknowledgments
Author Contributions
Conflicts of Interest
Appendix A
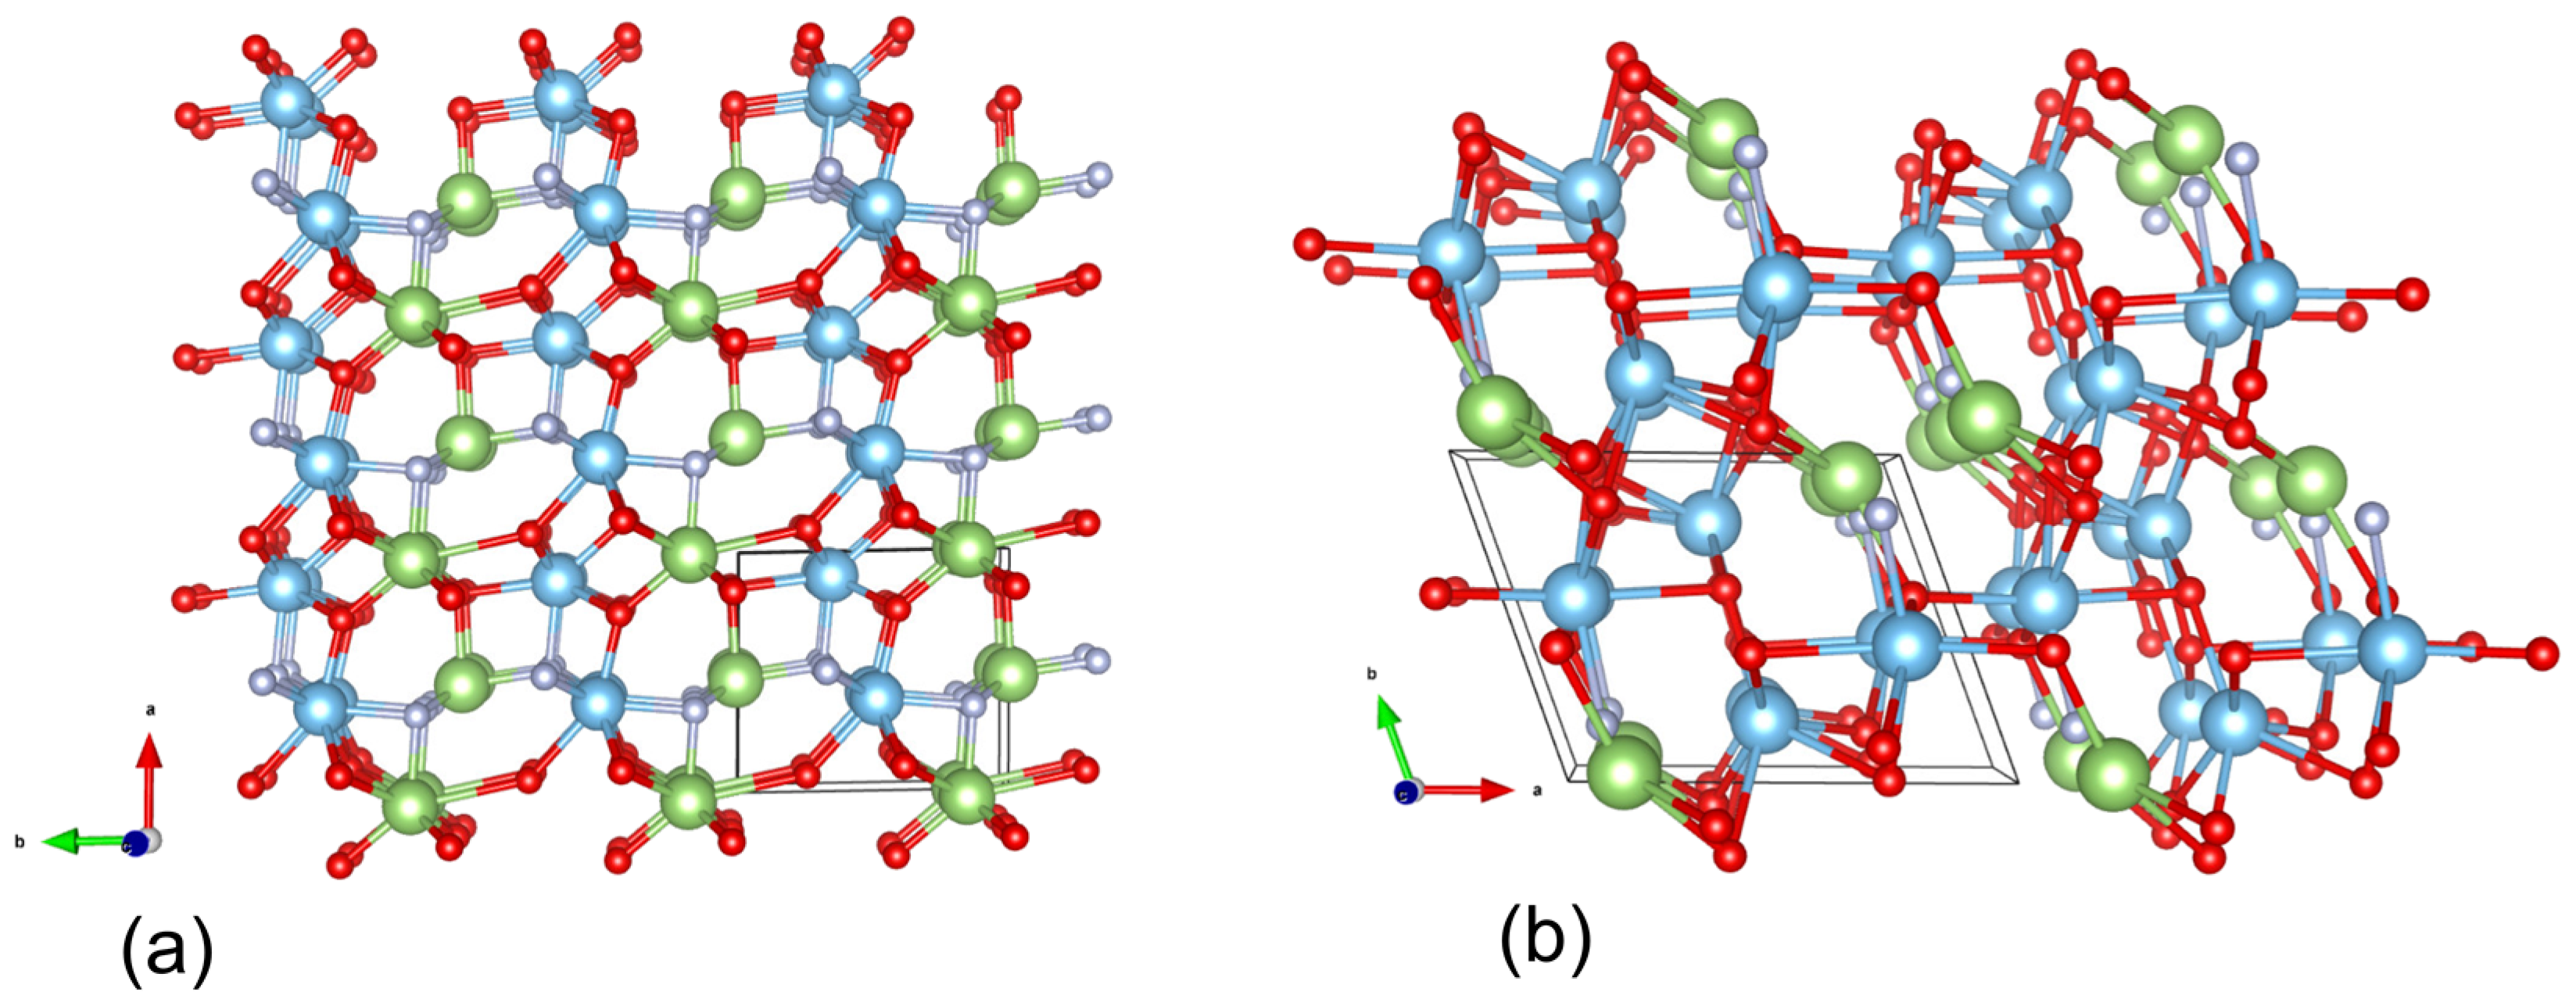
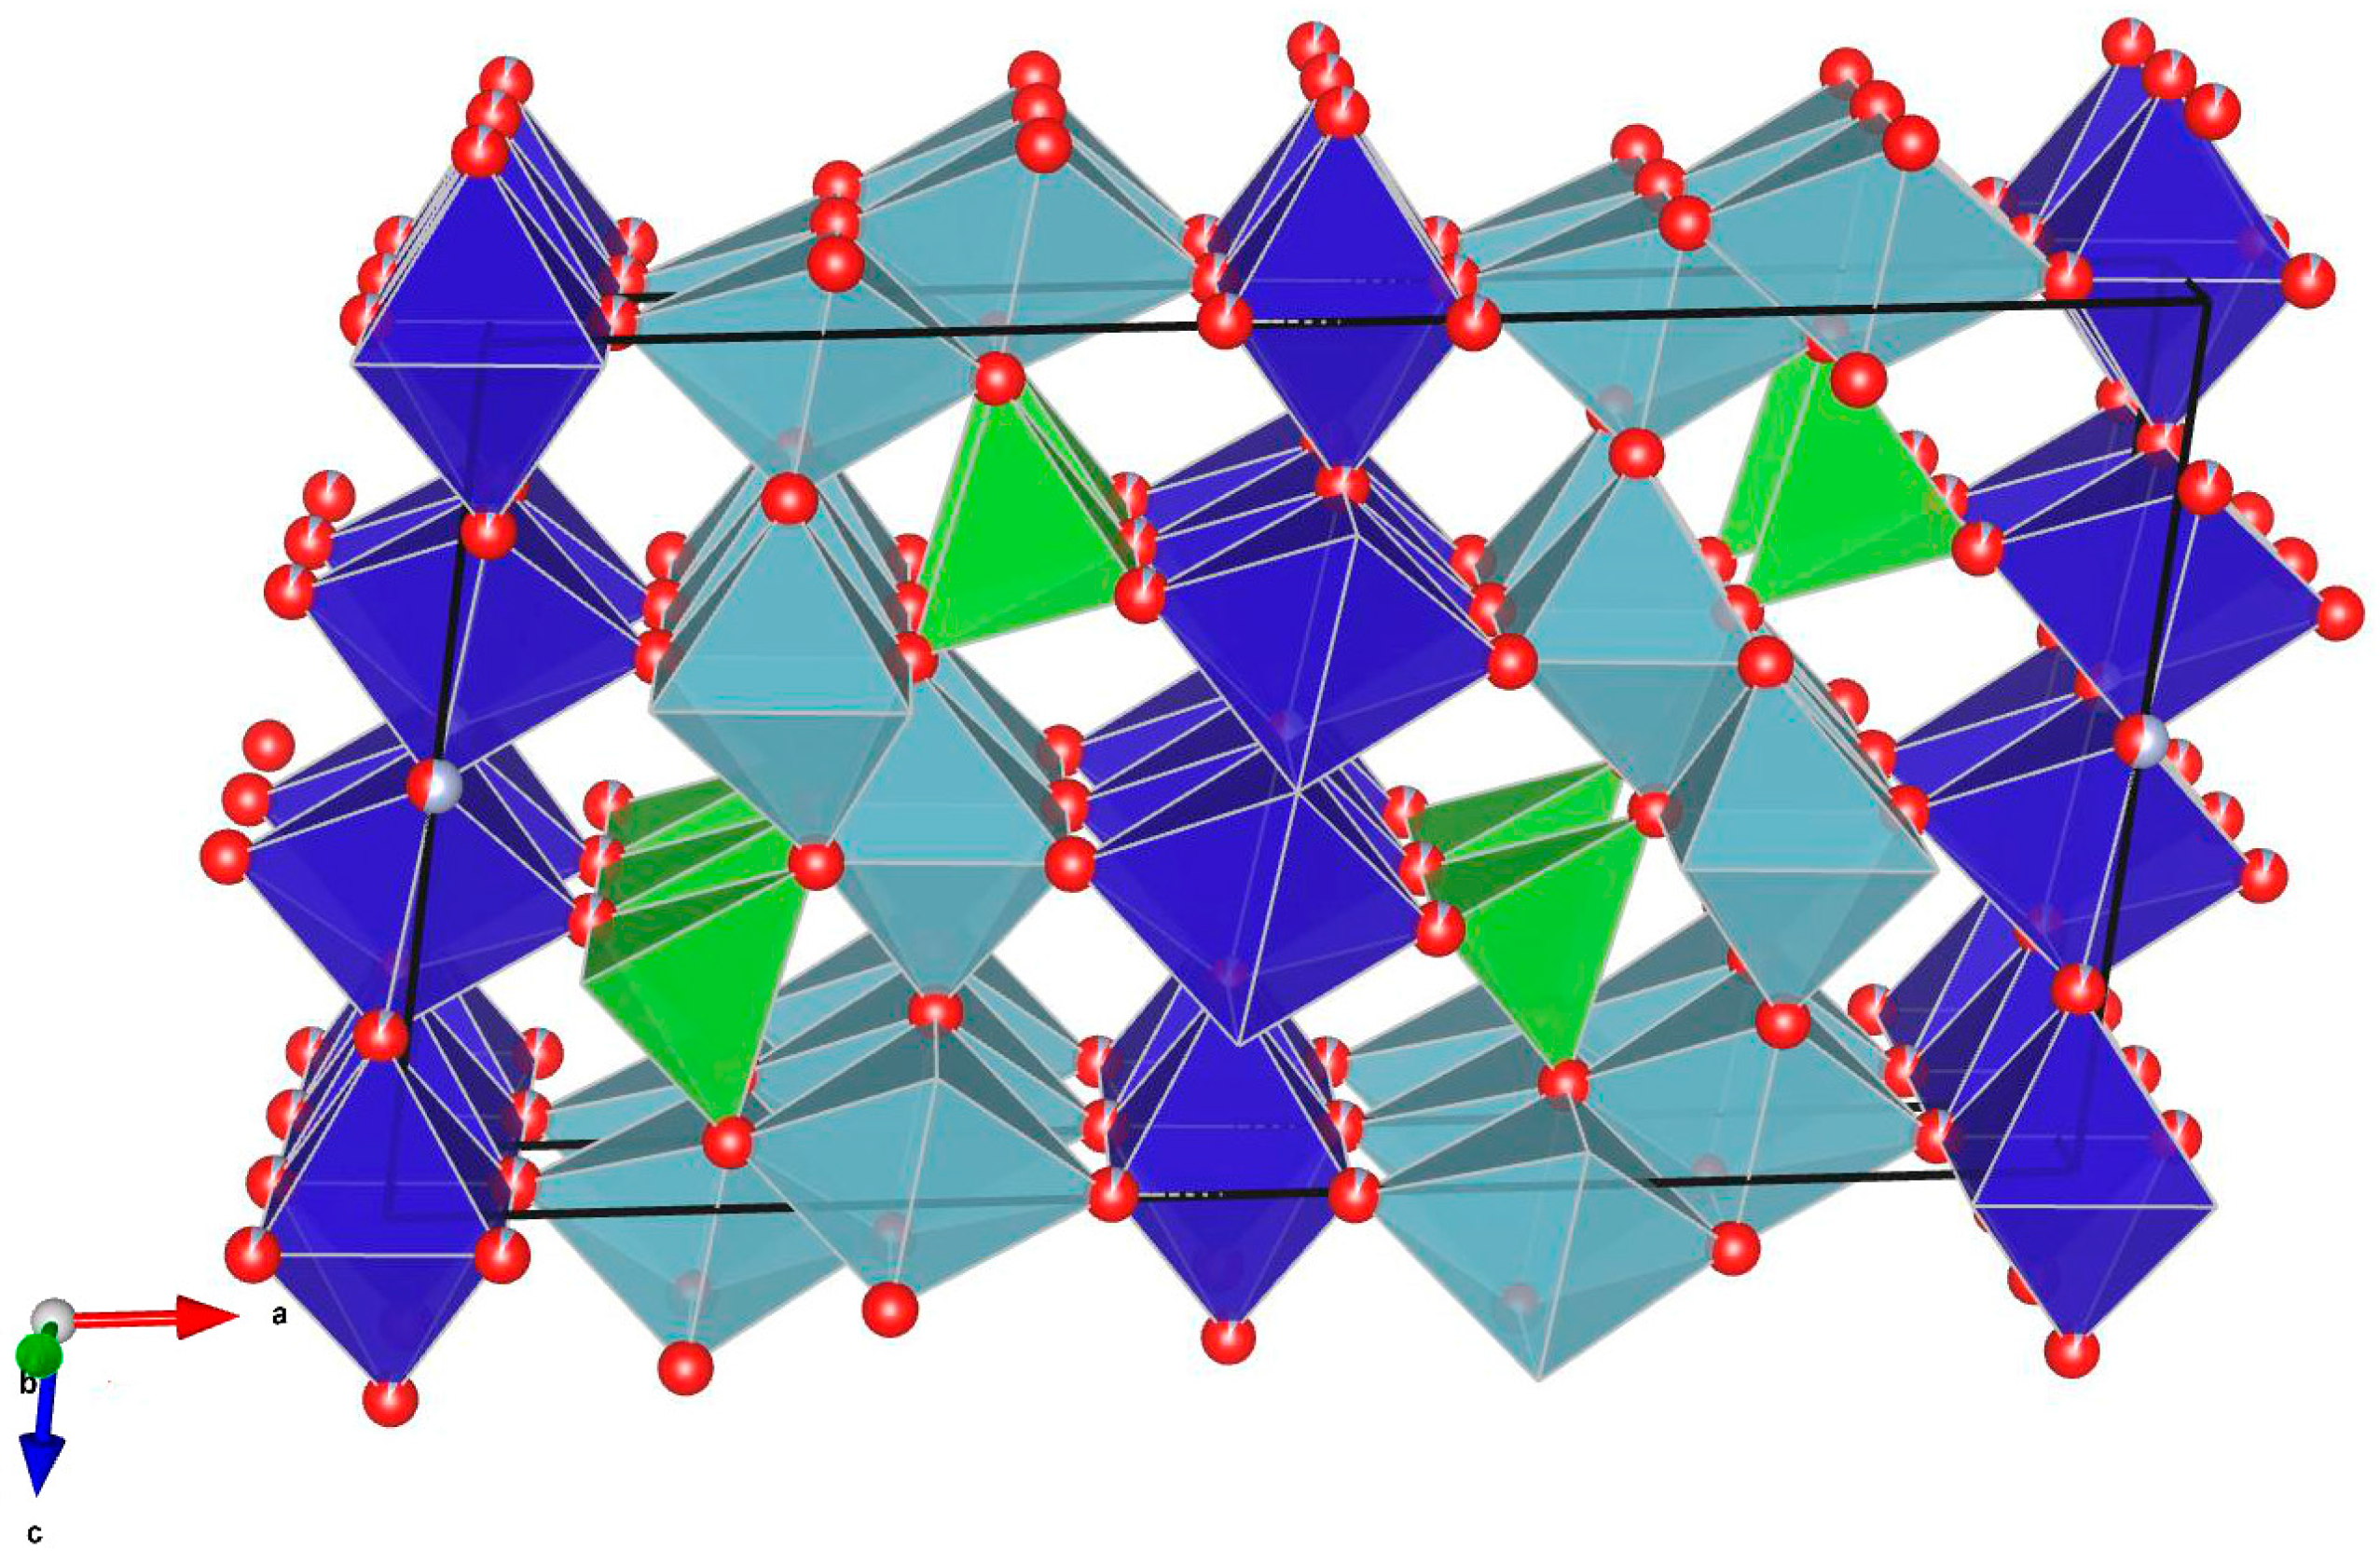
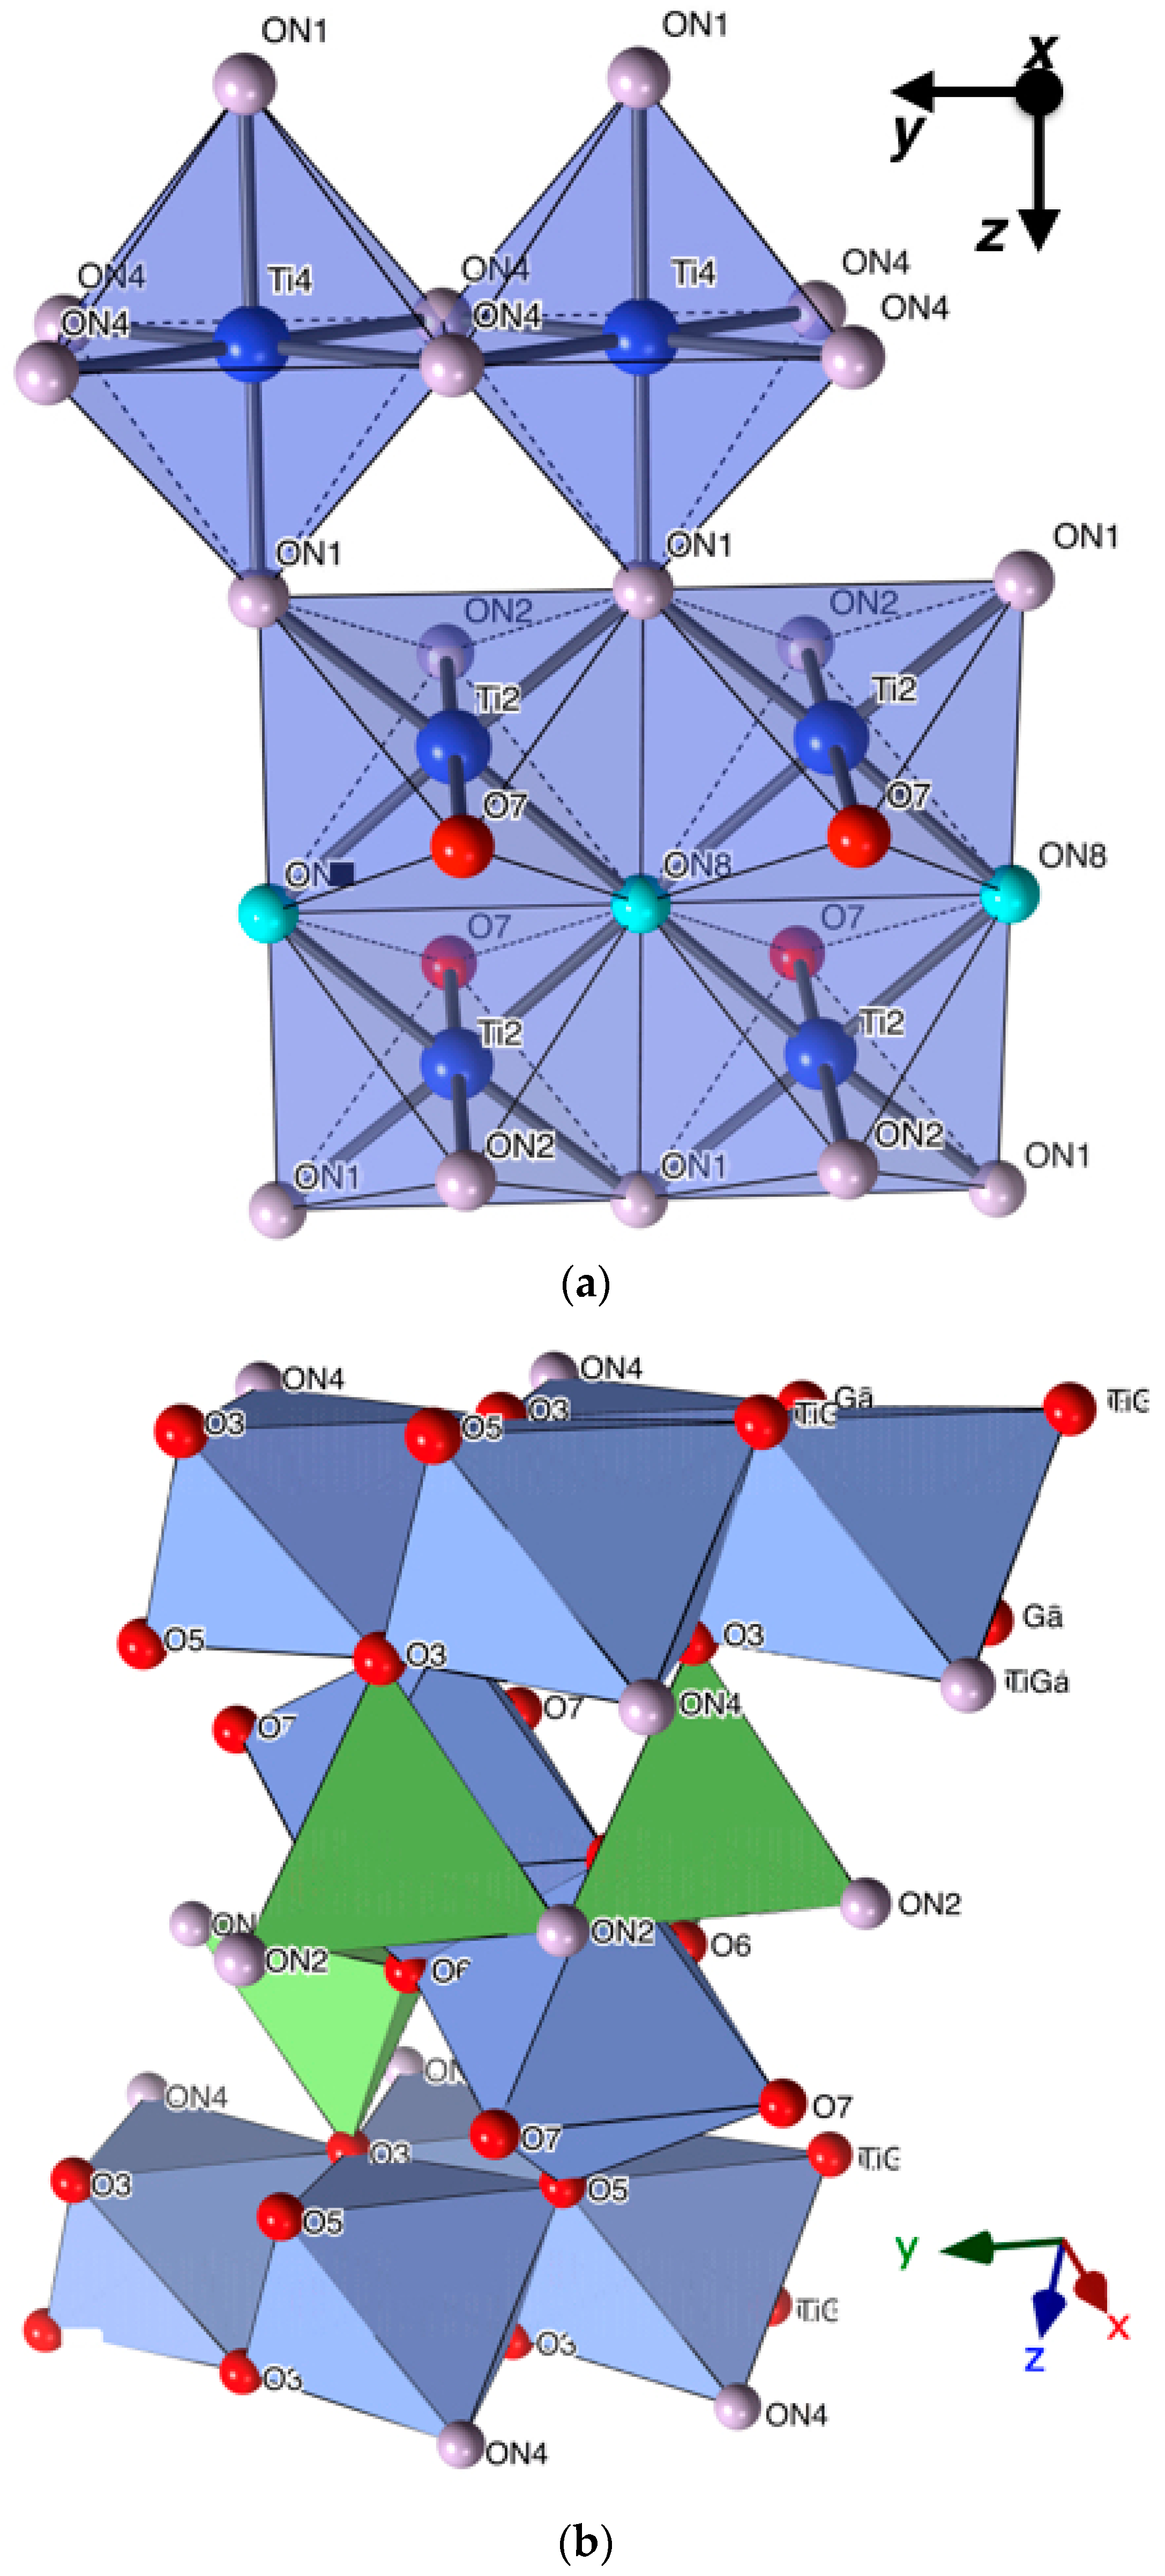
Structural Description

| Site | Comp * | M ** | x | y | z |
|---|---|---|---|---|---|
| TiGa1 | 0.272(7) | 4 | 0.68066(6) | 0 | 0.0554(1) |
| Ti2 | 1.0 | 4 | 0.48766(9) | 0 | 0.6516(1) |
| TiGa3 | 0.245(7) | 4 | 0.18934(6) | 0 | 0.3871(1) |
| Ti4 | 1.0 | 2 | 0 | 0 | 0 |
| Ga5 | 1.0 | 4 | 0.15770(5) | 0 | 0.7257(1) |
| ON1 | 0.08(2) | 4 | 0.0147(2) | 0 | 0.2125(4) |
| ON2 | 0.08(2) | 4 | 0.4003(2) | 0 | 0.3039(5) |
| O3 | 1.0 | 4 | 0.1979(2) | 0 | 0.9208(5) |
| ON4 | 0.07(2) | 4 | 0.4277(2) | 0 | 0.9955(4) |
| O5 | 1.0 | 4 | 0.1876(2) | 0 | 0.1853(4) |
| O6 | 1.0 | 4 | 0.2288(2) | 0 | 0.5998(4) |
| O7 | 1.0 | 4 | 0.3792(3) | 0 | 0.6098(4) |
| ON8 | 0.57(1) | 2 | 0 | 0 | ½ |

| TiGa1 | To | dist. | Sij/ΣSij * | O3 | O3 | O3 | ON4 | O5 |
| O3 | 2.143(4) | 0.43 | ||||||
| O3 | 2.015(3) | 0.58 | 79.7(1) | |||||
| O3 | 2.015(3) | 0.58 | 79.7(1) | 96.1(2) | ||||
| ON4 | 1.920(4 | 0.72 | 171.7(2) | 94.8(1) | 94.8(1) | |||
| O5 | 1.927(2) | 0.71 | 88.0(1) | 79.6(1) | 167.5(2) | 97.3(1) | ||
| O5 | 1.927(2) | 0.71 | 88.0(1) | 167.5(2) | 79.6(1) | 97.3(1) | 102.1(2) | |
| 3.73 | ||||||||
| Ti2 | To | dist. | ON1 | ON1 | ON2 | O7 | ON8 | |
| ON1 | 1.976(3) | 0.63 | ||||||
| ON1 | 1.976(3) | 0.63 | 98.6(2) | |||||
| ON2 | 1.980(5) | 0.63 | 88.8(1) | 88.8(1) | ||||
| O7 | 1.916(5) | 0.73 | 90.9(1) | 90.9(1) | 179.6(2) | |||
| ON8 | 2.104(1) | 0.47 | 85.1(1) | 174.1(1) | 86.6(1) | 93.6(1) | ||
| ON8 | 2.104(1) | 0.47 | 174.1(1) | 85.1(1) | 86.6(1) | 93.6(1) | 90.86(5) | |
| 3.57 | ||||||||
| TiGa3 | To | dist. | O5 | O6 | O6 | O6 | O7 | |
| O5 | 1.897(4) | 0.76 | ||||||
| O6 | 2.025(4) | 0.57 | 160.8(2) | |||||
| O6 | 2.082(3) | 0.50 | 88.2(1) | 78.6(1) | ||||
| O6 | 2.082(3) | 0.50 | 88.2(1) | 78.6(1) | 92.1(2) | |||
| O7 | 1.936(3) | 0.70 | 95.6(1) | 96.5(1) | 83.1(1) | 173.8(2) | ||
| O7 | 1.936(3) | 0.70 | 95.6(1) | 96.5(1) | 173.8(2) | 83.1(1) | 101.4(2) | |
| 3.71 | ||||||||
| Ti4 | To | dist. | ON1 | ON1 | ON4 | ON4 | ON4 | |
| ON1 | 1.980(4) | 0.63 | ||||||
| ON1 | 1.980(4) | 0.63 | 180 | |||||
| ON4 | 1.973(3) | 0.64 | 90.6(1) | 89.4(1) | ||||
| ON4 | 1.973(3) | 0.64 | 90.6(1) | 89.4(1) | 98.8(2) | |||
| ON4 | 1.973(3) | 0.64 | 89.4(1) | 90.6(1) | 81.2(2) | 180 | ||
| ON4 | 1.973(3) | 0.64 | 89.4(1) | 90.6(1) | 180 | 81.2(2) | 98.8(2) | |
| 3.81 | ||||||||
| Ga5 | To | dist. | ON2 | ON2 | O3 | |||
| ON2 | 1.818(3) | 0.79 | ||||||
| ON2 | 1.818(3) | 0.79 | 111.0(2) | |||||
| O3 | 1.872(4) | 0.68 | 106.1(1) | 106.1(1) | ||||
| O6 | 1.859(4) | 0.71 | 109.1(1) | 109.1(1) | 115.3(2) | |||
| 2.96 |
| Average Bond Lengths | GaTiO2N | GaTi2O4N |
|---|---|---|
| d(Ga-ON) | 1.941 | 1.976 |
| d(Ti-O) | --- | 2.027 |
| d(Ti-ON) | 2.057 | 1.969 |
| CIF File Created for GaTiO2N | |||||||
| _audit_creation_date | 2017-08-05 | ||||||
| _symmetry_space_group_name_H-M | ‘PM’ | ||||||
| _symmetry_Int_Tables_number | 6 | ||||||
| _symmetry_cell_setting | monoclinic | ||||||
| loop_ | |||||||
| _symmetry_equiv_pos_as_xyz | |||||||
| x,y,z | |||||||
| x,-y,z | |||||||
| _cell_length_a | 5.9275 | ||||||
| _cell_length_b | 3.0572 | ||||||
| _cell_length_c | 5.2466 | ||||||
| _cell_angle_alpha | 90.0000 | ||||||
| _cell_angle_beta | 91.4407 | ||||||
| _cell_angle_gamma | 90.0000 | ||||||
| loop_ | |||||||
| _atom_site_label | |||||||
| _atom_site_type_symbol | |||||||
| _atom_site_fract_x | |||||||
| _atom_site_fract_y | |||||||
| _atom_site_fract_z | |||||||
| _atom_site_U_iso_or_equiv | |||||||
| _atom_site_adp_type | |||||||
| _atom_site_occupancy | |||||||
| Ga1 | Ga | 0.18413 | −0.00000 | 0.00367 | 0.00000 | Uiso | 1.00 |
| N2 | N | 0.16384 | −0.00000 | 0.37134 | 0.00000 | Uiso | 1.00 |
| Ti1 | Ti | 0.50889 | −0.00000 | 0.40778 | 0.00000 | Uiso | 1.00 |
| O2 | O | 0.43639 | −0.00000 | 0.76892 | 0.00000 | Uiso | 1.00 |
| O4 | O | 0.75867 | −0.00000 | 0.10112 | 0.00000 | Uiso | 1.00 |
| Ga2 | Ga | 0.01254 | 0.50000 | 0.48200 | 0.00000 | Uiso | 1.00 |
| N1 | N | 0.69627 | 0.50000 | 0.53124 | 0.00000 | Uiso | 1.00 |
| Ti2 | Ti | 0.66631 | 0.50000 | 0.90342 | 0.00000 | Uiso | 1.00 |
| O1 | O | 0.02938 | 0.50000 | 0.85656 | 0.00000 | Uiso | 1.00 |
| O3 | O | 0.42192 | 0.50000 | 0.14854 | 0.00000 | Uiso | 1.00 |
| CIF File Created for GaTiO4N | |||||||
| _audit_creation_date | 2017-08-05 | ||||||
| _symmetry_space_group_name_H-M | ‘P21’ | ||||||
| _symmetry_Int_Tables_number | 4 | ||||||
| _symmetry_cell_setting | monoclinic | ||||||
| loop_ | |||||||
| _symmetry_equiv_pos_as_xyz | |||||||
| x,y,z | |||||||
| -x,y+1/2,-z | |||||||
| _cell_length_a | 4.8847 | ||||||
| _cell_length_b | 5.0528 | ||||||
| _cell_length_c | 6.2742 | ||||||
| _cell_angle_alpha | 90.0000 | ||||||
| _cell_angle_beta | 110.3545 | ||||||
| _cell_angle_gamma | 90.0000 | ||||||
| loop_ | |||||||
| _atom_site_label | |||||||
| _atom_site_type_symbol | |||||||
| _atom_site_fract_x | |||||||
| _atom_site_fract_y | |||||||
| _atom_site_fract_z | |||||||
| _atom_site_U_iso_or_equiv | |||||||
| _atom_site_adp_type | |||||||
| _atom_site_occupancy | |||||||
| Ga1 | Ga | 0.07981 | 0.98738 | 0.15399 | 0.00000 | Uiso | 1.00 |
| N1 | N | 0.80267 | 0.11936 | 0.86384 | 0.00000 | Uiso | 1.00 |
| Ti1 | Ti | 0.21226 | 0.55540 | 0.48175 | 0.00000 | Uiso | 1.00 |
| Ti3 | Ti | 0.56276 | 0.49295 | 0.17439 | 0.00000 | Uiso | 1.00 |
| O1 | O | 0.95005 | 0.27236 | 0.30543 | 0.00000 | Uiso | 1.00 |
| O2 | O | 0.41028 | 0.91541 | 0.49985 | 0.00000 | Uiso | 1.00 |
| O3 | O | 0.42921 | 0.12888 | 0.11294 | 0.00000 | Uiso | 1.00 |
| O7 | O | 0.16559 | 0.28320 | 0.69354 | 0.00000 | Uiso | 1.00 |
References
- Lewis, N.S.; Nocera, D.G. Powering the planet: Chemical challenges in solar energy utilization. Proc. Natl. Acad. Sci. USA 2006, 103, 15729–15735. [Google Scholar] [CrossRef] [PubMed]
- Lewis, N.S.; Crabtree, G. Basic Research Needs for Solar Energy Utilization: Report of the Basic Energy Sciences Workshop on Solar Energy Utilization, 18–21 April 2005; US Department of Energy, Office of Basic Energy Science: Washington, DC, USA, 2005.
- Tsao, J.; Lewis, N.; Crabtree, G. Solar FAQs; US department of Energy: Washington, DC, USA, 2006; pp. 1–24.
- Hashimoto, K.; Irie, H.; Fujishima, A. TiO2 photocatalysis: A historical overview and future prospects. Jpn. J. Appl. Phys. 2005, 44, 8269. [Google Scholar] [CrossRef]
- Fujishima, A.; Honda, K. Electrochemical photolysis of water at a semiconductor electrode. Nature 1972, 238, 37–38. [Google Scholar] [CrossRef] [PubMed]
- Fujishima, A.; Honda, K.; Kikuchi, S. Photosensitized electrolytic oxidation on semiconducting n-type TiO2 electrod. Kogyo Kagaku Zasshi 1969, 72, 108–113. [Google Scholar] [CrossRef]
- Ruddlesden, S.N.; Popper, P. New compounds of the K2NiF4 type. Acta Crystallogr. 1957, 10, 538–539. [Google Scholar] [CrossRef]
- Maeda, K.; Domen, K. Oxynitride materials for solar water splitting. MRS Bull. 2011, 36, 25–31. [Google Scholar] [CrossRef]
- Fuertes, A. Synthesis and properties of functional oxynitrides—From photocatalysts to CMR materials. Dalton Trans. 2010, 39, 5942–5948. [Google Scholar] [CrossRef] [PubMed]
- Fuertes, A. Chemistry and applications of oxynitride perovskites. J. Mater. Chem. 2012, 22, 3293–3299. [Google Scholar] [CrossRef]
- Hirai, T.; Maeda, K.; Yoshida, M.; Kubota, J.; Ikeda, S.; Matsumura, M.; Domen, K. Origin of visible light absorption in GaN-rich (Ga1−xZnx)(N1−xOx) photocatalysts. J. Phys. Chem. C 2007, 111, 18853–18855. [Google Scholar] [CrossRef]
- Kasahara, A.; Nukumizu, K.; Hitoki, G.; Takata, T.; Kondo, J.N.; Hara, M.; Kobayashi, H.; Domen, K. Photoreactions on LaTiO2N under visible light irradiation. J. Phys. Chem. A 2002, 106, 6750–6753. [Google Scholar] [CrossRef]
- Kasahara, A.; Nukumizu, K.; Takata, T.; Kondo, J.N.; Hara, M.; Kobayashi, H.; Domen, K. LaTiO2N as a visible-light (≤600 nm)-driven photocatalyst (2). J. Phys. Chem. B 2003, 107, 791–797. [Google Scholar] [CrossRef]
- Porter, S.H.; Huang, Z.; Dou, S.; Brown-Xu, S.; Golam Sarwar, A.T.M.; Myers, R.C.; Woodward, P.M. Electronic structure and photocatalytic water oxidation activity of RTiNO2 (R = Ce, Pr and Nd) perovskite nitride oxides. Chem. Mater. 2015, 27, 2414–2420. [Google Scholar] [CrossRef]
- Hyett, G.; Green, M.A.; Parkin, I.P. The use of combinatorial chemical vapor deposition in the synthesis of Ti3-δO4N with 0.06 < δ < 0.25: A titanium oxynitride phase isostructural to anosovite. J. Am. Chem. Soc. 2007, 129, 15541–15548. [Google Scholar] [PubMed]
- Hyett, G.; Green, M.A.; Parkin, I.P. Ultra-violet light activated photocatalysis in thin films of the titanium oxynitride, Ti3−δO4N. J. Photochem. Photobiol. A Chem. 2009, 203, 199–203. [Google Scholar] [CrossRef]
- Maeda, K.; Takata, T.; Hara, M.; Saito, N.; Inoue, Y.; Kobayashi, H.; Domen, K. GaN: ZnO solid solution as a photocatalyst for visible-light-driven overall water splitting. J. Am. Chem. Soc. 2005, 127, 8286–8287. [Google Scholar] [CrossRef] [PubMed]
- Dharmagunawardhane, H.A.N.; James, A.; Wu, Q.; Woerner, W.R.; Sinclair, A.; Palomino, R.; Orlov, A.; Parise, J.B. Unexpected visible light driven photocatalytic activity without cocatalysts and sacrificial reagents from the (GaN)1–x(ZnO)x solid solution synthesized at high pressure in the entire composition range. RSC Adv. 2018. In Review. [Google Scholar]
- Wu, Y.B.; Lazic, P.; Hautier, G.; Persson, K.; Ceder, G. First principles high throughput screening of oxynitrides for water-splitting photocatalysts. Energy Environ. Sci. 2013, 6, 157–168. [Google Scholar] [CrossRef]
- Woerner, W.R.; Qian, G.-R.; Oganov, A.R.; Stephens, P.W.; Dharmagunawardhane, H.N.; Sinclair, A.; Parise, J.B. Combined theoretical and in situ scattering strategies for optimized discovery and recovery of high-pressure phases: A case study of the GaN–Nb2O5 system. Inorg. Chem. 2016, 55, 3384–3392. [Google Scholar] [CrossRef] [PubMed]
- Ozoliņš, V.; Wolverton, C.; Zunger, A. First-principles theory of vibrational effects on the phase stability of Cu-Au compounds and alloys. Phys. Rev. B 1998, 58, R5897. [Google Scholar] [CrossRef]
- Vinograd, V.L. Substitution of [4]al in layer silicates: Calculation of the Al-Si configurational entropy according to 29Si NMR spectra. Phys. Chem. Miner. 1995, 22, 87–98. [Google Scholar] [CrossRef]
- Brown, I.D.; Altermatt, D. Bond-valence parameters obtained from a systematic analysis of the inorganic crystal structure database. Acta Crystallogr. Sect. B 1985, 41, 244–247. [Google Scholar] [CrossRef]
- Lüdtke, T.; Orthmann, S.; Lerch, M. Bixbyite-type phases in the system Ta-Zr-ON. Z. Naturforsch. B 2017, 72, 305–311. [Google Scholar] [CrossRef]
- Kuno, Y.; Tassel, C.; Fujita, K.; Batuk, D.; Abakumov, A.M.; Shitara, K.; Kuwabara, A.; Moriwake, H.; Watabe, D.; Ritter, C. ZnTaO2N: Stabilized high-temperature LiNbO3-type structure. J. Am. Chem. Soc. 2016, 138, 15950–15955. [Google Scholar] [CrossRef] [PubMed]
- Oró-Solé, J.; Clark, L.; Bonin, W.; Attfield, J.P.; Fuertes, A. Anion-ordered chains in ad 1 perovskite oxynitride: NdVO2N. Chem. Commun. 2013, 49, 2430–2432. [Google Scholar] [CrossRef] [PubMed]
- Yashima, M.; Lee, Y.; Domen, K. Crystal structure and electron density of Tantalum oxynitride, a visible light responsive photocatalyst. Chem. Mater. 2007, 19, 588–593. [Google Scholar] [CrossRef]
- Srinivasa, S.; Cartz, L.; Jorgensen, J.; Worlton, T.; Beyerlein, R.; Billy, M. High-pressure neutron diffraction study of Si2N2O. J. Appl. Crystallogr. 1977, 10, 167–171. [Google Scholar] [CrossRef]
- Momma, K.; Izumi, F. Vesta: A three-dimensional visualization system for electronic and structural analysis. J. Appl. Crystallogr. 2008, 41, 653–658. [Google Scholar] [CrossRef]
- Cros, B.; Kernerczeskleba, H.; Philippot, E. The structure of V2GaO5. Acta Crystallogr. Sect. B-Struct. Commun. 1980, 36, 2210–2213. [Google Scholar] [CrossRef]
- Suchomel, M.R.; Ribaud, L.; Von Dreele, R.B.; Toby, B.H. Synchrotron powder diffraction simplified: The high-resolution diffractometer 11-BM at the Advanced Photon Source. Geochim. Cosmochim. Acta 2010, 74, 12. [Google Scholar]
- Wang, J.; Toby, B.H.; Lee, P.L.; Ribaud, L.; Antao, S.M.; Kurtz, C.; Ramanathan, M.; Von Dreele, R.B.; Beno, M.A. A dedicated powder diffraction beamline at the advanced photon source: Commissioning and early operational results. Rev. Sci. Instrum. 2008, 79, 085105. [Google Scholar] [CrossRef] [PubMed]
- Toby, B.H.; Huang, Y.; Dohan, D.; Carroll, D.; Jiao, X.S.; Ribaud, L.; Doebbler, J.A.; Suchomel, M.R.; Wang, J.; Preissner, C.; et al. Management of metadata and automation for mail-in measurements with the aps 11-BM high-throughput, high-resolution synchrotron powder diffractometer. J. Appl. Crystallogr. 2009, 42, 990–993. [Google Scholar] [CrossRef]
- Toby, B.H.; Von Dreele, R.B. GSAS-II: The genesis of a modern open-source all purpose crystallography software package. J. Appl. Crystallogr. 2013, 46, 544–549. [Google Scholar] [CrossRef]
- Stephens, P.W. Phenomenological model of anisotropic peak broadening in powder diffraction. J. Appl. Crystallogr. 1999, 32, 281–289. [Google Scholar] [CrossRef]
- Balzar, D.; Audebrand, N.; Daymond, M.R.; Fitch, A.; Hewat, A.; Langford, J.I.; Le Bail, A.; Louer, D.; Masson, O.; McCowan, C.N.; et al. Size-strain line-broadening analysis of the Ceria round-robin sample. J. Appl. Crystallogr. 2004, 37, 911–924. [Google Scholar] [CrossRef]
- Ha, K.; Ciria, M.; O’Handley, R.C.; Stephens, P.W.; Pagola, S. X-ray study of strains and dislocation density in epitaxial Cu/Ni/Cu/Si(001) films. Phys. Rev. B 1999, 60, 13780–13785. [Google Scholar] [CrossRef]
- Brese, N.E.; O’Keeffe, M.; Rauch, P.; DiSalvo, F.J. Structure of Ta3N5 at 16 K by time-of-flight neutron diffraction. Acta Crystallogr. C 1991, 47, 2291–2294. [Google Scholar] [CrossRef]
- Glass, C.W.; Oganov, A.R.; Hansen, N. USPEX—Evolutionary crystal structure prediction. Comput. Phys. Commun. 2006, 175, 713–720. [Google Scholar] [CrossRef]
- Lyakhov, A.O.; Oganov, A.R.; Stokes, H.T.; Zhu, Q. New developments in evolutionary structure prediction algorithm USPEX. Comput. Phys. Commun. 2013, 184, 1172–1182. [Google Scholar] [CrossRef]
- Lyakhov, A.O.; Oganov, A.R.; Valle, M. How to predict very large and complex crystal structures. Comput. Phys. Commun. 2010, 181, 1623–1632. [Google Scholar] [CrossRef]
- Oganov, A.R.; Glass, C.W. Evolutionary crystal structure prediction as a tool in materials design. J. Phys. Condens. Matter 2008, 20, 064210. [Google Scholar] [CrossRef] [PubMed]
- Oganov, A.R.; Lyakhov, A.O.; Valle, M. How evolutionary crystal structure prediction works and why. Acc. Chem. Res. 2011, 44, 227–237. [Google Scholar] [CrossRef] [PubMed]
- Blöchl, P.E. Projector augmented-wave method. Phys. Rev. B 1994, 50, 17953. [Google Scholar] [CrossRef]
- Kresse, G.; Furthmüller, J. Efficient iterative schemes for ab initio total-energy calculations using a plane-wave basis set. Phys. Rev. B 1996, 54, 11169. [Google Scholar] [CrossRef]
- Perdew, J.P.; Burke, K.; Ernzerhof, M. Generalized gradient approximation made simple. Phys. Rev. Lett. 1996, 77, 3865. [Google Scholar] [CrossRef] [PubMed]
- Monkhorst, H.J.; Pack, J.D. Special points for brillouin-zone integrations. Phys. Rev. B 1976, 13, 5188. [Google Scholar] [CrossRef]
- Brown, I.D. The Chemical Bond in Inorganic Chemistry: The Bond Valence Model; Oxford University Press: Oxford, UK, 2002. [Google Scholar]


| Pressure | Formation Enthalpy (eV/atom) | |
|---|---|---|
| GaTiO2N | GaTi2O4N | |
| 0 GPa | 0.19 | 0.21 |
| 5 GPa | 0.14 | 0.15 |
| 10 GPa | 0.13 | 0.14 |
| 20 GPa | 0.10 | 0.11 |
| Compound | Sconf (eV K−1/F.U.) | T (K) |
|---|---|---|
| GaTiO2N | 3.29 | 1408 |
| GaTi2O4N | 4.41 | 1684 |
| Ga10Ti8O28N2 | 6.38 | 3494 |
© 2018 by the authors. Licensee MDPI, Basel, Switzerland. This article is an open access article distributed under the terms and conditions of the Creative Commons Attribution (CC BY) license (http://creativecommons.org/licenses/by/4.0/).
Share and Cite
James, A.; Esfahani, M.M.D.; Woerner, W.R.; Sinclair, A.; Ehm, L.; Oganov, A.R.; Parise, J.B. Theoretical and Experimental Investigations into Novel Oxynitride Discovery in the GaN-TiO2 System at High Pressure. Crystals 2018, 8, 15. https://doi.org/10.3390/cryst8020015
James A, Esfahani MMD, Woerner WR, Sinclair A, Ehm L, Oganov AR, Parise JB. Theoretical and Experimental Investigations into Novel Oxynitride Discovery in the GaN-TiO2 System at High Pressure. Crystals. 2018; 8(2):15. https://doi.org/10.3390/cryst8020015
Chicago/Turabian StyleJames, Alwin, M. Mahdi Davari Esfahani, William R. Woerner, Alexandra Sinclair, Lars Ehm, Artem R. Oganov, and John B. Parise. 2018. "Theoretical and Experimental Investigations into Novel Oxynitride Discovery in the GaN-TiO2 System at High Pressure" Crystals 8, no. 2: 15. https://doi.org/10.3390/cryst8020015
APA StyleJames, A., Esfahani, M. M. D., Woerner, W. R., Sinclair, A., Ehm, L., Oganov, A. R., & Parise, J. B. (2018). Theoretical and Experimental Investigations into Novel Oxynitride Discovery in the GaN-TiO2 System at High Pressure. Crystals, 8(2), 15. https://doi.org/10.3390/cryst8020015