Article

Removal of SO42− from Li2CO3 by Recrystallization in Na2CO3 Solution

1
College of Chemical Engineering, Sichuan University, Chengdu 610065, China
2
Department of Chemical Engineering, Tsinghua University, Beijing 100084, China
*
Authors to whom correspondence should be addressed.
Crystals 2018, 8(1), 19; https://doi.org/10.3390/cryst8010019
Submission received: 4 December 2017 / Revised: 29 December 2017 / Accepted: 3 January 2018 / Published: 5 January 2018

Abstract

:
Li2CO3 with high purity is an important raw material for the fabrication of lithium rechargeable batteries. This paper reports a facile recrystallization way to produce Li2CO3 with high purity from commercial Li2CO3 containing 0.8 wt % of SO42− by the treatment of the commercial Li2CO3 in Na2CO3 solution. The increase of temperature from 30 °C to 90 °C favored the recrystallization of Li2CO3 in Na2CO3 solution and promoted the removal of SO42− adsorbed or doped on/in the commercial Li2CO3. The content of SO42− in Li2CO3 decreased to 0.08 wt % after the treatment of the commercial Li2CO3 in 1.0 mol·L−1 Na2CO3 solution at 90 °C for 10.0 h.

1. Introduction

Li2CO3 with high purity is widely used for the fabrication of lithium rechargeable batteries, and is usually produced from lithium-bearing minerals such as spodumene (Li2O·Al2O3·4SiO2), containing 5.8%–8.1 wt % Li2O, and lepidolite (K(Li,Al)3(Si,Al)4O(F,OH)2), containing 3.2%–6.45 wt % Li2O, or from the Li-bearing brines in salt lakes containing 0.005%–0.2 wt % Li+. Sulfation roasting (roasting of the mixture of lepidolite, Na2SO4 and CaCl2) and alkaline roasting (roasting of spodumene or lepidolite with limestone) are usually adapted to convert the lithium-bearing minerals to soluble Li-bearing salts. The soluble Li-bearing salts are then leached with acid or water, and the purified solutions are then reacted with soluble carbonates to form Li2CO3 [1,2,3,4,5]. The Li-bearing brines usually contain impurities like SO42−, K+, Na+, Mg2+, Ca2+ and Cl, etc. and the formation of Li2CO3 from the Li-bearing brines is often carried out by evaporation and crystallization: the Li-bearing brines are concentrated by multi-step evaporations and then reacted with soluble carbonates. The commercial Li2CO3 produced either from the minerals or the Li-bearing brines usually contains impurities such as SO42−, Mg2+, Ca2+, Fe3+, K+, Na+, Cl, etc., and further purification is often needed before its application in lithium batteries.
The soluble cations like K+, Na+ and soluble anions such as Cl and partial SO42− can be removed by washing with purified water. There are two main ways to remove Mg2+ and Ca2+, which often exists as insoluble MgCO3 and CaCO3 in Li2CO3. One way is causticization-carbonation: Li2CO3 slurry is reacted with Ca(OH)2 at elevated temperature: (Li2CO3 + Ca(OH)2 → 2LiOH + CaCO3) [6], the impurities such as Mg2+ and Fe3+ are precipitated as Mg(OH)2 and Fe(OH)3 residues, and the obtained LiOH solution is purified by ion exchange to remove minor soluble ions such as Ca2+ and Mg2+ and then reacted with CO2 to form purified Li2CO3. Another way is hydrogenation-decomposition [7,8,9]: Li2CO3 is converted to soluble LiHCO3 by carburizing reaction (Li2CO3 + CO2 + H2O → 2LiHCO3), the soluble impurities in LiHCO3 solution are separated by ion exchange and purified Li2CO3 is formed by subsequent decomposition of LiHCO3 at elevated temperature (2LiHCO3 → Li2CO3 + H2O + CO2). Up to now, most former work has been focused mainly on the removal of Mg2+ and Ca2+, and little work has been concerned with the removal of SO42−, which is also one of the common impurities in commercial Li2CO3.
This paper reports a facile way to remove SO42− from commercial Li2CO3 containing SO42− by recrystallization in Na2CO3 solution. The behaviors of the adsorbed and doped SO42− on/in Li2CO3 in recrystallization process are discussed and an optimized method is suggested to fabricate Li2CO3 with high purity and high conversion ratio.

2. Materials and Methods

Commercial Li2CO3 containing 99.2 wt % of Li2CO3 and 0.8 wt % of SO42− was used in the experiments. 100.0 g of commercial Li2CO3 was mixed with 400.0 g of 1.0 mol·L−1 Na2CO3 solution at room temperature, keeping the stirring speed at 300 min−1. The mixture was then heated to 30–90 °C and kept in an isothermal state for 10.0 h. The purified Li2CO3 was then filtered, washed with distilled water three times, and dried at 150 °C for 10.0 h.
The contents of Li+ and SO42− in samples were detected by ion chromatograph (IC-300, Shenghan Chromatography Technology Co., Ltd., Qingdao, China) equipped with a SH-CC-3 column. The contents of CO32 in samples were determined by the HCl titration method. The crystallinities of the samples were analyzed by X-ray diffractometer (XRD, D8 advanced, Bruker, Karlsruhe, Germany) using Cu-Kα radiation (λ = 1.54178 Å). The surfaces of the samples were characterized by X-ray photoelectron spectroscopy (XPS, Model PHI-5300, PHI, Minneapolis, MN, USA) with a Mg-Kα photon energy of 1253.6 eV. The functional groups of the samples were examined by a Fourier transform infrared spectrometer (FT-IR, Nicolet 670, Thermo Fisher, Waltham, MA, USA), using KBr (AR) as the background.

3. Results and Discussion

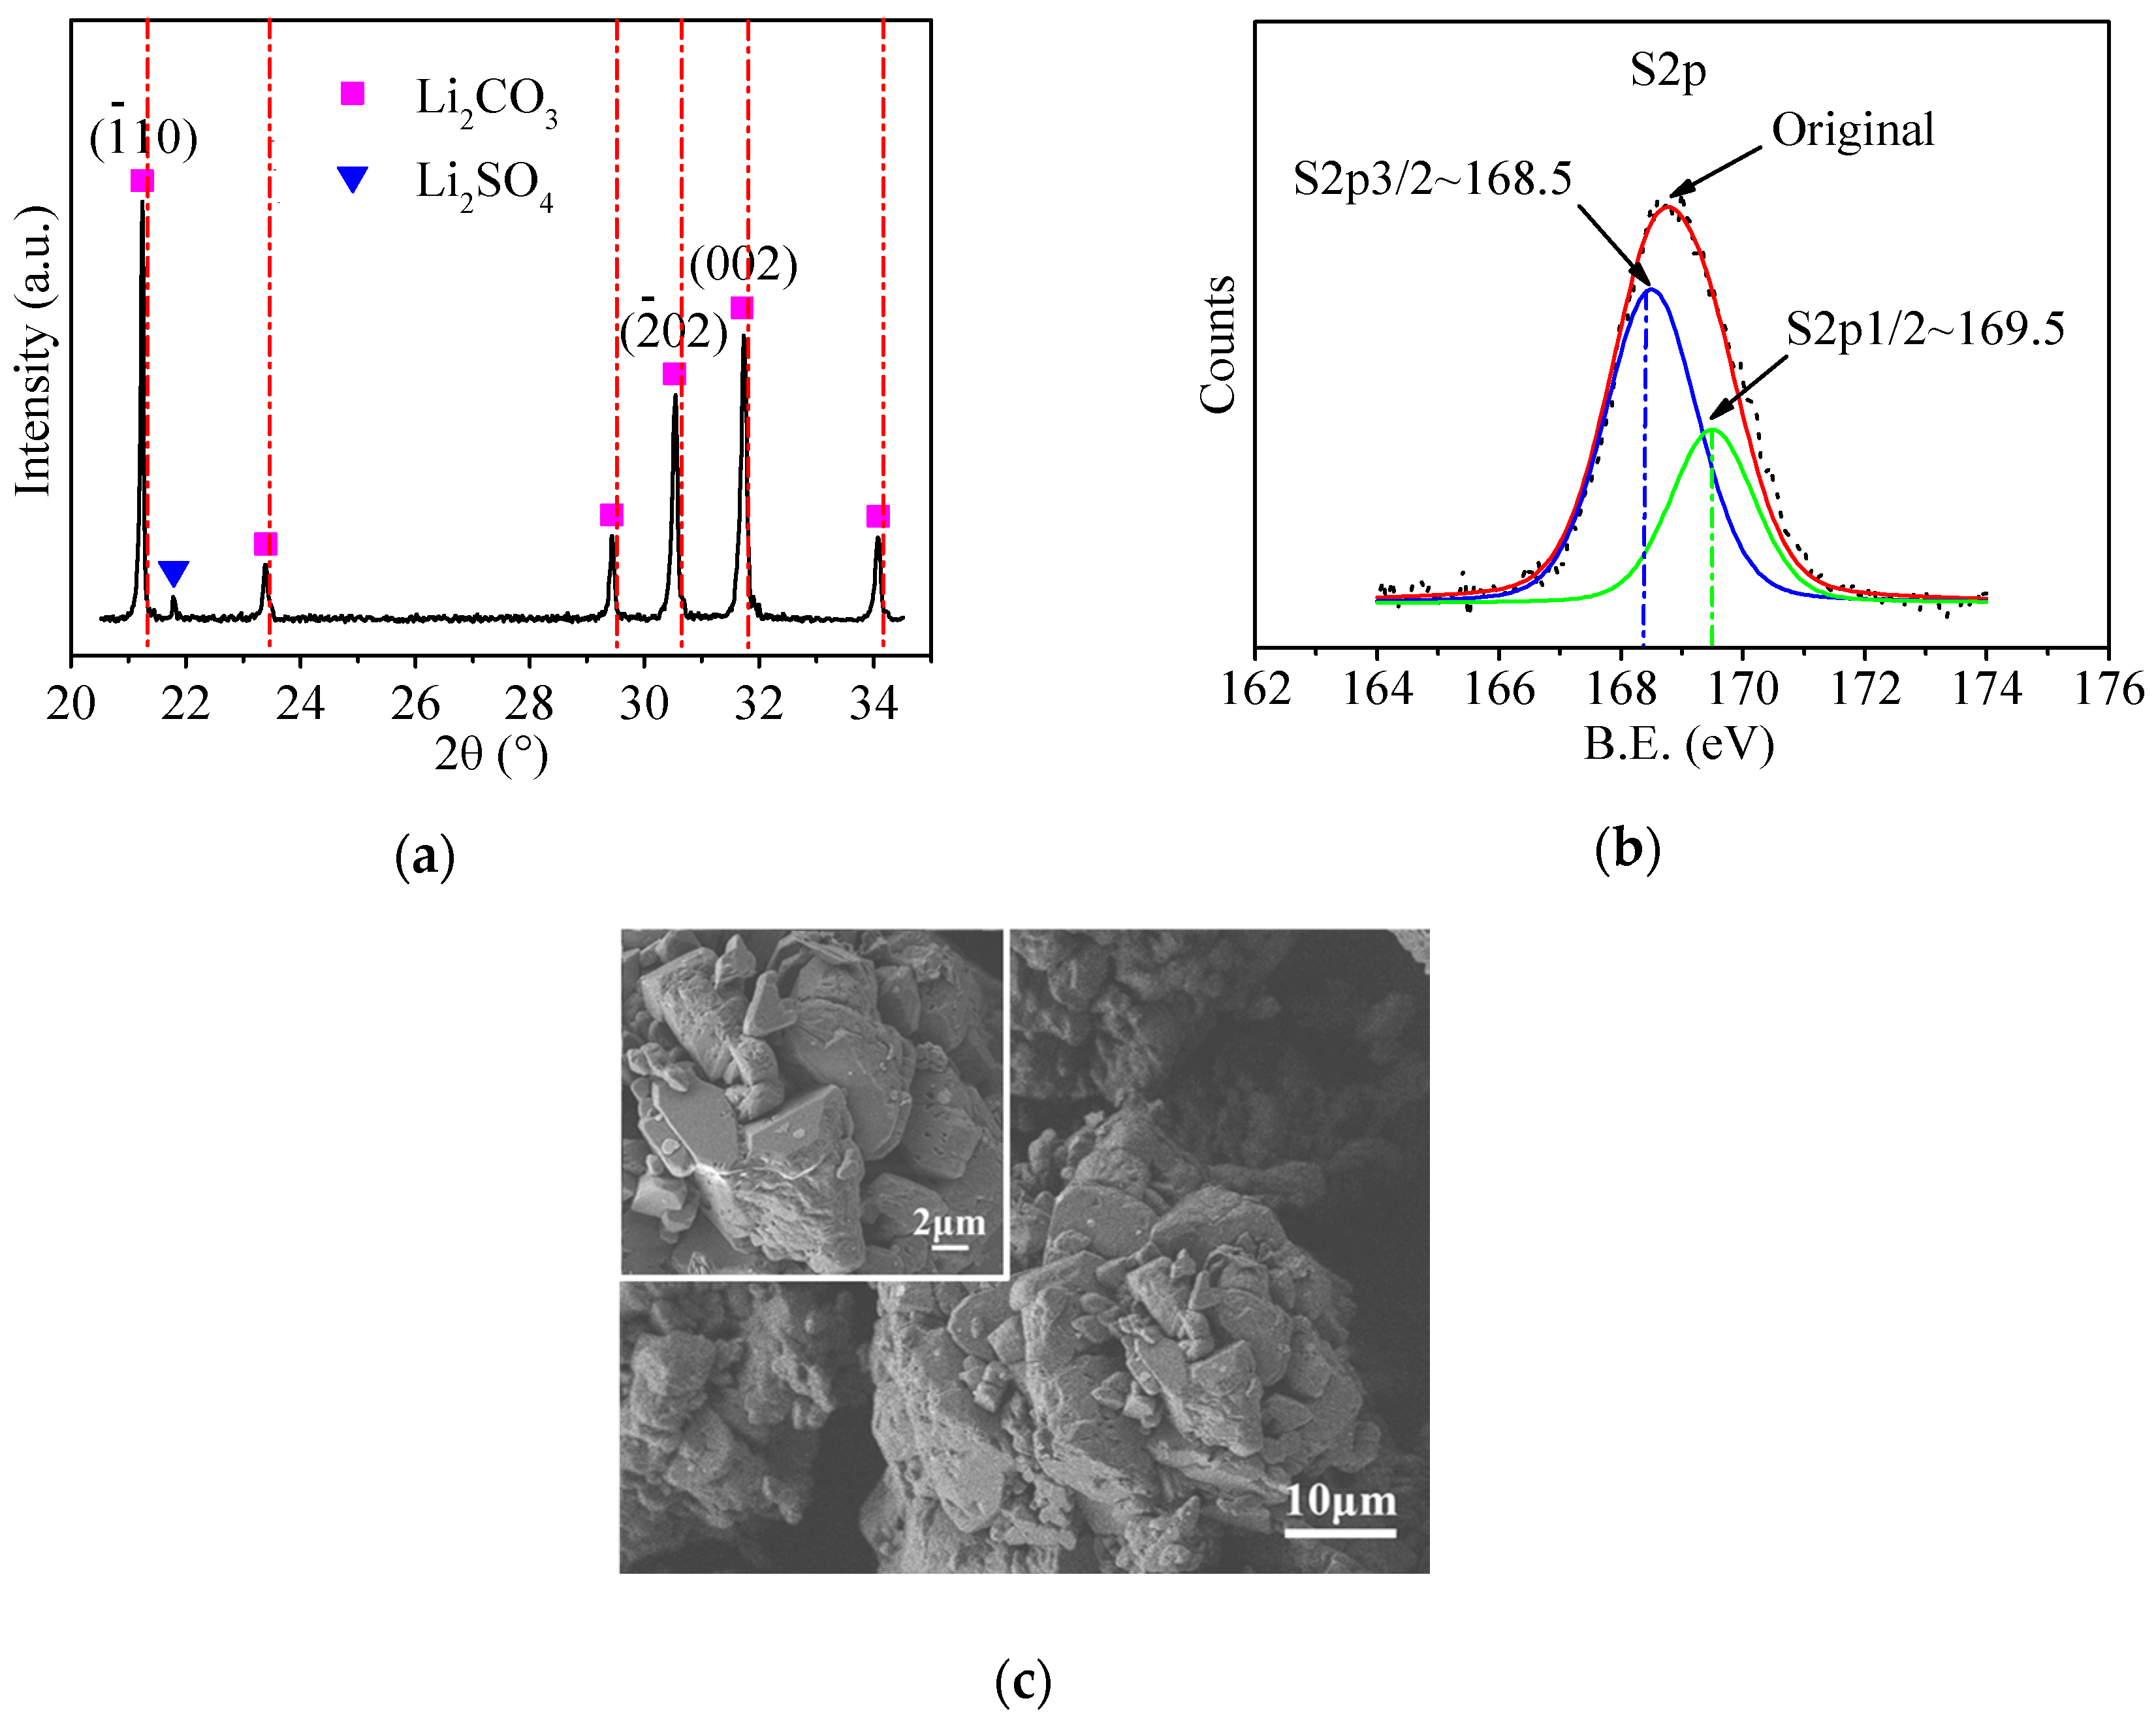
3.1. Characterization of Commercial Li2CO3

Figure 1a shows the XRD patterns of commercial Li2CO3. Most of the XRD peaks of the commercial Li2CO3 were quite identical with the standard peaks of the pure Li2CO3 (JCPDS 36-0787), and the peak located at 2θ = 21.76° indicated the existence of Li2SO4 (JCPDS 87-0729). The left shift of the XRD peaks of the commercial Li2CO3 compared with those of standard Li2CO3 (the dotted lines in Figure 1a) indicated the increase of the corresponding interplanar spacings, which should be connected with the doping of SO42− in Li2CO3 since the radius of SO42− (2.44 Å) was bigger than that of CO32− (1.64 Å) [10].
Figure 1b shows the S2p XPS patterns of the commercial Li2CO3 in the banding energy range of 164–174 eV. The original data can be divided into two peaks located at 169.5 eV and 168.5 eV, corresponding to the 2p1/2 and 2p3/2 peaks of S, respectively [11], which should be connected with the adsorption of SO42− on Li2CO3 surface.
Figure 1c shows the morphology of the mommercial Li2CO3. Un-regular particles with a diameter of 1–10 μm were aggregated with each other, forming agglomerates with a diameter of about 35 μm.
Chemical analysis showed that the commercial Li2CO3 was composed of 99.15 wt % of Li2CO3, 0.8 wt % of SO42+, 0.0045 wt % of Ca2+ and 0.0187 wt % of Na+.

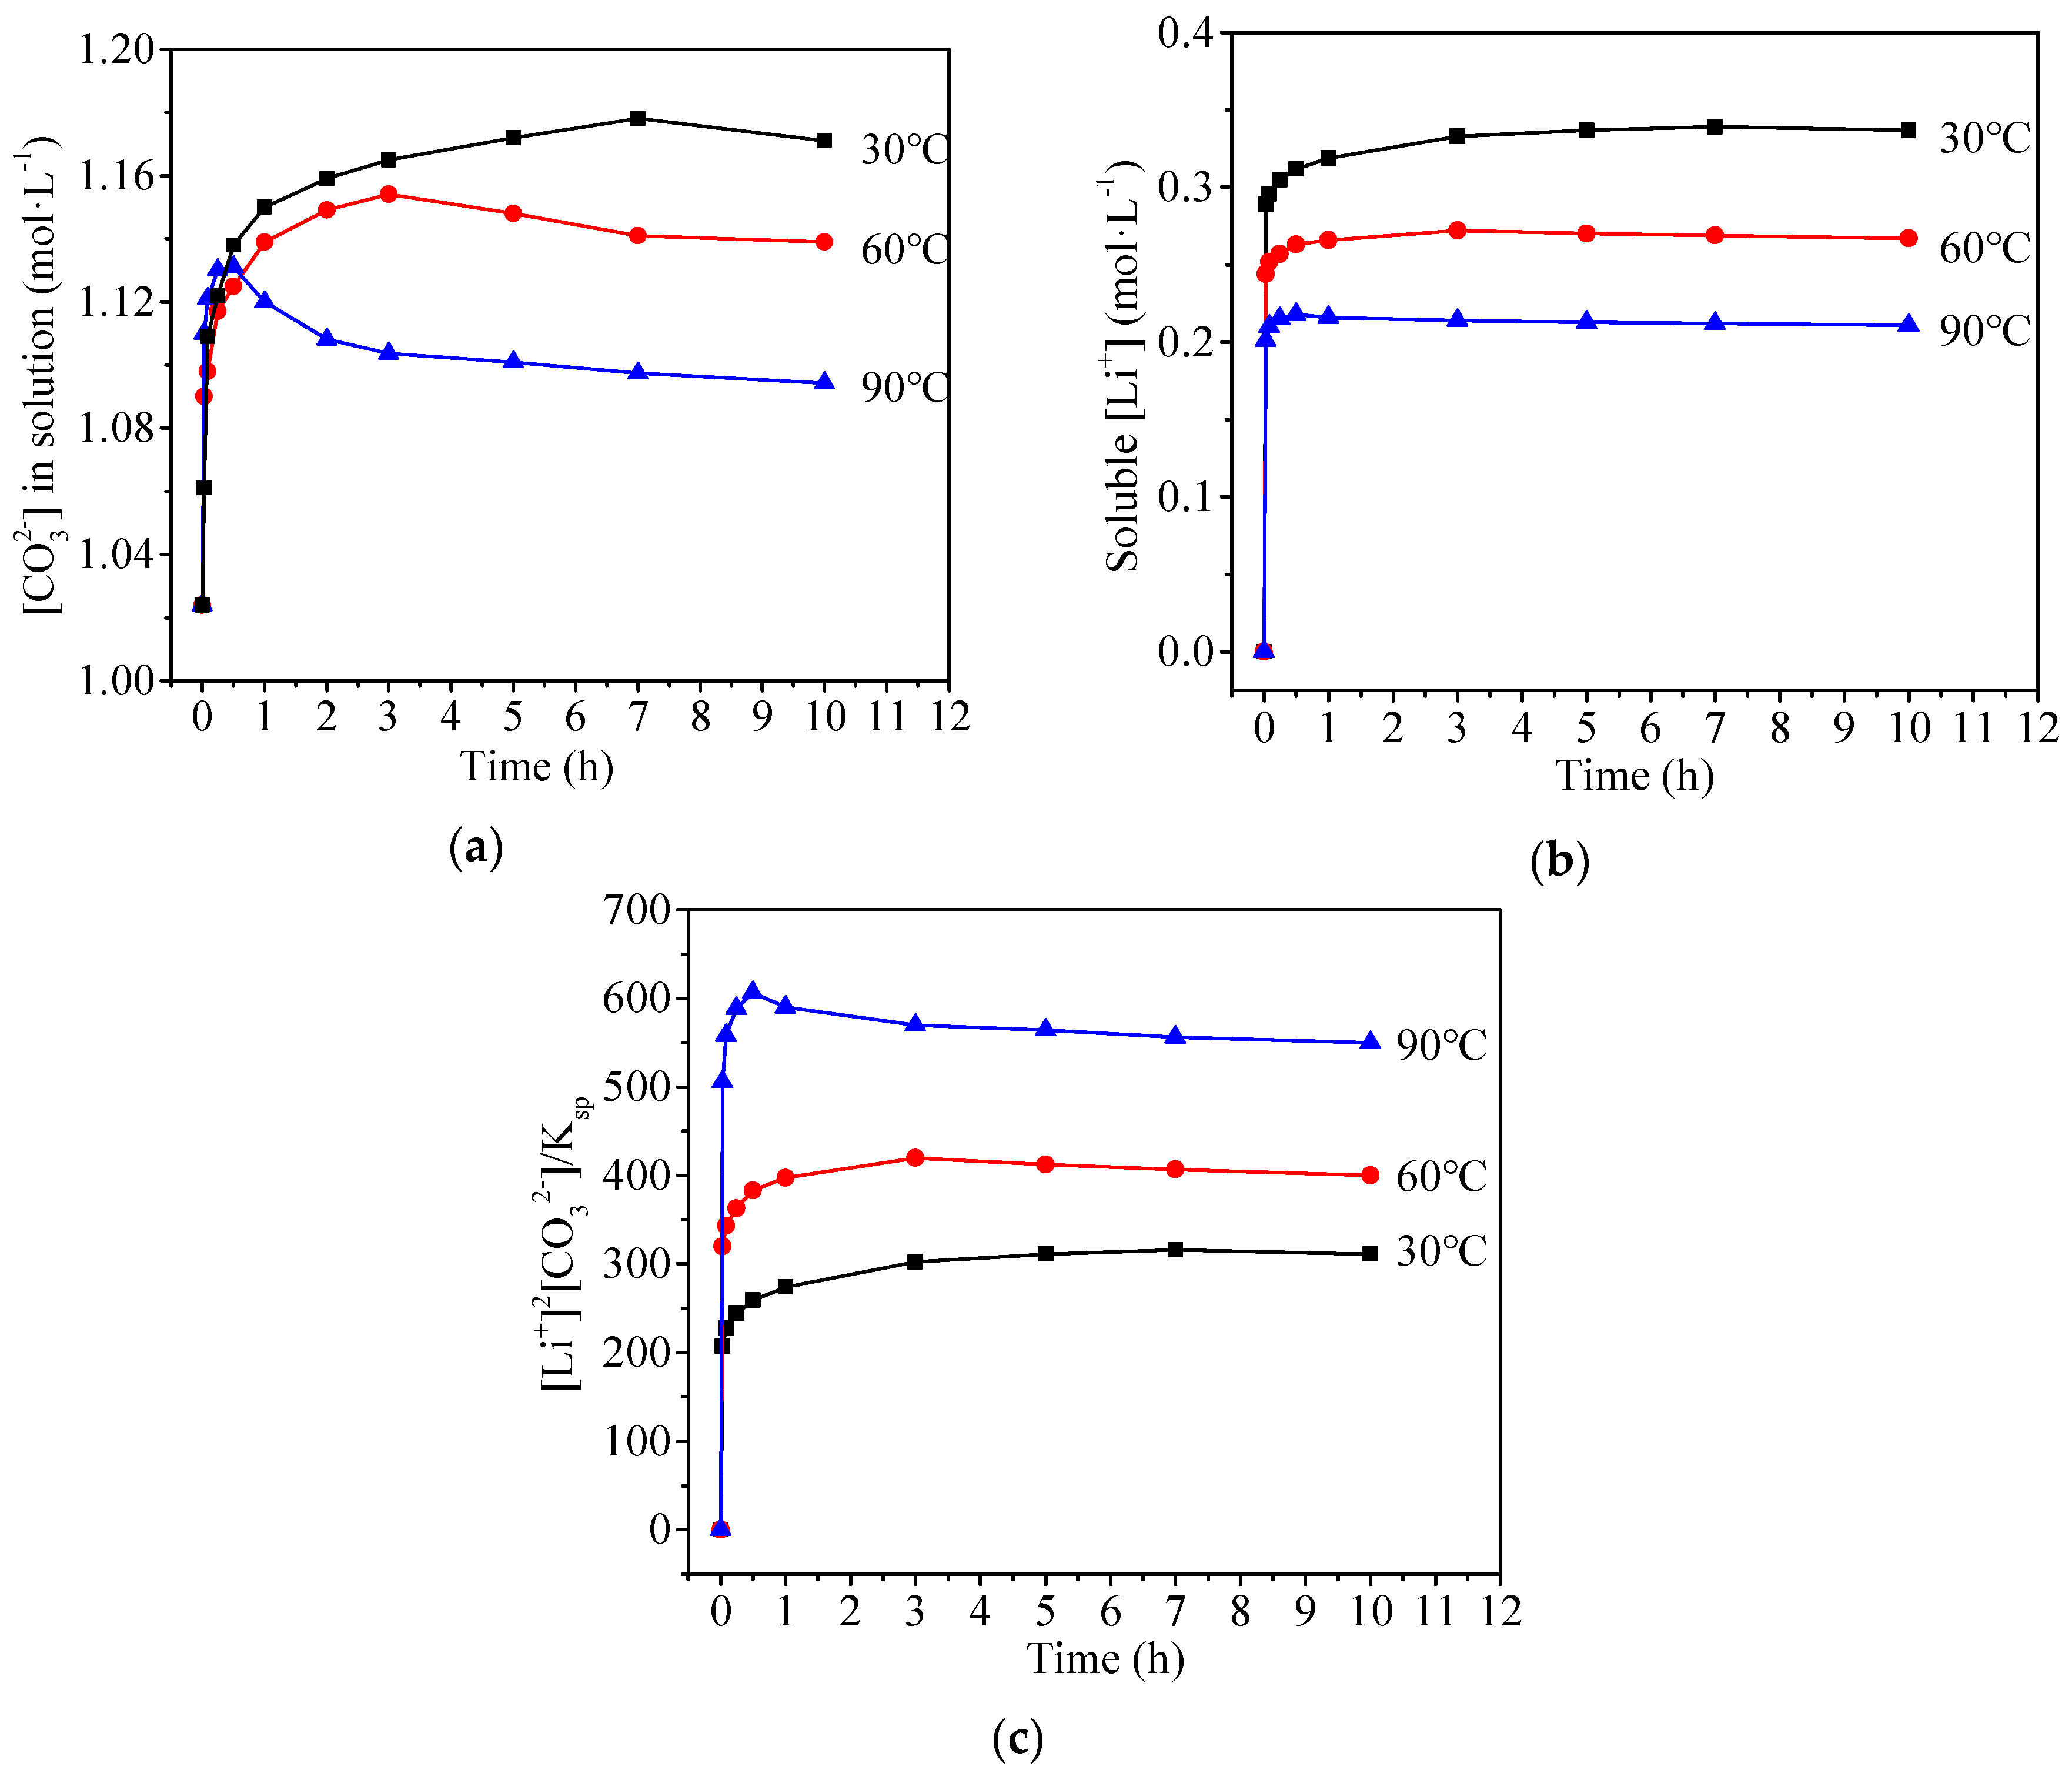
3.2. Recrystallization of Commercial Li2CO3

Figure 2a,b show the variations of the soluble [Li+] and [CO32] with reaction time at 30–90 °C. The initial quick increase of the soluble [Li+] and [CO32−] indicated that the dissolution of Li2CO3 was much faster than its precipitation at the initial stage, and the subsequent slight decrease of the soluble [Li+] and [CO32−] indicated that the precipitation of Li2CO3 was a little faster than its dissolution at the later time. The data in Figure 2a,b confirmed the recrystallization of Li2CO3 in Na2CO3 solution:
Li 2 CO 3 Li + + CO 3 2 Na 2 CO 3 Li 2 CO 3 .
Meanwhile, the comparatively low [Li+] and [CO32−] at high temperature could be attributed to the low solubility of Li2CO3 at high temperature (the solubility of Li2CO3 were 1.26 g·100 mL−1, 1.01 g·100 mL−1 and 0.72 g·100 mL−1 at 30 °C, 60 °C and 90 °C, respectively).
Figure 2c shows the variation of the supersaturation (the ratio of [Li+]2[CO32−] to Ksp of Li2CO3) with reaction time based on the data shown in Figure 2a,b. Ksp of Li2CO3 at 30 °C, 60 °C and 90 °C were 4.278 × 10⁻⁴, 2.031 × 10⁻⁴ and 8.864 × 10⁻⁵, respectively [12]. The comparatively high supersaturation at high temperature favored the quick precipitation of Li2CO3.

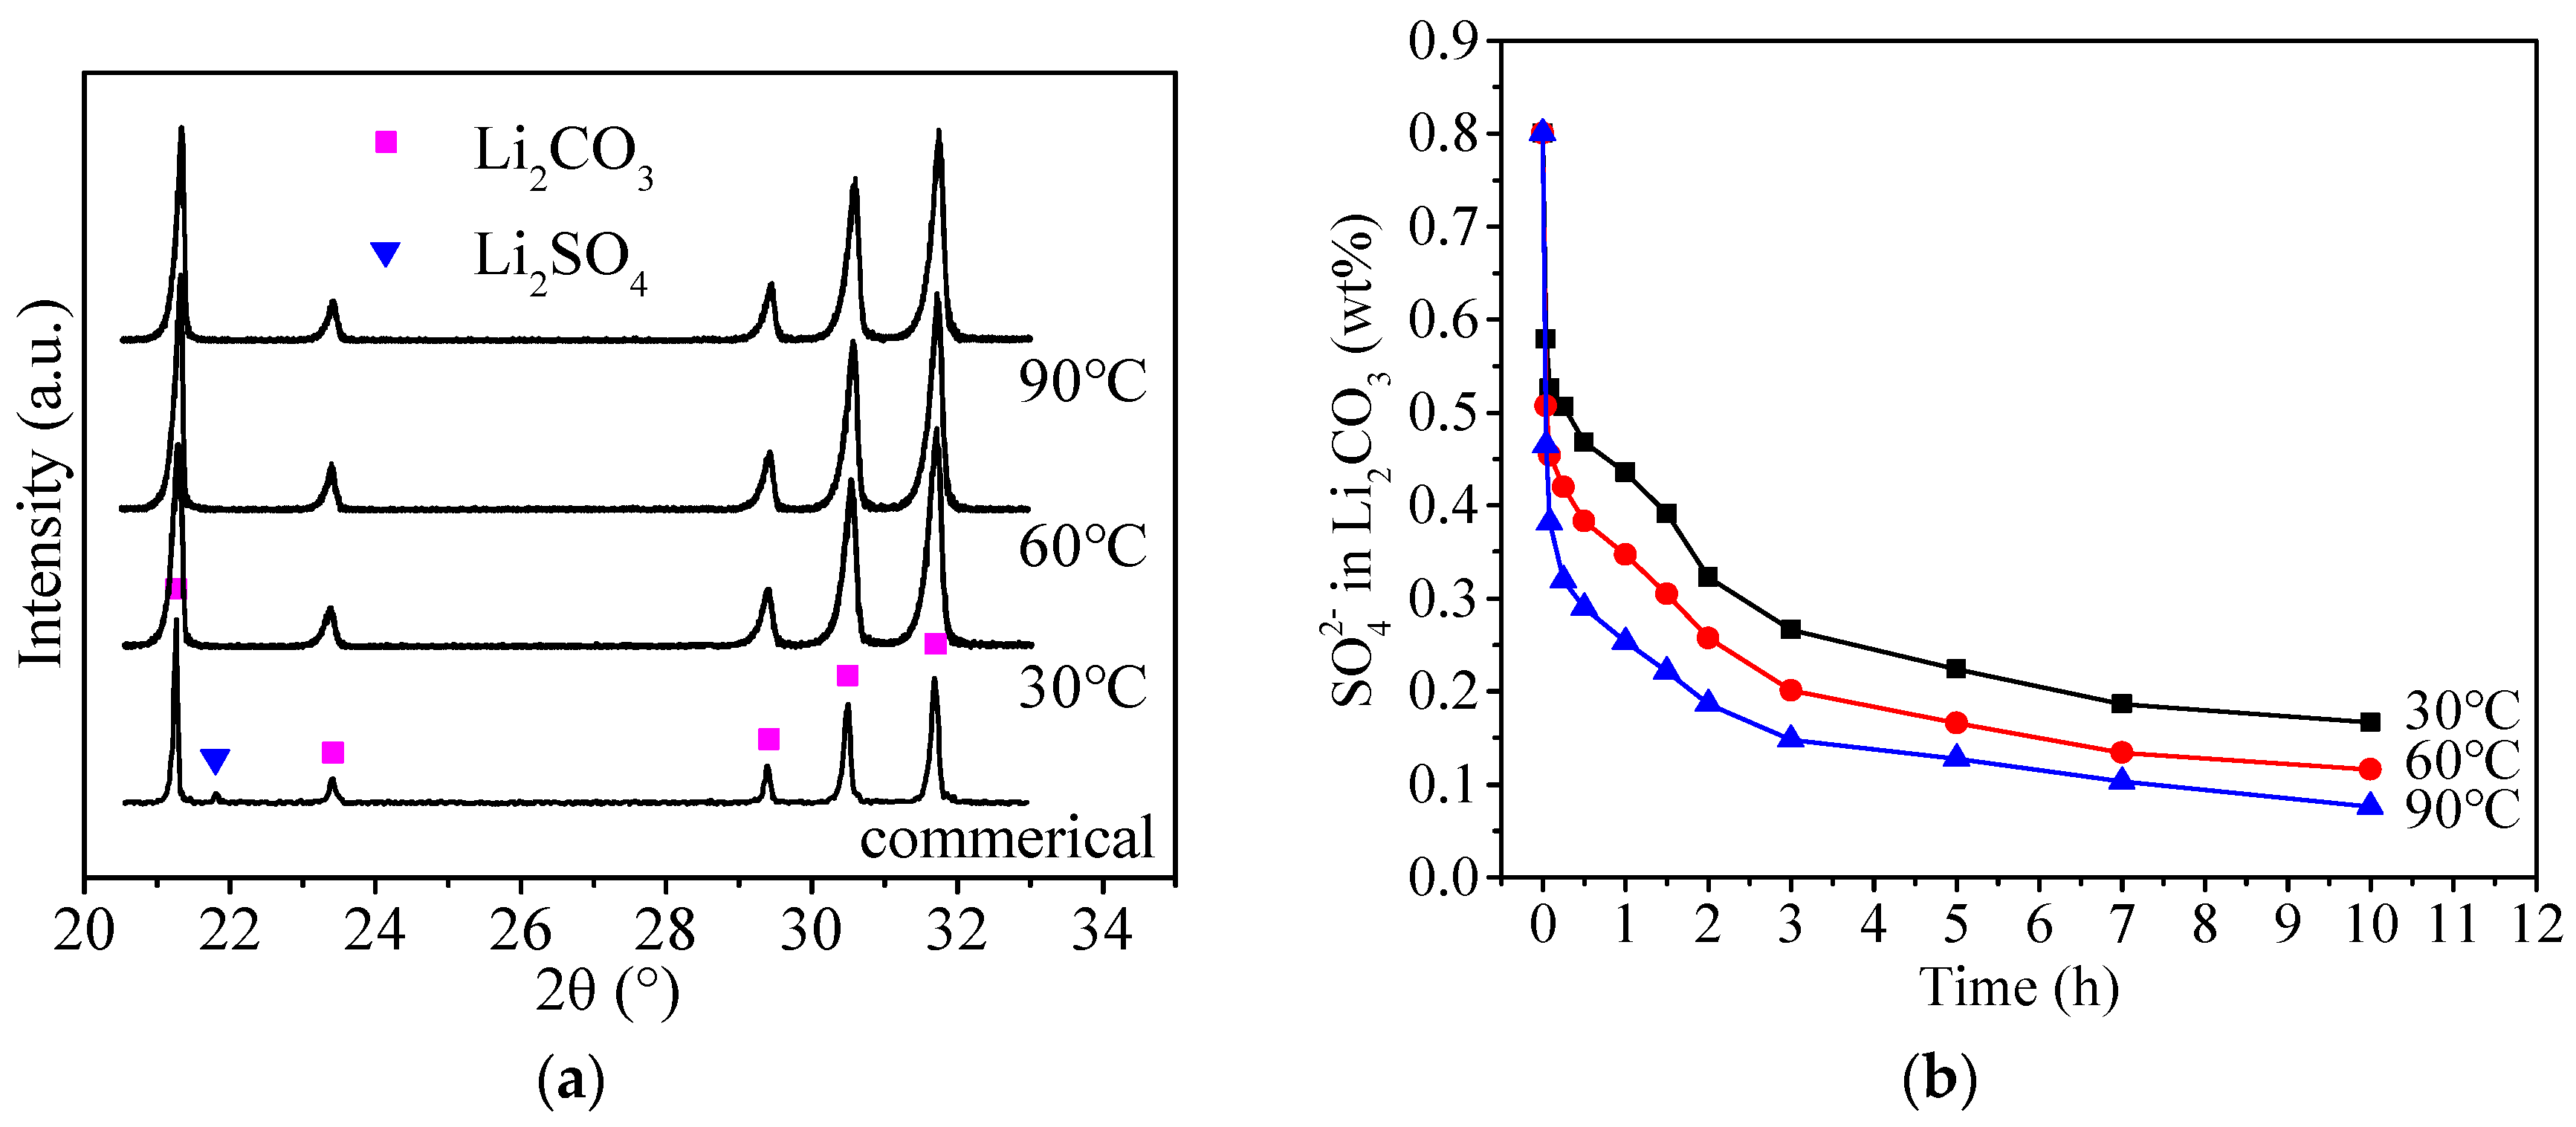
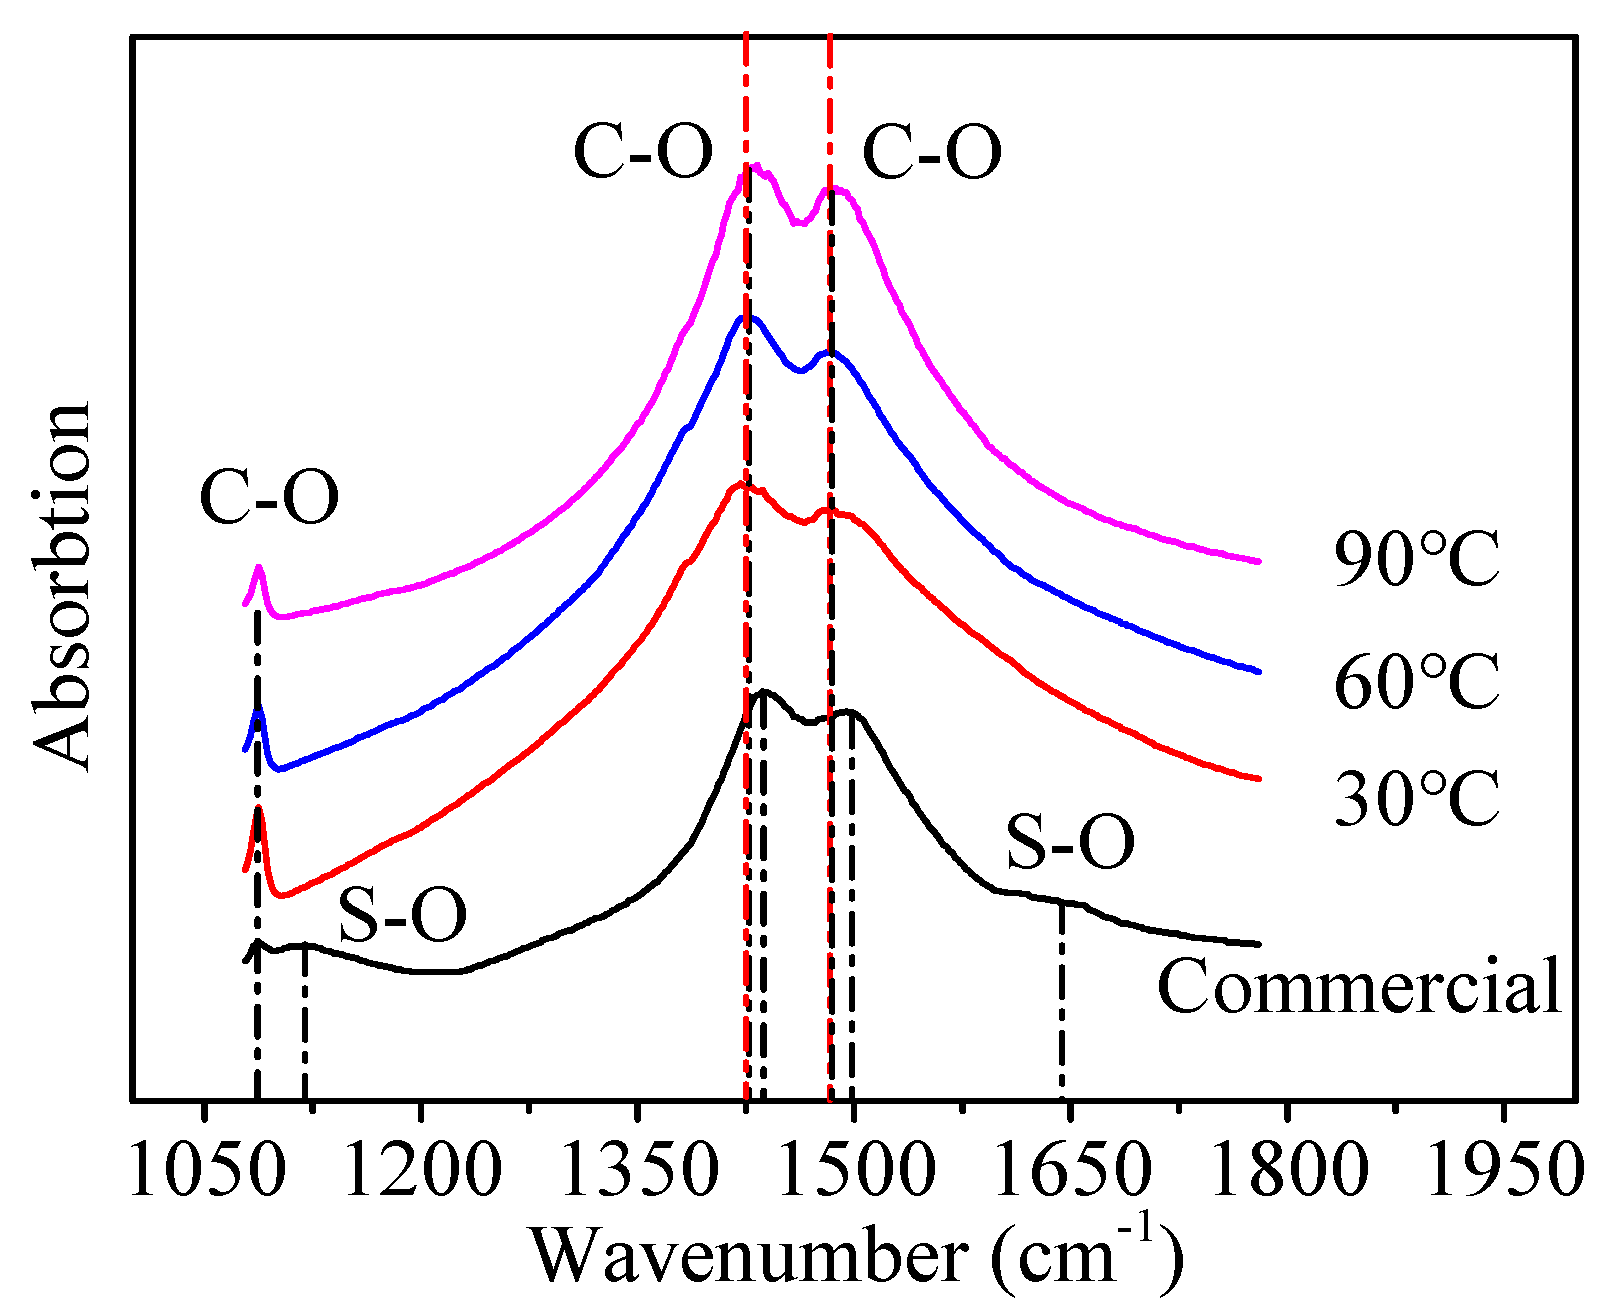
3.3. Removal of SO42− from Li2CO3

Figure 3a shows the XRD patterns of Li2CO3 before and after recrystallization. The disappearance of the Li2SO4 peak (located at 2θ = 21.76°) in the Li2CO3 samples after recrystallization at 30–90 °C indicated the removal of Li2SO4 from Li2CO3.
Figure 3b shows the variation of SO42− in Li2CO3 with reaction time at 30–90 °C. With the increase of reaction time, more and more SO42− was removed from Li2CO3, leading to the gradual decrease of SO42− in Li2CO3. The increase of temperature from 30 °C to 90 °C favored the removal of SO42− from Li2CO3. Chemical analysis showed that the purity Li2CO3 increase up to 99.8 wt %, the conversion ratio of the commercial Li2CO3 to Li2CO3 with high purity was 97.2 wt %, and the content of SO42− in Li2CO3 decreased to 0.08 wt % after treating the commercial Li2CO3 in 1.0 mol·L−1 Na2CO3 solution at 90 °C for 10.0 h.

3.3.1. Behavior of Adsorbed SO42

Figure 4 shows the FT-IR spectra of Li2CO3 before and after recrystallization in 1.0 mol·L−1 Na2CO3 solution at 30–90°C for 3.0 h. The peaks located at 1090 cm−1, 1430 cm−1 and 1482 cm−1 were attributed to the vibration of the symmetric (1090 cm−1) and antisymmetric (1430 cm−1 and 1482 cm−1) stretching vibrations of C-O bond in Li2CO3, respectively, while the peaks located at 1118 cm−1 and 1650 cm−1 were attributed to the symmetric (1118 cm−1) and antisymmetric (1650 cm−1) stretching vibrations of S-O bond of Li2SO4, respectively. The increase of temperature from 30 °C to 90 °C led to the enlargement of the peaks for Li2CO3 and the shrinkage of the peaks for SO42−, indicating the enhanced desorption of SO42− from Li2CO3 surface at elevated temperature. Comparing the data in Figure 1b with those in Figure 4, it was known that the peaks for the stretching vibration of C-O shifted from 1439 cm−1 and 1495 cm−1 for commercial Li2CO3 to 1430 cm−1 and 1482 cm−1 for purified Li2CO3, which should be attributed to the desorption of SO42− from Li2CO3 surface since the negative charges provided by SO42− weakened the polarity of Li+ in Li2CO3 [13,14], the desorption of SO42− thus enhanced the polarity of Li+ and led to the red shift of the C-O peaks in Li2CO3.
Figure 5 shows the XPS spectra of S2p in Li2CO3 samples before and after recrystallization in 1.0 mol·L−1 Na2CO3 solution at 30–90 °C for 3.0 h. As shown in Figure 5a, the S2p peaks located at 168.75 eV became much smaller after recrystallization at elevated temperatures, indicating the enhanced removal of SO42− at elevated temperatures. Table 1 shows the composition of Li2CO3 on surface and in bulk detected by XPS and ion chromatograph, respectively. The surface concentration of SO42 on surface was calculated by the equation (2). The atomic ratios of S to C on Li2CO3 surface decreased from 1:17.2 (for commercial Li2CO3) to 1:49.2, 1:61.3 and 1:88.2 (for the samples after crystallization at 30 °C, 60 °C and 90 °C, respectively). The data in Table 1 proved the concentrations of SO42− on surface were larger than those in the bulk, and the increase of temperature favored the desorption of SO42− from Li2CO3 surface.
Surface   concentration   of   Li 2 SO 4 = M ( SO 4 2 ) N ( C:S ) × M ( Li 2 CO 3 ) + M ( Li 2 SO 4 )

3.3.2. Behavior of Doped SO42

Figure 6 shows the XRD patterns of ( 1 ¯ 10 ), ( 2 ¯ 02 ) and (002) planes of Li2CO3 samples after crystallization in 1.0 mol·L−1 Na2CO3 solution at 30–90 °C for 3.0 h. The 2θ values of ( 1 ¯ 10 ) peaks were 21.267° at 30 °C, 21.298° at 60 °C and 21.309° at 90 °C, corresponding to the interplanar spacings of 4.1744 Å, 4.1684 Å and 4.1663 Å, respectively, according to the Bragg equation (2dsinθ = λ). The removal of the doped SO42− from Li2CO3 led to the decrease of the lattice distance of ( 1 ¯ 10 ) plane since the radius of SO42 (2.44 Å) was bigger than that of CO32 (1.64 Å). Similar phenomena occurred for ( 2 ¯ 02 ) and (002) planes: the 2θ values of ( 2 ¯ 02 ) peaks were 30.563° at 30 °C, 30.586° at 60 °C and 30.602° at 90 °C, corresponding to the interplanar spacings of 2.9225 Å, 2.9204 Å and 2.9189 Å, respectively, while the 2θ values of the (002) peaks were 31.755° at 30 °C, 31.73° at 60 °C and 31.788° at 90 °C, corresponding to the interplanar spacings of 2.8155 Å, 2.8137 Å and 2.8130 Å, respectively.
The crystallinities of Li2CO3 samples could be calculated out based on the half-widths (β) of the peaks of ( 1 ¯ 10 ), ( 2 ¯ 02 ) and (002) planes shown in Figure 5 and the Scherrer equation D = K λ / β c o s θ , where K = 0.86. The half-widths of ( 1 ¯ 10 ) peaks were 0.144° at 30 °C, 0.128° at 60 °C and 0.113° at 90 °C, corresponding to the crystal sizes of 55.5 nm, 62.5 nm and 70.8 nm, respectively. The increase of temperature favored the recrystallization of Li2CO3 and the formation of Li2CO3 with bigger sizes. Similar phenomena occurred for ( 2 ¯ 02 ) and (002): the half-widths of ( 2 ¯ 02 ) peaks were 0.222° at 30 °C, 0.208° at 60 °C and 0.187° at 90 °C, corresponding to crystal sizes of 36.7 nm, 39.2 nm and 43.61 nm, respectively, while the half-widths of (002) peaks were 0.261° at 30 °C, 0.229° at 60 °C and 0.195° at 90 °C, corresponding to crystal sizes of 31.33 nm, 35.71 nm and 41.94 nm, respectively.
The above work showed that the enhanced recrystallization of Li2CO3 at elevated temperature promoted the formation of Li2CO3 crystals with bigger sizes, which favored the desorption of the adsorbed SO42− and the removal of the doped SO42− from Li2CO3. The schematic diagram for the recrystallization of Li2CO3 is shown in Figure 6.

4. Conclusions

A facile method shown in Figure 7 was developed to purify commercial Li2CO3 containing 0.8 wt % of SO42− by recrystallization of the commercial Li2CO3 in Na2CO3 solution at 30–90 °C: Li 2 CO 3 Li + + CO 3 2 Na 2 CO 3 Li 2 CO 3 . The increase of temperature from 30 °C to 90 °C promoted the recrystallization of Li2CO3 and the formation of Li2CO3 crystals with bigger sizes, which favored the removal of SO42− adsorbed or doped on/in the commercial Li2CO3. The content of SO42− decreased to 0.08 wt % after treatment with the commercial Li2CO3 in 1 mol·L−1 Na2CO3 at 90 °C for 3.0 h.

Acknowledgments

The authors gratefully acknowledge the financial support from the National Science Foundation of China (No. 51774191, 51234003 and 51374138).

Author Contributions

Wei Cai and Ruosong Chen conceived the research idea; Wei Cai designed the experiments; Wei Cai and Yurong Yang performed the experiments and analyzed the data; Meigui Yi and Lan Xiang advised the experiments; all authors wrote the paper.

Conflicts of Interest

The authors declare no competing financial interests.

References

  1. Yan, Q. Extraction of lithium from lepidolite by sulfation roasting and water leaching. Int. J. Miner. Process. 2012, 110, 1–5. [Google Scholar] [CrossRef]
  2. Meshram, P.; Pandey, B.D. Extraction of lithium from primary and secondary sources by pre-treatment, leaching and separation: A comprehensive review. Hydrometallurgy 2014, 150, 192–208. [Google Scholar] [CrossRef]
  3. Luong, V.T.; Kang, D.J.; An, J.W.; Kim, M.J.; Tran, T. Factors affecting the extraction of lithium from lepidolite. Hydrometallurgy 2013, 134, 54–61. [Google Scholar] [CrossRef]
  4. Luong, V.T.; Kang, D.J.; An, J.W.; Dao, D.A.; Kim, M.J.; Tran, T. Iron sulphate roasting for extraction of lithium from lepidolite. Hydrometallurgy 2014, 141, 8–16. [Google Scholar] [CrossRef]
  5. Averill, W.A.; Olson, D.L. A review of extractive processes for lithium from ores and brines. Energy 1978, 3, 305–313. [Google Scholar] [CrossRef]
  6. Amouzegar, K.; Amant, G.S.; Harrison, S. Process for the Purification of Lithium Carbonate. U.S. Patent No. 6,048,507 A, 11 April 2000. [Google Scholar]
  7. Yi, W.; Yan, C.-Y.; Ma, P.-H.; Li, F.Q.; Wen, X.M. Refining of crude Li2CO3 via slurry phase dissolution using CO2. Sep. Purif. Technol. 2007, 56, 241–248. [Google Scholar] [CrossRef]
  8. Yi, W.-T.; Yan, C.-Y.; Ma, P.-H. Crystallization kinetics of Li2CO3 from LiHCO3 solutions. J. Cryst. Growth 2010, 312, 2345–2350. [Google Scholar] [CrossRef]
  9. Friedrich, H.; Pfeffinger, J.; Leutner, B. Method Producing Highly Pure Lithium Salts. U.S. Patent No. 6,592,832, 15 July 2003. [Google Scholar]
  10. Inorganic Chemistry, 4th ed.; Higher Education Press: Beijing, China, 2003; p. 151.
  11. Abraham, K.M.; Chaudhri, S.M. The lithium surface film in the Li/SO2 cell. J. Electrochem. Soc. 1986, 133, 1307–1311. [Google Scholar] [CrossRef]
  12. Sun, Y.; Song, X.-F.; Wang, J.; Luo, Y.; Yu, J.-G. Unseeded supersolubility of lithium carbonate: Experimental measurement and simulation with mathematical models. J. Cryst. Growth 2009, 311, 4714–4719. [Google Scholar] [CrossRef]
  13. Wan, S.Q.; Yi, Z.; Hao, Z.; Chia-Chung, S. Ab initio Investigation on Unhydrated Ion-associated Species between Na+, Li+, Mg2+ and SO42 Ions. Chem. J. Chin. Univ. 2012, 33, 1765–1770. [Google Scholar]
  14. Xu, C.Y.; Zhang, P.X.; Yan, L. Blue shift of Raman peak from coated TiO2 nanoparticles. J. Raman Spectrosc. 2001, 32, 862–865. [Google Scholar] [CrossRef]
Figure 1. (a) XRD; (b) XPS and (c) SEM patterns of commercial Li2CO3.
Crystals 08 00019 g001
Figure 2. Variation of (a) soluble [Li+]; (b) [CO32] and (c) supersaturation with reaction time.
Crystals 08 00019 g002
Figure 3. (a) XRD patterns of of Li2CO3 samples before and after recrystallization in Na2CO3 solution; (b) Variation of SO42− in Li2CO3 sample after recrystallization with reaction time.
Crystals 08 00019 g003
Figure 4. FT-IR spectra of Li2CO3 samples before and after recrystallization in Na2CO3 solution.
Crystals 08 00019 g004
Figure 5. XPS spectra of S2p in Li2CO3
Crystals 08 00019 g005
Figure 6. XRD spectra of ( 1 ¯ 10 ), ( 2 ¯ 02 ) and (002) planes of Li2CO3 samples after recrystallization in Na2CO3 solution.
Crystals 08 00019 g006
Figure 7. Schematic drawing for recrystallization of Li2CO3.
Crystals 08 00019 g007
Table 1. Composition of Li2CO3 on surface and in bulk.
Li2CO3 SamplesSurface CompositionSO42 on Surface (wt %)SO42 in Bulk (wt %)
Li (%)S (%)C (%)O (%)C:S
Commercial34.130.9416.1348.8017.167.10.8
Recrystallized at 30 °C34.090.3416.7148.8649.152.620.17
Recrystallized at 60 °C34.870.2817.1647.6961.292.110.12
Recrystallized at 90 °C33.900.1916.7649.1588.211.490.08

