Article

Microstructure Evolution of Ag-Alloyed PbTe-Based Compounds and Implications for Thermoelectric Performance

1
The Nancy and Stephen Grand Technion Energy Program (GTEP), Technion-Israel Institute of Technology, Haifa 32000, Israel
2
Department of Materials Science and Engineering, Technion-Israel Institute of Technology, Haifa 32000, Israel
3
Department of Materials Engineering, Faculty of Engineering Sciences, Ben-Gurion University of the Negev, Beer Sheva 84105, Israel
*
Author to whom correspondence should be addressed.
Crystals 2017, 7(9), 281; https://doi.org/10.3390/cryst7090281
Submission received: 17 August 2017 / Revised: 8 September 2017 / Accepted: 12 September 2017 / Published: 18 September 2017
(This article belongs to the Special Issue Materials Processing and Crystal Growth for Thermoelectrics)

Abstract

:
We investigate the microstructure evolution of Ag-alloyed PbTe compounds for thermoelectric (TE) applications with or without additions of 0.04 at. % Bi. We control the nucleation and temporal evolution of Ag2Te-precipitates in the PbTe-matrix applying designated aging heat treatments, aiming to achieve homogeneous dispersion of precipitates with high number density values, hypothesizing that they act as phonon scattering centers, thereby reducing lattice thermal conductivity. We measure the temperature dependence of the Seebeck coefficient and electrical and thermal conductivities, and correlate them with the microstructure. It is found that lattice thermal conductivity of PbTe-based compounds is reduced by controlled nucleation of Ag2Te-precipitates, exhibiting a number density value as high as 2.7 × 10²⁰ m−3 upon 6 h aging at 380 °C. This yields a TE figure of merit value of ca. 1.4 at 450 °C, which is one on the largest values reported for n-type PbTe compounds. Subsequent aging leads to precipitate coarsening and deterioration of TE performance. Interestingly, we find that Bi-alloying improves the alloys’ thermal stability by suppressing microstructure evolution, besides the role of Bi-atoms as electron donors, thereby maintaining high TE performance that is stable at elevated service temperatures. The latter has prime technological significance for TE energy conversion.

1. Introduction

Lead-telluride (PbTe) based compounds are common thermoelectric (TE) materials for the mid-temperature range (600–800 K) [1]. These narrow band-gap semiconductors (ca. 0.3 eV at room temperature), which have been thoroughly investigated, offer unique combination of high Seebeck coefficient, S, with relatively high electrical conductivity, σ , and low thermal conductivity, κ . Owing to this combination, single-phase PbTe exhibits a maximum dimensionless TE figure of merit (ZT) value of ca. 0.8 [2,3], which can approach ca. 2.0 owing to doping and nanostructuring [4,5,6]. The lattice thermal conductivity of PbTe is typically 2.2 Wm−1K−1 at room temperature [7,8], which is yet far away from the theoretical alloy limit [9]. This opens up prospects for tuning the TE performance by introducing lattice defects.
Reports indicate that phonons having low- to mid-range frequencies (i.e., mid- to long-wavelength range) can be significantly scattered by nanostructured features, such as precipitates [10], whereas high-frequency phonons (i.e., of short wavelengths) are scattered by point defects mainly, e.g., solute atoms and vacancies [11]. In this sense, besides achieving direct enhancement of the TE performance, understanding basic physical behavior of lattice thermal conductivity of two-phase alloys based on PbTe is a grand challenge by itself. This may be achieved by distinction between the effects of nano-particles volume fraction, number density, and average size—on the one hand, and those of the matrix composition—on the other hand [12,13]. Thorough investigations of the microstructure formed in PbTe-based ternary and quaternary systems, including its temporal evolution and effects on TE behavior, have been reported [14,15,16,17,18,19,20,21]. Such effects were particularly studied for Ag-alloyed PbTe compounds as well [22,23,24,25,26]. Nevertheless, neither of these studies introduces systematic investigations of the effects of second-phase precipitates’ volume fraction, number density, and average size, as well as their temporal evolution, on TE transport properties of PbTe-based alloys.
In this study, we focus on Ag-alloyed PbTe-based systems having the potential to form Ag2Te-precipitates dispersed in the PbTe-based solid solution. We perform controlled aging heat treatments at different temperatures and durations to enhance nucleation of Ag2Te-precipitates for directly reducing lattice thermal conductivity. It is hypothesized that aging should yield increased nucleation of Ag2Te-precipitates up to a time limit where over-aging processes take place [27], which is accompanied by changes in the PbTe-based matrix average composition. The side-effects on other TE transport properties and, in general, on TE performance are also examined. This approach was demonstrated by us recently for a ZnO-based system, with clear conclusions regarding TE performance [28]. In this context, we cope with two main challenges that concern the materials synthesis process, which are optimization of heat treatment conditions and selection of the processing routes, such as powder pressing and fast cooling, and highlight the essence of these factors in determination of the TE performance. Herein, knowledge of the temporal evolution of PbTe-matrix/Ag2Te-precipitates system’s microstructure upon aging will serve for improvement of the TE performance of PbTe-based compounds.

2. Experimental Procedure

2.1. Materials Synthesis

In this study we report on two classes of materials; the first one is synthesized by casting, and the second one by hot-pressing.
As-cast (AC) compounds are synthesized from pure elemental Pb powder (99.96%, Riedel-de Haën®, Hanover, Germany), Te ingots (99.99%, STREM CHEMICALS®, Newburyport, MA, USA), and Ag shots (99.999%, Alfa Aesar®) by mixing in the appropriate molar ratios to obtain the average composition of (PbTe)0.95(Ag2Te)0.05. We choose this composition since it is within the single-phase regime at temperatures above 600 °C, and is expected to decompose into a two-phase mixture, namely Ag2Te + PbTe, in a solid-state precipitation process at lower temperatures. The pure Pb-, Te-, and Ag-raw materials are poured into a 12.5 dia. quartz ampoule, which is evacuated and refilled with a 120 torr Ar-7% H2 gas mixture to avoid oxidation. The sealed ampoule is subsequently heated to 1000 °C for 2 h in a vertical programmable tube furnace to enable melting. Termination of the melting is performed by quenching in iced-water bath, followed by annealing at 700 °C for 24 h to homogenize the solid solution at the single-PbTe-phase regime and, finally, quenching in an iced-water bath. In order to precipitate the Ag2Te-phase from the solid solution, the ingot is sliced to disk-shape specimens, ca. 2 mm thick, and aged at 400 and 450 °C for different durations, as listed in Table 1, in sealed evacuated ampoules to enable us obtain Ag2Te-precipitates of different sizes and number densities dispersed in the PbTe-based solid solution.
Hot-pressed (HP) specimens of the (PbTe)0.97(Ag2Te)0.03 base composition are prepared in two batches; the first one does not contain Bi, and the second one contains 0.04 at. % Bi. These compositions and synthesis method are chosen in a way that allows us to prepare single-phase supersaturated specimens that are mechanically robust to sustain subsequent TE measurements. First, granules of Pb, Te, Ag, and Bi (99.5%, LOBA CHEMIE®, Mumbai, India) are mixed in the appropriate fractions and undergo repeated arc melting processes. Then, the solid solution is grinded into fine powder and heated up to 650 °C (within the single-phase regime) under a pressure of 21 MPa for 0.5 h in a 30 mm dia. die, and then cut into 12.5 mm dia. disks. Then, the specimens are aged at 380 °C for different durations, as listed in Table 1, in sealed and evacuated ampoules under a 120 torr Ar-7% H2 atmosphere to initiate nucleation of the Ag2Te-phase, followed by iced-water quenching.

2.2. Characterization Methods

2.2.1. Microstructure Analysis

We apply powder X-ray diffraction (XRD) to determine the phases present in the heat treated ingots. Measurements are carried out using a SmartLab® XRD diffractometer (Rigaku, The Woodlands, TX, USA) with an angular resolution of 0.02°, applying Cu-Kα radiation at the angular range of 2θ = 20–120°. Data are collected with angular scanning resolution of 0.03° per step. Microstructure characterization of the samples is carried out using a Ultra Plus® high-resolution scanning electron microscope (Zeiss, Oberkochen, Germany) (HRSEM) equipped with an 80 mm2 active area Oxford® SDD electron dispersive spectroscopy (EDS) detector with an energy resolution of 127 eV, equipped with a Schottky field-emission electron gun. In some cases, metallographic polishing of the specimens’ surface is carried out by ion milling employing a Helios NanoLab DualBeam® (FEI, Hillsboro, OR, USA) G3 UC dual beam focused ion beam (FIB) to reveal the microstructure features. All micrographs presented in this study are acquired using either secondary or backscattered signals, to be specified further below, operated in the range between 3 and 15 kV. Finally, the precipitate number density, Nv, defined as number per unit volume, is determined based on the two-dimensional HRSEM micrographs showing the Ag2Te-precipitates in a contrast that differs from that of the PbTe-based matrix, following the methodology introduced by us elsewhere [28].

2.2.2. Thermoelectric Property Measurements

We employ the laser flash analysis (LFA) technique, using an LFA-457 MicroFlash® apparatus (Netzsch, Selb, Germany), to directly measure the thermal diffusivity, α , of disk-shaped specimens at the temperature range of 25 through 600 or 700 °C, depending on the material. The thermal conductivity is then calculated from the relationship:
κ ( T ) = α ( T ) ρ C p ( T )
where ρ is the material’s bulk density as evaluated from the sample dimensions and mass, and its temperature dependence is neglected. C p is the heat capacity, measured indirectly using the LFA with respect to a standard made of pyroceram 9606 or pure alumina. Electrical conductivity and Seebeck coefficient values are measured employing an SBA-458 Nemesis® system (Netzsch, Selb, Germany) for specimens having the same geometry as for the LFA. All of the measurements are carried out under flowing Ar as a protective atmosphere.

3. Results

3.1. Microstructure Characterization

We perform XRD analysis for specimens that were hot-pressed prior to aging heat treatments to assure that the material is a PbTe-based solid solution single phase, or does not contain considerable amount of Ag2Te-precipitates. Figure 1 presents an XRD pattern collected from a hot-pressed specimen of the (PbTe)0.97(Ag2Te)0.03 composition, which did not undergo further aging heat treatments. The fully-indexed XRD pattern implies that the material is a single PbTe-phase.
HRSEM analysis is performed for all of the specimens to characterize their microstructures. Figure 2 displays selected HRSEM micrographs taken from the HP series of specimens with or without Bi. It is noteworthy that, first, the presence of elongated Ag2Te-precipitates is apparent for the specimens that were not aged, although they were iced-water quenched and are expected to comprise a single PbTe solid solution phase. EDS analysis was carried out for additional specimens to validate the Ag2Te-stoichiometry. The average concentrations inferred from analysis of several large precipitates is 61.7 ± 1.1 at. % Ag; 38.0 ± 1.1 at. % Te; Pb bal. The number densities of these Ag2Te-precipitates are, however, relatively small. Second, the Bi-free specimens exhibit precipitate number density that increases up to 6 h aging, then decreases up to 48 h aging, whereas the Bi-alloyed specimens exhibit relatively low precipitate number densities that do not change significantly with aging time. For example, quantitative analysis indicates that Nv exceeds values as great as 2.8 × 10¹⁷ and 2.7 × 10²⁰ m−3 after 6 h aging of the Bi-alloyed and Bi-free materials, respectively. The respective number densities reached after 48 h aging are 8.1 × 10¹⁶ and 1.1 × 10¹⁹ m−3. It is also shown that the Bi-alloyed specimens preserve the morphology of elongated precipitates over aging time, whereas the precipitate morphology in the Bi-free specimens evolves toward a spheroidal one. This transition takes place between 4 and 6 h aging.
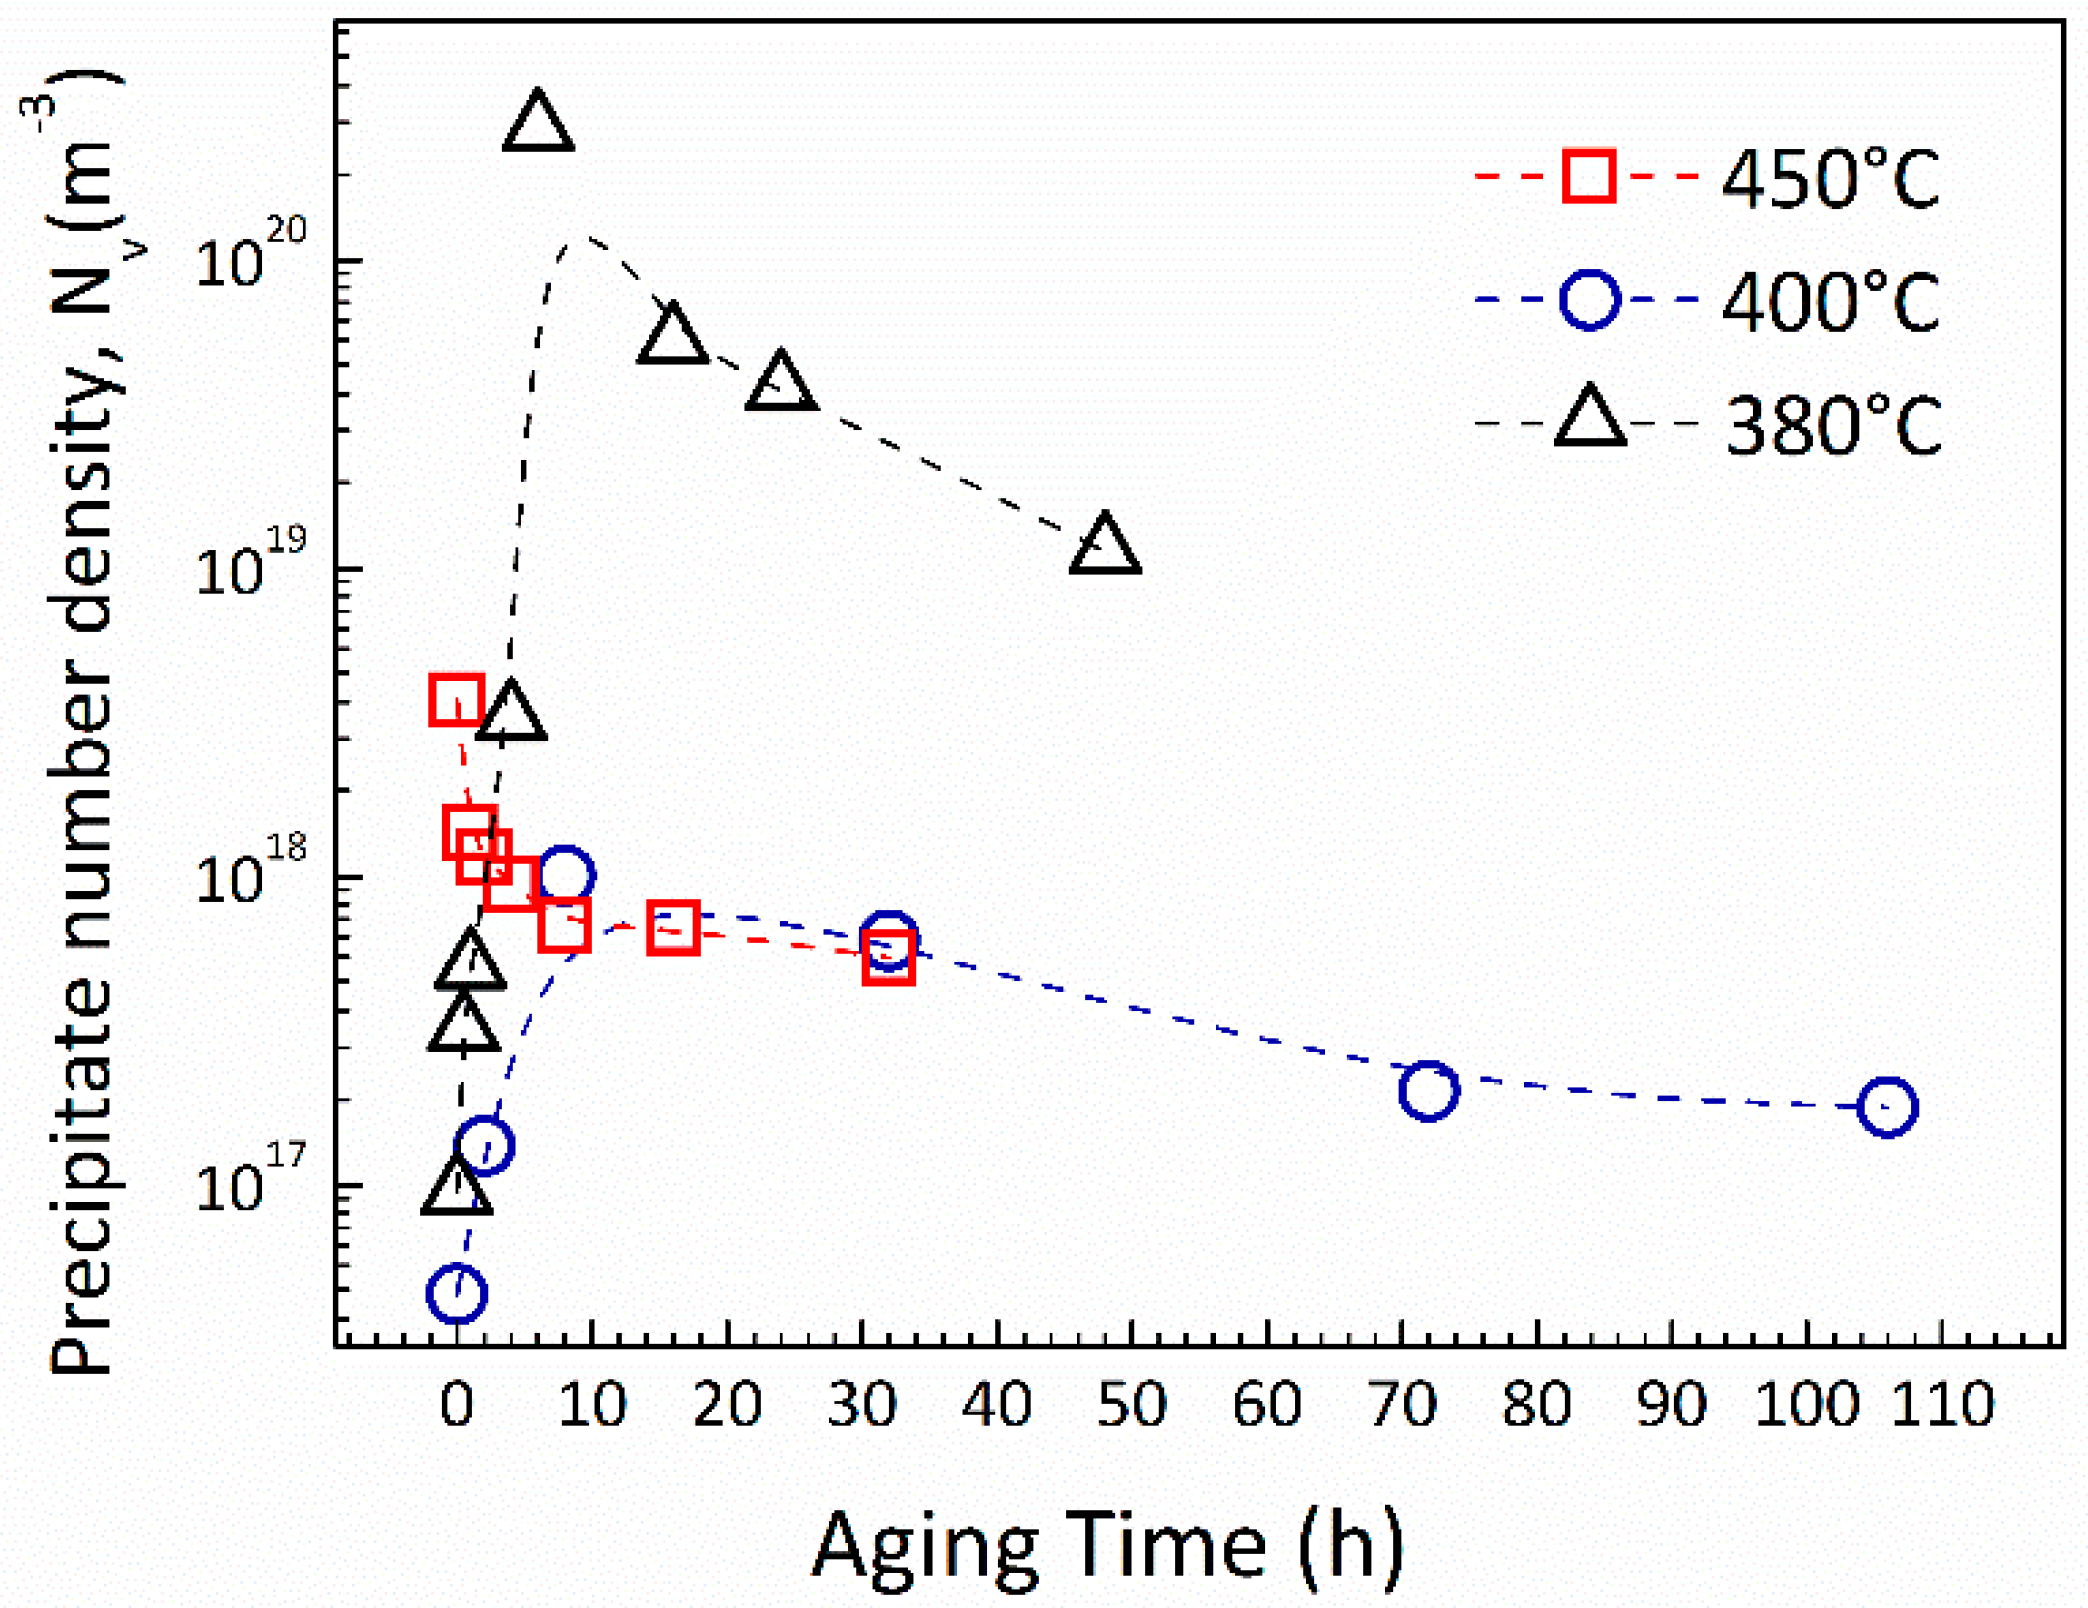
Figure 2 indicates that the Bi-free specimens exhibit strong dependence of the microstructure on aging time, implying that their TE transport coefficients can be modified and controlled more easily compared to the Bi-alloyed ones. To draw conclusions on the microstructure temporal evolution of these specimens on a quantitative basis, we evaluate the number densities of Ag2Te-precipitates for the Bi-free HP specimens aged at 380 °C, and compare them with those acquired from the AC specimens aged at 400 and 450 °C. The Nv-values for these specimens are plotted against aging time, and are shown in Figure 3.
It is shown that the Nv-values of the AC specimens that were aged at 450 °C decrease with aging time, and reach at an asymptotic value, a behavior typical for coarsening or “over-aging” [27]. The 400 °C- and 380 °C-aged ones, however, exhibit a different trend, which is more desirable for design of TE properties: a maximum value of Nv is achieved for each series.

3.2. Thermoelectric Transport Properties

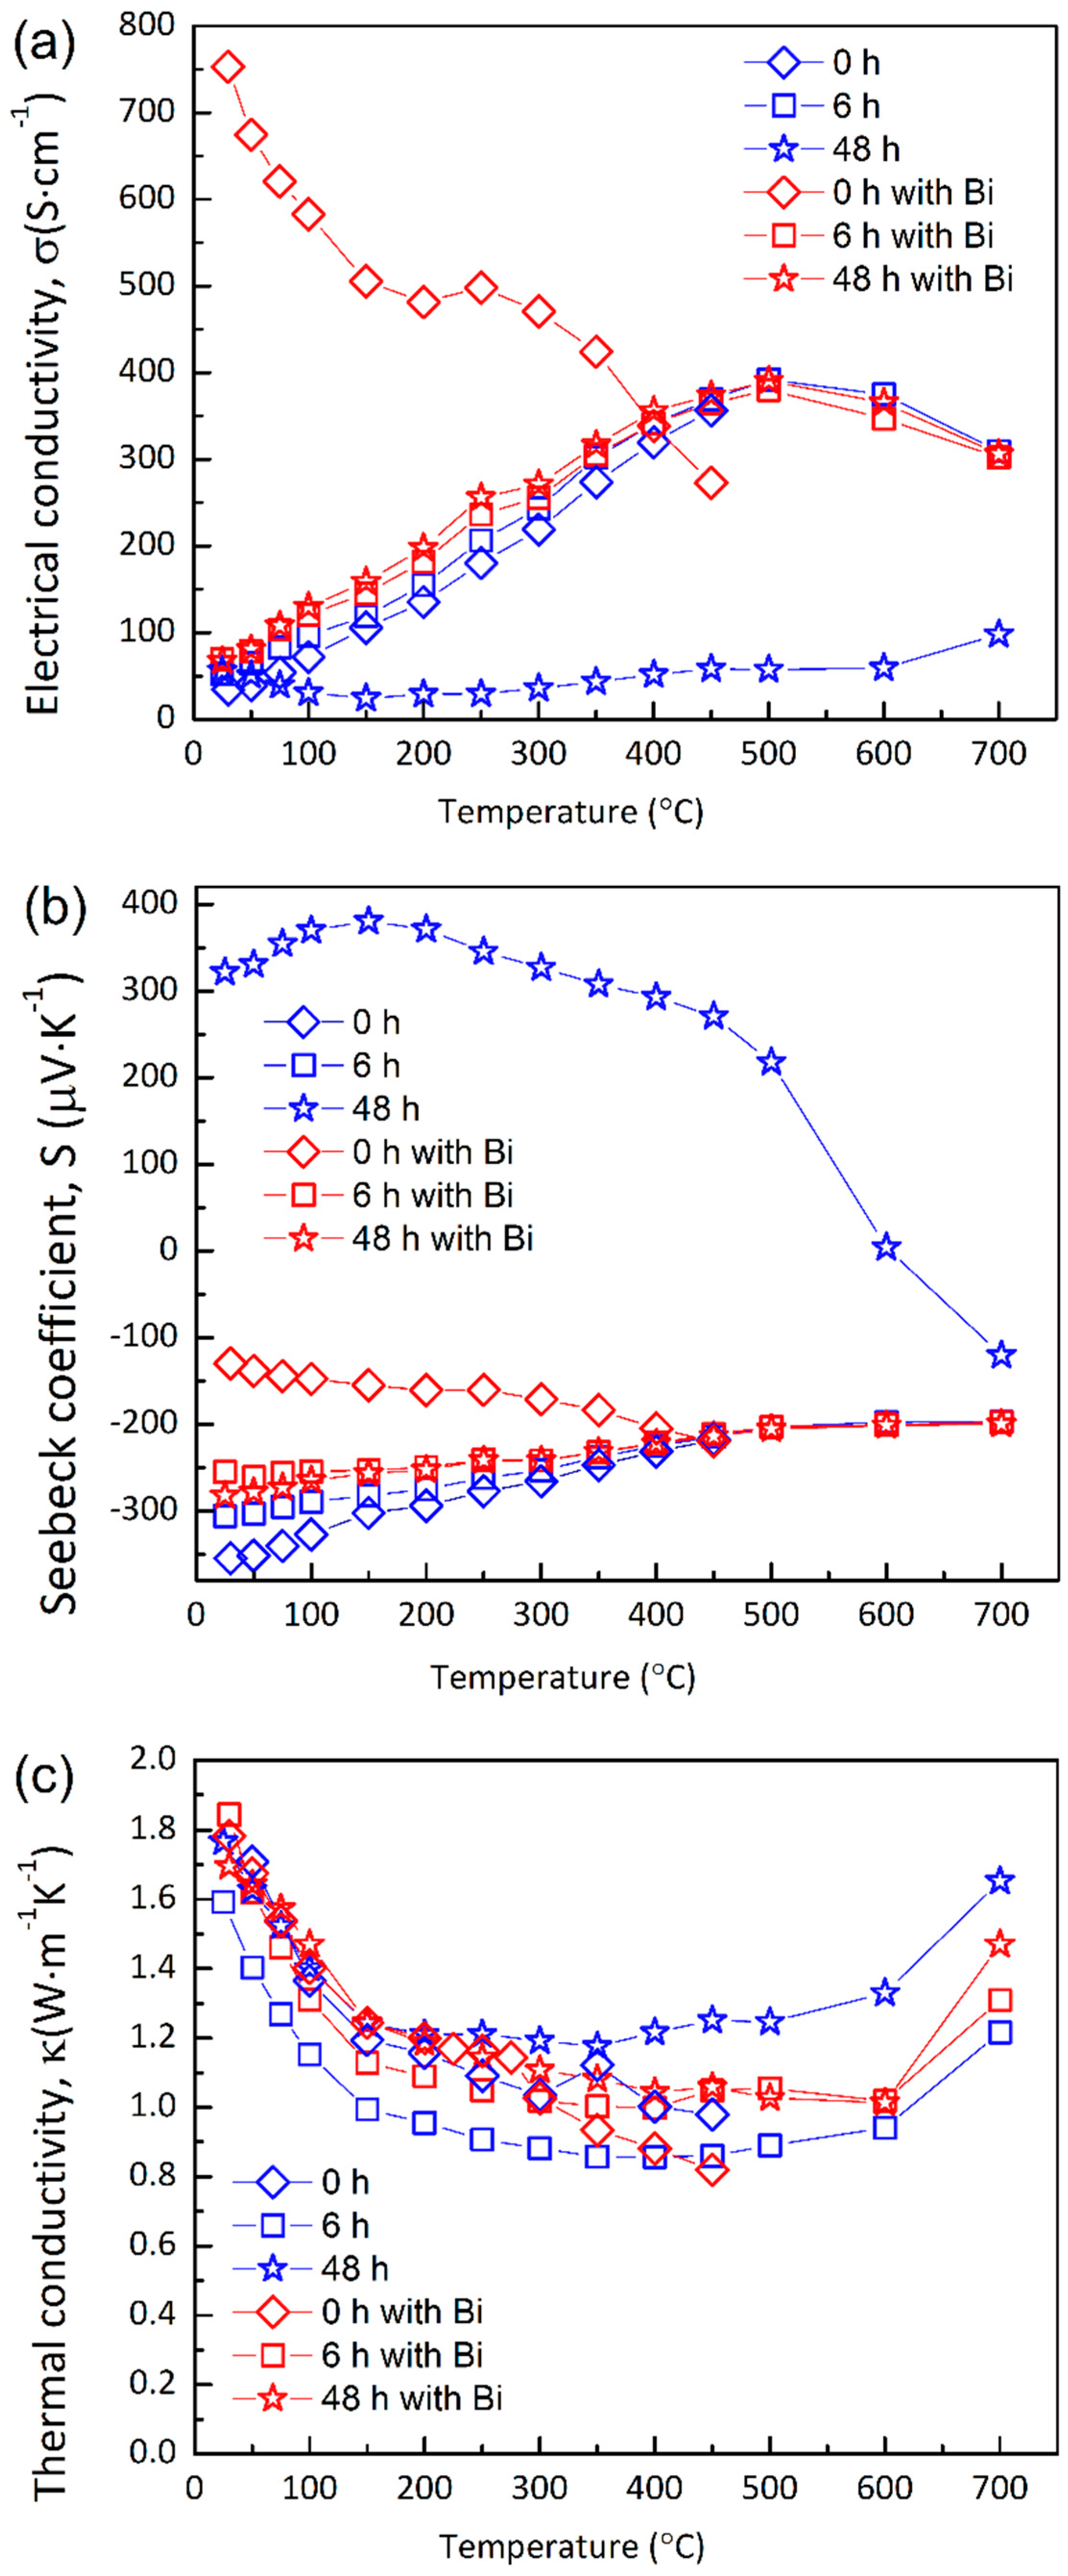
The temperature dependent electrical conductivity and Seebeck coefficient values are measured for the HP series of specimens aged for different durations, with or without Bi-additions. Selected results are displayed in Figure 4a,b, respectively. The electrical conductivity values exhibit a general trend of increase with increasing temperature, typical for a semiconducting behavior, with an exception for the as-quenched Bi-alloyed material that indicates decrease in the electrical conductivity from a value of ca. 750 S·cm−1, typical for a metallic behavior. Also, this general trend is less pronounced for the Bi-free materials aged for 48 h. These trends will be discussed further below.
It is also indicated that most of the Bi-doped samples exhibit electrical conductivity values that are slightly higher than those of their undoped counterparts up to 450 °C.
Figure 4b presents the Seebeck coefficient values vs. temperature, in which the trend is opposite to that of the electrical conductivity, as expected. Most samples show decrease in the absolute values of the Seebeck coefficient as the temperature increases up to 450 °C. Additionally, it is shown that all samples except one exhibit negative values, indicating their n-type polarity. As expected, the Bi-doped compounds possess lower absolute values of Seebeck coefficients compared to those of their undoped counterparts, due to increased charge carrier concentrations. Interestingly, at temperatures higher than ca. 450 °C, the curves describing the doped and undoped states converge.
Thermal conductivity values are evaluated based on Equation (1) by direct measurements of thermal diffusivity and room temperature values of the materials’ densities, which are listed in Table 2 for the HP series. Selected results appear in Figure 4c. All κ ( T ) -curves exhibit similar values and trends.
The bulk density is 7.60 g·cm−3 on average for the AC series. To evaluate the effects of Ag2Te-precipitates on thermal conductivity via phonon scattering mechanism, it is required to derive the lattice component of thermal conductivity, κ l . This is implemented applying the following relationship:
κ = κ e + κ l
where κ e is the electronic component of thermal conductivity, and is evaluated relying on the measured electrical conductivity, Figure 4a, utilizing the Wiedemann-Franz relationship [29]:
κ e = L σ T
where L is evaluated using a semi-empirical expression derived by Kim et al. [30], and is a function of S. It is valid for deviations from the degenerate limit, and was validated for PbTe-based compounds, as well. We calculate L for all samples and temperatures utilizing the measured S-values appearing in Figure 4b.
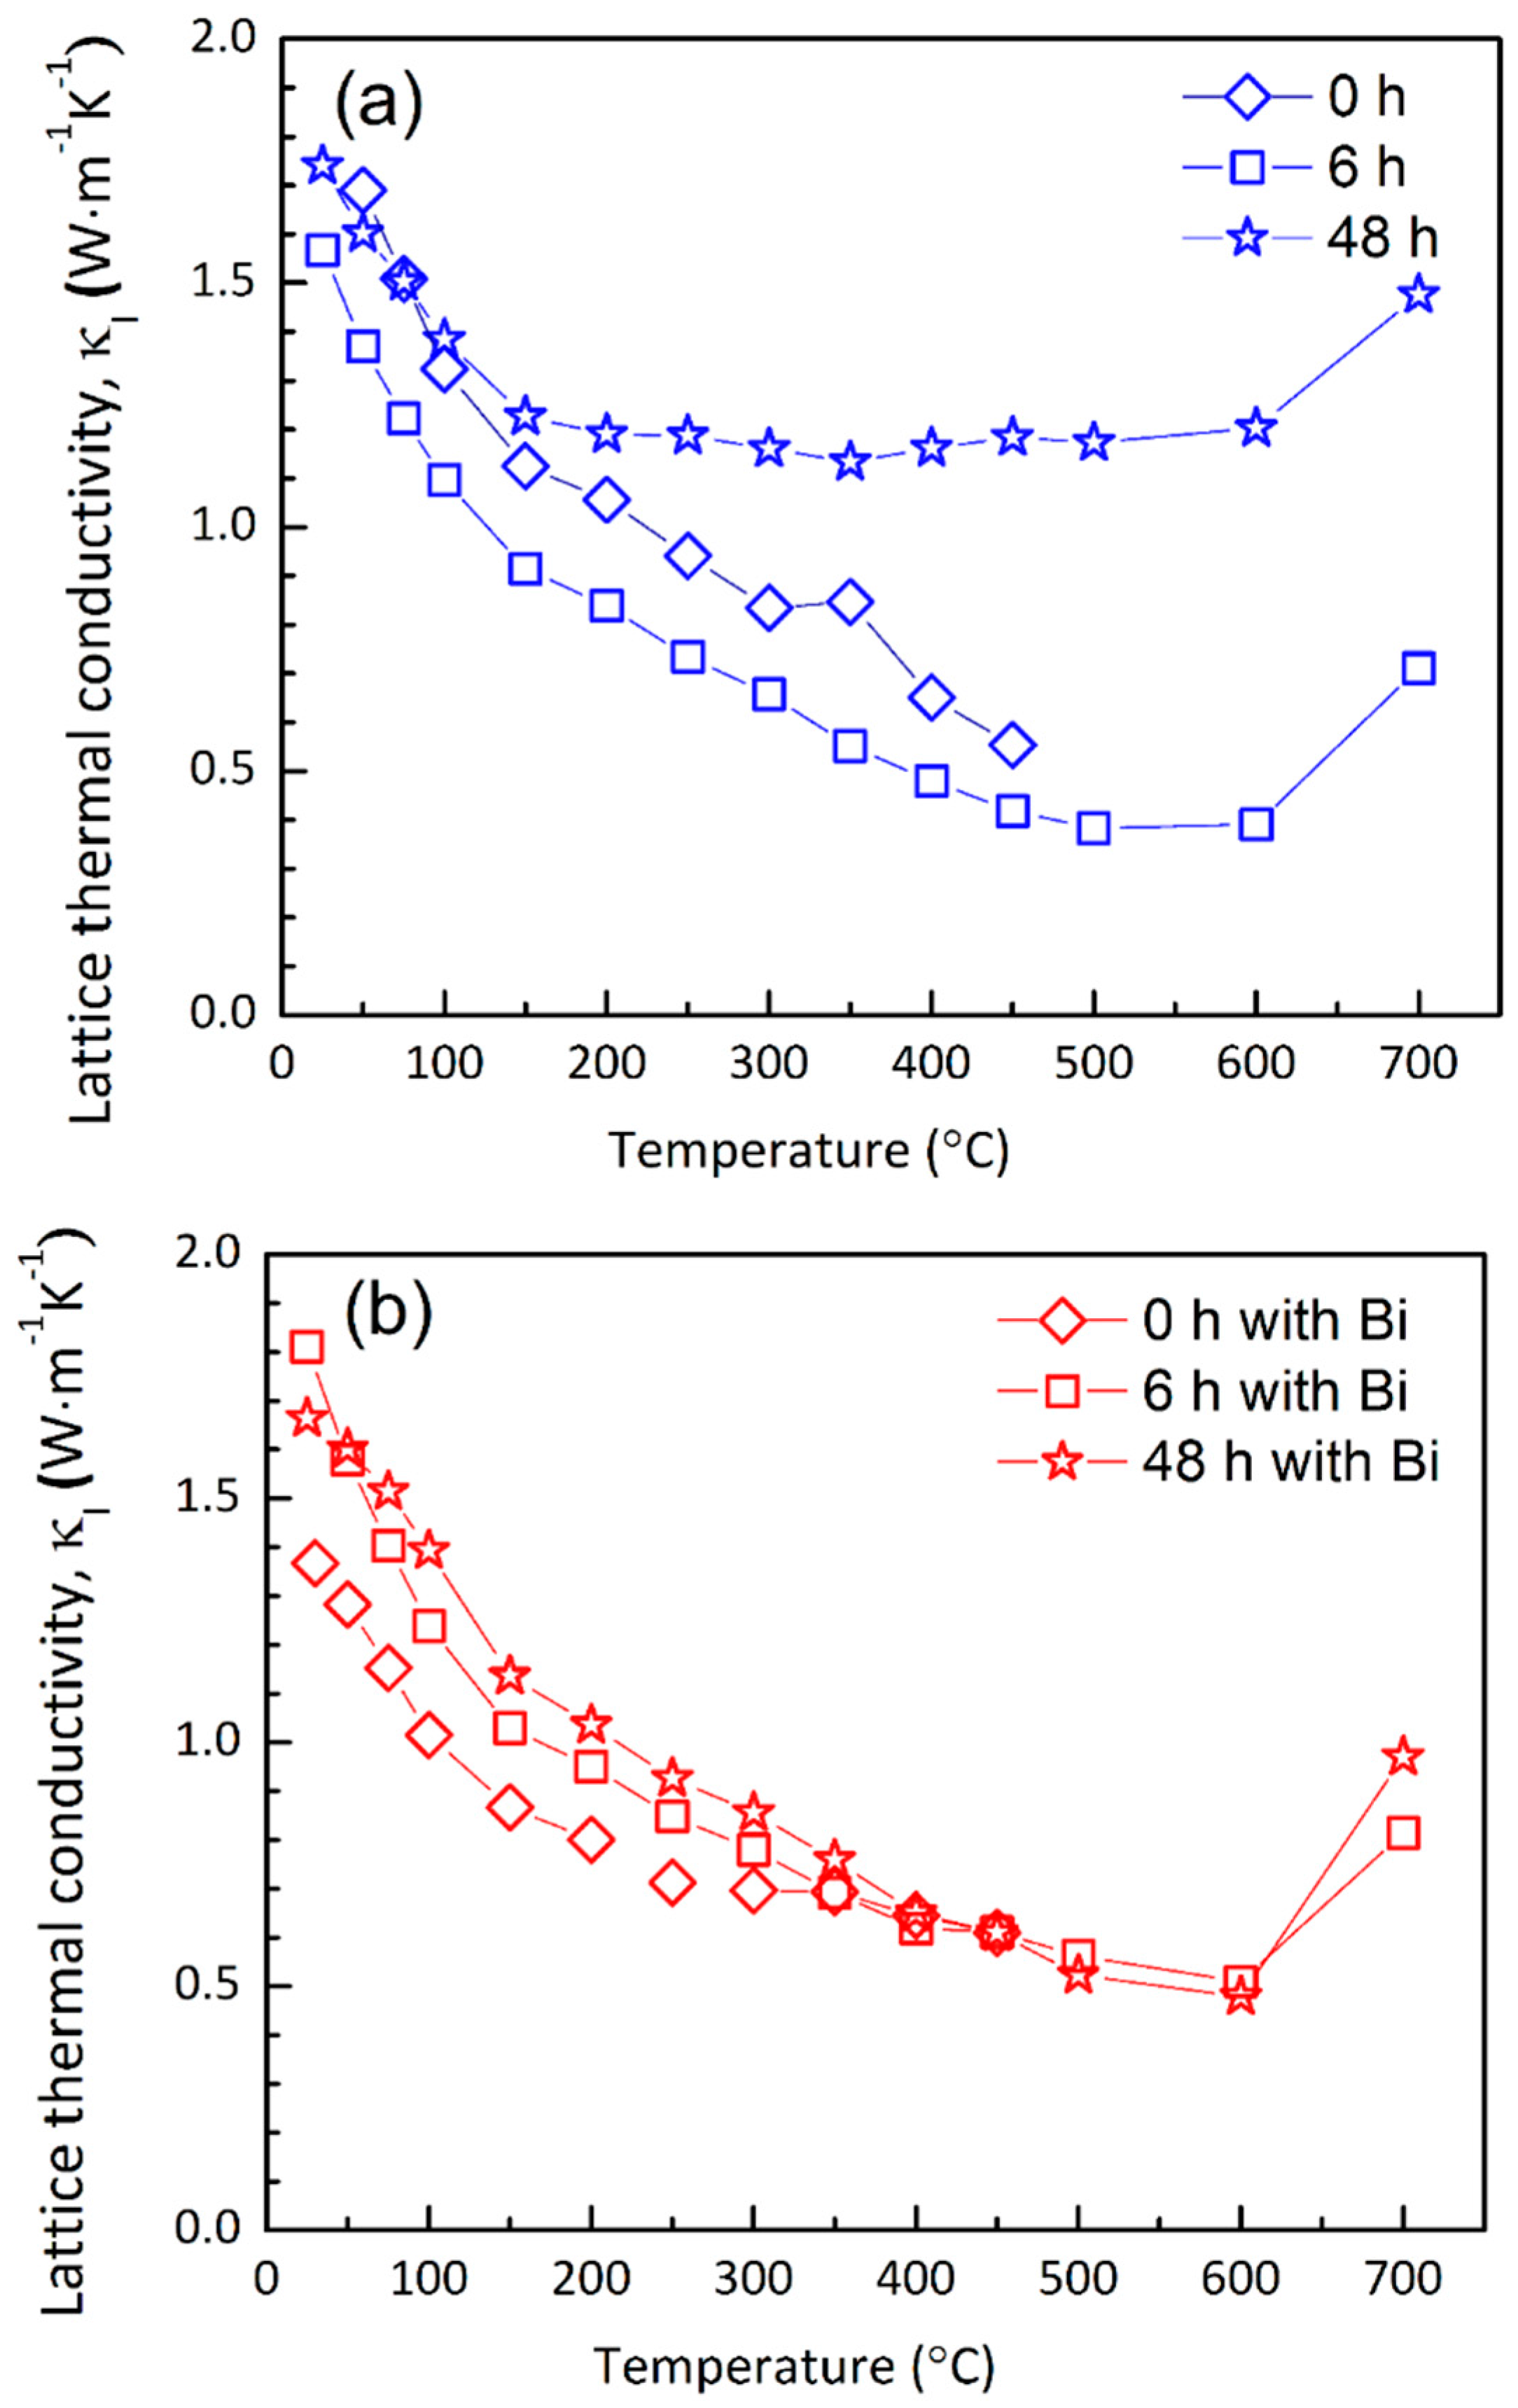
Figure 5 shows the temperature dependent lattice component thermal conductivity for the (a) Bi-free and (b) Bi-doped HP samples aged for 0, 6, and 48 h. Both types of samples show a similar trend of decreasing thermal conductivity with increasing temperature, which is associated to Umklapp phonon scattering [8]. For temperatures larger than 500 °C the κ l -values seem to increase with temperature, which deviates from the Umklapp-behavior; this is probably due to phenomena that are not considered by the expression of L , such as bipolar effects [30].
Interestingly, it is indicated that the Bi-free compounds exhibit the lowest κ l values for 6 h aging, whereas 48 h aging leads to maximum κ l values. Conversely, the Bi-alloyed compounds exhibit κ l values with increasing order of their aging times. These trends will be discussed further below.

4. Discussion

4.1. Materials Processing and Microstructure Evolution

It is indicated in Figure 2 and Figure 3 that the materials microstructure, particularly the Ag2Te-precipitate number density, can be controlled by selecting the appropriate synthesis procedures and aging heat treatments. The specimens aged at 450 °C show an undesirable behavior, in which Nv monotonously decreases with aging time, starting from a relatively large value of ca. 3 × 10¹⁹ m−3. This means that the onset of Ag2Te-precipitates nucleation takes place already during the quenching process. This can be explained by combination of the following factors. First, the PbTe matrix is highly supersaturated with Ag atoms, so that quenching from the single-phase region to two-phase region (below 450 °C) is inadequately fast. Second, the diffusion rate of Ag in the PbTe-matrix might be fast enough to enable the onset of Ag2Te nucleation just below the PbTe-solvus. Based on this experimental work, as compared to calculations of the expected cooling rates for cylindrical telluride ingots (in direct contact with the quartz wall) conducted by Ikeda et al. [15], we estimate the cooling time of the center of the ingot to be between 30 and 60 s until it reaches room temperature. This is sufficient to enable nucleation of the Ag2Te precipitates at intermediate temperatures. Ag is known to be a fast diffusing element in PbSe with D 0 = 7.4·10−8 m2·s−1 and Q = 33.77 kJ·mole−1; valid for the temperature range of 400 through 850 °C [25], where D 0 and Q are the pre-exponential diffusion coefficient and activation energy, respectively. This corresponds to a diffusion length, D t , of ca. 265 µm for 1 min annealing at 650 °C. Ag diffusion is expected to be faster in PbTe than in PbSe, since the former has a larger lattice constant [31], given that both have the same crystal structure and Ag diffusion should occur in interstitial mechanism [25]. Thus, due to the high diffusivity of Ag, it is reasonable that nanoscale precipitates form during quenching [26]. Lowering the aging temperature from 450 °C to 400 °C enables achieving slower kinetics and lower diffusion rate of Ag atoms in the PbTe matrix at the same time with increased nucleation rate, I, of the Ag2Te-phase, Equation (4) [27]:
I exp ( Δ G * + Δ G D k B T )
Here, ∆G* is the critical energy for nucleation, and is decreasing with increased degree of super-saturation [27]; ∆GD is the critical energy for mass transport; and k B is the Boltzmann constant.
The major differences between the AC and HP series are the synthesis method and composition. First, the HP samples are less brittle and are easier to handle during the subsequent measurements, with somewhat larger bulk density values compared to the AC ones, Table 2. Second, the HP series contains smaller concentrations of Ag (3.3 at. %) compared to AC (5.0 at. %). The reduction of Ag-concentration in the HP series enabled us avoiding formation of primary Ag2Te-precipitates during quenching owing to reduced degree of super-saturation.
It is shown in Figure 3 that 6 h aging at 380 °C is the critical condition for obtaining an adequately high value of Nv = 2.7∙1020 m−3. Such value was found to be enough to initiate phonon scattering in PbTe [32,33]. After reaching at this peak Nv, an over-aging stage begins, in which the precipitates coarsen [27], and their effect on phonon scattering is expected to diminish.
Comparison between the microstructures obtained for the Bi-doped and Bi-free materials that underwent identical aging conditions shown in Figure 2—on the one hand, and the obtained Nv values shown in Figure 3—on the other hand, is very instructive. First, it is observed that Bi greatly suppresses temporal evolution of the precipitates. This is manifested by relatively large, needle-like precipitates, several micrometers long, which appear in the Bi-doped samples; this size is preserved for a wide range of aging times. Conversely, their undoped counterparts exhibit small precipitates (tens of nm dia.) for 6 h aging, and large precipitates (ca. 500 nm dia.) for 48 h aging. This implies that Bi atoms encourage “pinning” of the Ag2Te-precipitates to their original sizes. Second, Bi additions affect the morphology of the precipitates. Whereas the undoped samples exhibit needle-shaped precipitates that evolve into spheroidal ones between 4 and 6 h aging, the Bi-doped samples contain only needle-shaped ones. This can be explained by coherent interfaces existing between the PbTe-matrix and Ag2Te-precipitates due to small lattice mismatch [25]. The degree of coherency decreases during precipitate growth [27]; however, Bi-additions preserve high degree of coherency, possibly due to interfacial segregation, as observed in a different PbTe-based system [34].

4.2. Electronic Transport Properties

In this section we will explain the complicated behavior shown in Figure 4, starting from the Bi-free materials. Generally, all samples exhibit an inverse relation between σ and |S|, that is, as one increases the other one decreases with dopant concentration, which is expected [29]. Most samples, however, exhibit increase of σ and decrease of |S| with increasing temperature. This is opposite to the behavior observed for heavily-doped semiconductors [29], which is associated to the fact that charge carrier activation occurs from the Fermi level to higher energy states in the conduction band. Rather, these trends are often observed for intrinsic or lightly-doped semiconductors, where such behavior originates from the thermal activation of charge carriers across the band gap. This is, however, not the case here. Our explanation for this trend is based on the increase of Ag solubility limit in PbTe with increasing temperature, which leads to dissolution of Ag2Te-precipitates and increase of the extrinsic charge carrier concentration with increasing temperature [24]; this raises the Fermi energy to levels closer to the conduction band.
It should be noted that Ag is an n-type dopant in Ag-saturated PbTe due to formation of interstitial Ag defects [24], therefore yields negative S-values, whereas for low concentrations Ag atoms act as acceptors. During aging, nucleation and growth of the Ag2Te-phase take place, and Ag-atoms are consumed and depleted from the PbTe-matrix. Therefore, S-coefficients become less negative with increasing aging time, Figure 4b. Interestingly, the Bi-free sample aged for 48 h shows very low electrical conductivity, and its S-coefficient is positive and changes its sign to negative upon heating, implying a transition from p-type to n-type behavior. This can be explained considering that after 48 h aging the volume fraction of Ag2Te is the greatest, so that the amount of Ag-atoms dissolved in the PbTe-matrix is the smallest. This is because Ag2Te precipitates act as p-type dopants in PbTe, in analogy with Na2Te and K2Te, where Na+ or K+ substitute for Pb+2 [23]. Ca. 1% solubility of Ag2Te in PbTe apparently results in compensated defects and very low concentration of extrinsic charge carriers (<1018 cm−3), possibly since half of the Ag atoms occupying interstitial sites donate one electron compensating for the remaining Ag substituting for Pb. The occurrence of Ag as both an n- and a p-type dopant has been reported previously [35]. Overall, Ag-solubility increases with temperature so that |S| is decreasing with temperature for all cases. Moreover, Ag2Te-precipitates dissolve at temperatures as high as 450 °C, which is manifested by convergence of all curves at this temperature for both Bi-alloyed and Bi-free compounds, Figure 4b.
The behavior of the Bi-alloyed compound is easier to comprehend, since Bi-dopants serve always as donors in PbTe. The as-quenched Bi-alloyed sample exhibits decreasing σ- values with growing temperatures starting from ca. 750 S∙cm−1 at room temperature. This behavior can be explained as follows. At the beginning of the measurement cycle Bi atoms, acting as electron donors, are homogeneously dispersed in the matrix that contains very few Ag2Te-precipitates per unit volume. During SBA analysis the temperature reaches 700 °C, followed by slow cooling. We hypothesize that Bi-atoms prefer to segregate to the interface between the PbTe-matrix and the Ag2Te-precipitates to reduce the total interfacial free energy. Once Bi-atoms segregate to these interfaces, their concentration in the PbTe-matrix decrease. The electrical conductivity of the ‘0 h’ sample is relatively high and keeps decreasing with temperature since the PbTe-matrix is sufficiently enriched by Bi. The samples aged for 6 h and more contain less Bi-atoms dissolved in the PbTe-matrix, so that their electrical conductivities are smaller than that of the ‘0 h’ one, and they behave as in the non-degenerate limit, Figure 4a. This also explains why S-values become more negative with aging time. We note that this suggested mechanism relies on the scenario of interfacial segregation of Bi-atoms to the PbTe/Ag2Te interfaces. To the best of our knowledge, this has not been reported in literature, however was validated by us from first-principles [36].

4.3. Thermal Transport Properties

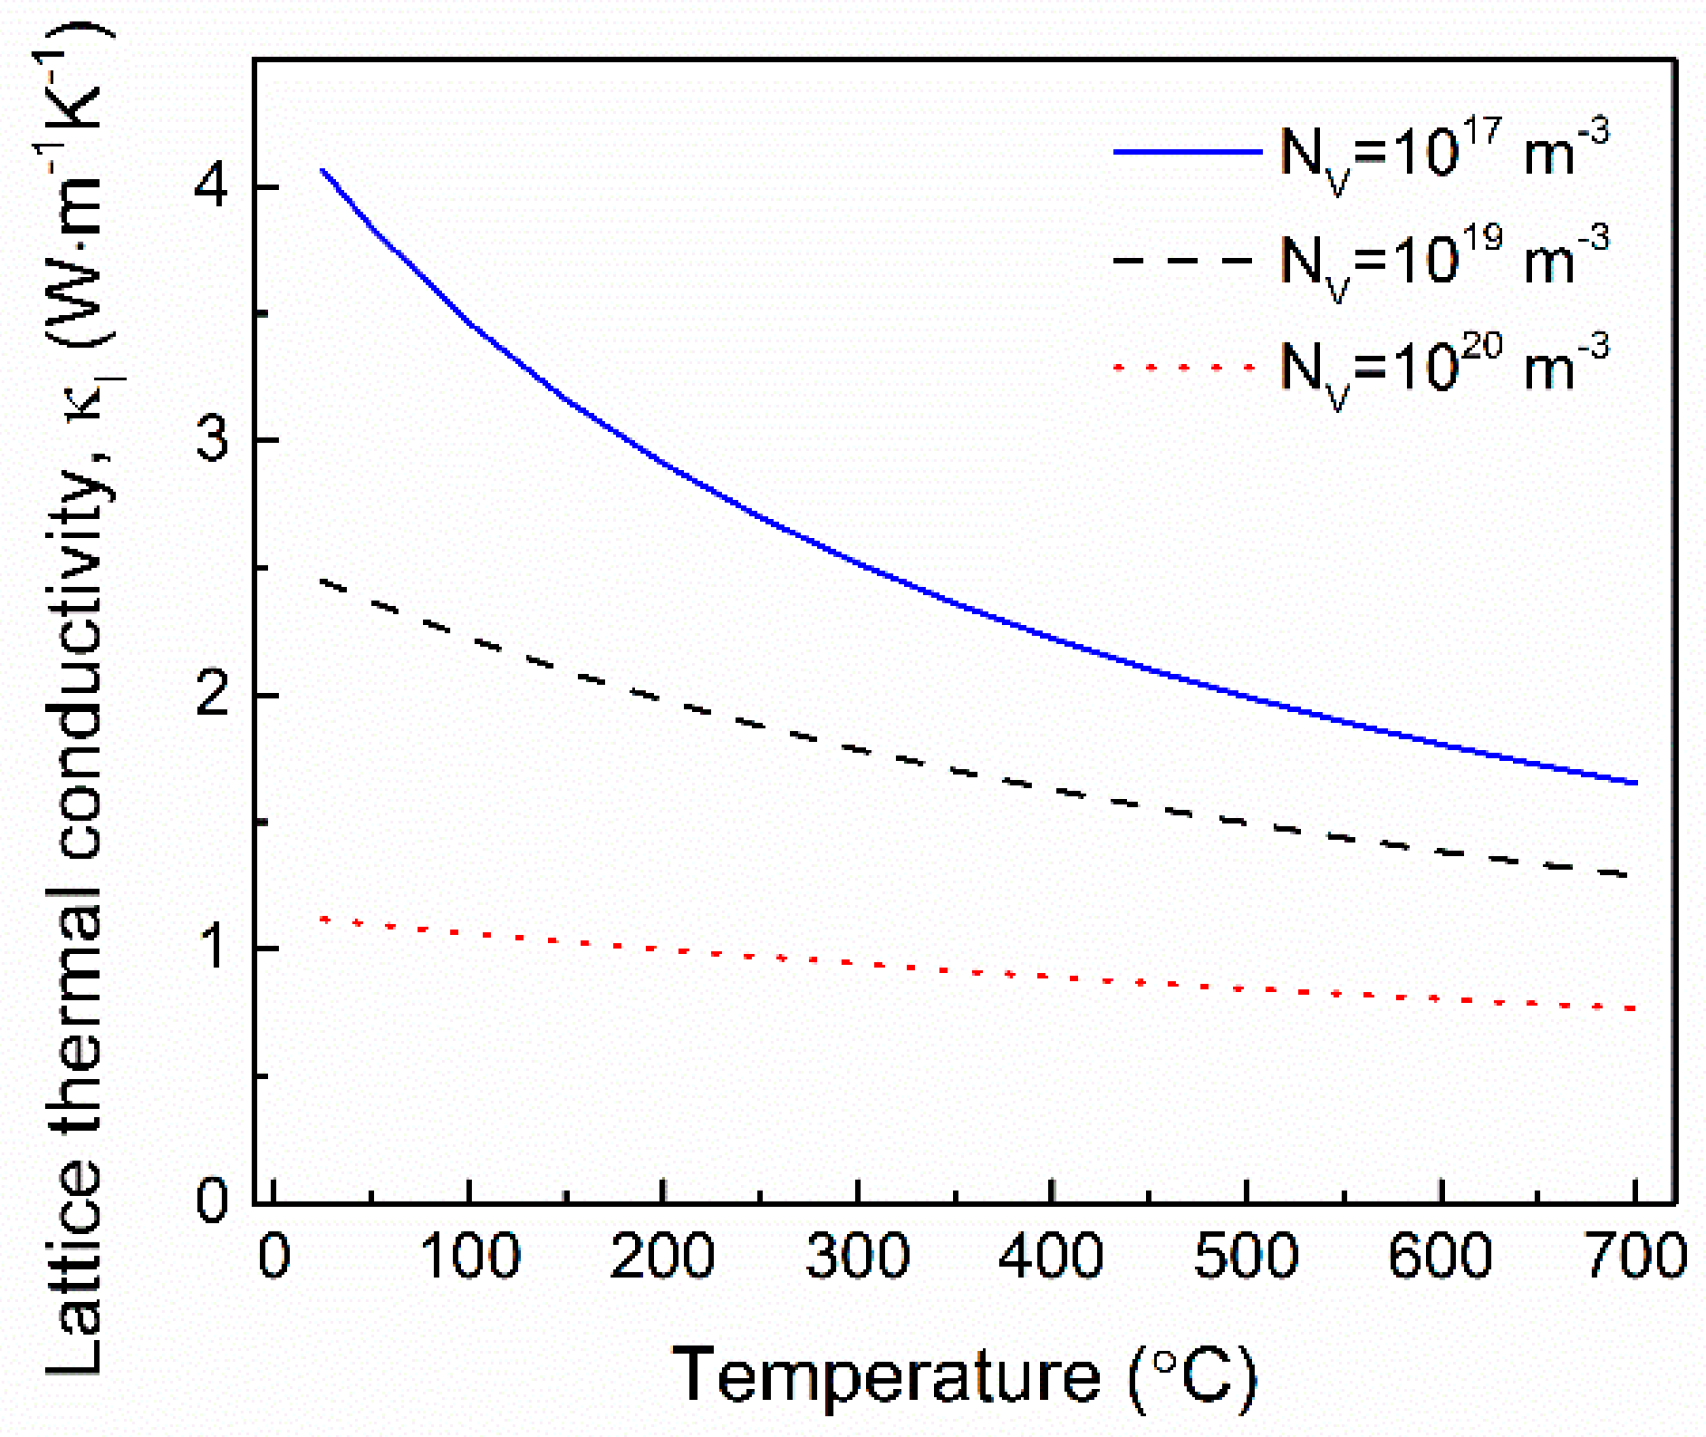
Figure 5 shows an interesting behavior, in which the Bi-free compounds exhibit the lowest κ l values for 6 h aging, whereas 48 h aging leads to maximum κ l values. Conversely, the Bi-alloyed compounds exhibit κ l values with increasing order of their aging times. This can be elucidated considering the role of Ag2Te-precipitates in phonon scattering. The Bi-free samples exhibit decrease in κ l -values with aging time from the as quenched state up to 6 h due to the significant increase of Nv to values as large as 2.7 × 10²⁰ m−3; such Nv-value was found to be adequately high to initiate phonon scattering with sufficient intensity to reduce thermal conductivity by tens percent [32]. Conversely, κ l -values increase from 6 h aging up to 48 h aging, which seems to deviate from the trend introduced before. This is explained by the role of the degree of matrix supersaturation in scattering phonons, as utilized by us previously [28,37]. The as-quenched sample comprises non-equilibrium, strained, and super-saturated PbTe solid solution that relaxes upon aging. For the as-quenched state, this is the dominating mechanism for phonon scattering. With growing aging time, the matrix strains relieve, however Nv increases. For longer aging times, Nv decreases due to coarsening with simultaneous strain relief; therefore, the lattice thermal conductivity grows to values even larger than for the as-quenched state. The interplay between these competing factors determine the temporal evolution of κ l shown in Figure 5a. For comparison, the trends shown in Figure 5b for the Bi-alloyed samples are somewhat different: κ l -values keep increasing with aging time. This is because the Nv-values of these samples are too low, so that precipitates do not play any significant role in phonon scattering. Instead, matrix relaxation remains the only mechanism, and this yields continuous increase of κ l with aging time. To demonstrate the significant influence of precipitates having the same Nv-values as in Figure 3 on κ l , we calculate κ l ( T ) for 10 nm radius precipitates dispersed in PbTe-matrix having different Nv-values applying the Callaway model with parameters that are conventional for PbTe-matrix [32,33], and the results are shown in Figure 6.
It is indicated that κ l is sensitive to precipitate number density variations in the range simulated, which corroborates our analysis.

4.4. Thermoelectric Performance

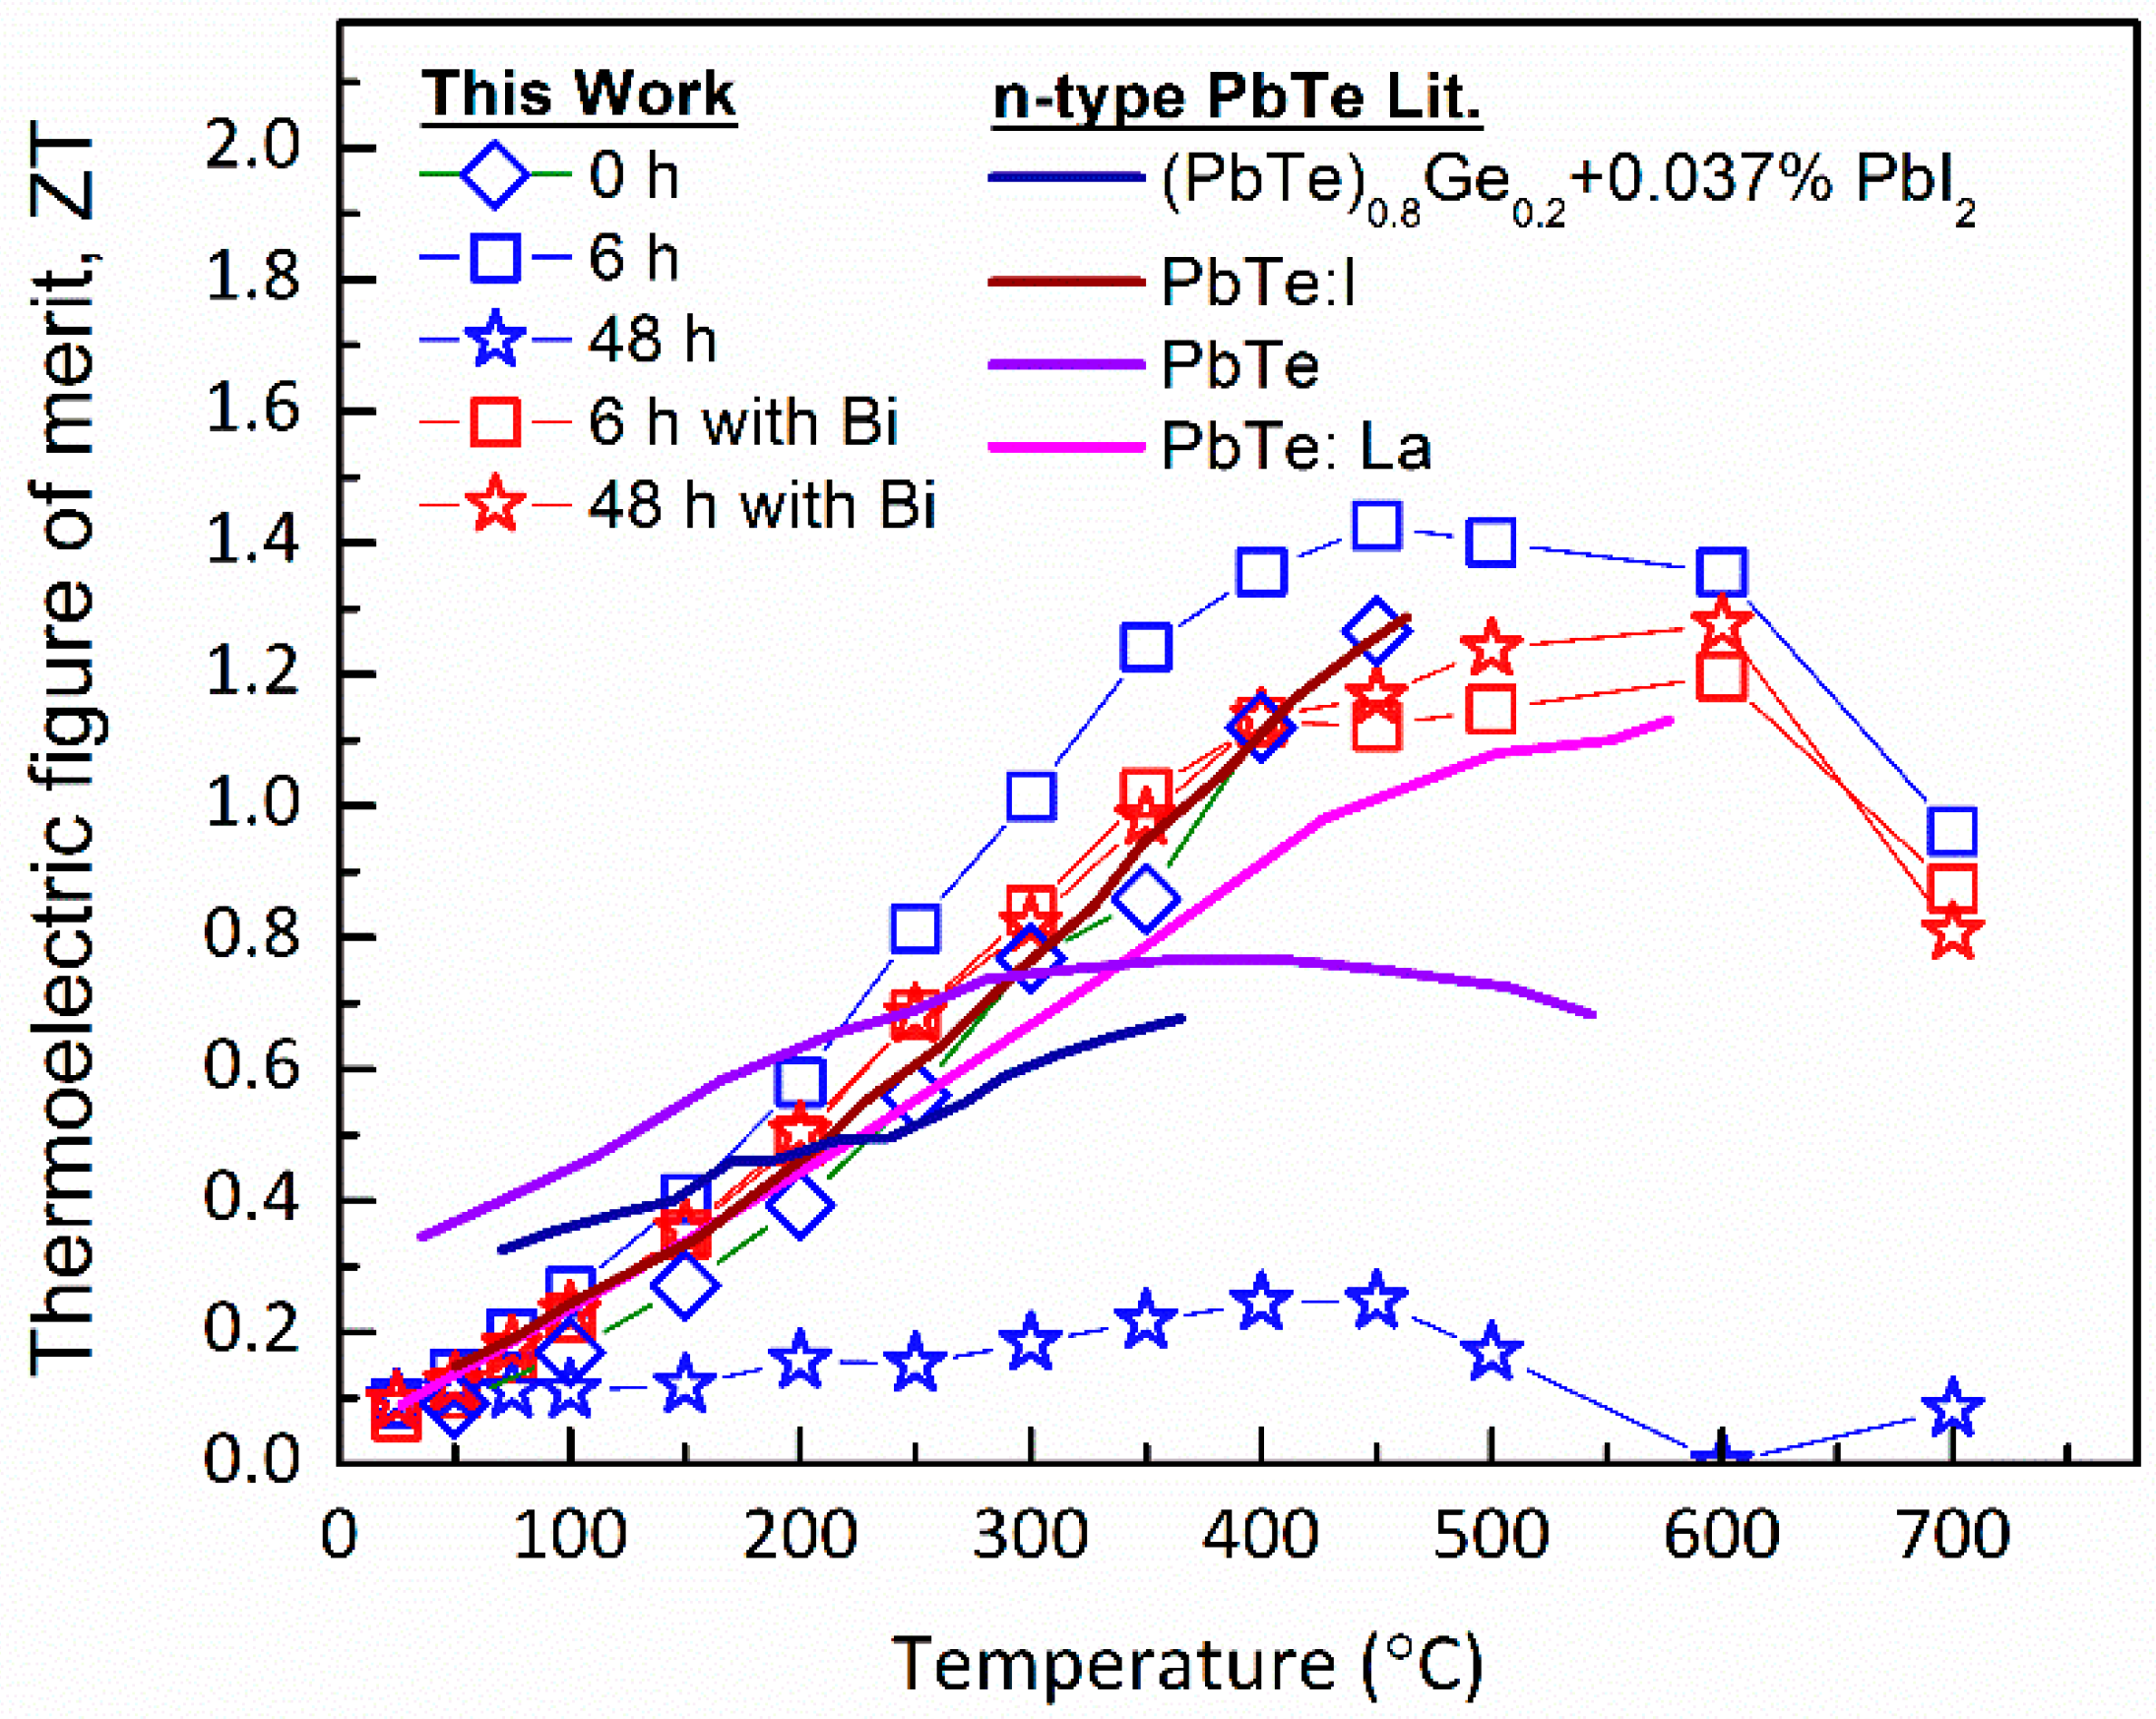
We examine the effects of aging and microstructure evolution on the TE figure of merit, ZT. Figure 7 shows the temperature dependent ZT-values calculated for the HP series of both Bi-alloyed and Bi-free materials, together with selected values reported in literature for other n-type PbTe.
Interestingly, it is indicated that ZT is extremely sensitive to microstructure evolution for the Bi-free compounds, and is almost insensitive to it for the Bi-alloyed ones. Additionally, the Bi-free ones exhibit maximum ZT-values that are greater than those of the Bi-alloyed ones. Most importantly, ZT significantly improves due to 6 h aging with respect to the raw material (as-quenched), which is associated to the decrease of κ l thanks to precipitation of the Ag2Te-phase. The maximum ZT value obtained is ca. 1.4 at 450 °C, which is one of the largest ones reported for n-type PbTe [38,39,40,41,42,43]. Subsequent aging for 48 h results in drastic decrease of ZT for the undoped specimens, whereas that of the Bi-doped specimen only slightly decreases. This can be explained by coarsening process taking place in the undoped specimen after 48 h aging, Figure 2 and Figure 3, which increases lattice thermal conductivity and reduces electrical conductivity. Furthermore, Bi alloying suppresses the microstructure evolution and reduces the Nv-values, Figure 2, which leads to only a slight reduction of ZT after 6 and 48 h aging. This clarifies the positive effects of Bi in stabilizing the material’s microstructure against evolution, and thereby in preventing deterioration of TE performance. All of the above imply that good control and understanding of the evolved microstructure help us to employ two-phase materials for TE applications.

5. Summary and Conclusions

Our investigation of Ag2Te precipitation in undoped and Bi-doped (PbTe)1−x(Ag2Te)x compounds includes materials synthesis in two different routes, namely casting and hot-pressing, aging heat treatments, microstructure characterization, and TE property measurements. It was found that Ag2Te-precipitate number density can be controlled by changing the average composition as well as heat treatment temperature and duration. A maximum precipitate number density value as high as 2.7 × 10²⁰ m−3 was achieved for the Bi-free compounds after 6 h aging at 380 °C, yielding ZT = 1.4 at 450 °C. This is one on the largest values reported for n-type PbTe compounds, and is associated to improved phonon scattering efficiency. Subsequent aging results in precipitate coarsening, which causes drastic increase of thermal conductivity and decrease of electrical conductivity. This is associated to a reduction of phonon scattering efficiency by both precipitates and matrix strains, as well as depletion of Ag-solutes from the PbTe-matrix. Interestingly, Bi-doping results in stagnation of microstructure evolution, maintaining thermally stable TE performance. Overall, this study provides us with fundamental understanding and practical tools necessary to design TE properties in PbTe-based compounds as well as in other two-phase systems.

Acknowledgments

This research was carried out in the framework of the Nancy & Stephen Grand Technion Energy Program (GTEP), and supported by the Leona M. and Harry B. Helmsley Charitable Trust and the Adelis Foundation for renewable energy research. Generous support from the Israel Science Foundation (ISF), Grant No. 698/13, as well as from the German-Israeli Foundation for Research and Development (GIF), Grant No. I-2333-1150.10/2012 is gratefully acknowledged.

Author Contributions

T.G. performed materials synthesis, microstructure characterization and thermoelectric measurements, and analyzed the data; Y.A. and Y.G. designed the experimental procedures and methodology, and provided scientific supervision; Y.G. supervised hot-pressing processes; A.S. contributed to materials characterization and data analysis; T.G. and Y.A. wrote the paper. All authors contributed to this research.

Conflicts of Interest

The authors declare no conflict of interest.

References

  1. LaLonde, A.D.; Pei, Y.; Wang, H.; Snyder, G.J. Lead telluride alloy thermoelectrics. Mater. Today 2011, 14, 526–532. [Google Scholar] [CrossRef]
  2. Snyder, G.J.; Toberer, E.S. Complex thermoelectric materials. Nat. Mater. 2008, 7, 105–114. [Google Scholar] [CrossRef] [PubMed]
  3. Dughaish, Z.H. Lead telluride as a thermoelectric material for thermoelectric power generation. Phys. B Condens. Matter 2002, 322, 205–223. [Google Scholar] [CrossRef]
  4. Tan, G.; Shi, F.; Hao, S.; Zhao, L.D.; Chi, H.; Zhang, X.; Uher, C.; Wolverton, C.; Dravid, V.P.; Kanatzidis, M.G. Non-equilibrium processing leads to record high thermoelectric figure of merit in PbTe-SrTe. Nat. Commun. 2016, 7, 12167. [Google Scholar] [CrossRef] [PubMed]
  5. Korkosz, R.J.; Chasapis, T.C.; Lo, S.h.; Doak, J.W.; Kim, Y.J.; Wu, C.I.; Hatzikraniotis, E.; Hogan, T.P.; Seidman, D.N.; Wolverton, C.; et al. High ZT in p-type (PbTe)1–2x(PbSe)x(PbS)x thermoelectric materials. J. Am. Chem. Soc. 2014, 136, 3225–3237. [Google Scholar] [CrossRef] [PubMed]
  6. Rawat, P.K.; Paul, B.; Banerji, P. Exploration of Zn resonance levels and thermoelectric properties in I-doped PbTe with ZnTe nanostructures. ACS Appl. Mater. Interfaces 2014, 6, 3995–4004. [Google Scholar] [CrossRef] [PubMed]
  7. Tan, G.; Kanatzidis, M.G. Chapter 4 All-Scale Hierarchical PbTe. In Materials Aspect of Thermoelectricity; CRC Press: Boca Raton, FL, USA, 2016; pp. 125–158. [Google Scholar]
  8. Tritt, T.M. Thermal Conductivity: Theory, Properties, and Applications; Springer: Berlin, Germany, 2004. [Google Scholar]
  9. Rowe, D.M. Thermoelectrics Handbook: Macro to Nano; CRC Press: Boca Raton, FL, USA, 2006. [Google Scholar]
  10. Wu, D.; Zhao, L.-D.; Zheng, F.; Jin, L.; Kanatzidis, M.G.; He, J. Understanding nanostructuring processes in thermoelectrics and their effects on lattice thermal conductivity. Adv. Mater. 2016, 28, 2737–2743. [Google Scholar] [CrossRef] [PubMed]
  11. Li, J.; Zhang, X.; Lin, S.; Chen, Z.; Pei, Y. Realizing the high thermoelectric performance of GeTe by Sb-doping and Se-alloying. Chem. Mater. 2017, 29, 605–611. [Google Scholar] [CrossRef]
  12. He, J.Q.; Sootsman, J.R.; Girard, S.N.; Zheng, J.C.; Wen, J.G.; Zhu, Y.M.; Kanatzidis, M.G.; Dravid, V.P. On the origin of increased phonon scattering in nanostructured PbTe based thermoelectric materials. J. Am. Chem. Soc. 2010, 132, 8669–8675. [Google Scholar] [CrossRef] [PubMed]
  13. Medlin, D.L.; Snyder, G.J. Interfaces in bulk thermoelectric materials a review for current opinion in colloid and interface science. Curr. Opin. Colloid Interface Sci. 2009, 14, 226–235. [Google Scholar] [CrossRef]
  14. Ikeda, T.; Collins, L.A.; Ravi, V.A.; Gascoin, F.S.; Haile, S.M.; Snyder, G.J. Self-assembled nanometer lamellae of thermoelectric PbTe and Sb2Te3 with epitaxy-like interfaces. Chem. Mater. 2007, 19, 763–767. [Google Scholar] [CrossRef]
  15. Ikeda, T.; Haile, S.M.; Ravi, V.A.; Azizgolshani, H.; Gascoin, F.; Snyder, G.J. Solidification processing of alloys in the pseudo-binary PbTe- Sb2Te3 system. Acta Mater. 2007, 55, 1227–1239. [Google Scholar] [CrossRef]
  16. Ikeda, T.; Iwanaga, S.; Wu, H.J.; Marolf, N.J.; Chen, S.W.; Snyder, G.J. A combinatorial approach to microstructure and thermopower of bulk thermoelectric materials: The pseudo-ternary PbTe-Ag2Te-Sb2Te3 system. J. Mater. Chem. 2012, 24335–24347. [Google Scholar] [CrossRef]
  17. Ikeda, T.; Marolf, N.J.; Bergum, K.; Toussaint, M.B.; Heinz, N.A.; Ravi, V.A.; Jeffrey Snyder, G. Size control of Sb2Te3 Widmanstätten precipitates in thermoelectric PbTe. Acta Mater. 2011, 59, 2679–2692. [Google Scholar] [CrossRef]
  18. Ikeda, T.; Ravi, V.; Jeffrey Snyder, G. Microstructure size control through cooling rate in thermoelectric PbTe-Sb2Te3 composites. Metall. Mater. Trans. A 2010, 41, 641–650. [Google Scholar] [CrossRef]
  19. Ikeda, T.; Ravi, V.A.; Snyder, G.J. Formation of Sb2Te3 Widmanstätten precipitates in thermoelectric PbTe. Acta Mater. 2009, 57, 666–672. [Google Scholar] [CrossRef]
  20. Ikeda, T.; Toberer, E.S.; Ravi, V.A.; Snyder, G.J.; Aoyagi, S.; Nishibori, E.; Sakata, M. In situ observation of eutectoid reaction forming a PbTe-Sb2Te3 thermoelectric nanocomposite by synchrotron X-ray diffraction. Scr. Mater. 2009, 60, 321–324. [Google Scholar] [CrossRef]
  21. Ikeda, T.; Toussaint, M.; Bergum, K.; Iwanaga, S.; Jeffrey Snyder, G. Solubility and formation of ternary Widmanstätten precipitates in PbTe in the pseudo-binary PbTe–Bi2Te3 system. J. Mater. Sci. 2011, 46, 3846–3854. [Google Scholar] [CrossRef]
  22. Pei, Y.; Heinz, N.A.; LaLonde, A.; Snyder, G.J. Combination of large nanostructures and complex band structure for high performance thermoelectric lead telluride. Energy Environ. Sci. 2011, 4, 3640–3645. [Google Scholar] [CrossRef]
  23. Pei, Y.; Lensch-Falk, J.; Toberer, E.S.; Medlin, D.L.; Snyder, G.J. High thermoelectric performance in PbTe due to large nanoscale Ag2Te precipitates and La doping. Adv. Funct. Mater. 2011, 21, 241–249. [Google Scholar] [CrossRef]
  24. Pei, Y.; May, A.F.; Snyder, G.J. Self-tuning the carrier concentration of PbTe/Ag2Te composites with excess Ag for high thermoelectric performance. Adv. Energy Mater. 2011, 1, 291–296. [Google Scholar] [CrossRef]
  25. Lensch-Falk, J.L.; Sugar, J.D.; Hekmaty, M.A.; Medlin, D.L. Morphological evolution of Ag2Te precipitates in thermoelectric PbTe. J. Alloys Compd. 2010, 504, 37–44. [Google Scholar] [CrossRef]
  26. Bergum, K.; Ikeda, T.; Jeffrey Snyder, G. Solubility and microstructure in the pseudo-binary PbTe-Ag2Te system. J. Solid State Chem. 2011, 184, 2543–2552. [Google Scholar] [CrossRef]
  27. Porter, D.A.; Easterling, K.E. Phase Transformations in Metals and Alloys, 2nd ed.; Chapman & Hall: London, UK, 1992. [Google Scholar]
  28. Koresh, I.; Amouyal, Y. Effects of microstructure evolution on transport properties of thermoelectric nickel-doped zinc oxide. J. Eur. Ceram. Soc. 2017, 37, 3541–3550. [Google Scholar] [CrossRef]
  29. Goldsmid, H.J. Introduction to Thermoelectricity; Springer: Berlin/Heidelberg, Germany, 2009. [Google Scholar]
  30. Kim, H.-S.; Gibbs, Z.M.; Tang, Y.; Wang, H.; Snyder, G.J. Characterization of Lorenz number with Seebeck coefficient measurement. APL Mater. 2015, 3, 041506. [Google Scholar] [CrossRef]
  31. Pei, Y.-L.; Liu, Y. Electrical and thermal transport properties of Pb-based chalcogenides: PbTe, PbSe, and PbS. J. Alloys Compd. 2012, 514, 40–44. [Google Scholar] [CrossRef]
  32. Amouyal, Y. Reducing lattice thermal conductivity of the thermoelectric compound AgSbTe2 (P4/mmm) by lanthanum substitution: Computational and experimental approaches. J. Electron. Mater. 2014, 43, 3772–3779. [Google Scholar] [CrossRef]
  33. Amouyal, Y. A practical approach to evaluate lattice thermal conductivity in two-phase thermoelectric alloys for energy applications. Materials 2017, 10, 386. [Google Scholar] [CrossRef] [PubMed]
  34. He, J.; Blum, I.D.; Wang, H.Q.; Girard, S.N.; Doak, J.; Zhao, L.D.; Zheng, J.C.; Casillas, G.; Wolverton, C.; Jose-Yacaman, M.; et al. Morphology control of nanostructures: Na-doped PbTe–PbS system. Nano Lett. 2012, 12, 5979–5984. [Google Scholar] [CrossRef] [PubMed]
  35. Strauss, A.J. Effect of Pb- and Te-saturation on carrier concentrations in impurity-doped PbTe. J. Electron. Mater. 1973, 2, 553–569. [Google Scholar] [CrossRef]
  36. Grossfeld, T. Microstructure Evolution and Enhancement of the Thermoelectric Conversion Efficiency of PbTe-Based Compounds for Renewable Energy Applications. Mater’s Thesis, Technion—Israel Institute of Technology, Haifa, Israel, 2015. [Google Scholar]
  37. Cojocaru-Mirédin, O.; Abdellaoui, L.; Nagli, M.; Zhang, S.; Yu, Y.; Scheu, C.; Raabe, D.; Wuttig, M.; Amouyal, Y. Role of nanostructuring and microstructuring in silver antimony telluride compounds for thermoelectric applications. ACS Appl. Mater. Interfaces 2017, 9, 14779–14790. [Google Scholar] [CrossRef] [PubMed]
  38. Pei, Y.; LaLonde, A.; Iwanaga, S.; Snyder, G.J. High thermoelectric figure of merit in heavy hole dominated PbTe. Energy Environ. Sci. 2011, 4, 2085–2089. [Google Scholar] [CrossRef]
  39. Pei, Y.; Wang, H.; Snyder, G.J. Band engineering of thermoelectric materials. Adv. Mater. 2012, 24, 6125–6135. [Google Scholar] [CrossRef] [PubMed]
  40. Pei, Y.; Shi, X.; LaLonde, A.; Wang, H.; Chen, L.; Snyder, G.J. Convergence of electronic bands for high performance bulk thermoelectrics. Nature 2011, 473, 66–69. [Google Scholar] [CrossRef] [PubMed]
  41. Wang, H.; Pei, Y.; LaLonde, A.D.; Snyder, G.J. Weak electron–phonon coupling contributing to high thermoelectric performance in n-type PbSe. Proc. Natl. Acad. Sci. USA 2012, 109, 9705–9709. [Google Scholar] [CrossRef] [PubMed]
  42. Wang, H.; Pei, Y.; LaLonde, A.D.; Snyder, G.J. Heavily doped p-type PbSe with high thermoelectric performance: An alternative for PbTe. Adv. Mater. 2011, 23, 1366–1370. [Google Scholar] [CrossRef] [PubMed]
  43. Pei, Y.; LaLonde, A.D.; Wang, H.; Snyder, G.J. Low effective mass leading to high thermoelectric performance. Energy Environ. Sci. 2012, 5, 7963–7969. [Google Scholar] [CrossRef]
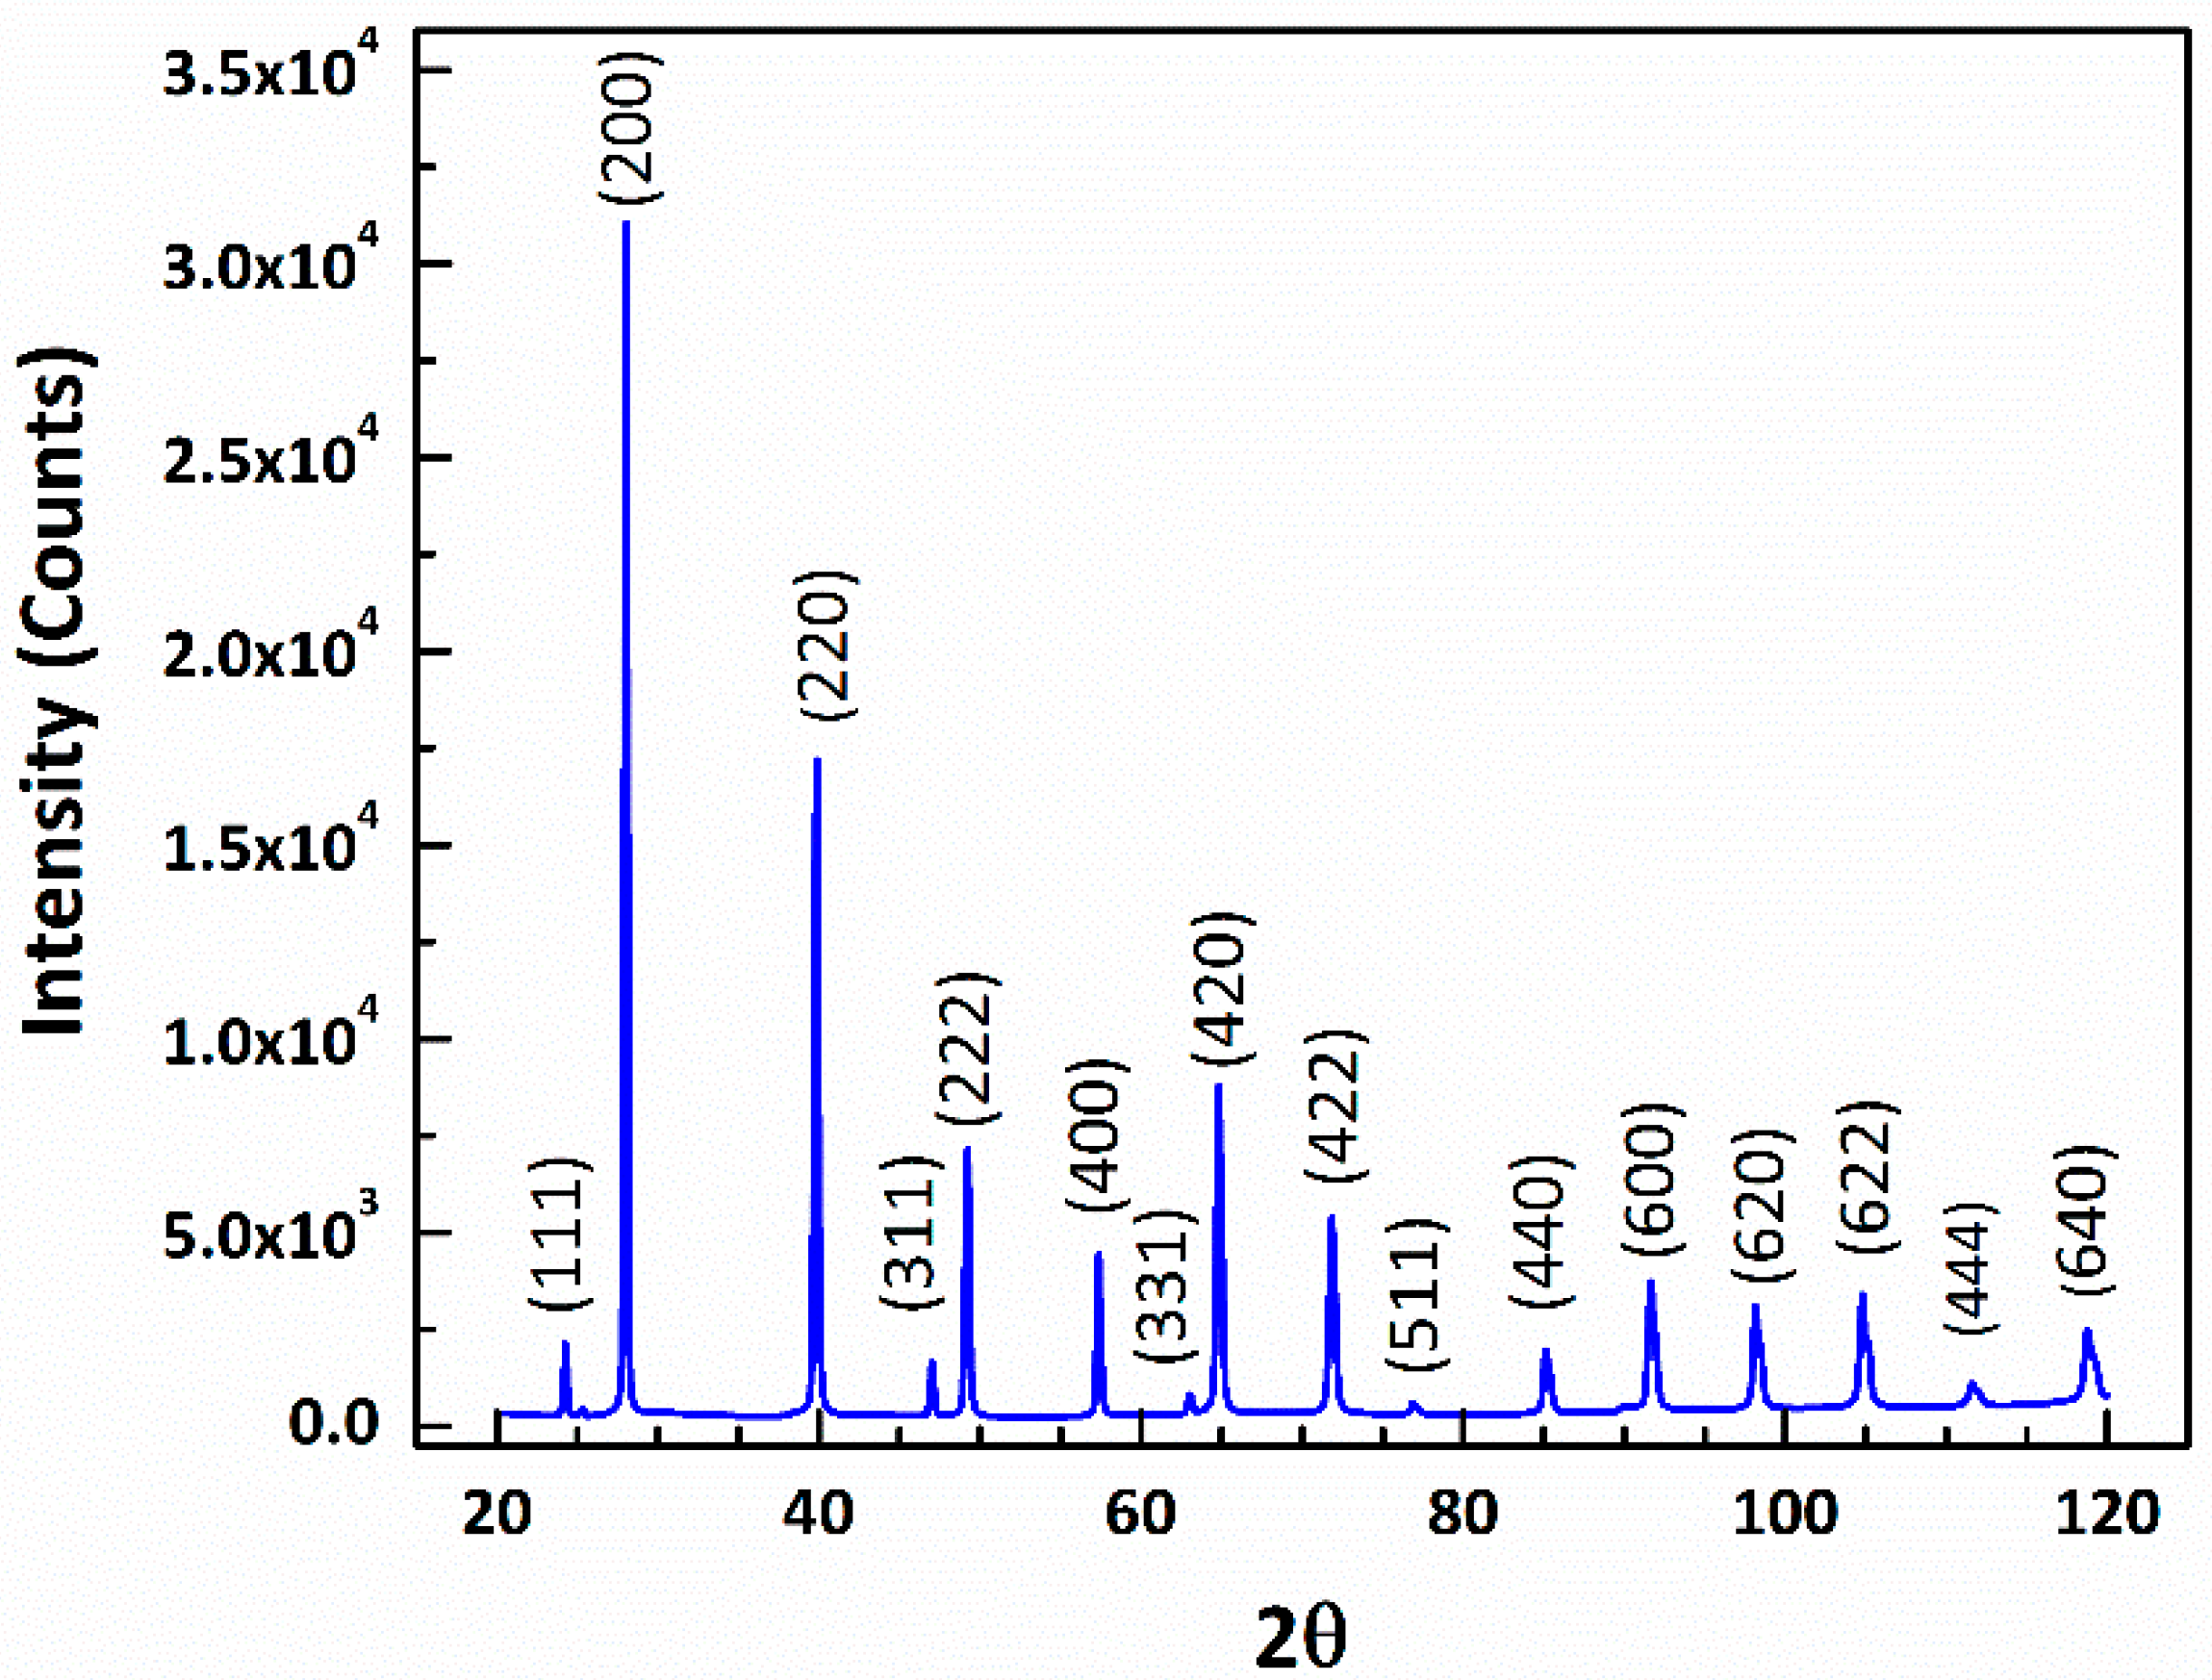
Figure 1. A fully-indexed powder x-ray diffraction (XRD) pattern acquired from the hot-pressed (HP) as-pressed, (PbTe)0.97(Ag2Te)0.03 series, corresponding with the rock-salt PbTe crystal structure (JCPDS number 04-002-0317).
Crystals 07 00281 g001
Figure 2. High-resolution scanning electron microscopy (HRSEM) micrographs taken from the polished surfaces of the series of hot-pressed (HP) samples aged at 380 °C for different durations, showing either needle-shaped or spheroidal Ag2Te-precipitates embedded in a PbTe-based matrix. (a) through (f) display Bi-free specimens aged for 0, 1, 4, 6, 16, and 48 h, respectively. (g,h) display Bi-alloyed specimens aged for 6 and 48 h, respectively. (ac,g,h) are collected applying the back-scattered electrons (BSE) signal, whereas (df) are collected applying the secondary electrons (SE) signal.
Crystals 07 00281 g002
Figure 3. Precipitate number density (Nv) values measured for the different aging times and temperatures, plotted for the (PbTe)0.95(Ag2Te)0.05 as-cast (AC) samples aged at 400 °C (blue circles) and 450 °C (red squares), as well as for the hot-pressed (HP) (PbTe)0.97(Ag2Te)0.03 samples aged at 380 °C (black triangles). For the series of samples aged at 450 °C Nv decreases with aging time, whereas for the samples aged at 400 °C and 380 °C sharp increase of Nv values is indicated for short durations, followed by a decrease.
Crystals 07 00281 g003
Figure 4. The temperature dependent (a) electrical conductivity, (b) Seebeck coefficient, and (c) thermal conductivity values measured for the hot-pressed (HP) series of specimens aged at 380 °C for 0 (diamonds), 6 (squares), and 48 h (stars) for the Bi-free (blue symbols) and Bi-alloyed (red symbols) materials.
Crystals 07 00281 g004
Figure 5. The temperature dependent lattice thermal conductivity values evaluated from the measured thermal and electrical conductivities applying the Wiedemann-Franz relationship for the hot-pressed (HP) series of specimens aged at 380 °C for 0 (diamonds), 6 (squares), and 48 h (stars), for the (a) Bi-free (blue symbols) and (b) Bi-alloyed (red symbols) materials.
Crystals 07 00281 g005
Figure 6. The temperature dependent lattice thermal conductivity values calculated based on the Callaway model for PbTe-matrix containing precipitates of 10 nm radius and three different number densities: Nv = 1017, 1019, and 1020 m−3, denoted by blue solid, black dashed, and red dotted lines, respectively.
Crystals 07 00281 g006
Figure 7. The temperature dependent thermoelectric figure of merit, ZT, evaluated for the hot-pressed (HP) series of specimens aged at 380 °C for 0 (diamonds), 6 (squares), and 48 h (stars) for the Bi-free (blue symbols) and Bi-alloyed (red symbols) materials. Selected data for n-type PbTe from literature are plotted for comparison.
Crystals 07 00281 g007
Table 1. A list of the materials’ compositions, synthesis conditions, and heat treatments carried out for each specimen.
MaterialAging Temperature [°C]Aging Times [h]
As-cast (AC) (PbTe)0.95(Ag2Te)0.054000, 2, 8, 32, 72, 106
4500, 1, 2, 4, 8, 16, 32
Hot-pressed (HP) (PbTe)0.97(Ag2Te)0.033800, 0.5, 1, 2, 4, 6, 8, 16, 24, 48
Hot-pressed (HP) 0.04 at. % Bi + (PbTe)0.97(Ag2Te)0.033800, 2, 6, 48
Table 2. A list of hot-pressed (HP) samples’ bulk densities, as measured after the different aging heat treatments.
Aging Time (h)Bulk Density (g·cm−3)
Bi-FreeBi-Alloyed
08.007.86
17.657.42
27.827.45
67.977.37
187.857.38
487.977.58