Article

Formation of Bragg Band Gaps in Anisotropic Phononic Crystals Analyzed With the Empty Lattice Model

1
Franche-Comté Electronique Mécanique Thermique et Optique, CNRS UMR 6174, Université de Franche-Comté, Besançon F-25030, France
2
Department of Chemistry, MIT, 77 Massachusetts Avenue, Cambridge, MA 02139, USA
*
Author to whom correspondence should be addressed.
Crystals 2016, 6(5), 52; https://doi.org/10.3390/cryst6050052
Submission received: 25 March 2016 / Revised: 25 April 2016 / Accepted: 3 May 2016 / Published: 11 May 2016
(This article belongs to the Special Issue Phononic Crystals)

Abstract

:
Bragg band gaps of phononic crystals generally, but not always, open at Brillouin zone boundaries. The commonly accepted explanation stems from the empty lattice model: assuming a small material contrast between the constituents of the unit cell, avoided crossings in the phononic band structure appear at frequencies and wavenumbers corresponding to band intersections; for scalar waves the lowest intersections coincide with boundaries of the first Brillouin zone. However, if a phononic crystal contains elastically anisotropic materials, its overall symmetry is not dictated solely by the lattice symmetry. We construct an empty lattice model for phononic crystals made of isotropic and anisotropic materials, based on their slowness curves. We find that, in the anisotropic case, avoided crossings generally do not appear at the boundaries of traditionally defined Brillouin zones. Furthermore, the Bragg “planes” which give rise to phononic band gaps, are generally not flat planes but curved surfaces. The same is found to be the case for avoided crossings between shear (transverse) and longitudinal bands in the isotropic case.

Graphical Abstract

1. Introduction

Phononic crystals are periodic functional composites made of two or more materials with different mass densities and elastic constants [1]. The propagation of acoustic waves in phononic crystals is characterized by a complex dispersion relation (the relation between frequency and wave vector), also termed the band structure. A characteristic feature of the phononic crystal band structure is the existence of band gaps, i.e., frequency ranges within which the propagation of acoustic waves is prohibited, either in a specific propagation direction, or in any direction (complete band gaps). Phononic crystals have attracted a rapidly growing interest motivated both by fundamental aspects of wave phenomena and by potential applications in many fields (see, e.g., the review by Hussein et al. [2]).
The phononic band structure can be computed numerically using several methods such as multiple scattering theory [3,4], plane wave expansion [5,6,7], and finite element method [8,9,10]. However, it is also important to understand how the band structure forms and how it is affected by the geometry of the phononic crystal and properties of constituent materials. Band gaps appearing in the wave propagation in periodic media are often termed “Bragg band gaps” as their origin is closely related to Bragg diffraction [5,6,11,12,13]. Indeed, in the limit of vanishing periodic perturbation, the band gaps form at wavevectors satisfying the Bragg reflection condition [14]. The band structure of a medium with a vanishing periodicity is referred to as the “empty lattice” band structure. It is constructed of dispersion bands of the homogeneous medium periodically repeated in the reciprocal lattice. For scalar waves in an isotropic medium, the intersections of dispersion bands form planes (referred to as Bragg planes) which bisect reciprocal lattice vectors at right angles. Domains of the reciprocal space bounded by Bragg planes are termed Brillouin zones (BZs), with the first BZ being the Wigner-Seitz cell of the reciprocal lattice [15]. In the case of a finite periodic perturbation, dispersion bands separate along the Bragg planes, forming band gaps; in particular, the gap between the first and second dispersion bands forms at the boundary of the first BZ. Thus, the formation of the band structure can be understood based solely on the geometry of the reciprocal lattice.
The situation with elastic waves in phononic crystals is more complicated than that with scalar waves due to the presence of longitudinal and shear waves. Band gaps resulting from avoided crossings of longitudinal and shear bands form at inconspicuous locations inside the BZs rather than at BZ boundaries [16,17,18]. Elastic anisotropy will complicate matters even further. A recent study of anisotropic photonic crystals by Sivarajah et al. [19] revealed that in the anisotropic case the Bragg planes generally do not correspond to BZ boundaries constructed using the Wigner-Seitz bisection method. Consequently, the conventionally defined first BZ is no longer bounded by Bragg planes and does not conform to the original definition of the BZ by Brillouin (even though it can still be used as a primitive cell of the reciprocal lattice). Sivarajah et al. [19] then proposed an alternative first BZ bounded by Bragg planes constructed using the empty lattice method.
In solid state acoustics, anisotropic materials (typically natural crystals) are widely used, and phononic crystals made of anisotropic materials have been investigated in a number of studies [1,18,20,21]. While these studies were concerned with the analysis of the numerically calculated band structure, it would be desirable to understand the band gap formation in the limit of small periodicity without resorting to numerical computations, on par with the isotropic case.
In this paper, we demonstrate the utility of the empty lattice model for analyzing the formation of Bragg band gaps in phononic crystals in the presence of longitudinal-shear intersections and elastic anisotropy. We use analytical calculations to construct empty-lattice band structures for systems of increased complexity, from scalar waves in an isotropic medium to vector waves in a strongly anisotropic solid. We show that in the anisotropic case (as well as in the case of longitudinal-shear crossings) Bragg “planes” are generally no longer flat planes but curved surfaces. We then numerically calculate band structures of phononic crystals with a finite periodic perturbation to demonstrate the formation of band gaps at locations predicted by the empty lattice model.

2. Empty Lattice Model

2.1. Analytical Model

In this section, we construct an empty lattice model for elastic waves propagating in elastically anisotropic phononic crystals. We obtain the empty-lattice band structure and the intersections of Bloch waves based on the slowness curves for bulk elastic waves propagating in the solid [22]. The empty lattice model applies to a fictitious medium which has the same periodicity as the phononic crystal but is homogeneous, i.e., the periodic perturbation is considered vanishingly small. For definiteness, we consider the case of two-dimensional square-lattice phononic crystals, as depicted in Figure 1a, but the analysis can be straightforwardly extended to other Bravais lattices. Figure 1b shows a schematic construction of the dispersion relation for Bloch waves in reciprocal space. The origin of reciprocal space is located at Γ 0 , 0 and Γ α 1 , α 2 denotes the reciprocal lattice points with coordinates ( b α 1 , b α 2 ) , where b = 2 π / a and a is the lattice constant. The angular frequency ω is zero at all reciprocal lattice points Γ α 1 , α 2 [14]. From these points originate cones that grow linearly with ω since bulk wave propagation is non dispersive in the homogeneous solid. Each cone thus shows the dispersion relation between angular frequency and wavevector for the Bloch harmonics labeled by the pair of integers α = ( α 1 , α 2 ) . The local slope is the slowness of a bulk wave. There are in general three bulk waves with orthogonal polarizations, and hence three cones originating from each reciprocal lattice point, though only one is depicted in Figure 1b. It is clear that every two different cones will eventually intersect. The band structure is often represented by vertical cross-sections in particular reciprocal lattice directions. For quantitative evaluation of band gaps, all the boundaries of the irreducible BZ should be considered when plotting the band structure [21]. Here, we investigate the mechanism of appearance of Bragg band gaps but not their precise width nor the existence of complete band gaps. Consequently, we plot the band structure along the path M-Γ-X of the first BZ that includes all high symmetry points. The reduced frequency f a = ω a / ( 2 π ) is plotted as a function of the reduced wavenumber k a / ( 2 π ) .
The slowness curve s ( ψ ) for a particular bulk wave is easily obtained from the Christoffel equation [22], with ψ the direction angle (see Figure 1c for its definition). The slowness is the inverse of the phase velocity. Any point ( k , ω ) belonging to cone α = ( α 1 , α 2 ) satisfies
k = ω s ( ψ ) n + b α
with the unit vector n = ( cos ψ , sin ψ ) T . Let us consider any wave vector inside the first BZ with the parametrization
k = b κ = b κ 1 κ 2 , ( κ 1 , κ 2 ) - 1 2 , 1 2 2 .
For instance, we can take κ 2 = 0 for the Γ-X direction and κ 1 = κ 2 for the Γ-M direction, and sweep κ 1 in the range of [0, 0.5]. When plotting the band structure, we wish to obtain ω as a function of k . Writing
ω s ( ψ ) n = b ( κ - α ) ,
we see that the vectors n and κ - α are proportional. This condition determines uniquely angle ψ as a function of κ and α . The frequency can further be obtained by
ω = b s - 1 ( ψ ) | κ - α | = b s - 1 ( ψ ) ( κ 1 - α 1 ) 2 + ( κ 2 - α 2 ) 2 .
For the cone centered at Γ 0 , 0 , the above equation simplifies to
ω = b s - 1 ( ψ ) | κ | = b s - 1 ( ψ ) κ 1 2 + κ 2 2 .
Finally, intersections between cones ( α 1 , α 2 ) and ( β 1 , β 2 ) can be determined as the values of ( ω , κ ) that satisfy
ω = b s - 1 ( ψ ( κ , α ) ) | κ - α | = b s - 1 ( ψ ( κ , β ) ) | κ - β | .

2.2. Empty Lattice Model for Scalar Waves in an Isotropic Medium

We first consider scalar waves propagating in an isotropic solid, such as epoxy. This medium supports two shear bulk waves and one longitudinal bulk wave. The out-of-plane (shear) waves remain uncoupled even when a two-dimensional periodic modulation is imposed in the plane ( x 1 , x 2 ) . The slowness curve of this shear wave is shown in Figure 2a. It is simply a circle of constant radius s s . Equations (4) and (5) simplify to
ω = b ( κ 1 - α 1 ) 2 + ( κ 2 - α 2 ) 2 / s s
and
ω = b κ 1 2 + κ 2 2 / s s .
Intersections between cones ( 0 , 0 ) and ( α 1 , α 2 ) are obtained by equating the two equations above, which results in
2 κ · α = α · α .
This means that intersections occur at the perpendicular line to the connection of reciprocal lattice points, in accordance with the definition of Brillouin zones [14]. The band structure for the scalar and isotropic empty lattice model can be obtained directly using Equation (7).
The empty-lattice band structure for the out-of-plane polarized waves in epoxy is shown in Figure 2b. Each dispersion branch is labeled according to the reciprocal lattice point Γ α 1 , α 2 from which the cone it belongs to originates. Note that the (1,0) and (0,1) shear Bloch waves are degenerate in the Γ-M direction, but not in the Γ-X direction. Numerical (colored dots) and analytical (solid lines) results are consistent (see Methods in Section 5 for a description of band structure computation). Numerical calculations in Section 2 serve to confirm analytical results and provide polarization information for in-plane waves. The first branch intersection along both the Γ-X and the Γ-M directions appears at the high symmetry points X and M of the first BZ. There are also branch intersections located inside the first BZ at higher frequencies. According to Equation (6), intersections between branches ( - 1 , 0 ) and ( 1 , 1 ) are located at b ( 0 . 25 , 0 ) (point S 1 ) and b ( 1 / 6 , 1 / 6 ) (point S 2 ). In fact, they belong to shifted replicas of higher order BZ boundaries. Such a situation cannot occur in the one-dimensional empty lattice model [23]. Isofrequency curves corresponding to the first band are shown in Figure 2c. They are circles centered at the reciprocal lattice points. The intersection of adjacent cones are marked with thick dashed lines. They are straight lines that bisect the connection between two adjacent reciprocal lattice points, as per Equation (9). These intersections are of course the boundaries of the first BZ as canonically defined. Indeed, this isotropic and scalar case is the textbook case discussed by Brillouin [14].

2.3. Empty Lattice Model for Vector Waves in an Isotropic Solid

Next, we consider vector waves propagating in an isotropic solid. The bulk waves of homogeneous solids have orthogonal polarizations and do not interact, but the introduction of a periodic modulation in the phononic crystal can couple them [18]. The slowness curves for pure longitudinal and shear waves in epoxy are plotted in Figure 3a. They are circles of constant radius s l and s s , respectively. Let us look for the intersections between the longitudinal cone centered at lattice point Γ 0 , 0 and the shear cone centered at lattice point Γ α 1 , α 2 . The dispersion relation for the longitudinal Bloch wave can be obtained by replacing s s with s l in Equation (8),
ω = b κ 1 2 + κ 2 2 / s l ,
while the dispersion relation for the shear Bloch wave is still given by Equation (7). After simple mathematical operations and setting γ = ( s s / s l ) 2 , we have
κ 1 + α 1 γ - 1 2 + κ 2 + α 2 γ - 1 2 = γ ( γ - 1 ) 2 ( α 1 2 + α 2 2 ) .
Intersections of the pure longitudinal and pure shear modes are composed of circular arcs centered at ( - b α 1 / ( γ - 1 ) , - b α 2 / ( γ - 1 ) ). The 4 nearest-neighbor shear cones yield 4 such arcs for ( α 1 = ± 1 , α 2 = 0 ) and ( α 1 = 0 , α 2 = ± 1 ) . As a note, for isotropic solids the general relation s s > 2 s l implies γ > 2 .
The empty-lattice band structure for in-plane polarized waves in epoxy is shown in Figure 3b. The color scale represents the polarization information in the considered propagation direction [10,18]. Owing to the same slowness s s , shear branches in Figure 3b are exactly the same as those in Figure 2b. Intersections of longitudinal branches are found at BZ boundaries. In contrast, longitudinal branches can intersect shear branches at wavevectors located inside the first BZ. Two such intersection points I 1 and I 2 are identified in Figure 3b. Isofrequency curves corresponding to the second band for the in-plane waves are shown in Figure 3c. As the wavenumber increases from 0, the ( 0 , 0 ) longitudinal branch is first followed until the intersection point is reached, after which the second shear branch is followed. The first intersections of the longitudinal and shear cones are marked with a thick dashed line. In contrast to Figure 2c, these Bragg-plane intersections are composed of four arcs located inside the first BZ, as predicted by Equation (11), rather than straight lines. This rule generally holds for all other longitudinal-shear Bragg-plane intersections.

2.4. Empty Lattice Model for Vector Waves in an Anisotropic Solid

In this section, we consider the most general case, the empty lattice model for vector waves propagating in anisotropic solids. For definiteness, examples are shown for rutile (TiO 2 , 4 / m m m tetragonal crystal). The crystallographic orientation is chosen to be the Z-cut, that is the Z crystallographic axis is parallel to the x 3 -axis of the reference frame in Figure 1a. The orientation we consider here is X - 15 , meaning the x 1 -axis is obtained from the X crystallographic axis by a rotation by - 15 about the x 3 -axis. Slowness curves are shown in Figure 4a. There are 3 bulk elastic waves: a pure shear wave polarized along the x 3 -axis, and a quasi-shear (QS) and a quasi-longitudinal (QL) waves polarized in-plane. The pure shear wave case is identical with the analysis in Section 2.2, so we focus mostly on the QS and QL waves in this section. In the anisotropic case it is not generally possible to simplify analytical expressions for the empty lattice model from Section 2.1 as we did previously for the isotropic case.
The empty-lattice band structure for out-of-plane polarized waves is shown in Figure 4b for the X−15 orientation of rutile. Branch labels are identical to those for epoxy in Figure 2b. In fact, the two band structures can be made identical if the frequencies are multiplied by the ratio of the shear slownesses.
The QL and the QS slownesses in Figure 4a are strongly anisotropic. They get close in some directions and move away from each other in other directions. The empty-lattice band structure for the in-plane polarized waves for the X - 15 orientation is shown in Figure 4c. In the Γ-M direction, the degeneracy of the ( 1 , 0 ) and the ( 0 , 1 ) QS Bloch waves is lifted, giving rise to separate branches. Moreover, the group velocity in the direction of propagation vanishes at some points in the Γ-M direction for the ( 0 , 1 ) and ( 1 , - 1 ) QS branches [24]. Their appearance here is owing to the combination of periodicity and anisotropy. Figure 4d shows the isofrequency curves corresponding to the first QS band for the X - 15 orientation. Their shape is strongly influenced by the shape of the QS slowness curve. It is remarkable that intersections between adjacent cones form curved lines. These QS Bragg “planes” generally deviate from the straight boundaries of the first BZ. Only the two high symmetry points X and M are preserved owing to the central symmetry of the slowness curve.
Finally, we consider the case of Z-cut rutile in the X orientation. Though anisotropic, the slowness curves plotted in Figure 5a have the symmetry of the square lattice. Lowest intersections between quasi-shear cones in Figure 5b are then exactly the same as the boundaries of the first BZ. Other intersections, however, can appear inside the first BZ. Figure 4e and Figure 5c show the isofrequency curves corresponding to the second band for the X - 15 orientation and for the X orientation, respectively. Intersections of the QS and QL Bloch waves are shown in thick dashed lines. They both locate inside the first BZ.

3. Formation of Bragg Band Gaps in Phononic Crystals

The empty lattice model predicts the positions of band intersections in reciprocal space. When the periodic modulation in the phononic crystal is finite, these intersections can turn into avoided crossings and band gaps open. In order to study the formation of avoided crossings (band gaps) in phononic crystals, we introduce small air-filled holes in the two-dimensional square-lattice phononic crystal depicted in Figure 1a. Material A is either epoxy or rutile, while material B is air. The ratio of the hole diameter to the lattice constant is d / a = 0 . 2 .
Band structures for square-lattice phononic crystals with isotropic (epoxy) and anisotropic (Z-cut rutile, X - 15 orientation) solid components are shown in Figure 6 and Figure 7, respectively. For pure shear waves, avoided crossings occur at high symmetry points X and M. In addition, in Figure 6a, avoided crossings also appear around points S 1 and S 2 . A directional band gap could even be generated along the Γ-X direction if a larger hole were considered, as we checked numerically. This phenomenon could also be observed in Figure 7a if a larger frequency range were presented.
For in-plane polarized waves in Figure 6b and Figure 7b, avoided crossings occur not only at the high symmetry points, but also inside the first BZ (for instance the first intersections I 2 and I 2 of the QS and QL branches in the Γ-M direction). It is noteworthy that no avoided crossing is formed at I 1 . The reason for the different behavior at I 1 and I 2 is that in the Γ-M direction the (1, 0) shear wave has a polarization not orthogonal to the (0, 0) longitudinal wave; hence an avoided crossing is expected to appear at I 2 when a periodic modulation is applied. In the Γ-X direction, however, the two waves remain orthogonal, and the orthogonality is preserved by the symmetry of the phononic crystal lattice. Consequently, no avoided crossing appears at I 1 . All avoided crossings appear at intersections of the empty-lattice band structure. Similar results were found in two-dimensional phononic crystals with isotropic solid components [17] or holes in a piezoelectric matrix [18], where avoided crossing is generally accompanied by a transfer of the polarization from one branch to the other. It is also noted that the intersection point I 2 in Figure 7b can be tuned by changing the orientation of the anisotropic solid. A relatively large band gap could thus be expected when the frequencies of points I 2 and M are the same.
When inclusion B is a solid different from solid A in Figure 1a, the empty lattice model can still be used as long as the volume fraction of material B remains small. In this case, avoided crossings are again found to appear around the intersections predicted by the empty lattice model for the matrix. The same is true when the volume fraction is large but the material contrast is small. For general phononic crystals composed of several different solids with large relative volume fractions or large material contrast, the empty lattice model does not apply anymore. However, there could be situations when a medium is patterned on a very fine scale, and then a periodic perturbation is introduced on a larger scale (for example, consider a periodic system of holes in a fiber-reinforced composite). One can also envision a metamaterial containing resonant inclusions (not necessarily periodic), with a periodic structure imposed on a larger scale. In these cases the empty lattice model can be constructed based on the frequency-dependent effective properties (effective mass densities and elastic constants) of the underlying elastic metamaterial medium [25,26,27].
Moreover, it has been shown that the phonon dispersion relation can be measured experimentally along any direction of the BZ by using Brillouin light scattering [28,29,30,31,32,33,34]. In these works, either resonance (hybridization) or Bragg band gaps were evidenced. Clearly, the theory in the present paper only applies to Bragg band gaps. The lowest Bragg band gaps were found to appear around wavenumbers corresponding to the high symmetry points of the BZ for the considered lattices [28,29,30,31,32]. Nonetheless, by tuning the elastic properties of the constituting materials, the same experimental approach should allow one to observe Bragg band gap formation inside the BZ, similarly to the case of photonic crystals [19].

4. Conclusions

In summary, we have constructed an empty lattice model for elastically anisotropic phononic crystals based on the slowness curves of matrix material, and have predicted the positions of band intersections and Bragg band gaps opening in reciprocal space. For scalar waves in an isotropic medium, the first intersections are located exactly at the boundaries of the first BZ and subsequent intersections occur at shifted replicas of boundaries of higher order BZs. For vector waves with different polarizations, intersections define curved closed contours different from those of the BZ boundaries, which can occur inside the first BZ. For vector waves in an anisotropic solid, intersections also in general form curved closed contours different from those of the BZ boundaries. Numerical calculations of the band structure confirm that avoided crossings and consequently Bragg band gaps form around the intersections predicted by the empty lattice model for the matrix.

5. Materials and Methods

5.1. Materials

We use epoxy as the isotropic material and rutile as the anisotropic material. The corresponding material parameters can be found e.g., in Ref. [1]. For epoxy, the mass density is ρ = 1142 kg/m 3 , and the independent elastic constants are c 11 = 7 . 54 GPa and c 44 = 1 . 48 GPa. For the X orientation of Z-cut rutile, the mass density is ρ = 4280 kg/m 3 , and the independent elastic constants are c 11 = 266 GPa, c 12 = 173 GPa, c 13 = 136 GPa, c 33 = 470 GPa, c 44 = 124 GPa, and c 66 = 189 GPa.

5.2. Methods

We use the open-source finite element software FreeFEM + + [35] to calculate band structures and slowness curves. Variational formulations of the elastodynamic equation and explanations of how to write numerical simulation codes for phononic crystals with FreeFEM + + can be found in Ref. [1]. The relevant programs can be downloaded for free for scientific research [36]. Band structures and isofrequency curves are obtained by letting the wavevector k sweep the high symmetry boundaries or the whole area of the first BZ, respectively.

Acknowledgments

The authors would like to thank Anurupa Shaw for helpful discussions. Financial support by the Labex ACTION program (Contract No. ANR-11-LABX-0001-01) is gratefully acknowledged. The second author would like to thank the support from the S3TEC Energy Frontier Research Center funded by the U.S. Department of Energy, Office of Science, Basic Energy Sciences (Award No. DE-SC0001299/DE-FG02-09ER46577).

Author Contributions

Vincent Laude formulated the idea, Yan Feng Wang conducted the numerical simulations, Vincent Laude, Yan Feng Wang, and Alexei A. Maznev discussed the results and wrote the manuscript.

Conflicts of Interest

The authors declare no conflict of interest.

References and Notes

  1. Laude, V. Phononic Crystals: Artificial Crystals for Sonic, Acoustic, and Elastic Waves; Walter de Gruyter: Berlin, Germany, 2015. [Google Scholar]
  2. Hussein, M.I.; Leamy, M.J.; Ruzzene, M. Dynamics of phononic materials and structures: Historical origins, recent progress, and future outlook. Appl. Mech. Rev. 2014, 66, 040802. [Google Scholar] [CrossRef]
  3. Kafesaki, M.; Economou, E.N. Multiple-scattering theory for three-dimensional periodic acoustic composites. Phys. Rev. B 1999, 60, 11993. [Google Scholar] [CrossRef]
  4. Liu, Z.; Chan, C.; Sheng, P.; Goertzen, A.; Page, J. Elastic wave scattering by periodic structures of spherical objects: Theory and experiment. Phys. Rev. B 2000, 62, 2446. [Google Scholar] [CrossRef]
  5. Kushwaha, M.S.; Halevi, P.; Dobrzynski, L.; Djafari-Rouhani, B. Acoustic band structure of periodic elastic composites. Phys. Rev. Lett. 1993, 71, 2022. [Google Scholar] [CrossRef] [PubMed]
  6. Sigalas, M.; Economou, E. Band structure of elastic waves in two dimensional systems. Solid State Commun. 1993, 86, 141–143. [Google Scholar] [CrossRef]
  7. Moiseyenko, R.P.; Laude, V. Material loss influence on the complex band structure and group velocity in phononic crystals. Phys. Rev. B 2011, 83, 064301. [Google Scholar] [CrossRef]
  8. Wang, Y.F.; Wang, Y.S.; Su, X.X. Large bandgaps of two-dimensional phononic crystals with cross-like holes. J. Appl. Phys. 2011, 110, 113520. [Google Scholar] [CrossRef]
  9. Laude, V.; Moiseyenko, R.P.; Benchabane, S.; Declercq, N.F. Bloch wave deafness and modal conversion at a phononic crystal boundary. AIP Adv. 2011, 1, 041402. [Google Scholar] [CrossRef] [Green Version]
  10. Wang, Y.F.; Wang, Y.S.; Laude, V. Wave propagation in two-dimensional viscoelastic metamaterials. Phys. Rev. B 2015, 92, 104110. [Google Scholar] [CrossRef]
  11. Martinezsala, R.; Sancho, J.; Sánchez, J.; Gómez, V.; Llinares, J.; Meseguer, F. Sound-attenuation by sculpture. Nature 1995, 378, 241. [Google Scholar] [CrossRef]
  12. Suzuki, T.; Paul, K. Complex elastic wave band structures in three-dimensional periodic elastic media. J. Mech. Phys. Solids 1998, 46, 115–138. [Google Scholar] [CrossRef]
  13. Dowling, J.P. Sonic band structure in fluids with periodic density variations. J. Acoust. Soc. Am. 1992, 91, 2539–2543. [Google Scholar] [CrossRef]
  14. Brillouin, L. Wave Propagation in Periodic Structures: Electric Filters and Crystal Lattices; Dover Publications: New York, NY, USA, 1946. [Google Scholar]
  15. Ashcroft, J.; Mermin, N. Solid State Physics; Harcourt Inc.: San Diego, CA, USA, 1976. [Google Scholar]
  16. Tamura, S.; Hurley, D.; Wolfe, J. Acoustic-phonon propagation in superlattices. Phys. Rev. B 1988, 38, 1427–1449. [Google Scholar] [CrossRef]
  17. Wu, T.T.; Huang, Z.G. Level repulsions of bulk acoustic waves in composite materials. Phys. Rev. B 2004, 70, 214304. [Google Scholar] [CrossRef]
  18. Achaoui, Y.; Khelif, A.; Benchabane, S.; Laude, V. Polarization state and level repulsion in two-dimensional phononic crystals and waveguides in the presence of material anisotropy. J. Phys. D: Appl. Phys. 2010, 43, 185401. [Google Scholar] [CrossRef]
  19. Sivarajah, P.; Maznev, A.; Ofori-Okai, B.; Nelson, K. What is the Brillouin zone of an anisotropic photonic crystal? Phys. Rev. B 2016, 93, 054204. [Google Scholar] [CrossRef]
  20. Wang, Y.Z.; Li, F.M.; Huang, W.H.; Jiang, X.; Wang, Y.S.; Kishimoto, K. Wave band gaps in two-dimensional piezoelectric/piezomagnetic phononic crystals. Int. J. Solids Struct. 2008, 45, 4203–4210. [Google Scholar] [CrossRef]
  21. Lin, S.C.S.; Huang, T.J. Tunable phononic crystals with anisotropic inclusions. Phys. Rev. B 2011, 83, 174303. [Google Scholar] [CrossRef]
  22. Auld, B.A. Acoustic Fields and Waves in Solids; Wiley: New York, NY, USA, 1973. [Google Scholar]
  23. Inoue, K.; Ohtaka, K. Photonic Crystals: Physics, Fabrication and Applications; Springer: Berlin, Germany, 2004. [Google Scholar]
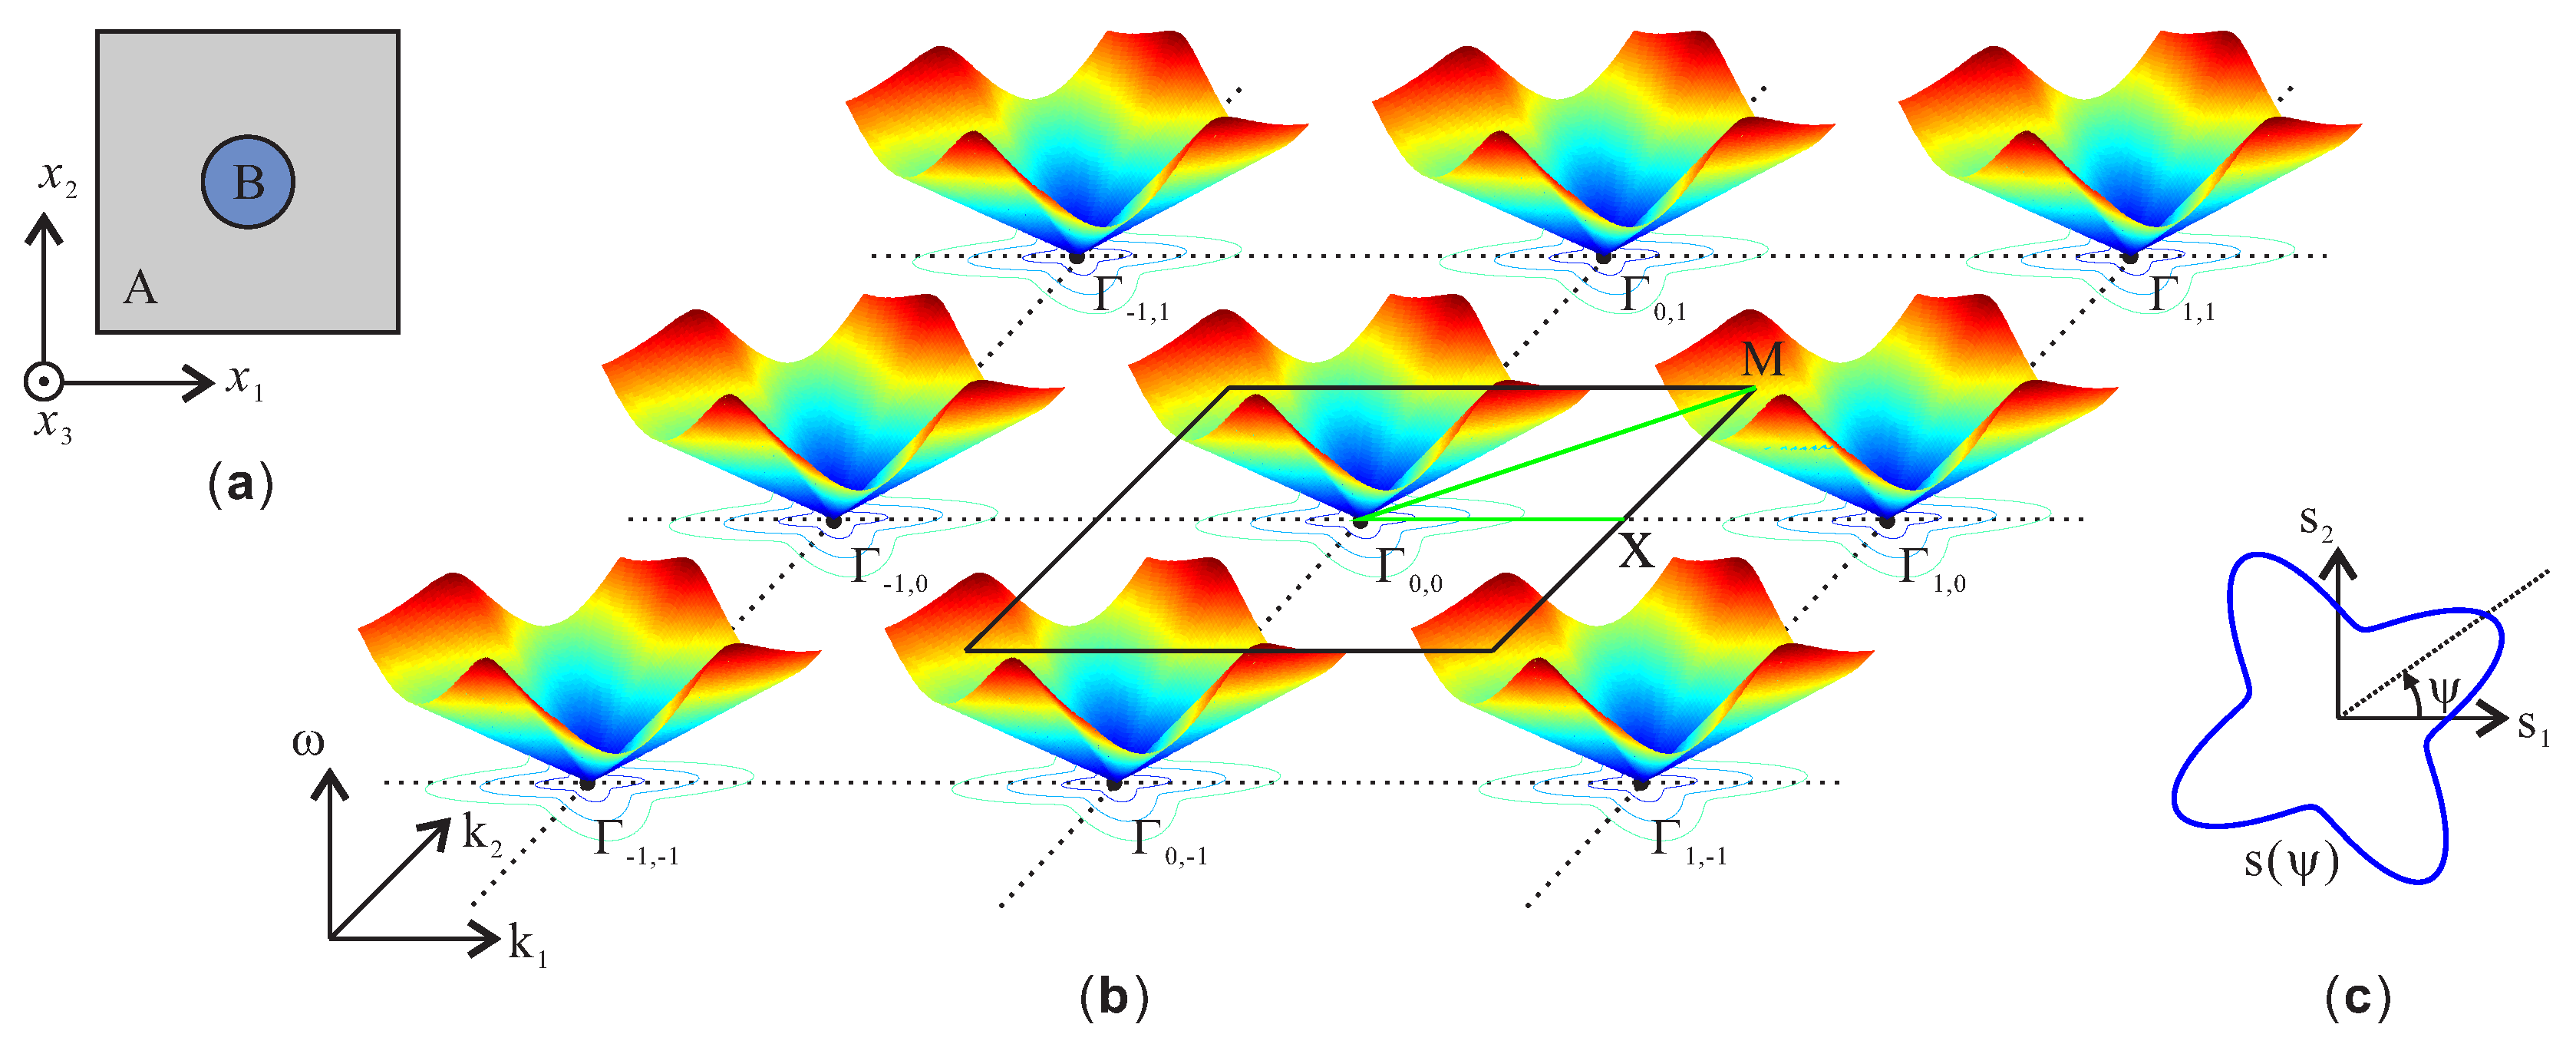
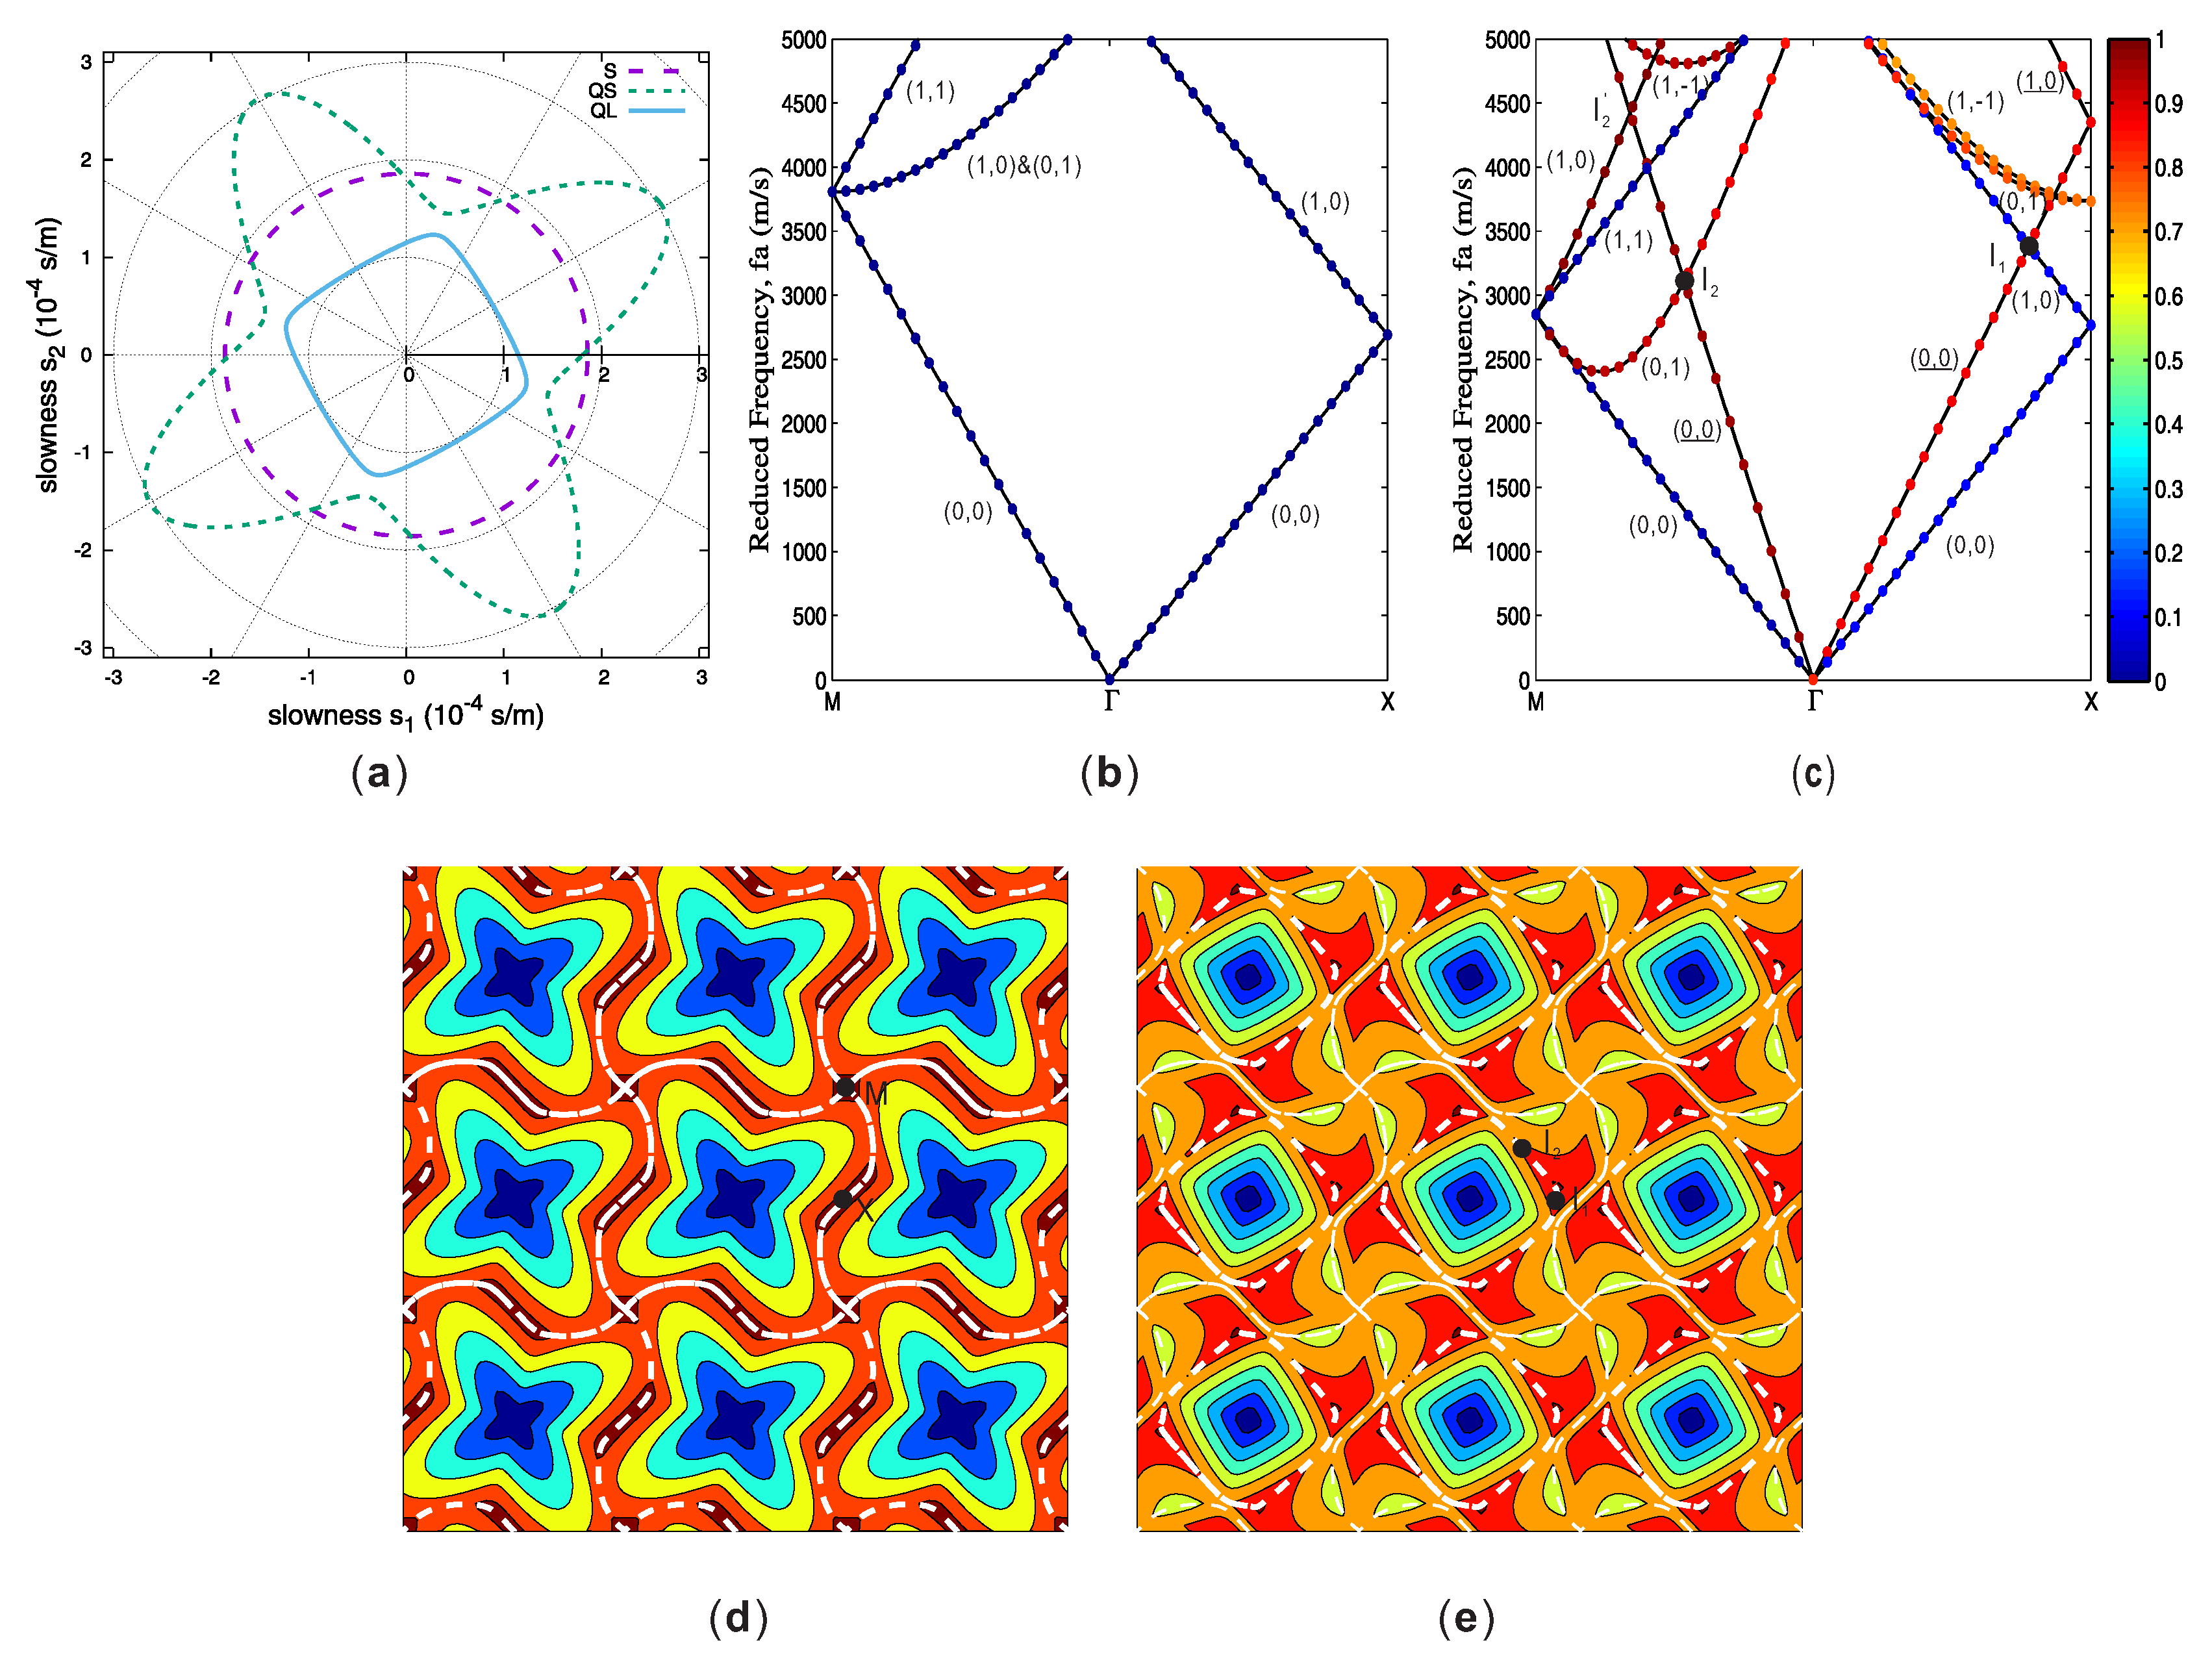
  24. At the minimum of these branches, the group velocity vanishes in the Γ-M direction. However, the orthogonal group velocity component is non-zero since the equifrequency contour centered on Γ0,1 or Γ1,−1 is tangent to the propagation direction at these points. Energy propagation is then orthogonal to the Bloch wavevector.
  25. Lai, Y.; Wu, Y.; Sheng, P.; Zhang, Z.Q. Hybrid elastic solids. Nat. Mater. 2011, 10, 620–624. [Google Scholar] [CrossRef] [PubMed]
  26. Zhu, R.; Liu, X.; Hu, G.; Sun, C.; Huang, G. Negative refraction of elastic waves at the deep-subwavelength scale in a single-phase metamaterial. Nat. Commun. 2014, 5, 5510. [Google Scholar] [CrossRef] [PubMed]
  27. Wang, Y.F.; Wang, Y.S.; Zhang, C. Two-dimensional locally resonant elastic metamaterials with chiral comb-like interlayers: Bandgap and simultaneously double negative properties. J. Acoust. Soc. Am. 2016. accepted for publication. [Google Scholar]
  28. Gorishnyy, T.; Jang, J.H.; Koh, C.; Thomas, E.L. Direct observation of a hypersonic band gap in two-dimensional single crystalline phononic structures. Appl. Phys. Lett. 2007, 91, 121915. [Google Scholar] [CrossRef]
  29. Still, T.; Cheng, W.; Retsch, M.; Sainidou, R.; Wang, J.; Jonas, U.; Stefanou, N.; Fytas, G. Simultaneous occurrence of structure-directed and particle-resonance-induced phononic gaps in colloidal films. Phys. Rev. Lett. 2008, 100, 194301. [Google Scholar] [CrossRef] [PubMed]
  30. Sato, A.; Pennec, Y.; Yanagishita, T.; Masuda, H.; Knoll, W.; Djafari-Rouhani, B.; Fytas, G. Cavity-type hypersonic phononic crystals. New J. Phys. 2012, 14, 113032. [Google Scholar] [CrossRef]
  31. Zhu, G.; Swinteck, N.Z.; Wu, S.; Zhang, J.S.; Pan, H.; Bass, J.D.; Deymier, P.A.; Banerjee, D.; Yano, K. Direct observation of the phonon dispersion of a three-dimensional solid/solid hypersonic colloidal crystal. Phys. Rev. B 2013, 88, 144307. [Google Scholar] [CrossRef]
  32. Schneider, D.; Liaqat, F.; El Abouti, O.; Tremel, W.; Butt, H.J.; Djafari-Rouhani, B.; Fytas, G.; El Boudouti, E.H. Defect-controlled hypersound propagation in hybrid superlattices. Phys. Rev. Lett. 2013, 111, 164301. [Google Scholar] [CrossRef] [PubMed]
  33. Beltramo, P.J.; Schneider, D.; Fytas, G.; Furst, E.M. Anisotropic hypersonic phonon propagation in films of aligned ellipsoids. Phys. Rev. Lett. 2014, 113, 205503. [Google Scholar] [CrossRef] [PubMed]
  34. Alonso-Redondo, E.; Schmitt, M.; Urbach, Z.; Hui, C.; Sainidou, R.; Rembert, P.; Matyjaszewski, K.; Bockstaller, M.; Fytas, G. A new class of tunable hypersonic phononic crystals based on polymer-tethered colloids. Nat. Commun. 2015, 6, 8309. [Google Scholar] [CrossRef] [PubMed]
  35. Hecht, F. New development in FreeFem++. J. Numer. Math. 2012, 20, 251–266. [Google Scholar] [CrossRef]
  36. FreeFEM++ Codes. Available online: http://members.femto-st.fr/vincent-laude/freefem-scripts-numerical-simulation-phononic-crystals (accessed on 5 May 2016).
Figure 1. Graphical construction of the empty lattice model for anisotropic phononic crystals. (a) The unit cell of a two-dimensional square-lattice phononic crystal. When the matrix (A) and the inclusion (B) are composed of the same material, the model reduces to the unit cell of the empty lattice. (b) The dispersion relation for Bloch harmonics in reciprocal space is a set of cones originating from reciprocal lattice points. The vertical axis is the angular frequency. The horizontal plane is the reciprocal space, and the black dots are for reciprocal lattice points labeled as Γ α 1 , α 2 with α 1 and α 2 being arbitrary integers. The central square centered at Γ 0 , 0 (black solid line) is the boundary of the first BZ for the square lattice with high symmetry points X and M. The colored lines centered around each reciprocal lattice points represent the isofrequency curves of an arbitrary anisotropic material. The shape of isofrequency curves is a frequency-scaled version of the slowness curve for the considered bulk wave shown in (c). ψ is the direction angle defined with respect to the s 1 axis.
Crystals 06 00052 g001
Figure 2. Empty lattice model for out-of-plane polarized waves in epoxy. (a) The slowness curve is a circle in this case. (b) The empty-lattice band structure for the out-of-plane polarized waves of epoxy is shown. Numerical and analytical results are shown with solid circles and lines, respectively. Each branch is labeled by an index corresponding to the reciprocal lattice point from which the generating cone originates. Points S 1 and S 2 are examples of intersections between branches located inside the first Brillouin zone (BZ). (c) Isofrequency curves are plotted for the first band. The white dashed lines mark the first intersection between cones centered at adjacent reciprocal lattice points.
Crystals 06 00052 g002
Figure 3. Empty lattice model for in-plane polarized waves in epoxy. (a) The slowness curves for pure shear (dashed line) and for pure longitudinal (solid line) waves are both circles. (b) The empty-lattice band structure for in-plane polarized waves is shown. Numerical and analytical results are shown with solid circles and lines, respectively. The color scale represents the polarization in the propagation direction, from 0 (shear) to 1 (longitudinal). Each dispersion branch is labeled by an index corresponding to the reciprocal lattice point from which the generating cone originates. Indices for longitudinal branches are underlined for clarity. Points I 1 and I 2 are the first intersections between shear and longitudinal branches. (c) Isofrequency curves are plotted for the second band. The thick dashed lines show the first intersection between shear and longitudinal cones, while the thin dashed lines show the first intersection between pure shear cones.
Crystals 06 00052 g003
Figure 4. Empty lattice model for in-plane polarized waves in Z-cut rutile with the X - 15 orientation. (a) The three slowness curves are for a pure shear wave (long dashed line), a quasi-shear (QS) wave (short dashed line) and a quasi-longitudinal (QL) wave (solid line). The empty-lattice band structures for (b) out-of-plane and (c) in-plane polarized waves are shown. Numerical and analytical results are shown with solid circles and lines, respectively. The color scale in (c) represents the polarization in the propagation direction, from 0 (shear) to 1 (longitudinal). Each dispersion branch is labeled by an index corresponding to the reciprocal lattice point from which the generating cone originates. Indices for longitudinal branches are underlined for clarity. Points I 1 , I 2 , and I 2 are intersections between QS and QL branches. (d) Isofrequency curves are plotted for the first band of in-plane waves. The thick dashed lines represent the intersections between adjacent QS cones. (e) Isofrequency curves are plotted for the second band of in-plane waves. The thick dashed lines show the first intersection between QS and QL cones and thin dashed lines show intersections between adjacent QS cones.
Crystals 06 00052 g004
Figure 5. Empty lattice model for in-plane polarized waves in Z-cut rutile. (a) The three slowness curves are for a pure shear wave (long dashed line), a QS wave (short dashed line) and a QL wave (solid line). (b) Isofrequency curves are plotted for the first band of in-plane waves. The thick dashed lines represent the intersections between adjacent QS cones. (c) Isofrequency curves are plotted for the second band of in-plane waves. The thick dashed lines show the first intersection between QS and QL cones.
Crystals 06 00052 g005
Figure 6. Band structures for (a) the out-of-plane polarized waves and (b) the in-plane polarized waves of epoxy with air holes ( d / a = 0 . 2 ). The color scale represents the polarization amount in the propagation direction, from 0 (shear) to 1 (longitudinal). Solid lines correspond to the empty lattice model.
Crystals 06 00052 g006
Figure 7. Band structures for (a) the out-of-plane polarized waves and (b) the in-plane polarized waves of Z-cut rutile for the X - 15 orientation with air holes ( d / a = 0 . 2 ). The color scale represents the polarization amount in the propagation direction, from 0 (shear) to 1 (longitudinal). Solid lines correspond to the empty lattice model.
Crystals 06 00052 g007

