Article

Synthesis, Crystal Structural Investigations, and DFT Calculations of Novel Thiosemicarbazones

by
Brian J. Anderson
*,
Jerry P. Jasinski
,
Michael B. Freedman
,
Sean P. Millikan
,
Kelly A. O’Rourke
and
Victoria A. Smolenski
Department of Chemistry, Keene State College, 229 Main Street, Keene, NH 03435-2001, USA
*
Author to whom correspondence should be addressed.
Crystals 2016, 6(2), 17; https://doi.org/10.3390/cryst6020017
Submission received: 8 January 2016 / Revised: 26 January 2016 / Accepted: 28 January 2016 / Published: 2 February 2016
(This article belongs to the Section Biomolecular Crystals)

Abstract

:
The crystal and molecular structures of three new thiosemicarbazones, 2-[1-(2-hydroxy-5-methoxyphenyl)ethylidene]-N-methyl-hydrazinecarbothioamide monohydrate (1), 2-[1-(2-hydroxy-5-methoxyphenyl)ethylidene]-N-ethyl-hydrazinecarbothioamide (2) and 2-[1-(2-hydroxy-4-methoxyphenyl)ethylidene]-N-ethyl-hydrazinecarbothioamide acetonitrile solvate (3), are reported and confirmed by single crystal X-ray diffraction, NMR and UV-vis spectroscopic data. Compound (1), C11H15N3O2S·H2O, crystallizes in the monoclinic with space group P21/c, with cell parameters a = 8.2304(3) Å, b = 16.2787(6) Å, c = 9.9708(4) Å, and β = 103.355(4)°. Compound (2), C12H17N3O2S, crystallizes in the C2/c space group with cell parameters a = 23.3083(6) Å, b = 8.2956(2) Å, c = 13.5312(3) Å, β = 91.077(2)°. Compound (3), C11H15N3O2S·C2H3N, crystallizes in the triclinic P-1 space group with cell constants a = 8.9384(7) Å, b = 9.5167(8) Å, c = 10.0574(8) Å, α = 110.773(7)°, β = 92.413(6)°, and γ = 90.654(7)°. DFT B3LYP/6-31(G) geometry optimized molecular orbital calculations were also performed and frontier molecular orbitals of each compound are displayed. The correlations between the calculated molecular orbital energies (eV) for the surfaces of the frontier molecular orbitals to the electronic excitation transitions from the absorption spectra of each compound have been proposed. Additionally, similar correlations observed among three closely related compounds, (4), 2-[1-(2-hydroxy-4-methoxyphenyl)ethylidene]-N-methyl-hydrazinecarbothioamide, (5), 2-[1-(2-hydroxy-6-methoxyphenyl)ethylidene]-N-methyl-hydrazinecarbothioamide acetonitrile monosolvate and (6), 2-[1-(2-hydroxy-6-methoxyphenyl)ethylidene]-N-ethyl-hydrazinecarbothioamide, examining structural differences from the substitution of the methoxy group from the phenyl ring (4, 5, or 6 position) and the substitution of the terminal amine (methyl or ethyl) to their frontier molecular orbital surfaces and from their Density Functional Theory (DFT) molecular orbital energies provide further support for the suggested assignments of the title compounds.

1. Introduction

Thiosemicarbazones are a versatile class of ligands that bind a metal through a nitrogen and sulfur atom. This class of ligands has been widely studied due to their interesting coordination chemistry, prompting several reviews [1,2,3,4]. Metal complexes with thiosemicarbazone ligands have been found to have biological activity including anti-malarial [5] and anti-cancer properties [6]. Studies have also looked at the ability of these complexes to bind DNA [7] and they have even been investigated as biological imaging agents [8]. Additionally, recent research has shown metal thiosemicarbazone complexes to be effective catalysts for Heck couplings [9], hydrogenations [10], and Hartwig couplings [11]. Due to these areas, there is an interest in developing novel thiosemicarbazone compounds and their metal complexes. Here, we report the synthesis and crystal structure of three new complexes (1, 2, and 3), as well spectroscopic studies and DFT calculations of these three complexes along with comparisons with three other closely related thiosemicarbazones whose crystal structures have previously been published (4 [12], 5 [13], and 6 [14]). These structures are similar in structure, but vary in the position of a methoxy group on the aryl ring, and either a methyl or ethyl group on the terminal amine nitrogen, as shown in Scheme 1 below.
Scheme 1. Synthesis of thiosemicarbazones.
Crystals 06 00017 g010
The typical synthesis of thiosemicarbazones is a condensation between a ketone (or aldehyde) and a thiosemicarbazide. The crystal structures of some other closely related thiosemicarbazones, N-Ethyl-2-[1-(2-hydroxy-4-methylphenyl)ethylidene]hydrazinecarbothioamide [15] and N-Ethyl-2-[1-(2-hydroxynaphthalen-1-yl)ethylidene] hydrazinecarbothioamide [16], have also been reported.

2. Results and Discussion

2.1. Structural Study of (1), (2) and (3)

In this discussion, structural and theoretical comparisons are grouped around pairs of compounds that are similar in containing a 4-methoxy, 5-methoxy or 6-methoxy substitution on the 2-hydroxy-phenyl ring and either a methyl or ethyl group on the terminal amine group, respectively, providing responses for three related pairs of compounds.

Numbering of Structures in Crystal Structure Tables

The numbering system chosen to compare the structural and theoretical data of compounds (1), (2) and (3) is based on the template shown below (Scheme 2). In compounds (4), (5) and (6), the numbering system of the published structures is translated to coincide with the new data in (1), (2) and (3).
Scheme 2. Numbering system for theoretical and experimental data on thiosemicarbazones.
Crystals 06 00017 g011
Figure 1 below, shows the Ortep drawing and packing diagram of Compound (1): 2-[1-(2-hydroxy-5-methoxyphenyl)ethylidene]-N-methyl-hydrazinecarbothioamide monohydrate.
Figure 1. (A) ORTEP drawing of (1) showing the atom numbering scheme and 50% probability displacement ellipsoids of non-H atoms; (B, C) The molecular packing of (1) viewed along the a axis. Dashed lines indicate O–HN, N–HO, O–HO intramolecular hydrogen bonds and weak C–HS, C–HO, O–HS intermolecular interactions forming a 3D supramolecular structure. Hydrogen atoms not involved in hydrogen bonding have been removed for clarity.
Crystals 06 00017 g001
Figure 2 below, shows the Ortep drawing and packing diagram of Compound (2): 2-[1-(2-hydroxy-5-methoxyphenyl)ethylidene]-N-ethyl-hydrazinecarbothioamide.
In (1), C11H15N3O2S·H2O, one molecule and a water molecule crystallize in the asymmetric unit, while in (2), C12H17N3O2S, a single molecule is present. Bond lengths and angles for both compounds are in normal ranges [17] (Table 1). In (1), the dihedral angle between the mean planes of the phenyl ring and hydrazinecarbothioamide group (N1/N2/C8/S1/N3) is 2.0(5)°, forming a nearly planar molecule. In the crystal, an N2–H2O1W intermolecular hydrogen bond in concert with a weak O1W–H1WBS1 intermolecular interaction along with the C9–N3 fragment form an R44(12) ring motif structure (Figure 1). Additional O1–H1N1 intramolecular hydrogen bonds involving the hydroxyl group along with weak C–HO, C–HS and N–HOW, OW–HS intermolecular interactions (Table 2) are also observed forming a three-dimensional (3D) supramolecular structure.
In (2) the dihedral angle between the mean planes of the phenyl ring and hydrazinecarbothioamide group (N1/N2/C8/S1/N3) is 50.3(8)°, forming a significantly twisted molecule. In the crystal, an intramolecular O1–H1N1 hydrogen bond forms a R 2 2 ( 20 ) ring motif structure (Figure 2). In addition, a weak N2–H2S1 intermolecular interaction, which gives rise to a R 2 2 ( 8 ) ring motif along with a weak N3–H3O2 interaction involving the 5-methoxy oxygen atom, forms a two-dimensional (2D) network structure (Table 2).
Figure 2. (A) ORTEP drawing of (2) showing the atom numbering scheme and 50% probability displacement ellipsoids of non-H atoms; (B, C) The molecular packing of (2) viewed along the b axis. Dashed lines indicate O–HO intramolecular hydrogen bonds and weak N–HS, N–HO intermolecular interactions forming a 2D network structure. Hydrogen atoms not involved in hydrogen bonding have been removed for clarity.
Crystals 06 00017 g002
Table 1. Selected crystal and DFT * bond lengths (Å), bond angles (°), and torsion angles (°): (1)–(2).
AtomsDistance, ÅDFT, ÅDistanceDFT, Å
C1-C71.4783(16)1.487 *1.4754(14)1.469 *
C2-O11.3646(15)1.365 *1.3555(13)1.348 *
C5-O21.3660(16)1.371 *1.3809(13)1.359 *
C7-N11.2890(16)1.290 *1.2995(14)1.305 *
N2-C91.3626(16)1.386 *1.3543(13)1.381 *
C9-S11.6815(13)1.665 *1.6903(10)1.684 *
C9-N31.3334(16)1.370 *1.3273(13)1.347 *
N3-C111.4522(18)1.454 *1.4565(14)1.460 *
(1) C11H15N3O2S·H2O
AtomsDistance, ÅDFT, ÅDistanceDFT, Å
C1-C7-N1115.27(10)117.19 *117.17(9)117.64 *
C8-C7-N1125.67(11)123.90 *123.94(9)120.51 *
C7-N1-N2120.44(10)118.04 *117.28(9)119.41 *
N1-N2-C9119.03(10)122.12 *119.67(9)121.40 *
N2-C9-N3113.99(11)110.94 *116.91(9)115.10 *
N2-C9-S1122.47(9)118.63 *119.56(8)118.63 *
(2) C12H17N3O2S
AtomsDistance, ÅDFT, ÅDistanceDFT, Å
C7-N1-N2-C9−177.40(11)173.15 *−152.54(10)172.86 *
C1-C7-N1-N2178.93(10)179.36 *−173.28(9)176.73 *
N1-N2-C9-N3−177.90(10)174.62 *16.31(15)−14.94 *
N1-N2-C9-S12.06(15)−6.78 *−165.17(8)166.03 *
* DFT B3LYP 6-31 G(d) geometry optimization calculations for (1) and (2).
Table 2. Hydrogen bond interactions for (1) and (2) (Å and °).
D–HAd(D–H)/Åd(H–A)/Åd(DA)/Å<(DHA)/°
(1) C11H15N3O2S·H2O
O1–H1N10.841.852.521(13)143.7
N2–H2O1W #10.882.072.8869(14)155.0
N3–H2O1W #10.882.233.0367(16)151.4
C8–H8BO1 #20.982.813.4458(17)123.1
C10–H10AS1 #30.982.823.4756(18)124.9
C11–H11BO2 #20.982.683.3833(19)129.1
O1W–H1WAO1 #40.851.992.8200(13)165.3
O1W–H1WBS10.852.433.2691(11)167.3
(2) C12H17N3O2S
O1–H1N10.841.912.6317(12)144.0
N2–H2S1 #50.881.913.3348(9)160.6
N3–H3O2 #60.882.253.0145(12)144.6
Symmetry Codes: #1 1 − x, 1 − y, 1 − z; #2 1 − x, 1 − y, 1 − z; #3 1 + x, 3/2 − y, −1/2 + z; #4 +x, 3/2 − y, 1/2 + z; #5 1 − x, +y, 1/2 − z; #6 3/2 −x, 1/2 − y, 1 − z.
Figure 3 below, shows the Ortep drawing and packing diagram of Compound (3): 2-[1-(2-hydroxy-4-methoxyphenyl)ethylidene]-N-ethyl-hydrazinecarbothioamide acetonitrile solvate.
In (3), C12H17N3O2S.C2H3N, one molecule and an acetonitrile solvent molecule crystallize in the asymmetric unit, while in (4), C11H15N3O2S, a single molecule is present [12]. Bond lengths and angles for both compounds are in normal ranges [17] (Table 3). In (3) the dihedral angle between the mean planes of the phenyl ring and hydrazinecarbothioamide group (N1/N2/C8/S1/N3) is 45.4(7)°, forming a significantly twisted molecule. In the crystal, an intramolecular O1–H1N1 hydrogen bond forms a S 1 1 ( 6 ) graph set motif (Figure 3). Additional weak C–HO, N–HS intermolecular interactions and a weak N3–H3NA1 solvent interaction (Table 3) are also observed, which help stabilize the crystal packing.
Figure 3. (A) ORTEP drawing of (3) showing the atom numbering scheme and 50% probability displacement ellipsoids of non-H atoms; (B, C) The molecular packing of (3) viewed along the b axis. Dashed lines indicate O–HN intramolecular hydrogen bonds and weak N–HS, N–HN, C–HO intermolecular interactions. Hydrogen atoms not involved in hydrogen bonding have been removed for clarity.
Crystals 06 00017 g003
Compound (4): 2-[1-(2-hydroxy-4-methoxyphenyl)ethylidene]-N-methyl-hydrazinecarbothioamide [12].
In (4) the dihedral angle between the mean planes of the phenyl ring and hydrazinecarbothioamide group (N1/N2/C8/S1/N3) is 9.2(1)° [12]. In the crystal, an intramolecular O–HN hydrogen bond is observed serving to keep the molecule in a nearly planar conformation. Additional weak and C–HO intermolecular interactions (Table 4) assist in linking the molecules into dimers along (010) and influence crystal packing (Figure 4).
Figure 4. (A) ORTEP drawing of (4) showing the atom numbering scheme and 50% probability displacement ellipsoids of non-H atoms; (B, C) The molecular packing of (4) viewed along the a axis. Dashed lines indicate O–HN, intramolecular hydrogen bonds and weak C–HO, N–HS intermolecular interactions. Hydrogen atoms not involved in hydrogen bonding have been removed for clarity.
Crystals 06 00017 g004
Table 3. Selected crystal and DFT * bond lengths (Å), bond angles (°), and torsion angles (°): (3)–(4).
AtomsDistance, ÅDFT, ÅDistanceDFT, Å
C1-C71.4660(19)1.474 *1.465(4)1.470 *
C2-O11.4660(19)1.353 *1.350(3)1.341 *
C5-O21.3614(18)1.370 *1.362(3)1.362 *
C7-N11.3006(18)1.304 *1.290(3)1.300 *
N2-C91.3532(17)1.382 *1.354(3)1.383 *
C9-S11.6930(14)1.683 *1.695(3)1.668 *
C9-N31.3215(17)1.347 *1.328(3)1.367 *
N3-C111.4568(18)1.461 *1.446(4)1.456 *
(3) C12H17N3O2S.C2H3N
AtomsAngles, °DFT, °Angles, °DFT, °
C1-C7-N1116.85(13)117.57 *115.4 (2)116.81 *
C8-C7-N1122.61(13)121.76 *123.1 (2)121.63 *
C7-N1-N2115.97(12)119.76 *119.4 (2)120.52 *
N1-N2-C9120.00(11)121.38 *119.8 (2)121.14 *
N2-C9-N3117.41(12)115.14 *114.3 (2)111.78 *
N2-C9-S1117.97(10)118.48 *122.13 (19)124.14 *
(4) C11H15N3O2S [12]
AtomsTorsions, °DFT, °Torsions, °DFT, °
C7-N1-N2-C9153.11(13)−172.15 *178.8(2)−171.06 *
C1-C7-N1-N2−173.60(11)−176.67 *−179.2(2)−178.66 *
N1-N2-C9-N3−16.0(2)14.87 *−177.6(2)−176.89 *
N1-N2-C9-S1165.79(10)−166.08 *2.8(3)4.08 *
* DFT B3LYP 6-31 G(d) geometry optimization calculations for (3) and (4).
Table 4. Hydrogen bond interactions for (3) and (4) [Å and °].
D–HAd(D–H)/Åd(H–A)/Åd(DA)/Å<(DHA)/°
(1) C12H17N3O2S.C2H3N
O1–H1N10.841.852.5846(16)145.3
N2–H2S1 #10.882.693.3936(13)137.5
N3–H3NA1 #20.882.413.181(2)145.8
C12–H12AO2 #30.982.553.343(2)137.5
C2A–H2AAO2 #40.982.823.4756(18)124.9
C2A–H2AB…O1 #20.982.683.3833(19)129.1
(2) C11H15N3O2S [12]
O1–H1N10.821.852.5661(3)145.0
C10–H10AO2 #50.962.593.301(4)132.0
C10–H10CO1 #60.962.273.481(4)158.0
Symmetry Codes: #1 2 − x, 1 − y, 1 − z; #2 2 − x, 1 − y, 2 − z; #3 1 − x, 2 − y, 3 − z; #4 + x, 1 − y, −1 + z; #5 −1/2 + x, 1/2 − y, −1/2 + z; #6 1 − x, 1 − y, 1 – z.
Compound (5): 2-[1-(2-hydroxy-6-methoxyphenyl)ethylidene]-N-methyl-hydrazinecarbothioamide acetonitrile monosolvate [13].
In (5), C11H15N3O2S.C2H3N, one molecule and an acetonitrile solvent molecule crystallize in the asymmetric unit [13], while in (6), C12H17N3O2S, a single molecule is present [14]. Bond lengths and angles for both compounds are in normal ranges [17] (Table 5). In (5) the dihedral angle between the mean planes of the phenyl ring and hydrazinecarbothioamide group (N1/N2/C8/S1/N3) is 75.1(2)° forming a significantly twisted molecule (Figure 5) [13]. In the crystal, the main molecule is linked to the solvent molecule by a weak N–HN hydrogen bond while O–HS hydrogen bonds (Table 6) link the molecules into columns along [100].
Figure 5. (A) ORTEP drawing of (5) showing the atom numbering scheme and 50% probability displacement ellipsoids of non-H atoms; (B, C) The molecular packing for (5) viewed along the b axis. Dashed lines indicate N–HN intramolecular hydrogen bonds and weak O–HS intermolecular interactions. Hydrogen atoms not involved in hydrogen bonding have been removed for clarity.
Crystals 06 00017 g005
Compound (6): 2-[1-(2-hydroxy-6-methoxyphenyl)ethylidene]-N-ethyl-hydrazinecarbothioamide [14].
In (6) the dihedral angle between the mean planes of the phenyl ring and hydrazinecarbothioamide group (N1/N2/C8/S1/N3) is 86.8(4)° also forming a significantly twisted molecule (Figure 6) [14]. In the crystal, intermolecular O–HS hydrogen bonds (Table 6) link the molecules into chains along [001].
Figure 6. (A) ORTEP drawing of (6) showing the atom numbering scheme and 50% probability displacement ellipsoids of non-H atoms; (B, C) The molecular packing of (6) viewed along the b axis. Dashed lines indicate weak O–HS intermolecular interactions. Hydrogen atoms not involved in hydrogen bonding have been removed for clarity.
Crystals 06 00017 g006
Table 5. Selected crystal and DFT* bond lengths (Å), bond angles (°), and torsion angles (°): (5)–(6).
AtomsDistance, ÅDFT, ÅDistanceDFT, Å
C1-C71.495(3)1.498 *1.487(3)1.498 *
C2-O11.361(3)1.368 *1.367(3)1.365 *
C6-O21.371(3)1.360 *1.362(3)1.363 *
C7-N11.278(3)1.288 *1.281(3)1.298 *
N2-C91.357(3)1.375 *1.355(3)1.376 *
C9-S11.692(2)1.684 *1.688(2)1.685 *
C9-N31.327(3)1.345 *1.311(3)1.344 *
N3-C111.453(3)1.451 *1.471(3)1.456 *
(5) C11H15N3O2S.C2H3N [13]
AtomsAngles, °DFT, °Angles, °DFT, °
C1-C7-N1124.78(19)124.40 *124.46(19)124.26 *
C8-C7-N1117.49(19)117.42 *117.74(18)117.51 *
C7-N1-N2117.10(17)119.46 *116.48(17)119.33 *
N1-N2-C9119.82(17)121.33 *119.04(16)121.32 *
N2-C9-N3116.28(19)114.89 *116.6(2)114.96 *
N2-C9-S1119.40(16)119.79 *119.71(15)119.59 *
(6) C12H17N3O2S [14]
AtomsAngles, °DFT, °Angles, °DFT, °
C7-N1-N2-C9−175.26(18)178.25 *178.22(19)178.32 *
C1-C7-N1-N23.1(3)−1.06 *−0.6(3)−1.98 *
N1-N2-C9-N3−1.7(3)0.68 *1.3(3)0.35 *
N1-N2-C9-S1178.38(18)−179.17 *−179.12(15)−179.62 *
* DFT B3LYP 6-31 G(d) geometry optimization calculations for (5) and (6).
Table 6. Hydrogen bond interactions for (5) and (6) [Å and °].
D–H…Ad(D–H)/Åd(H–A)/Åd(DA)/Å<(DHA)/°
(1) C11H15N3O2S C2H3N [13]
O2–H2S1 #10.842.343.1823(17)177.0
N1–H1N1A0.882.253.039(3)149.0
(2) C12H17N3O2S [14]
O1–H1S1 #20.822.353.1655(19)175.0
Symmetry Codes: #1 − x, − y + 2, 2 − z; #2 x, −y, 1/2 + z.

2.2. Theoretical Study of (1) and (2)

After a DFT geometry optimization calculation for (1), the dihedral angle between the mean planes of the phenyl ring and hydrazinecarbothioamide group (N1/N2/C8/S1/N3) becomes 54.4(9)°, an increase of 52.4(4)°. Bond lengths, bond angles and torsion angles show only small changes (Table 1). However, the large increase in the angle between the mean planes of the phenyl ring and hydrazinecarbothioamide group suggests that the influence of the water molecule and numerous intra- and intermolecular interactions is significant. The N2–H2O1W intermolecular hydrogen bond in concert with a weak O1W–H1WBS1 and additional O1–H1N1 intramolecular hydrogen bonds involving the hydroxyl group along weak C–HO, C–HS and N–HOW, OW–HS intermolecular interactions (Table 2) obviously play a role in this observation and in the crystal packing of the molecule.
After a DFT geometry optimization calculation for (2), the dihedral angle between the mean planes of the phenyl ring and hydrazinecarbothioamide group (N1/N2/C8/S1/N3) becomes 24.5(5)°, a decrease of 25.8(4)°. Bond lengths, bond angles and torsion angles show only small changes (Table 1). However, the large decrease in the angle between the mean planes of the phenyl ring and hydrazinecarbothioamide group suggests that the influence of the numerous intra- and intermolecular interactions is significant. The weak N2–H2S1, N3–H3O2 intermolecular interactions in concert with the O1–H1N1 intramolecular hydrogen bond (Table 2) appear to play a role in these observations and in the crystal packing of the molecule.
Calculated molecular orbital energies (eV) for the surfaces of the frontier molecular orbitals for (1) show three absorption band envelopes, exhibiting some blue shifts, which are consistent with the experimental data (Figure 7 and Table 7) with λmax values located at 217, 297, and 348 nm, respectively. The bands in the UV region, 215–350 nm, are assigned to n→π*, π→π* and n→n* transitions. In the Highest Occupied Molecular Orbital (HOMO) the electronic clouds are distributed primarily on the sulfur atom. In HOMO−1 they are located on the phenyl ring and the hydrazinecarbothioamide group. In Lowest Unoccupied Molecular Orbital (LUMO) and LUMO+1 the electronic clouds are delocalized primarily on the phenyl ring while in LUMO+2 they are dispersed on both the hydrazinecarbothioamide group and phenyl ring. Therefore, the first absorption band envelope at 348 nm is assigned to contributions primarily from HOMO→LUMO and HOMO−1→LUMO. The second absorption band at 297 nm is assigned to overlapping contributions from HOMO→LUMO+1 and HOMO−1→LUMO+1. The third absorption band at 217 nm is assigned to overlapping contributions from HOMO→LUMO+2 and HOMO−1→LUMO+2, respectively. It is evident that electron transitions among frontier molecular orbitals in (1) are corresponding to n→π*, π→π* and n→n* transitions.
Calculated molecular orbital energies (eV) for the surfaces of the frontier molecular orbitals for (2) show three absorption band envelopes, exhibiting some blue shifts, which are consistent with the experimental data (Figure 7 and Table 7) with λmax values located at 207, 296, and 346 nm, respectively. The bands in the UV region, 200–350 nm, are assigned to n→π*, π→π* and π→n* transitions. In HOMO the electronic clouds are distributed primarily on the phenyl ring. In HOMO−1 they are located on the phenyl ring and the hydrazinecarbothioamide group. In LUMO, LUMO+1 and LUMO+2 the electronic clouds are dispersed on both the hydrazinecarbothioamide group and phenyl ring. Therefore, the first absorption band envelope at 346 nm is assigned to contributions primarily from HOMO→LUMO. The second absorption band at 296 nm is assigned to HOMO−1→LUMO. The third absorption band at 207 nm is assigned to overlapping contributions from HOMO→LUMO+1, HOMO−1→LUMO+1, HOMO→LUMO+2 and HOMO−1→LUMO+2, respectively. It is evident that electron transitions among frontier molecular orbitals in (2) are corresponding to n→π*, π→π* and π→n* transitions.
Figure 7. Calculated frontier molecular orbitals for C11H15N3O2S (1) and C12H17N3O2S (2).
Crystals 06 00017 g007
Table 7. Experimental and calculated energy of molecular orbitals of (1) and (2) and associated transitions.
(1) C11H15N3O2S(2) C12H17N3O2S
Experimental λ (nm/eV)Calculated λ (nm/eV)MO ContributionExperimental λ (nm/eV)Calculated λ (nm/eV)MO Contribution
348/3.52318.7/3.89HOMO→LUMO346/3.58329.8/3.76HOMO→LUMO
348/3.52289.5/4.28HOMO−1→LUMO296/4.19319.3/3.88HOMO−1→LUMO
297/4.17236.2/5.25HOMO→LUMO+1201/6.17224.9/5.51HOMO→LUMO+1
297/4.17222.4/5.57HOMO−1→LUMO+1201/6.17220.0/5.64HOMO−1→LUMO+1
217/5.71219.7/5.64HOMO→LUMO+2201/6.17213.9/5.79HOMO→LUMO+2
217/5.71207.7/5.97HOMO−1→LUMO+2201/6.17209.5/5.98HOMO−1→LUMO+2

2.3. Theoretical Study of (3) and (4)

After a DFT geometry optimization calculation for (3), the dihedral angle between the mean planes of the phenyl ring and hydrazinecarbothioamide group (N1/N2/C8/S1/N3) becomes 22.7(7)°, a decrease of 22.8(0)°. Bond lengths, bond angles and torsion angles show only small changes (Table 3). However, the small decrease in the angle between the mean planes of the phenyl ring and hydrazinecarbothioamide group suggests that the influence of the numerous intra- and intermolecular interactions is significant. The weak N2–H2S1, C12–H12AO2, C2A–H2AAO2, C2A–H2ABO1 intermolecular interactions in concert with a weak N3–H3NA1 solvent interaction along with an O1–H1N1 intramolecular hydrogen bond (Table 4) appear to play a role in these observations and in the crystal packing of the molecule.
After a DFT geometry optimization calculation for (4), the dihedral angle between the mean planes of the phenyl ring and hydrazinecarbothioamide group (N1/N2/C8/S1/N3) becomes 4.5(0)°, a decrease of 4.7(1)°. Bond lengths, bond angles and torsion angles show only small changes (Table 3). The small decrease in the angle between the mean planes of the phenyl ring and hydrazinecarbothioamide group suggests that the influence of the one intra- and two intermolecular interactions is involved. The weak C10–H10AO2, C10–H10AO1 intermolecular interactions along with an O1–H1N1 intramolecular hydrogen bond (Table 4) appear to play a role in these observations and in the crystal packing of the molecule.
Calculated molecular orbital energies (eV) for the surfaces of the frontier molecular orbitals for (3) show three absorption band envelopes, exhibiting some blue shifts, which are consistent with the experimental data (Figure 8 and Table 8) with λmax values located at 207, 241 and 329 nm, respectively. The bands in the UV region, 255–330 nm, are assigned to n→π*, π→π* and n→n* transitions. In HOMO and HOMO−1 the electronic clouds are distributed primarily on the hydrazinecarbothioamide group. In LUMO they are located on the phenyl ring and hydrazinecarbothioamide group. In LUMO+1 the electronic clouds are delocalized primarily on the phenyl ring while in LUMO+2 they are dispersed on the hydrazinecarbothioamide group. Therefore, the first absorption band envelope at 329 nm is assigned to contributions primarily from HOMO→LUMO and HOMO−1→LUMO. The second absorption band at 241 nm is assigned to HOMO→LUMO+1 and HOMO−1→LUMO+1. The third absorption band envelope at 207 nm is assigned to overlapping contributions from HOMO→LUMO+2 and HOMO−1→LUMO+2, respectively. It is evident that electron transitions among frontier molecular orbitals in (3) are corresponding to n→π*, π→π* and n→n* transitions.
Calculated molecular orbital energies (eV) for the surfaces of the frontier molecular orbitals for (4) show four absorption band envelopes, exhibiting some blue shifts, which are consistent with the experimental data (Figure 8 and Table 8) with λmax values located at 208, 242, 298, and 332 nm, respectively. The bands in the UV region, 255–340 nm, are assigned to n→π*, π→π* and n→n* transitions. In HOMO the electronic clouds are distributed primarily on the sulfur atom. In HOMO−1 and LUMO they are located on the phenyl ring and the hydrazinecarbothioamide group. In LUMO+1 the electronic clouds are delocalized primarily on the phenyl ring while in LUMO+2 they are dispersed on the hydrazinecarbothioamide group. Therefore, the first absorption band envelope at 332 nm is assigned to contributions primarily from HOMO→LUMO. The second absorption band at 297 nm is assigned to HOMO−1→LUMO. The third absorption band envelope at 242 nm is assigned to overlapping contributions from HOMO→LUMO+1, HOMO−1→LUMO+1 and HOMO→LUMO+2, respectively, while the fourth absorption band is assigned to HOMO−1→LUMO+2. It is evident that electron transitions among frontier molecular orbitals in (4) are corresponding to n→π*, π→π* and n→n* transitions.
Figure 8. Calculated frontier molecular orbitals for C12H17N3O2S (3) and C11H15N3O2S (4).
Crystals 06 00017 g008
Table 8. Experimental and calculated energy of molecular orbitals of (3) and (4) and associated transitions.
(3) C12H17N3O2S(4) C11H15N3O2S
Experimental λ (nm/eV)Calculated λ (nm/eV)MO ContributionExperimental λ (nm/eV)Calculated λ (nm/eV)MO Contribution
329/3.77318.9/3.89HOMO→LUMO332.3/3.73295.8/4.19HOMO→LUMO
329/3.77307.8/4.02HOMO−1→LUMO298.6/4.15283.4/4.37HOMO−1→LUMO
241/5.14236.3/5.25HOMO→LUMO+1242/5.12224.6/5.52HOMO→LUMO+1
241/5.14230.1/5.39HOMO−1→LUMO+1242/5.12217.4/5.70HOMO−1→LUMO+1
207/5.99214.7/5.77HOMO→LUMO+2242/5.12214.5/5.78HOMO→LUMO+2
207/5.99209.6/5.91HOMO−1→LUMO+2208/5.96207.9/5.96HOMO−1→LUMO+2

2.4. Theoretical Study of (5) and (6)

After a DFT geometry optimization calculation for (5), the dihedral angle between the mean planes of the phenyl ring and hydrazinecarbothioamide group (N1/N2/C8/S1/N3) becomes 68.5(7)°, a decrease of 6.5(5)°. Bond lengths, bond angles and torsion angles show only small changes (Table 5). The small decrease in the angle between the mean planes of the phenyl ring and hydrazinecarbothioamide group suggests that the influence of the numerous intra- and intermolecular interactions is small. The weak O2–H2S1 intermolecular interactions along with a N1–H1NA1 solvent interaction (Table 6) appear to play a role in these observations and in the crystal packing of the molecule.
After a DFT geometry optimization calculation for (6), the dihedral angle between the mean planes of the phenyl ring and hydrazinecarbothioamide group (N1/N2/C8/S1/N3) becomes 70.8(0)°, a decrease of 16.0(4)°. Bond lengths, bond angles and torsion angles show only small changes (Table 5). The moderate decrease in the angle between the mean planes of the phenyl ring and hydrazinecarbothioamide group suggests that the influence of the weak O2–H2S1 intermolecular interactions is small (Table 6) and appears to play a small role in these observations and in the crystal packing of the molecule.
Calculated molecular orbital energies (eV) for the surfaces of the frontier molecular orbitals for (5) show three absorption band envelopes, exhibiting some blue shifts, which are consistent with the experimental data (Figure 9 and Table 9) with λmax values located at 203, 240 and 273 nm, respectively. The bands in the UV region, 20–275 nm, are assigned to n→π*, π→π* and n→n* transitions. In HOMO and HOMO−1 the electronic clouds are distributed primarily on the hydrazinecarbothioamide group. In LUMO and LUMO+1 they are located on the phenyl ring and hydrazinecarbothioamide group. In LUMO+2 the electronic clouds are delocalized primarily on the phenyl ring. Therefore, the first absorption band envelope at 273 nm is assigned to contributions primarily from HOMO→LUMO and HOMO−1→LUMO. The second absorption band at 240 nm is assigned to HOMO→LUMO+1 and HOMO−1→LUMO+1. The third absorption band envelope at 203 nm is assigned to overlapping contributions from HOMO→LUMO+2 and HOMO−1→LUMO+2, respectively. It is evident that electron transitions among frontier molecular orbitals in (5) are corresponding to n→π*, π→π* and n→n* transitions.
Calculated molecular orbital energies (eV) for the surfaces of the frontier molecular orbitals for (6) show three absorption band envelopes, exhibiting some blue shifts, which are consistent with the experimental data (Figure 9 and Table 9) with λmax values located at 197, 239 and 275 nm, respectively. The bands in the UV region, 185–280 nm, are assigned to n→π*, π→π* and n→n* transitions. In HOMO and HOMO−1 the electronic clouds are distributed primarily on the hydrazinecarbothioamide group. In LUMO and LUMO + 2 they are located on the phenyl ring. In LUMO+1 the electronic clouds are delocalized primarily on the hydrazinecarbothioamide group. Therefore, the first absorption band envelope at 275 nm is assigned to contributions primarily from HOMO→LUMO. The second absorption band at 239 nm is assigned to HOMO−1→LUMO. The third absorption band envelope at 197 nm is assigned to overlapping contributions from HOMO→LUMO+1, HOMO−1→LUMO+1, HOMO→LUMO+2 and HOMO−1→LUMO+2, respectively. It is evident that electron transitions among frontier molecular orbitals in (6) are corresponding to n→π*, π→π* and n→n* transitions.
Figure 9. Calculated frontier molecular orbitals for C11H15N3O2S (5) and C12H17N3O2S (6).
Crystals 06 00017 g009
Table 9. Experimental and calculated energy of molecular orbitals of (5) and (6) and associated transitions.
(5) C11H15N3O2S(6) C12H17N3O2S
Experimental λ (nm/eV)Calculated λ (nm/eV)MO ContributionExperimental λ (nm/eV)Calculated λ (nm/eV)MO Contribution
273/4.54273.8/4.52HOMO→LUMO275/4.51261.7/4.74HOMO→LUMO
273/4.54266.7/4.65HOMO−1→LUMO239/5.19252.5/4.91HOMO−1→LUMO
240/5.17246.5/5.03HOMO→LUMO+1197/6.29240.2/5.16HOMO→LUMO+1
240/5.17240.7/5.15HOMO−1→LUMO+1197/6.29238.1/5.21HOMO−1→LUMO+1
203/6.11234.8/5.28HOMO→LUMO+2197/6.29232.3/5.34HOMO→LUMO+2
203/6.11229.5/5.40HOMO−1→LUMO+2197/6.29230.3/5.38HOMO−1→LUMO+2

3. Experimental Procedures

3.1. General Information for the Synthesis of Compounds (1)–(6)

All reagents were purchased from Sigma Aldrich Co., St Louis, MS, USA. NMR spectra were obtained using a JEOL ECS-400 MHz spectrometer at room temperature unless otherwise stated. Chemical shifts are reported in ppm and referenced via residual solvent resonances to Me4Si (1H and 13C). Melting points were taken in open capillary tubes and are uncorrected. Absorption spectra were recorded in acetonitrile (from 6 × 10⁻⁴ to 2 × 10⁻⁵ M at room temperature) on a Cary 300 UV-Vis spectrophotometer. NMR (Figure S1–S12) and UV-Vis spectra (Figure S13–S18) for all compounds can be found in the Supplementary Information.

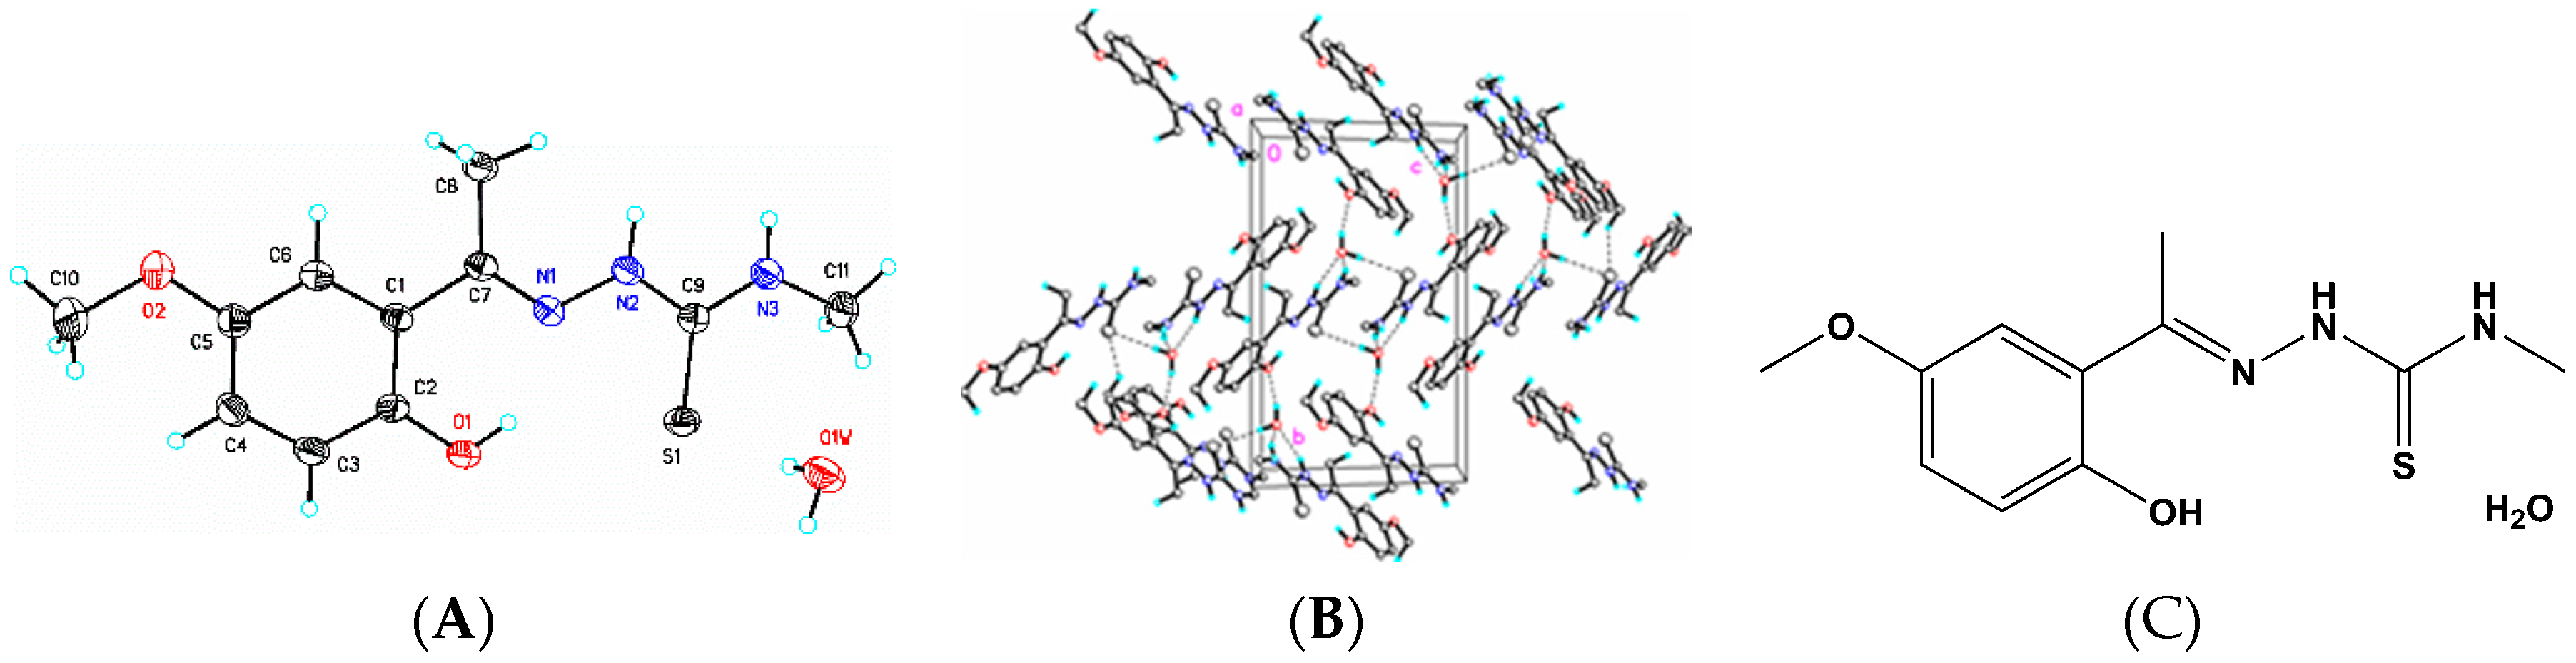
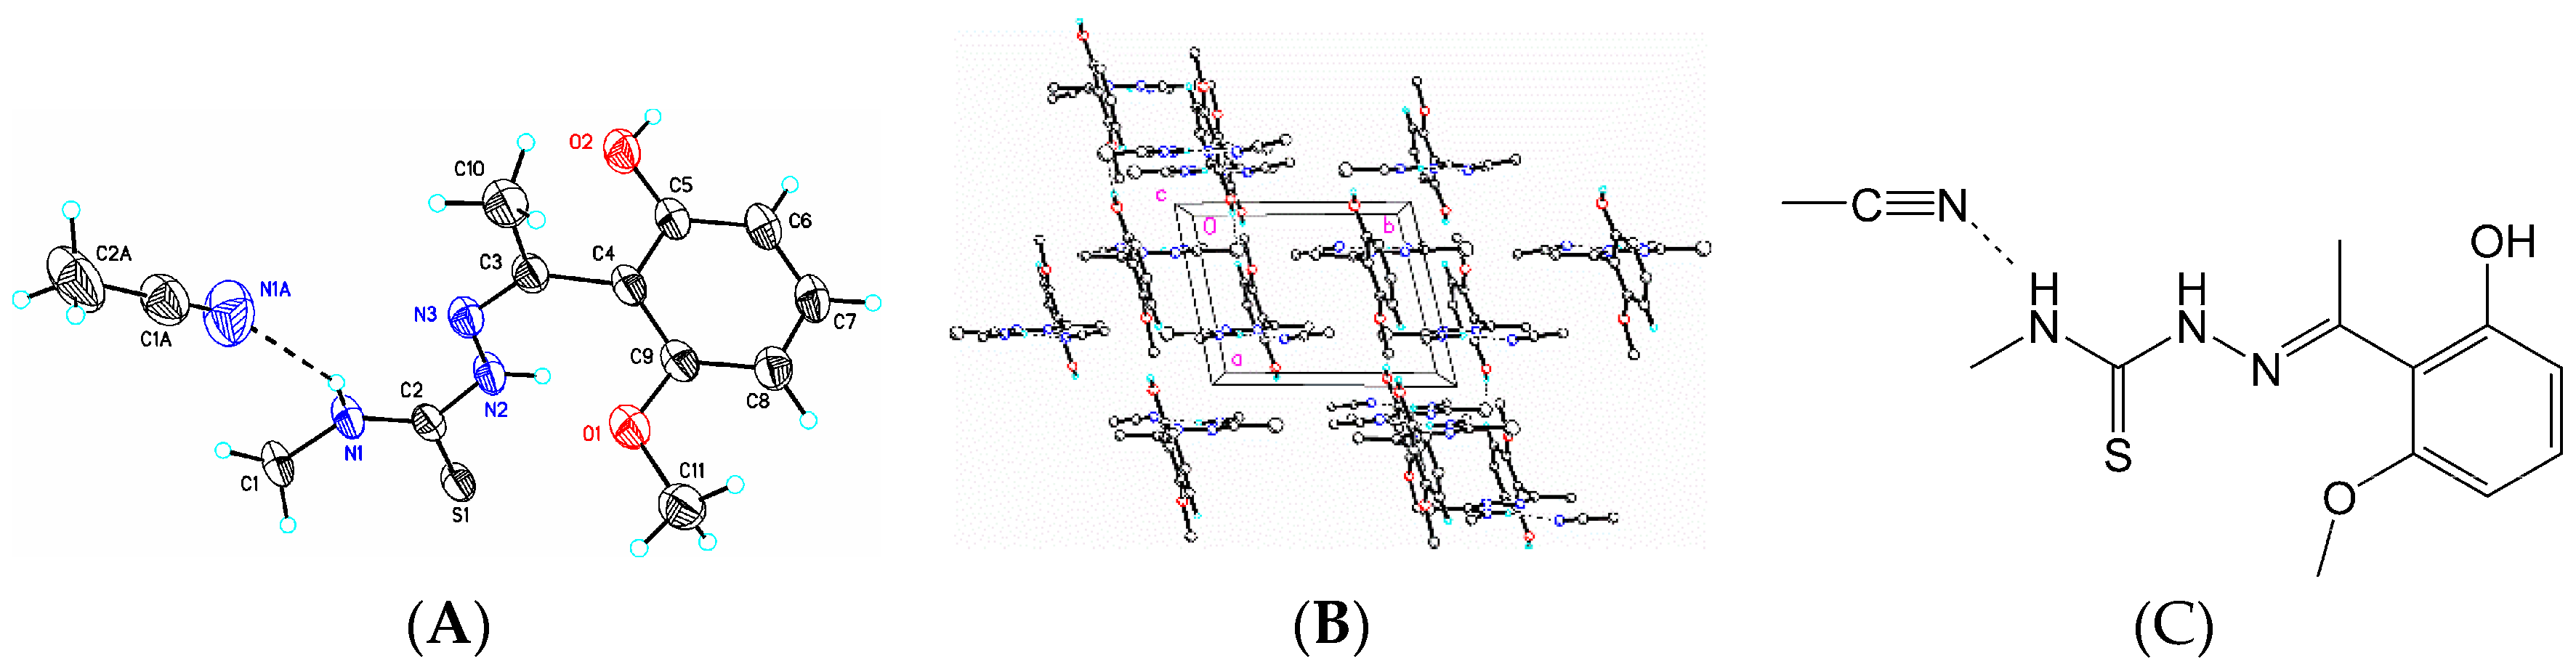
3.2. Synthesis and Spectroscopic Analysis of 2-[1-(2-Hydroxy-5-Methoxyphenyl)Ethylidene]-N-Methyl-Hydrazinecarbothioamide (1)

Crystals 06 00017 i001
A 25 mL round bottom flask was charged with 5 mL of 1:1 mixture of ethanol: deionized water solution and then 0.2 g (1 equiv) of starting ketone and 0.17 g (1 equiv) of the thiosemicarbazide were added. The solution was refluxed for 48 h, after dichloromethane (5 mL) and deionized water (5 mL) were added, and the organic layer was separated. The aqueous layer was then extracted with an additional 5 mL of dichloromethane, the organic layers were combined, washed with brine (2 × 5 mL), dried with magnesium sulfate, and the solvent removed in vacuo. The resulting product was crystallized from acetonitrile or dichloromethane layered with hexanes in 58% yield. M.p. 399–402 K. 1H NMR (acetone-d6, δ): 11.7 (br s, 1H, NH), 9.52 (br s, 1H, OH), 7.73 (br s, 1H, NH), 7.5 (d, J = 8.6 Hz, 1H, Ar), 6.47 (d, J = 8.6 Hz, 1H, Ar), 6.42 (d, 1H, Ar), 3.80 (s, 3H, CH3), 3.13 (d, J = 4.7 Hz, 3H, CH3), 2.43 (s, 3H, CH3). 13C {1H} NMR (acetone-d6, δ): 180.4 (C=S), 162.3 (C=N), 160.1 (Ar), 155.1 (Ar), 129.9 (Ar), 113.5 (Ar), 105.9 (Ar), 101.5 (Ar), 54.9 (OMe), 29.6 (Me), 13.6 (Me).

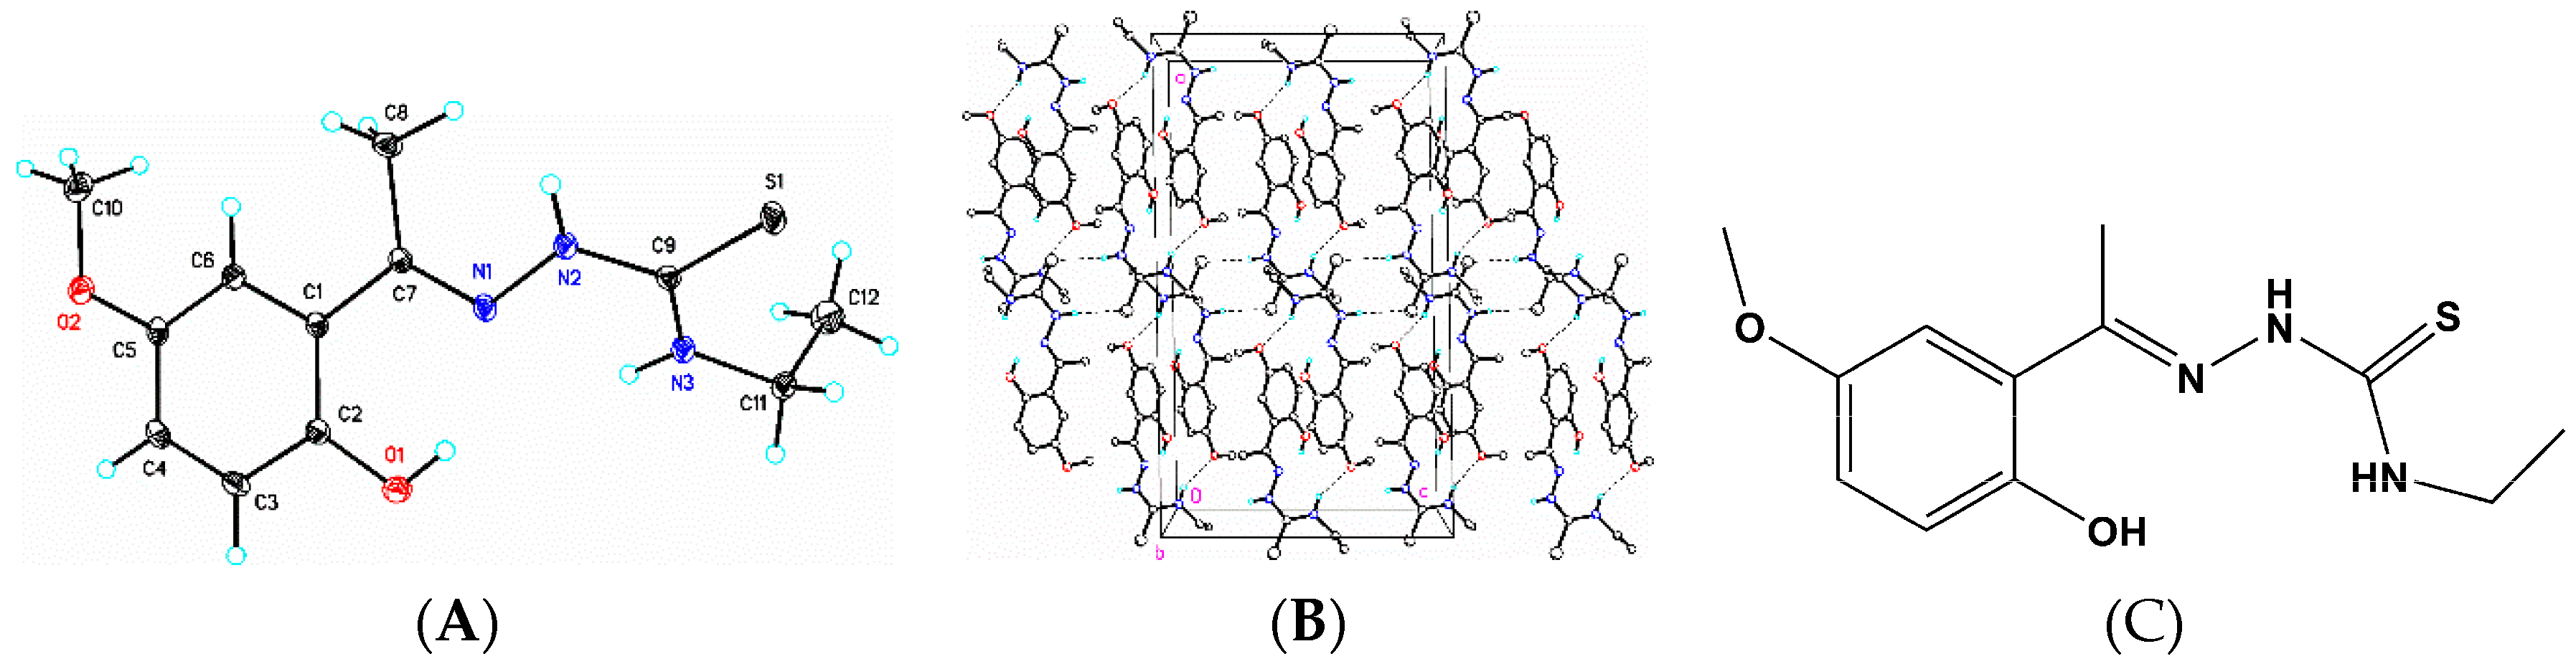
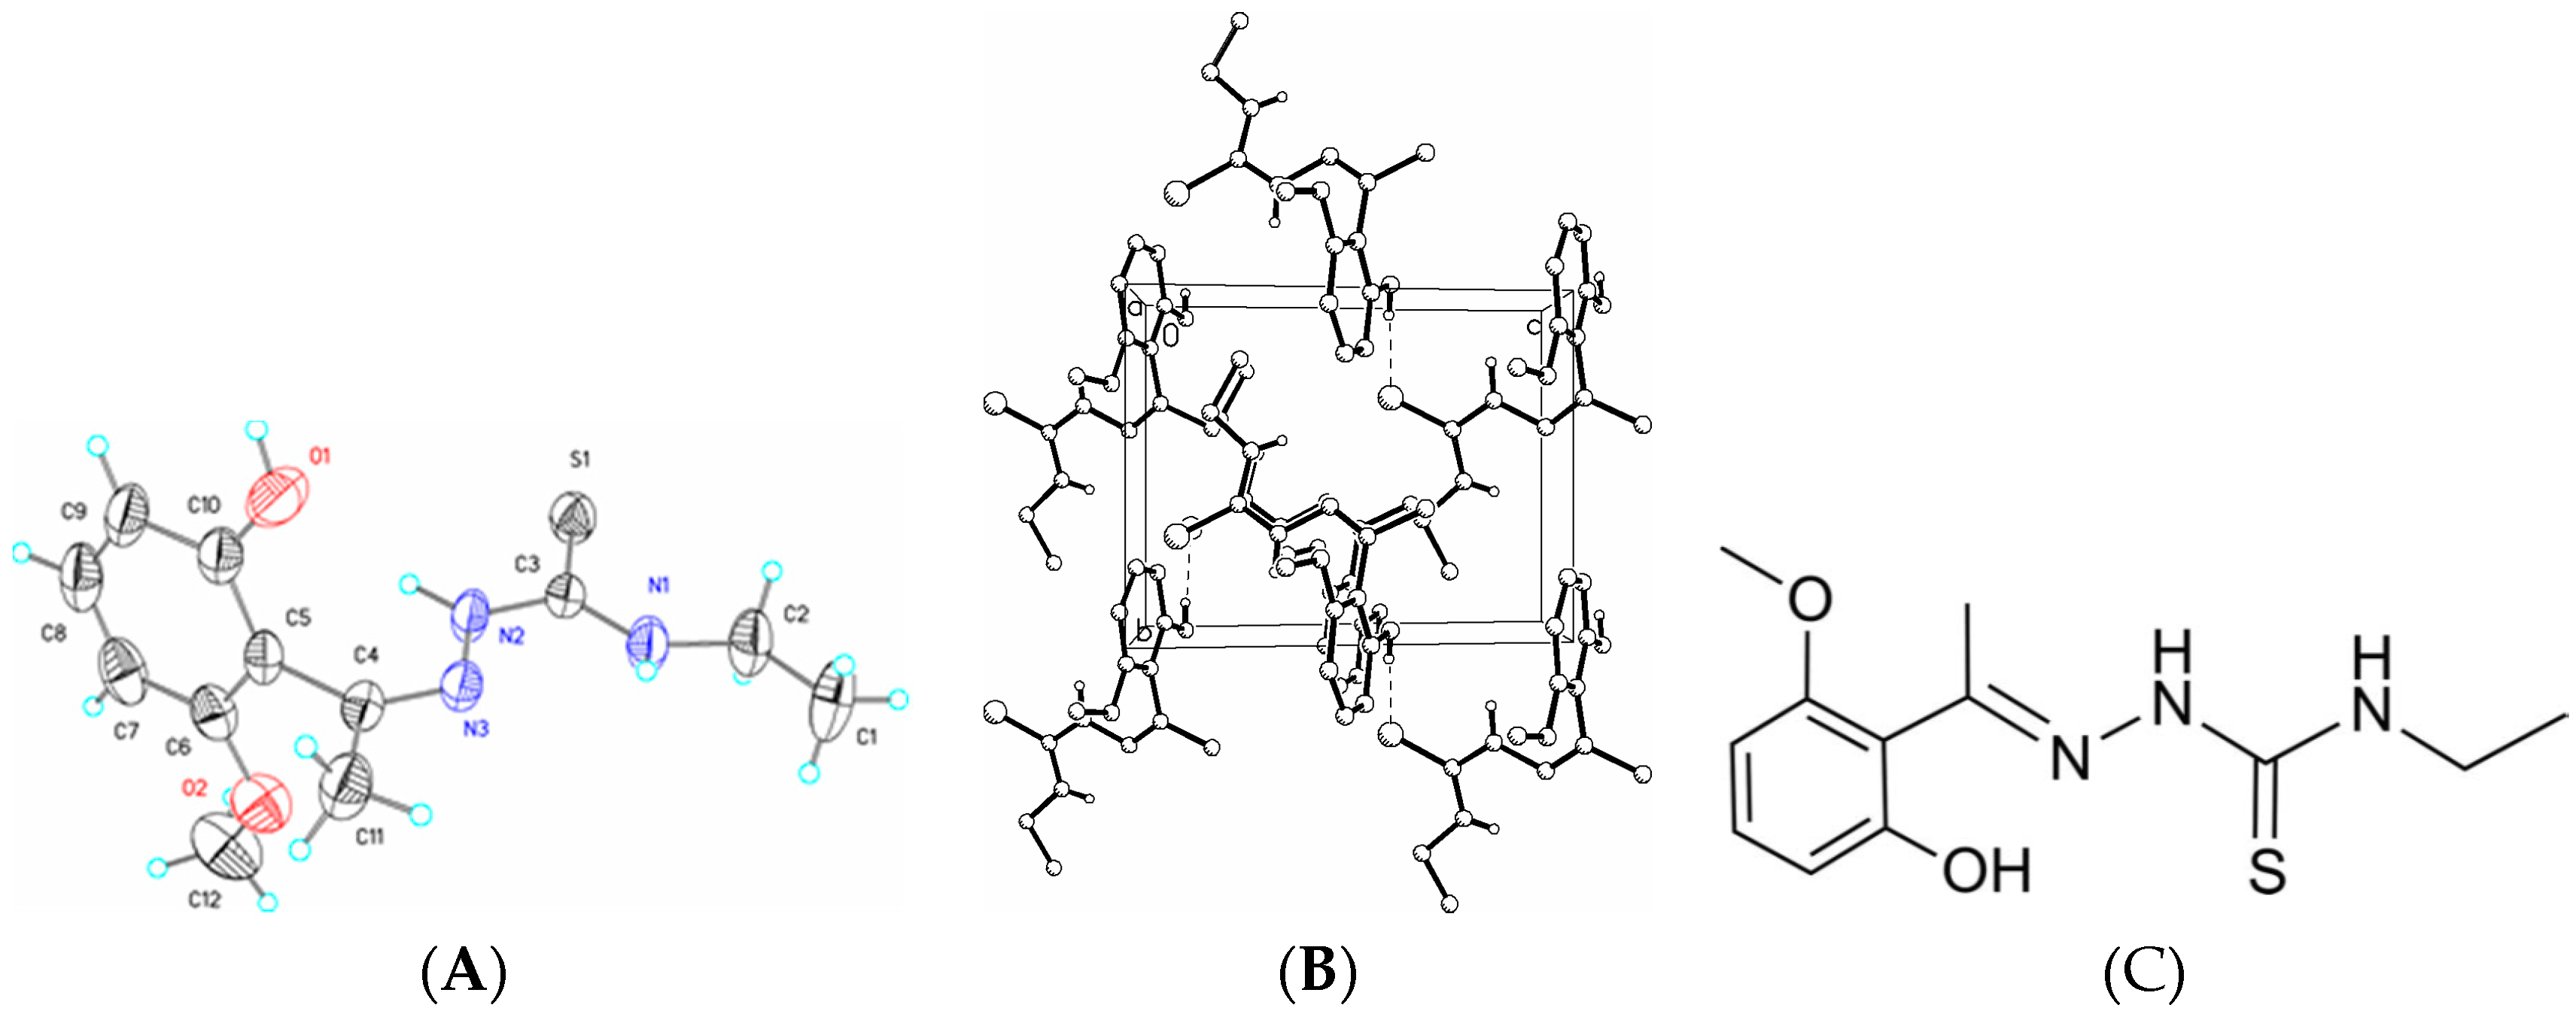
3.3. Synthesis and Spectroscopic Analysis of 2-[1-(2-Hydroxy-5-Methoxyphenyl)Ethylidene]-N-Ethyl-Hydrazinecarbothioamide (2)

Crystals 06 00017 i002
A 50 mL round bottom flask was charged with 2′-hydroxy-4′-methoxyacetophenone (0.206 g, 1.24 mmol), and 4-ethyl-3-thiosemicarbazide (0.148 g, 1.24 mmol), 20 mL of methanol and one drop of concentrated sulfuric acid. The colorless solution was then refluxed for 24 h, after which time the resulting yellow solution was transferred to a 125 mL glass separatory funnel and dichloromethane (15 mL) and water (15 mL) were added. The layers were separated and the aqueous layer was extracted with an additional 10 mL of dichloromethane. The organic layer (top) was removed, the aqueous layer was extracted with an additional 10 mL, the organic layers were combined and washed with brine (15 mL), dried with magnesium sulfate, and the solvent was removed in vacuo. The resulting yellow solid was recrystallized from minimal hot acetonitrile and allowed to cool to room temperature yielding yellow crystals (0.260 g, 78%). M.p. 411–416 K. 1H NMR (acetone-d6, δ): 10.6 (br s, 1H, OH), 9.50 (br s, 1H, NH), 7.83 (br s, 1H, NH), 7.05 (d, J = 3 Hz, 1H, Ar), 6.87 (dd, J = 9, 3 Hz, 1H, Ar), 6.80 (d, J = 9 Hz, 1H, Ar), 3.74 (s, 3H, OCH3), 3.69 (m, 2H, CH2CH3), 2.42 (s, 3H, CH3), 1.19 (t, J = 8 Hz, 3H, CH2CH3). 13C {1H} NMR (acetone-d6, δ): 179.5 (C=S), 152.6 (C=N), 152.4 (Ar), 151.6 (Ar), 121.5 (Ar), 117.7 (Ar), 117.0 (Ar), 113.2 (Ar), 55.187 (OMe), 39.2 (Me), 13.9, 13.8.

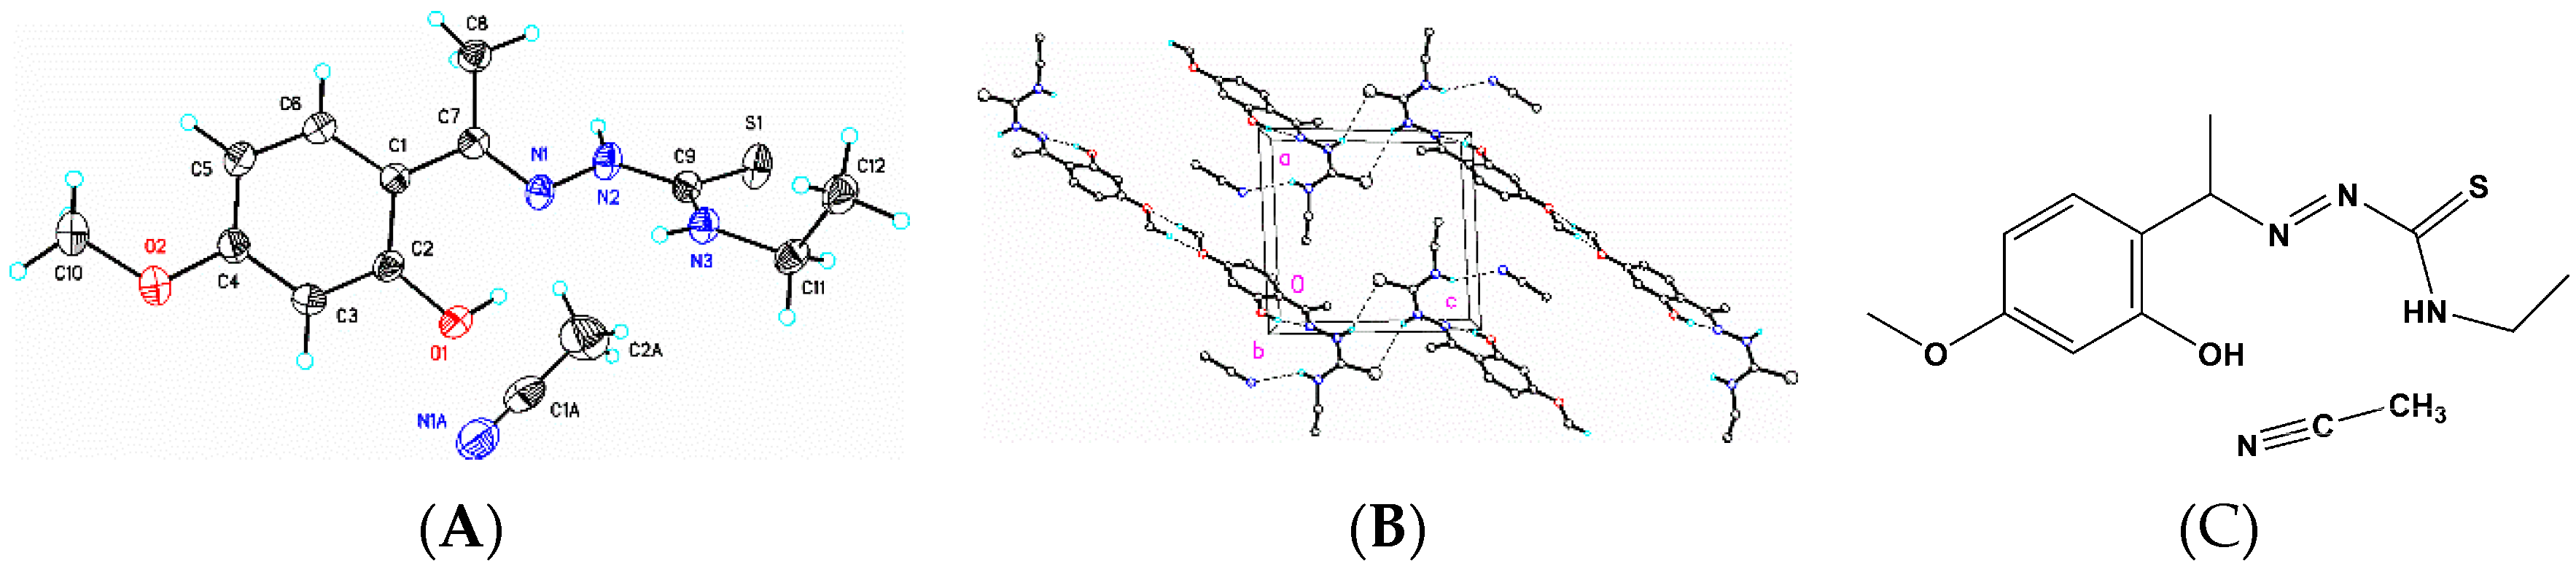
3.4. Synthesis and Spectroscopic Analysis of 2-[1-(2-Hydroxy-4-Methoxyphenyl)Ethylidene]-N-Ethyl-Hydrazinecarbothioamide (3)

Crystals 06 00017 i003
A 50 mL round bottom flask was charged with 2′-hydroxy-4′-methoxyacetophenone (0.206 g, 1.24 mmol), and 4-ethyl-3-thiosemicarbazide (0.148 g, 1.24 mmol), 20 mL of methanol and one drop of concentrated sulfuric acid. The colorless solution was then refluxed for 24 h, after which time the resulting yellow solution was transferred to a 125 mL glass separatory funnel and dichloromethane (15 mL) and water (15 mL) were added. The layers were separated and the aqueous layer was extracted with an additional 10 mL of dichloromethane. The organic layer (top) was removed, the aqueous layer was extracted with an additional 10 mL, the organic layers were combined and washed with brine (15 mL), dried with magnesium sulfate, and the solvent was removed in vacuo. The resulting yellow solid was recrystallized from minimal hot acetonitrile and allowed to cool to room temperature yielding yellow crystals (0.260 g, 78%). M.p. 418–420 K. 1H NMR (CDCl3, δ): 11.20 (s, 1H, NH), 8.54 (s, 1H, OH), 7.35 (d, J = 7 Hz, 1H, Ar), 6.65 (br s, 1H, NH), 6.50-6.46 (m, 2H, Ar), 3.81 (s, 3H, CH3), 3.80–3.68 (m, 2H, CH2), 2.33 (s, 3H, CH3), 1.28 (t, J = 7 Hz, 3H, CH3). 13C {1H} NMR (acetone-d6, δ): 179.5 (C=S), 162.3 (C=N), 160.1 (Ar), 154.9 (Ar), 129.9 (Ar), 113.5 (Ar), 105.9 (Ar), 101.5 (Ar), 54.9 (OMe), 39.3 (Me), 13.8, 13.5.

3.5. Spectroscopic Data for Compounds (4), (5), and (6)

Crystals 06 00017 i004
Compound 4: 1H NMR (acetone-d6, δ): 11.7 (br s, 1H, NH), 9.52 (br s, 1H, OH), 7.73 (br s, 1H, NH), 7.5 (d, J = 8.6 Hz, 1H, Ar), 6.47 (d, J = 8.6 Hz, 1H, Ar), 6.42 (d, 1H, Ar), 3.80 (s, 3H, CH3), 3.13 (d, J = 4.7 Hz, 3H, CH3), 2.43 (s, 3H, CH3). 13C {1H} NMR (acetone-d6, δ): 180.4 (C=S), 162.3 (C=N), 160.1 (Ar), 155.1 (Ar), 129.9 (Ar), 113.5 (Ar), 105.9 (Ar), 101.5 (Ar), 54.9 (OMe), 29.6 (Me), 13.6 (Me). M.p. 448–453 K.
Crystals 06 00017 i005
Compound 5: 1H NMR (acetone-d6, δ): 8.9 (br, 1H, NH), 8.23 (br, 1H, OH), 8.03 (br, 1H, NH), 7.25 (t, J = 8 Hz, 1H, Ar), 6.62 (d, J = 8 Hz, 2H, Ar), 3.78 (3H, OMe), 3.08 (d, J = 4 Hz, 3H, NMe), 2.11 (3H, Me). 13C {1H} NMR (acetone-d6, δ): 178.9 (C=S), 157.2 (C=N), 154.5 (Ar), 145.3 (Ar), 131.5 (Ar), 109.4 (Ar), 108.9 (Ar), 102.9 (Ar), 55.4 (OMe), 30.5 (Me), 22.7 (Me). M.p. 415–420 K.
Crystals 06 00017 i006
Compound 6: 1H NMR (acetone-d6, δ): 8.97 (br, 1H, NH), 8.18 (br, 1H, OH), 8.04 (br, 1H, NH), 7.25 (t, J = 8 Hz, 1H, Ar), 6.64 (d, J = 8 Hz, 2H, Ar), 3.78 (3H, OMe), 3.67-3.60 (m, 2H, CH2CH3), 2.11 (3H, Me), 1.18 (t, J = 7 Hz, CH2CH3, 3H). 13C {1H} NMR (acetone-d6, δ): 177.8 (C=S), 157.2 (C=N), 154.5 (Ar), 145.4 (Ar), 131.5 (Ar), 109.3 (Ar), 108.8 (Ar), 102.9 (Ar), 55.4 (OMe), 38.8 (Me), 22.6, 14.0. M.p. 458–460 K.

3.6. X-Ray Structure Analysis and Refinement

Individual crystals of compounds (1), (2) and (3) were mounted on a CryoLoop (Hampton Research, 34 Journey, Aliso Viejo, CA, USA) and placed in a −100 °C compressed air stream on an Agilent Gemini-EOS Single Crystal Autodiffractometer at Keene State College (Agilent Technologies, LTD, Yarnton, England, Keene, NH, USA). Crystallographic data were collected using graphite monochromated 0.71073 Å Mo-Kα radiation and integrated and corrected for absorption using the CrysAlisRed (Oxford Diffraction, 2010 software package) [18]. The structures were solved using direct methods and refined using least-square methods on F-squared [19]. The hydrogen atoms were placed in their calculated positions and included in the refinement using the riding model. All other pertinent crystallographic details such as h, k, l ranges, 2θ ranges, and R-factors can be found in Table 10.

Crystallographic Data for (1), (2) and (3)

Table 10. Crystal and experimental data for (1), (2) and (3).
Compound123
FormulaC11H15N3O2S ·H2OC12H17N3O2SC12H17N3O2S.C2H3N
Formula weight271.33267.34308.40
Crystal color, habitColorless, blockColorless, irregularColorless, irregular
Crystal size (mm)0.46 × 0.22 × 0.140.36 × 0.32 0.260.45 × 0.38 × 0.32
Crystal systemMonoclinicMonoclinicTriclinic
Space Group, ZP21/c, 4C2/c, 8P-1, 2
Temperature, K173(s)173(2)173 (2)
a (Å)8.2304(3)23.3083(6)8.9384(7)
b (Å)16.2787(6)8.2956(2)9.5167(8)
c (Å)9.9708(4)13.5312(3)10.0574(8)
α (°)9090110.773(7)
β (°)103.355(4)91.077(2)92.413(6)
γ (°)909090.654(7)
Volume, Å31299.77(9)2615.87(12)798.89(12)
F (0,0,0)576.01136.0328.0
m (mm−1)0.2540.2460.213
Qcalc (Mg m−3)1.3871.3581.282
RadiationMo Kα (λ =0.7107)Mo Kα (λ = 0.7107)Mo Kα (λ = 0.7107)
2Θ range for data collection6.318 to 65.744°6.036 to 65.736°6.14 to 65.516°
Reflections collected15566163449837
Independent Reflections/Rint4479/0.03434463/0.03535259/0.0379
Data/restraints/parameters4479/0/1704463/0/1675259/0/196
Collection range
h−11 to 12−33 to 35−13 to 13
k−24 to 24−12 to 12−13 to 13
l−15 to 14−20 to 17−14 to 14
GOF on F21.0731.0601.047
Final R indexes [I ≥ 2σ (I)]R1 = 0.0429, wR2 = 0.1038R1 = 0.0381, wR2 = 0.0948R1 = 0.0539, wR2 = 0.1317
Final R indexes (all data)R1 = 0.0584, wR2 = 0.1132R1 = 0.0498, wR2 = 0.1023R1 = 0.0769, wR2 = 0.1516
Largest diff. Peak/hole/eÅ−30.37/−0.220.39/−0.310.40/−0.35

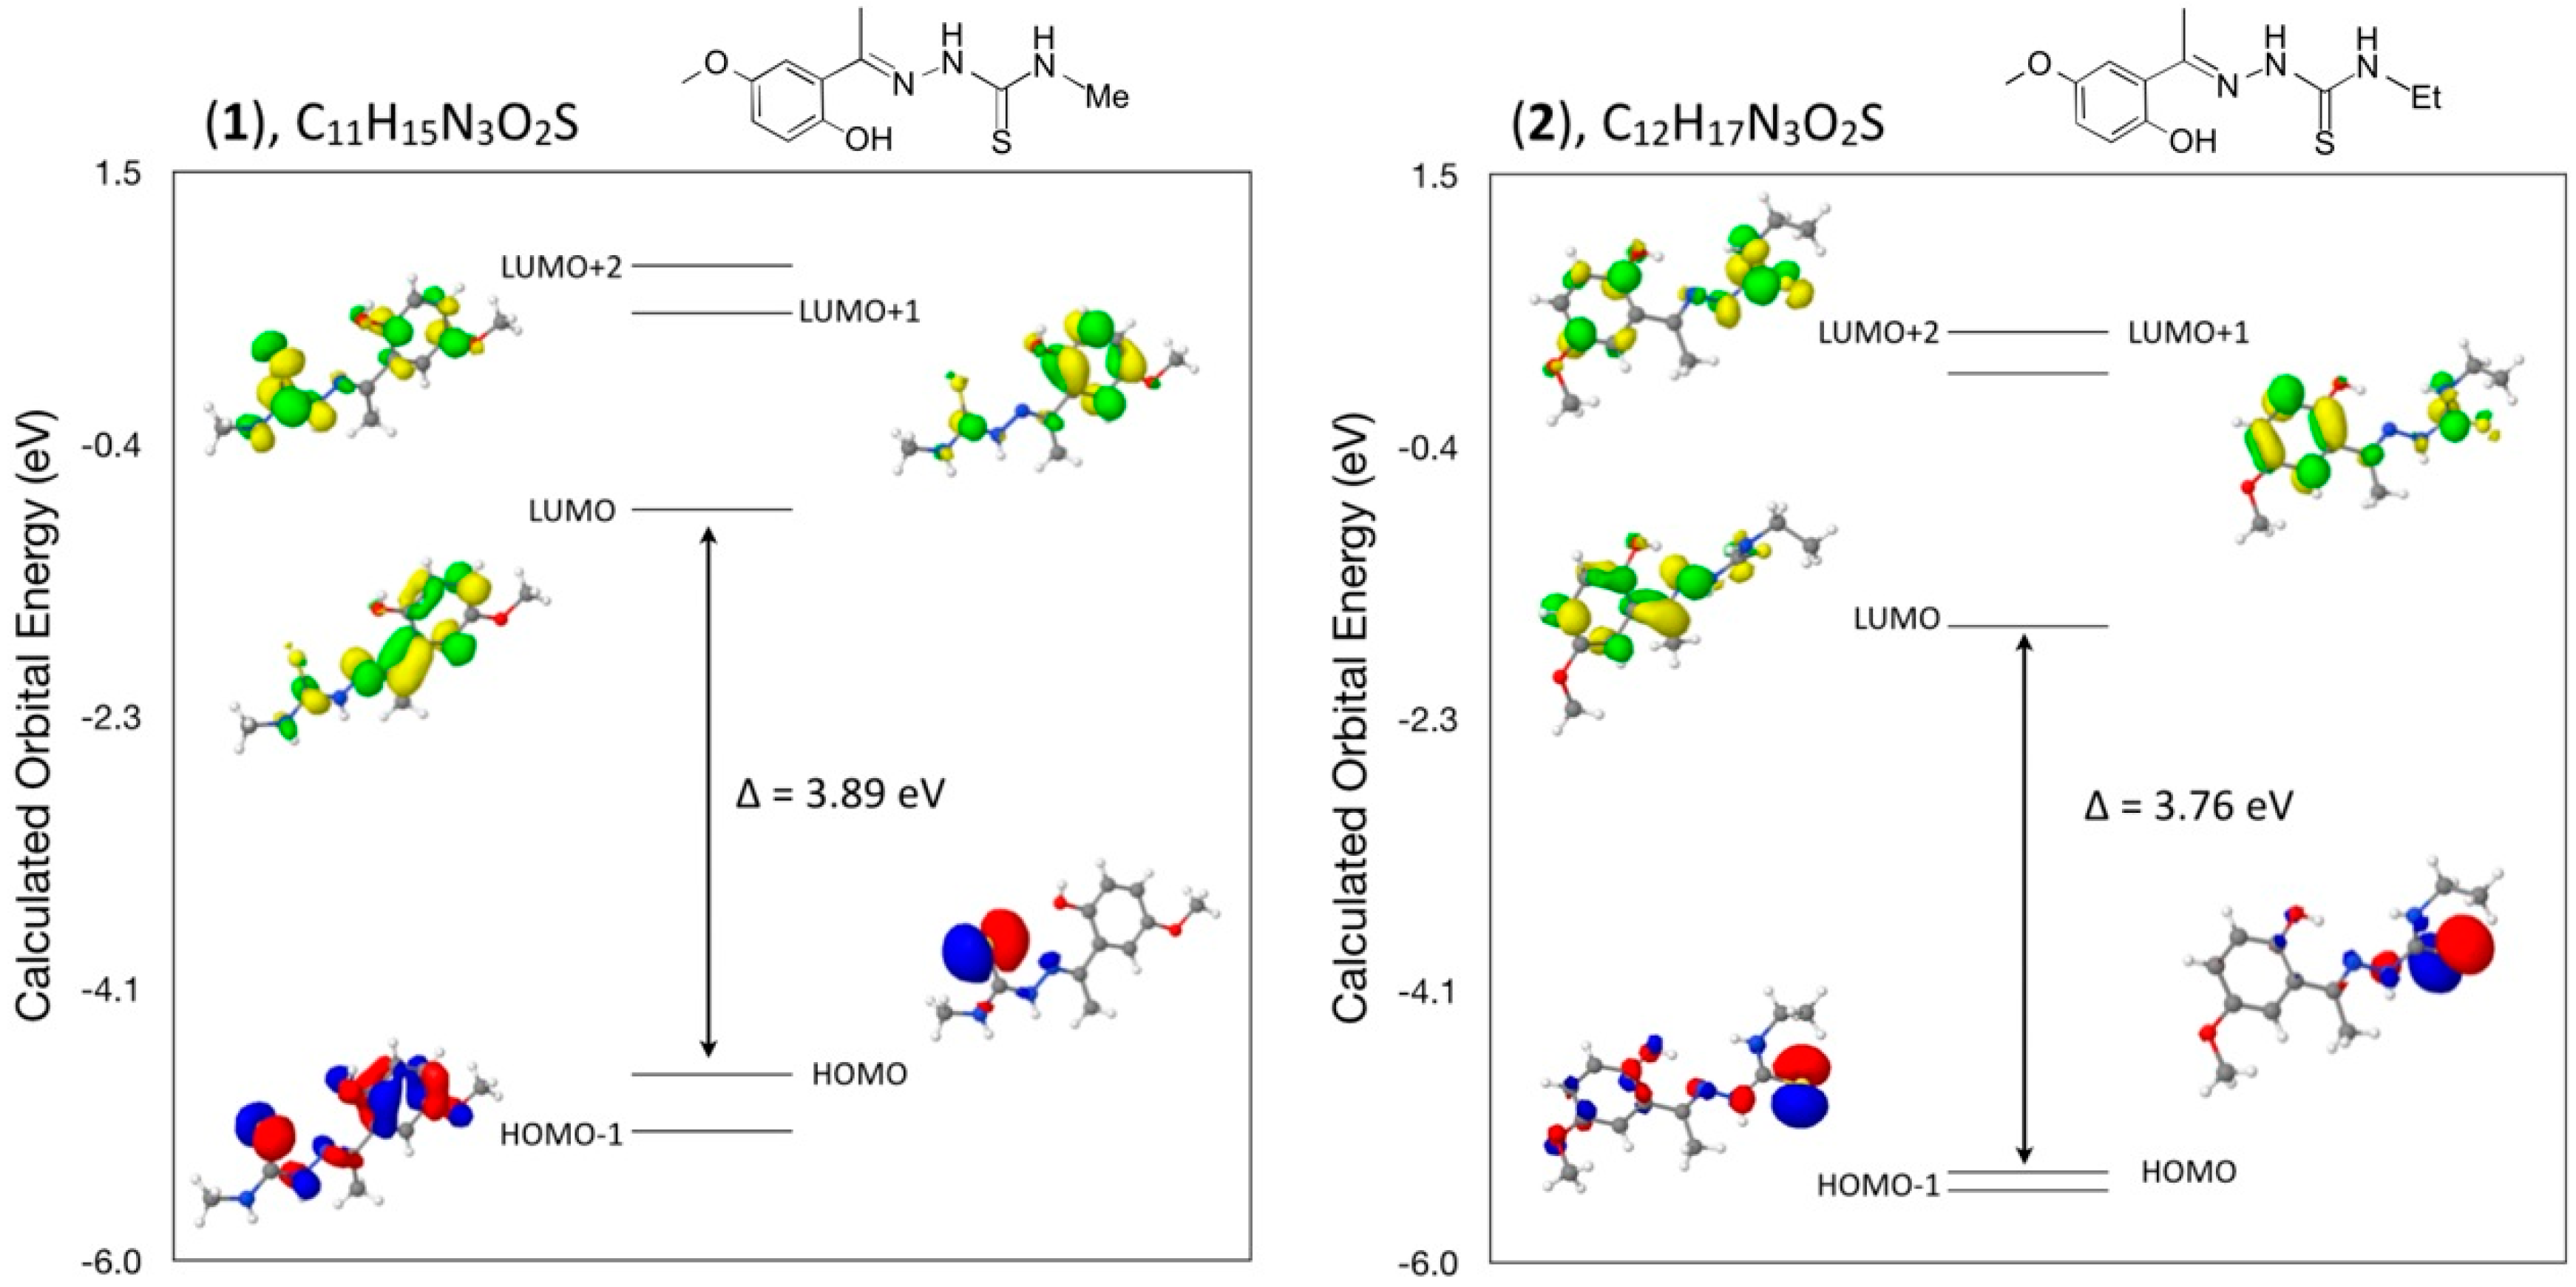
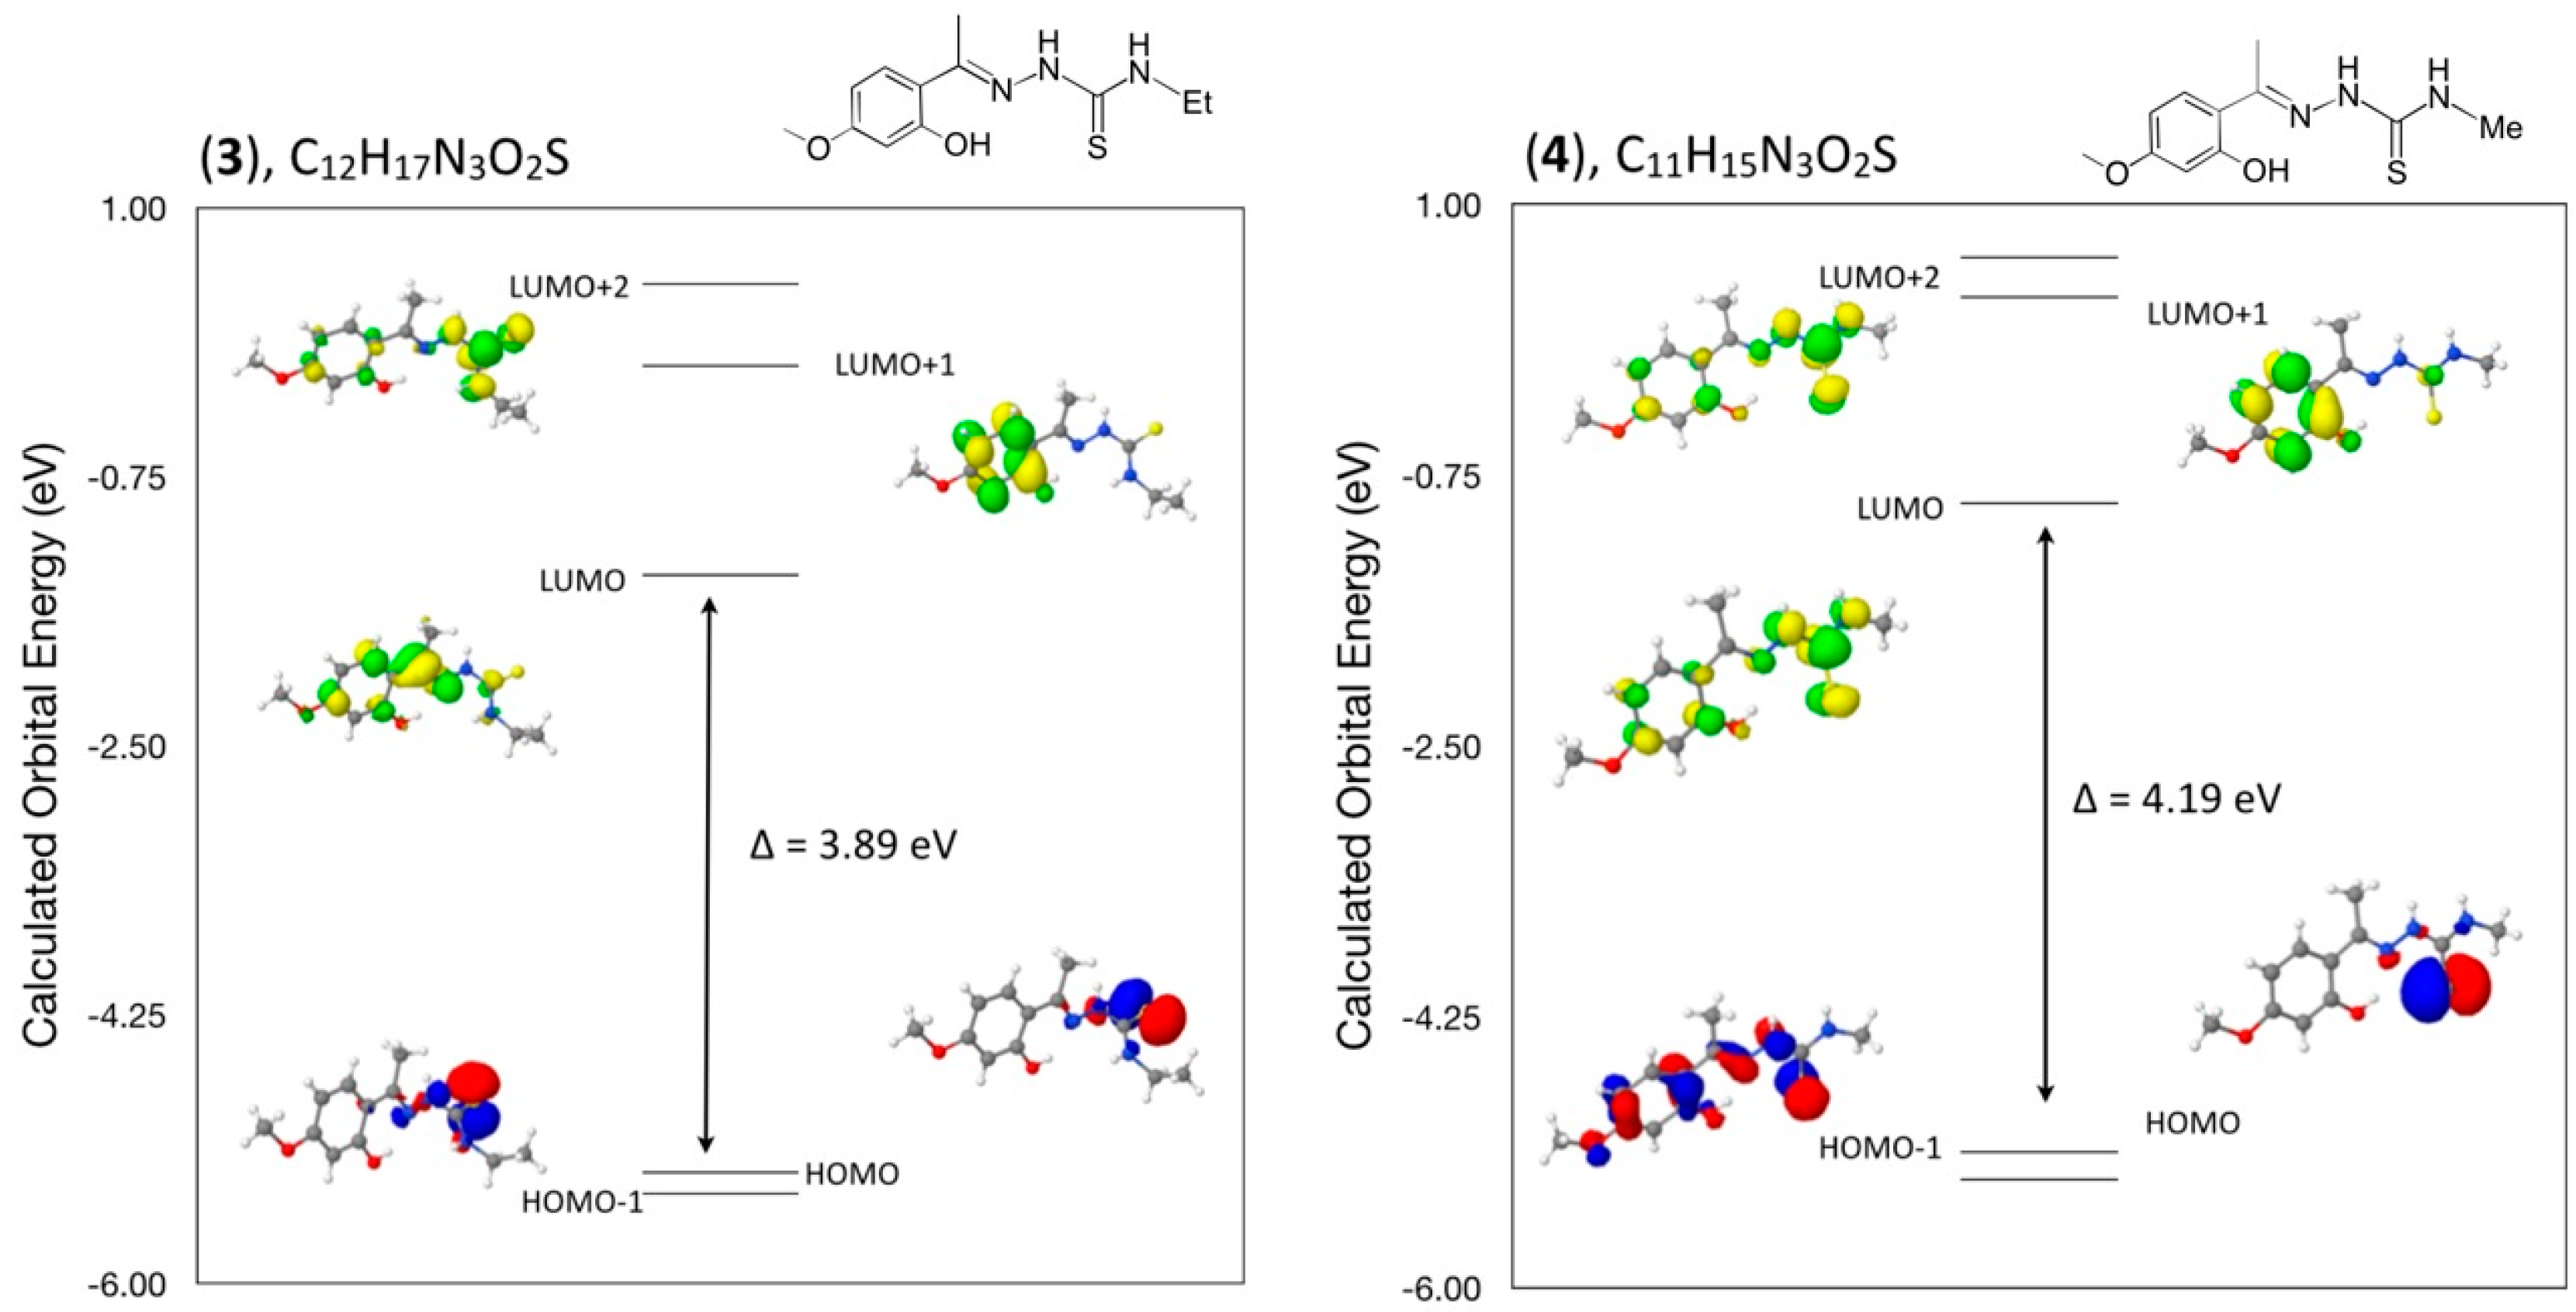
3.7. Computational Details

A density functional theory (DFT) molecular orbital calculation (WebMo Pro [20]) with the GAUSSIAN-03 program package [21] employing the B3LYP (Becke three parameter Lee-Yang-Parr exchange correlation functional), which combines the hybrid exchange functional of Becke [22,23] with the gradient correlation functional of Lee, Yang and Parr [21] and the 6–31 G(d) basis set [24] was performed on each of the six compounds. No solvent corrections were made with these calculations. Starting geometries were taken from X-ray refinement data. The optimized results in the free molecule state are, therefore, compared to those in the crystalline state. Discrepancies between the experimental and calculated band centers and band intensities exist. However, this does not prohibit us from making informed decisions on the observations since it is generally known that DFT often underestimates HOMO-LUMO gaps, thereby having a tendency to give excitations far too low in energy. All calculations were performed on a workstation PC using default convergence criteria.

3.8. Density Functional Theory (DFT) Calculations

A comparison of selected bond angles and bond distances in crystals (1), (2) and (3) to that from the geometry optimized DFT calculations at the B3LYP 6–31 G(d) level is given in Table 1, Table 3 and Table 5. The differences between the two values are within normal ranges and generally consistent with bond lengths and angles for similar types of compounds such as in compounds (4), (5) and (6).
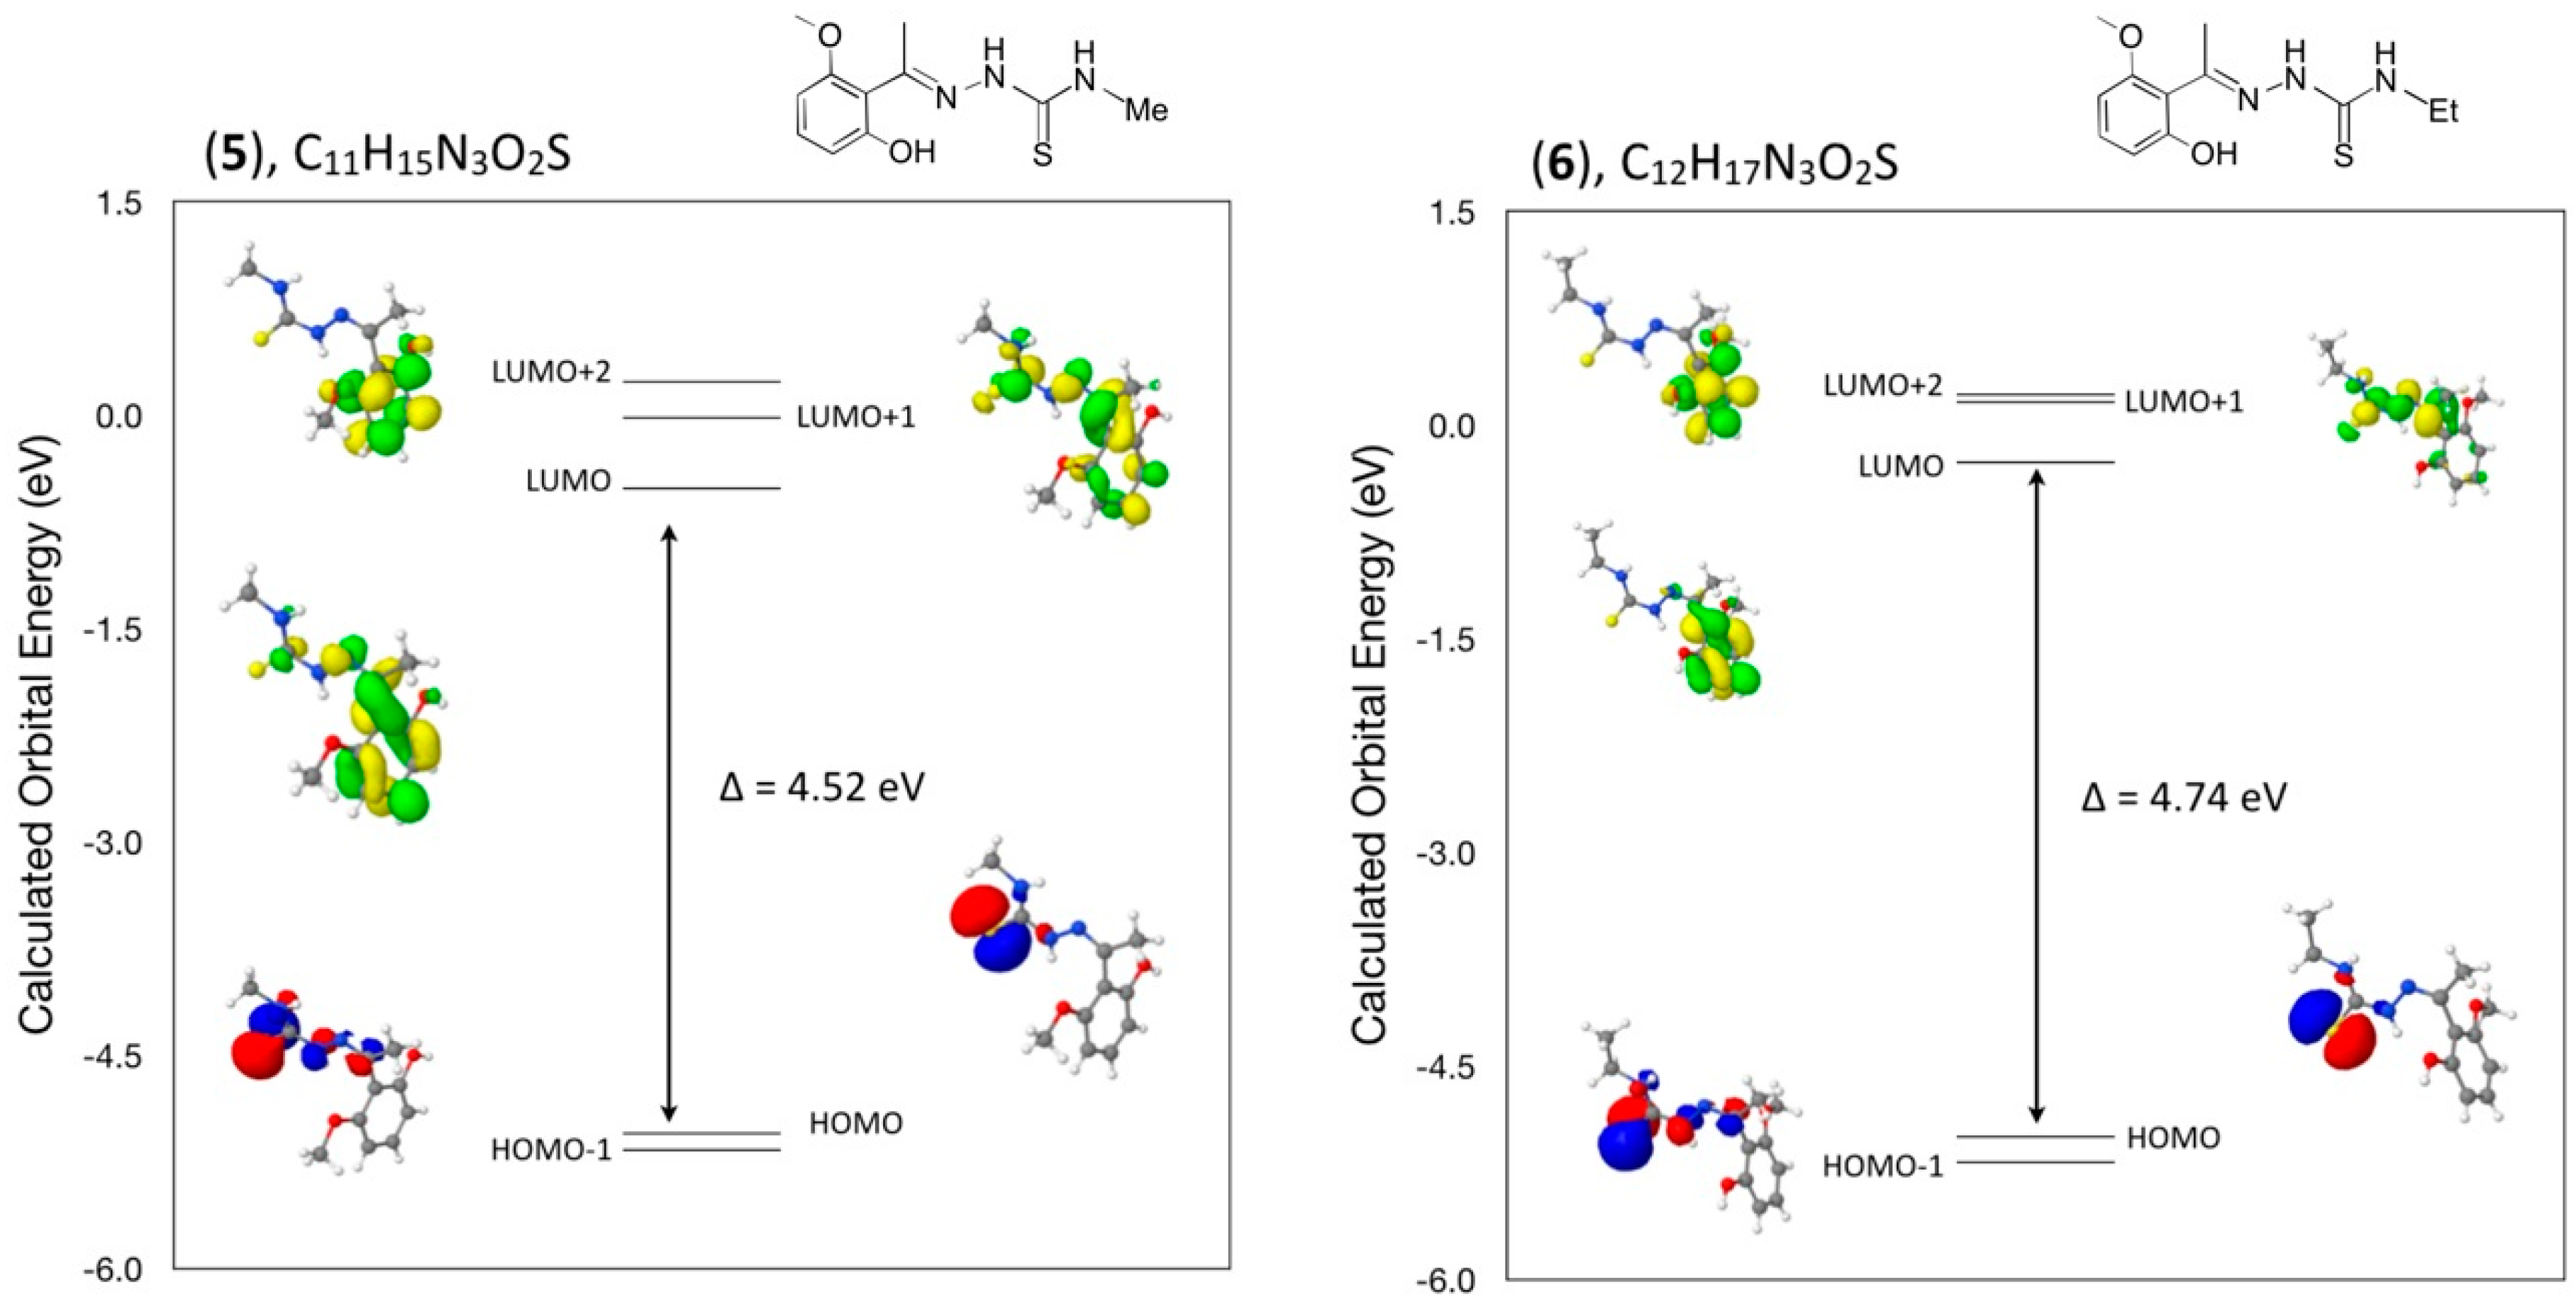
In addition, a comparison of the angles between mean planes of the indole and phenylsulfonyl rings in the crystal and with the DFT geometry optimized calculation in concert with strong and weak intermolecular hydrogen bond interactions has been included in a discussion of the structural aspects for each molecule. From a DFT molecular orbital calculation for each compound, surface plots for the two highest occupied molecular orbital (HOMO and HOMO−1) and three lowest unoccupied molecular orbitals (LUMO, LUMO+1, LUMO+2) are displayed to provide visual evidence of the molecular orbitals involved in the spectroscopic electronic energy transitions examined. Based on correlation of the energies of these HOMO-LUMO frontier surfaces to the UV-VIS absorption spectra, electronic excitation transition predications are suggested.

3.9. Electronic Absorption Spectra

Electronic absorption spectra of all compounds were obtained using a Cary-300 UV-Vis spectrophotometer. All samples were dissolved in acetonitrile and spectra were recorded at room temperature. Stock solutions of ~1 × 10⁻³ M solution were prepared and dilutions were prepared ranging down to ~2 × 10⁻⁵. All Spectra were scanned from 800 to 190 nm. Deconvolution of the spectra to obtain the λmax was carried out by the IGOR program [25].

4. Summary and Conclusions

The crystal and molecular structures of three new thiosemicarbazones have been determined, along with the frontier molecular orbitals of each compound displayed through density function theory (DFT-B3LYP 6-31G(d)) geometry optimization and molecular orbital calculations. Structural differences between these three compounds and three closely related previously published compounds have been elucidated. Correlations between the calculated molecular orbital energies (eV) for the surfaces of the frontier molecular orbitals to the electronic excitation transitions from the absorption spectrum of each of the six compounds have been determined. In each compound, the DFT molecular orbital calculation, supported by a geometry optimization calculation, confirmed that the excitation energies of the surfaces of the frontier molecular orbitals from the HOMO−1 and HOMO to LUMO, LUMO+1, LUMO+2, and LUMO+3 electronic excitations in all six compounds closely match the λmax values of the absorption spectra in overlapping contributions from two, three or four of these excitations within each band envelope. In the crystal structures of the three new compounds, as well as with the three previously published closely related structures, it has been determined that the presence of a methyl or ethyl substituted terminal amine group on the 4-methoxy, 5-ethoxy or 6-methoxy core structures in concert with hydrogen bonds and/or a variety of weak intermolecular interactions play significant roles in the crystal packing of each molecule. This is supported by changes in the mean planes between the hydrazinecarbothioamide group and phenyl rings within each comparative set of structures when the comparison is made between their crystal structures and density functional theory (DFT) geometry optimization calculations.

Supplementary Materials

1H, 13C NMR, and UV-vis spectra for all compounds 16 are available online at https://www.mdpi.com/2073-4352/6/2/17/s1.

Acknowledgments

Jerry P. Jasinski acknowledges the NSF-MRI program (grant No. CHE-1039027) for funds to purchase the X-ray diffractometer. Brian J. Anderson acknowledges the NSF-MRI program (grant No. CHE-1337206) for funds to purchase the 400 MHz NMR spectrometer. The authors also acknowledge Keene State College and the Department of Chemistry for funding and supplies.

Author Contributions

Michael B. Freedman, Sean P. Millikan, Kelly A. O’Rourke, designed the experiments and synthesized the compounds; Brian J. Anderson contributed reagents/materials/analysis tools for the project, interpreted the NMR data and assisted with writing the paper; Victoria A. Smolenski solved and refined the X-ray structures; Jerry P. Jasinski collected the X-ray data, interpreted the crystallographic results, performed the DFT calculations and assisted with writing the paper.

Conflicts of Interest

The authors declare no conflict of interest.

Appendix

CCDC 1445492 (1), 1445493 (2), 1445494 (3) contains supplementary crystallographic data for this paper. These data can be obtained free of charge from The Cambridge Crystallographic Data Centre via www.ccdc.cam.ac.uk/data_request/cif, or by emailing [email protected], or by contacting The Cambridge Crystallographic Data Centre, 12, Union Road, Cambridge CB2 1EZ, UK; fax: +44-1223-336033. E-Mail: [email protected] or at http://www.ccdc.cam.ac.uk).

References

  1. Lobana, T.S.; Sharma, R.; Bawa, G.; Khanna, S. Bonding and structure trends of thiosemicarbazone derivatives of metals-an overview. Coord. Chem. Rev. 2009, 253, 977–1055. [Google Scholar] [CrossRef]
  2. Ali, M.A.; Livingstone, S.E. Metal complexes of sulfur-nitrogen chelating agents. Coord. Chem. Rev. 1974, 13, 101–132. [Google Scholar]
  3. Campbell, M.J.M. Transition metal complexes of thiosemicarbazide and thiosemicarbazones. Coord. Chem. Rev. 1975, 15, 279–319. [Google Scholar] [CrossRef]
  4. Padhye, S.; Kauffman, G.B. Transition metal complexes of semicarbazones and thiosemicarbazones. Coord. Chem. Rev. 1985, 63, 127–160. [Google Scholar] [CrossRef]
  5. Chellan, P.; Nasser, S.; Vivas, L.; Chibale, K.; Smith, G.S. Cyclopalladated complexes containing tridentate thiosemicarbazone ligands of biological significance: Synthesis, structure and antimalarial activity. J. Organomet. Chem. 2010, 695, 2225–2232. [Google Scholar] [CrossRef]
  6. Halder, S.; Peng, S.-M.; Lee, G.-H.; Chatterjee, T.; Mukherjee, A.; Dutta, S.; Sanyal, U.; Bhattacharya, S. Synthesis, structure, spectroscopic properties and cytotoxic effect of some thiosemicarbazone complexes of palladium. New J. Chem. 2008, 32, 105–114. [Google Scholar] [CrossRef]
  7. Devi, W.B.; Singh, R.K.B.; Jasinski, J.P.; Golen, J.A. A new two dimensional copper(II) coordination complex with sulphonamide: Synthesis, crystal structure and DNA binding study. Inorg. Chem. Commun. 2012, 21, 163–167. [Google Scholar] [CrossRef]
  8. Dilworth, J.R.; Hueting, R. Metal complexes of thiosemicarbazones for imagine and therapy. Inorg. Chim. Acta 2012, 389, 3–15. [Google Scholar] [CrossRef]
  9. Xie, G.; Chellan, P.; Mao, J.; Chibale, K.; Smith, G.S. Thiosemicarbazone salicylaldiminato-palladium(II)-catalyzed mizoroki-heck reactions. Adv. Syn. Catal. 2010, 352, 1641–1647. [Google Scholar] [CrossRef]
  10. Pelagatti, P.; Venturini, A.; Leporati, A.; Carcelli, M.; Costa, M.; Bacchi, A.; Pelizzi, G.; Pelizzi, C. Chemoselective homogeneous hydrogenation of phenylacetylene using thiosemicarbazone and thiobenzoylhydrazone palladium(II) complexes as catalysts. J. Chem. Soc. Dalton Trans. 1998, 16, 2715–2722. [Google Scholar] [CrossRef]
  11. Prabhu, R.N.; Ramesh, R. Synthesis and structural characterization of palladium(II) thiosemicarbazone complex: Application to the buchwald-hartwig amination reaction. Tetrahedron Lett. 2013, 54, 1120–1124. [Google Scholar] [CrossRef]
  12. Anderson, B.J.; Freedman, M.B.; Millikan, S.P.; Jasinski, J.P. 2-[1-(2-Hydroxy-4-methoxyphenyl)ethylidene]-N-methylhydrazinecarbothioamide. Acta Crystallogr. Sect. E 2013, 69, o1315. [Google Scholar] [CrossRef] [PubMed]
  13. Anderson, B.J.; Keeler, A.M.; O’Rourke, K.A.; Krauss, S.T.; Jasinski, J.P. 2-[1-(2-Hydroxy-6-methoxyphenyl)ethylidene]-N-methylhydrazinecarbothioamide acetonitrile monosolvate. Acta Crystallogr. Sect. E 2013, 69, o11. [Google Scholar] [CrossRef] [PubMed]
  14. Anderson, B.J.; Kennedy, C.J.; Jasinski, J.P. N-Ethyl-2-[1-(2-hydroxy-6-methoxyphenyl) ethylidene]hydrazinecarbothioamide. Acta Crystallogr. Sect. E 2012, 68, o2982. [Google Scholar] [CrossRef] [PubMed]
  15. Anderson, B.; Hall, J.; Jasinski, J. N-ethyl-2-[1-(2-hydroxy-4-methylphenyl) ethylidene] hydrazinecarbothioamide. Acta Crystallogr. Sect. E 2014, 70, o735. [Google Scholar] [CrossRef] [PubMed]
  16. Anderson, B.; Shalit, Z.; Jasinski, J. N-ethyl-2-[1-(2-hydroxynaphthalen-1-yl) ethylidene] hydrazinecarbothioamide. Acta Crystallogr. Sect. E 2014, 70, o732. [Google Scholar] [CrossRef] [PubMed]
  17. Allen, F.H.; Kennard, O.; Watson, D.G.; Brammer, L.; Orpen, A.G.; Taylor, R. Tables of bond lengths determined by X-ray and neutron diffraction. Part I. Bond lengths in organic compounds. J. Chem. Soc. Perkin Trans. 1987, 2, S1–S19. [Google Scholar] [CrossRef]
  18. Oxford Diffraction Ltd. CrysAlis PRO and CrysAlis RED, Version 1.171.33.34d; Oxford Diffraction Ltd: Abingdon, UK, 2010.
  19. Sheldrick, G.M. Crystal structure refinement with SHELXL. Acta Crystallogr. Sect. C Struct. Chem. 2015, 71, 3–8. [Google Scholar] [CrossRef] [PubMed]
  20. WebMO LLc. WebMO Pro, Version 8.0.01e; WebMO LLc: Holland, The Netherlands, 2007.
  21. Gaussian Inc. Gaussian 03, Version C.02; Gaussian Inc: Wallingford, CT, USA, 2004.
  22. Becke, A.D. Density-functional exchange-energy approximation with correct asymptotic-behavior. Phys. Rev. A 1988, 38, 3098–3100. [Google Scholar] [CrossRef] [PubMed]
  23. Lee, C.; Yang, W.; Parr, R.G. Development of the colle-salvetti correlation-energy formula into a functional of the electron density. Phys. Rev. B Condens. Matter 1988, 37, 785–789. [Google Scholar] [CrossRef] [PubMed]
  24. Hehre, W.J.; Random, L.; Schleyer, P.R.; Pople, J.A. Ab initio molecular orbital theory. Acc. Chem. Res. 1976, 9, 399–406. [Google Scholar] [CrossRef]
  25. WaveMetrics. IGOR Pro (1988–2009), WaveMetrics: Lake Oswego, OR, USA, 2009.

