Article

Development of a CA-FVM Model with Weakened Mesh Anisotropy and Application to Fe–C Alloy

School of Metallurgy, Northeastern University, Shenyang 110819, China
*
Author to whom correspondence should be addressed.
Crystals 2016, 6(11), 147; https://doi.org/10.3390/cryst6110147
Submission received: 27 August 2016 / Revised: 6 November 2016 / Accepted: 11 November 2016 / Published: 15 November 2016
(This article belongs to the Special Issue Global Modeling in Crystal Growth)

Abstract

:
In order to match the growth of the decentered square and the evolution of the interface cell in a two-dimensional cellular automaton-finite volume method (CA-FVM) model with decentered square algorithm, the present work first alters the determination of the half length of the square diagonal according to the preferential growth orientation, and then modifies the interface evolution considering the contribution of neighboring solid cells. Accordingly, the sharp interface (physical basis of the model), the growth orientation, and the growth consistence are reasonably guaranteed. The CA-FVM model presents some capabilities in predicting the free growth of equiaxed dendrites. With the increase of the cooling rate, the solidification structure gradually changes from cell to dendrite, and the solute segregation becomes more severe. Meanwhile, the predicted solute segregation under the intensive cooling condition is consistent with the calculation by Ueshima model at the initial solidification stage. The predicted competition behavior of columnar dendrites is qualitatively consistent with the observation in the continuously cast steel billet. The predicted dendrite arm spacings are close to the measurements.

1. Introduction

The solidification structure of continuously cast steel strands typically consists of surface fine equiaxed dendrite, intermediate columnar dendrite, and interior equiaxed dendrite. During the steel solidification, the solute gradually enriches among columnar dendrites and, as a result, reduces the solidification temperature there, which easily causes the formation of cracks with the thermal stress [1]. Meanwhile, the over-developed columnar dendrites bridging together near the final solidification block the mixture between the enriched solute there and that before bridging, accordingly deteriorating the central segregation in the strand [2]. Therefore, the full understanding of the dendritic growth is of great significance to improving the solidification quality of the strand.
The dendrite is at the microscopic scale, whereas the liquid core in the steel strand is at the macroscopic scale—even more than 20 m in length [3,4]—leading to a considerable computational burden. Among numerical approaches for predicting the dendritic growth of alloys, cellular automaton (CA) method is the most efficient, and holds essential physical background [5]. Different from the use of additional governing equations to characterize the interface evolution in phase field (PF) and level set (LS) models, the CA approach depends on the designed neighboring configuration and capture rules [6]. However, CA models suffer severely from the mesh anisotropy. For example, dendrites tend to grow along or at 45° with respect to the mesh, regardless of the preferential growth orientation. Additionally, the growth discrepancy of multi-oriented dendrites is also a part of the artificial anisotropy. Focusing on neighboring configuration and capture rules and the interface evolution, many effective modifications have been proposed to reduce the mesh anisotropy [5,6,7,8,9,10,11,12,13,14,15]. Famous for keeping the preferential growth orientation at the coarse mesh [6], the decentered square algorithm (DCSA) has been successfully applied to the across-scale simulation of the dendritic evolution during welding, net shaping, and unidirectional solidification, and thus is the most promising method for the investigation of the dendritic growth of continuously cast steel. DCSA introduces squares with diagonals parallel to preferential growth orientations to ensure the capture of corresponding cells, and to maintain the dendrite and/or grain morphology. DCSA was first developed by Rappaz and Gandin [16,17] to describe the grain structure of alloys, and became one of key modules of ProCast. Additionally, it was coupled with melt flow and solute transport to predict the macro-segregation in the alloy ingot [18]. Inspired by the successful application of DCSA in grain structure, Wang et al. [19] connected the growth of the decentered square with the evolution of the CA cell according to the solid fraction to develop a CA-FDM (finite difference method) model known as μMatIC, accordingly simulating the multi-oriented dendritic growth of Ni-based alloys in two-dimensional (2D) and three-dimensional (3D) spaces. Subsequently, Dong and Lee [20] investigated columnar to equiaxed transition (CET) phenomena during the unidirectional solidification of Al–Cu alloys. Yuan et al. [21,22,23] coupled the model with melt flow to investigate equiaxed and columnar dendritic growth of Ni-based alloys with natural and forced convections and to reveal the formation of solute freckle induced by natural convection during the columnar solidification of Pb–Sn alloys. In addition, the solid fraction was calculated directly from the solute diffusion in the interface cell in μMatIC model. Nakagawa et al. [24] determined the solid fraction according to the solute balance at the solidification interface [7], and thus simulated the equiaxed dendritic morphology of Al–Si alloys in 2D space. Subsequently, Yamazaki et al. [25] predicted the peritectic solidification process of Fe-0.4wt%C (Fe–0.4C) alloy with the introduction of critical phase transformation temperatures according to the equilibrium phase diagram of Fe–C alloy. Zhao et al. [26] introduced the phase transition driving force to calculate the growth velocity of the solidification interface, and simulated 3D equiaxed dendritic growth of Fe–1.5C alloy. Yin et al. [27,28,29] determined the increment of solid fraction from the difference between equilibrium and actual liquid concentration (ZS method) [5], and accordingly carried out the simulation of the dendritic growth of body centered cubic (BCC) and face centered cubic (FCC) alloys in 2D quadrilateral and hexagonal grids, respectively. Meanwhile, Chen et al. [30,31] applied DCSA to predict 3D dendritic growth of tertiary alloys with ZS method [5]. Han et al. [32,33] simulated columnar dendritic growth and grain formation of Fe–C and Al–Cu alloys during gas tungsten arc welding.
The key point of DCSA is to reasonably match the stretch velocity of the decentered square and the growth velocity of the interface cell. If squares grow too fast, for example, as the maximum half length of the diagonal is 2 times the mesh size [19,20,21,22,23,24,25,26,27,28,29,30,31,32,33], they will capture multi-layers of interface cells around the solid dendrite, which goes against with the physical basis of the CA model—namely, the sharp interface—especially as the growth velocity is determined by the solute balance at the interface. Luo and Zhu [34] modified the calculation of the interface growth velocity of Fe–C alloy according to the quadratic sum of its components along axes from the solute balance. Tan et al. [35,36] established the relationship between the half length of the diagonal and the solid fraction according to the preferential growth orientation and determined the interface growth velocity of Al–Cu–Mg alloy with a PF model. However, under the premise that the preferential growth direction is ensured, meeting the sharp interface and keeping the growth consistency of multi-oriented dendrites as far as possible are still main concerns and difficulties in CA models with DCSA.
In the present paper, DCSA is embedded into the 2D CA-FVM (finite volume method) [37,38] model to deal with the preferential growth orientation. In order to keep the solidification interface sharp, the half length of the diagonal is determined according to the preferential growth orientation, as proposed by Tan et al. [35,36]. Moreover, an interface geometry factor (GF) [8,9] is introduced to ensure the growth consistence and avoid the over-capture of interface cells. Subsequently, model capability, interface type, and growth consistence are discussed in detail. Meanwhile, the CA-FVM model is employed to predict the multi-oriented dendritic solidification of Fe–0.82C alloy.

2. Model Description

2.1. Nucleation Model
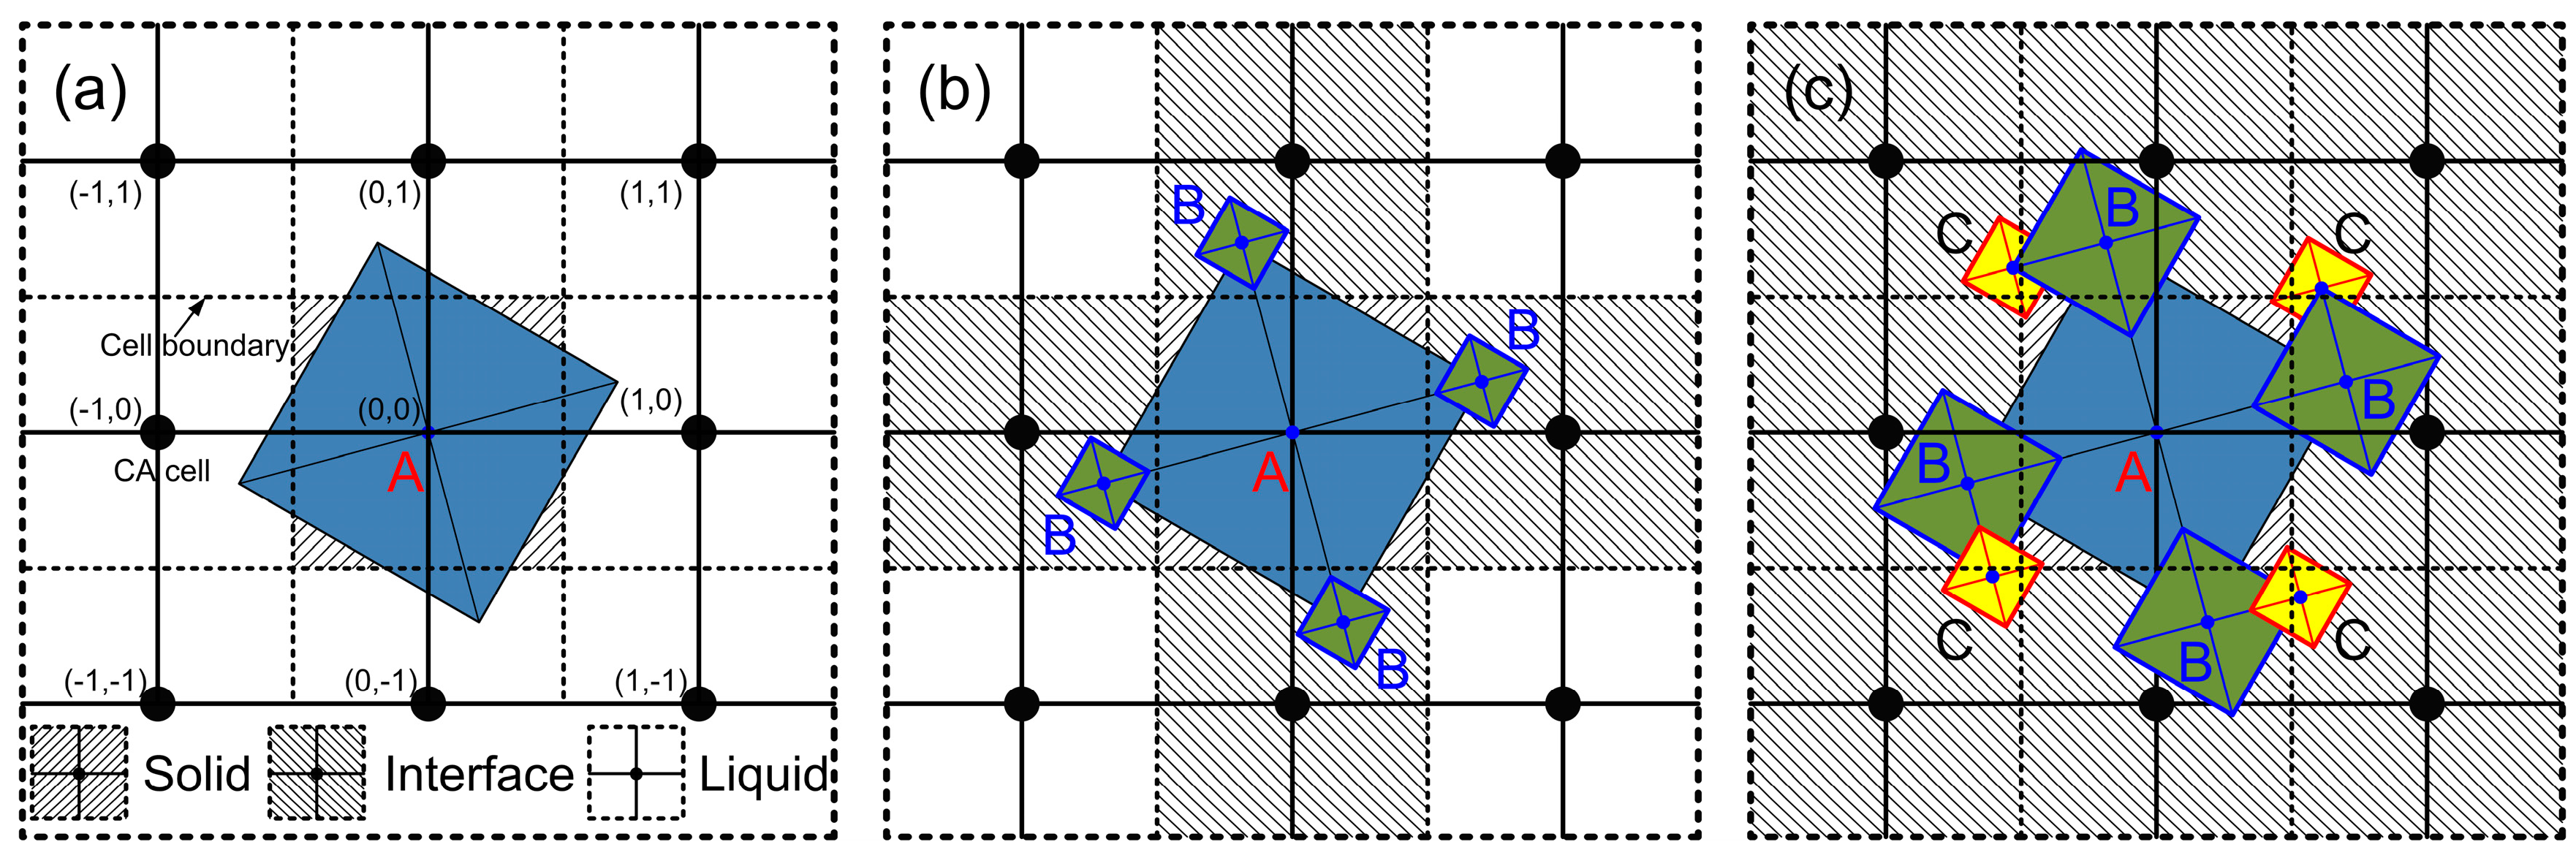
The variation of nucleation density n with the melt undercooling ΔT is described by a Gaussian function [39]:
d n d ( Δ T ) = n max 2 π Δ T σ exp ( 1 2 ( Δ T Δ T n Δ T σ ) 2 )
where nmax is the maximum nucleation density, m−1, and ΔTn and ΔTσ are the average and the standard deviation of the nucleation undercooling, K, respectively. The increment of the nucleation density, δn, induced by the change of the melt undercooling δT) is calculated as follows:
δ n = Δ T Δ T + δ ( Δ T ) d n d ( Δ T ) d ( Δ T )
The nucleation probability Pn of a liquid cell at the domain bottom is determined as follows:
P n = δ n Δ x
where Δx is the cell size. Meanwhile, a random number within 0 to 1 is generated for the liquid cell as it is scanned. If the random number is lower than Pn, and simultaneously ΔT is higher than ΔTn, nucleation will occur. The preferential growth orientation is randomly chosen within −45° to 45°.

2.2. CA Model

The solidification of a cell successively undergoes liquid, interface, and solid states, also present as its solid fraction changes from 0 to 1. Figure 1 is the schematic diagram of DCSA. As the nucleation of a liquid cell (0, 0) happens, a square noted as A with the same orientation is placed in the cell center. Four corners of square-A penetrate into the neighboring liquid cells such as (0, 1), accordingly capturing them as interface cells, as shown in Figure 1a. Simultaneously, a group of square-Bs form at A’s corners and correspond to the interface cells, respectively, as shown in Figure 1b. Growth parameters (orientation, location, etc.) of captured cells such as (0, 1) and square-Bs are inherited from cell (0, 0) and square-A. With the growth of the interface cells, square-Bs expand along the preferential growth direction, touch neighboring liquid cells such as (−1, 1), and capture them as interface cells (as shown in Figure 1c). Meanwhile, square-Cs are born at the corners of square-Bs which penetrate into neighboring liquid cells. Heretofore, all liquid cells at Moore locations of the nucleation cell (0, 0) are in interface state. Square-Bs continue growing until the corresponding interface cells become solid. Additionally, when a liquid cell cannot be captured by neighboring cells at Moore locations with their squares, it changes to an interface cell automatically. As several squares with the same orientation touch a liquid cell simultaneously, child squares are born at corresponding corners with the same orientation, but different locations. This case usually occurs when the nucleus orientation is 0°. If orientations of parent cells are different, the child’s orientation is selected as that with the maximum frequency in parents. Accordingly, the dendritic collision with different orientations is solved. With the above approaches, the orientation of an interface cell and its squares is single.
The growth velocity of the interface is determined by the solute balance and redistribution [7]:
V n C l * ( 1 k 0 ) = D s C s n | * D l C l n | *
C s * = k 0 C l *
C l * = C 0 + 1 m l ( T * T l + Γ κ f ( φ , θ ) )
κ = 2 x f s y f s x y f s ( x f s ) 2 y y f s ( y f s ) 2 x x f s [ ( x f s ) 2 + ( y f s ) 2 ] 3 / 2
f ( φ , θ ) = 1 15 ε cos ( 4 ( φ θ ) )
φ = arccos ( x f s [ ( x f s ) 2 + ( y f s ) 2 ] 1 / 2 )
where n is the norm of the solidification interface, Vn is the norm growth velocity of the interface, m/s, C 0 , C l * , and C s * are the initial content, equilibrium liquid, and solid concentrations at the interface, wt%, respectively, k0 is the equilibrium redistribution coefficient of the solute, ml is the slope of the liquidus line in the equilibrium Fe–C phase diagram, K·wt%−1, Γ is the Gibbs–Thomson coefficient of Fe–C alloy, K·m, φ and θ are angles of the interface norm and the preferential growth orientation with respect to the x axis, °, respectively, ε is the anisotropy parameter, Dl and Ds are diffusion coefficients of the solute in liquid and solid phases, m2·s−1, respectively, Tl is the equilibrium liquidus temperature of Fe–C alloy, K, and ∂xfs, ∂yfs, ∂xxfs, ∂yyfs, and ∂xyfs are derivatives of solid fraction fs determined with the bilinear interpolation method [13,14].
The magnitude of Vn is determined as follows [7]:
V n = V x | cos φ | + V y | sin φ |
V x = 1 Δ x ( 1 k 0 ) C l , P * { D s , P [ ( C s , P * C s , W ) f s , W + ( C s , P * C s , E ) f s , E ] + D l , P [ ( C l , P * C l , W ) ( 1 f s , W ) + ( C l , P * C l , E ) ( 1 f s , E ) ] }
where Vx and Vy are growth velocities along x and y axes, m·s−1, and W and E represent left and right neighbors of the present interface cell P, respectively.
Therefore, the half length of the square diagonal Ldia is updated as follows [9,35,36]:
L dia t + Δ t = L dia t + G F V n Δ t
G F = min ( 1 , ω G F ( i = 1 4 s i I + 1 2 i = 1 4 s i II ) )
s i I , s i II = { 1 f s = 1 0 f s < 1
where GF is the geometry factor, ω G F is the correction factor (influenced by the interfacial undercooling and the preferential growth orientation), s i I and s i II are state parameters of first and second nearest neighboring cells, respectively, and Δt and t are the time step and the solidification time, s, respectively.
Subsequently, the solid fraction is updated as follows [35,36]:
f s t + Δ t = L dia t + Δ t Δ x ( | sin θ | + cos θ )

2.3. Transport Models

The heat transfer during the solidification is described with a 2D heat conduction Equation:
ρ c p T t = λ 2 T + ρ L f s t
where T is the temperature, K, ρ is the density, kg·m−3, λ is the thermal conductivity, W·m−1·K−1, cp is the specific heat capacity, J·kg−1·K−1, and L is the solidification latent heat, J·kg−1.
Solute diffusions in liquid and solid phases are governed by the following equations:
C l t = D l 2 C l + C l ( 1 k 0 ) f s t
C s t = D s 2 C s
Meanwhile, the solid concentration in the interface cell is updated as follows:
C s t + Δ t = C s t f s t + k 0 C l t Δ f s f s t + Δ f s
As the interface cell becomes solid, the solute in the residual liquid phase discharges to the neighboring liquid phase, according to the concentration difference between them.
Both Equations (16) and (17) are solved implicitly. However, Equation (18) is treated explicitly, as well as the interface evolution. Therefore, the time step should satisfy the stability:
Δ t min ( Δ x V n , max , Δ x 2 4 D max )
where Vn,max is the maximum growth velocity of the interface, m·s−1, and Dmax is the maximum solute diffusion coefficient, m2·s−1. Physical properties of Fe–0.82C alloy are listed in Table 1 [37,38].

3. Model Evaluation and Application

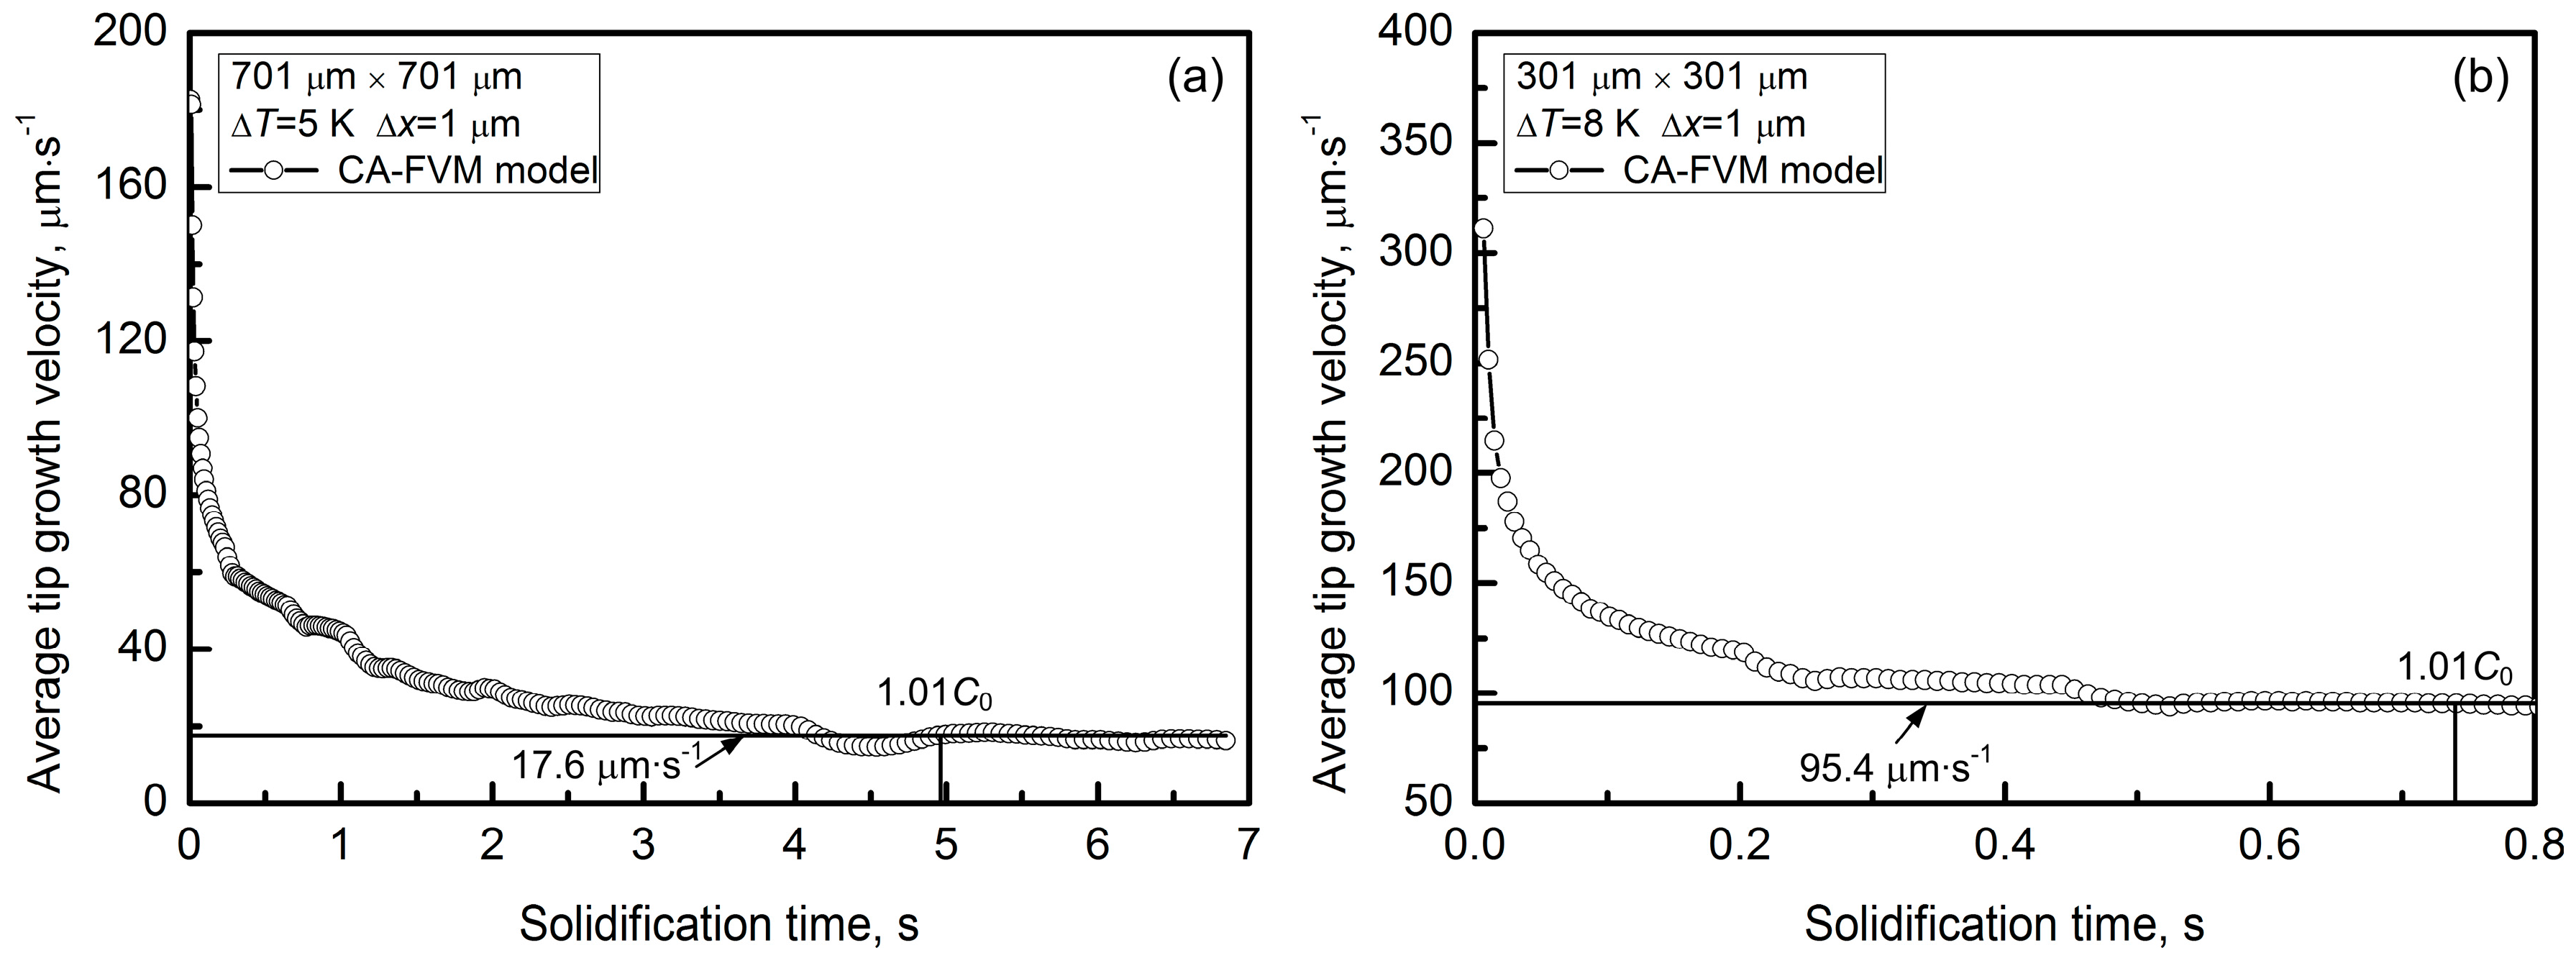
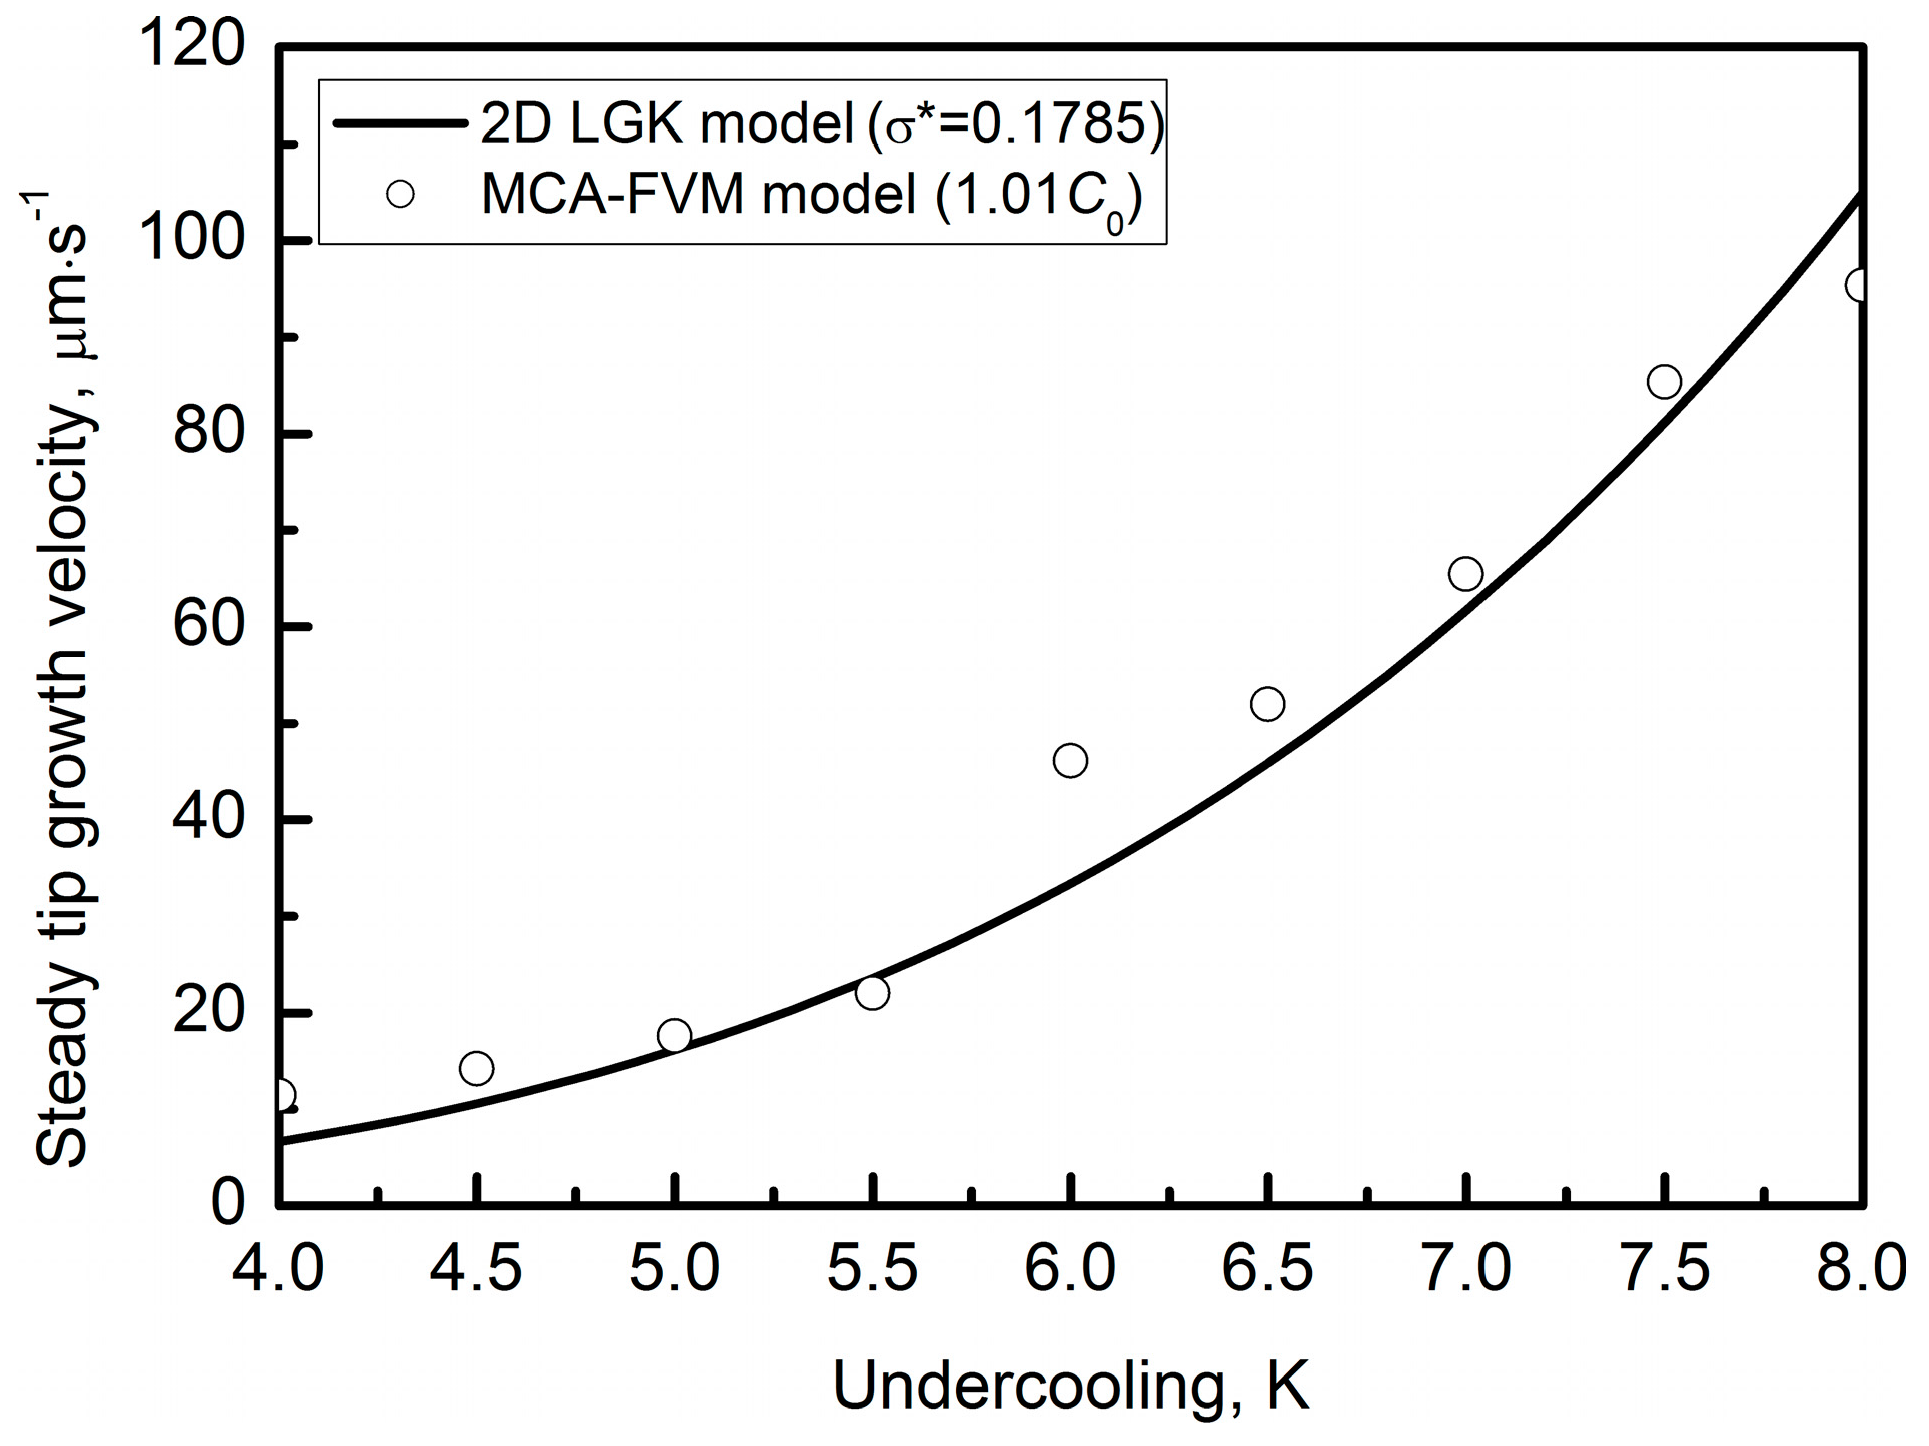
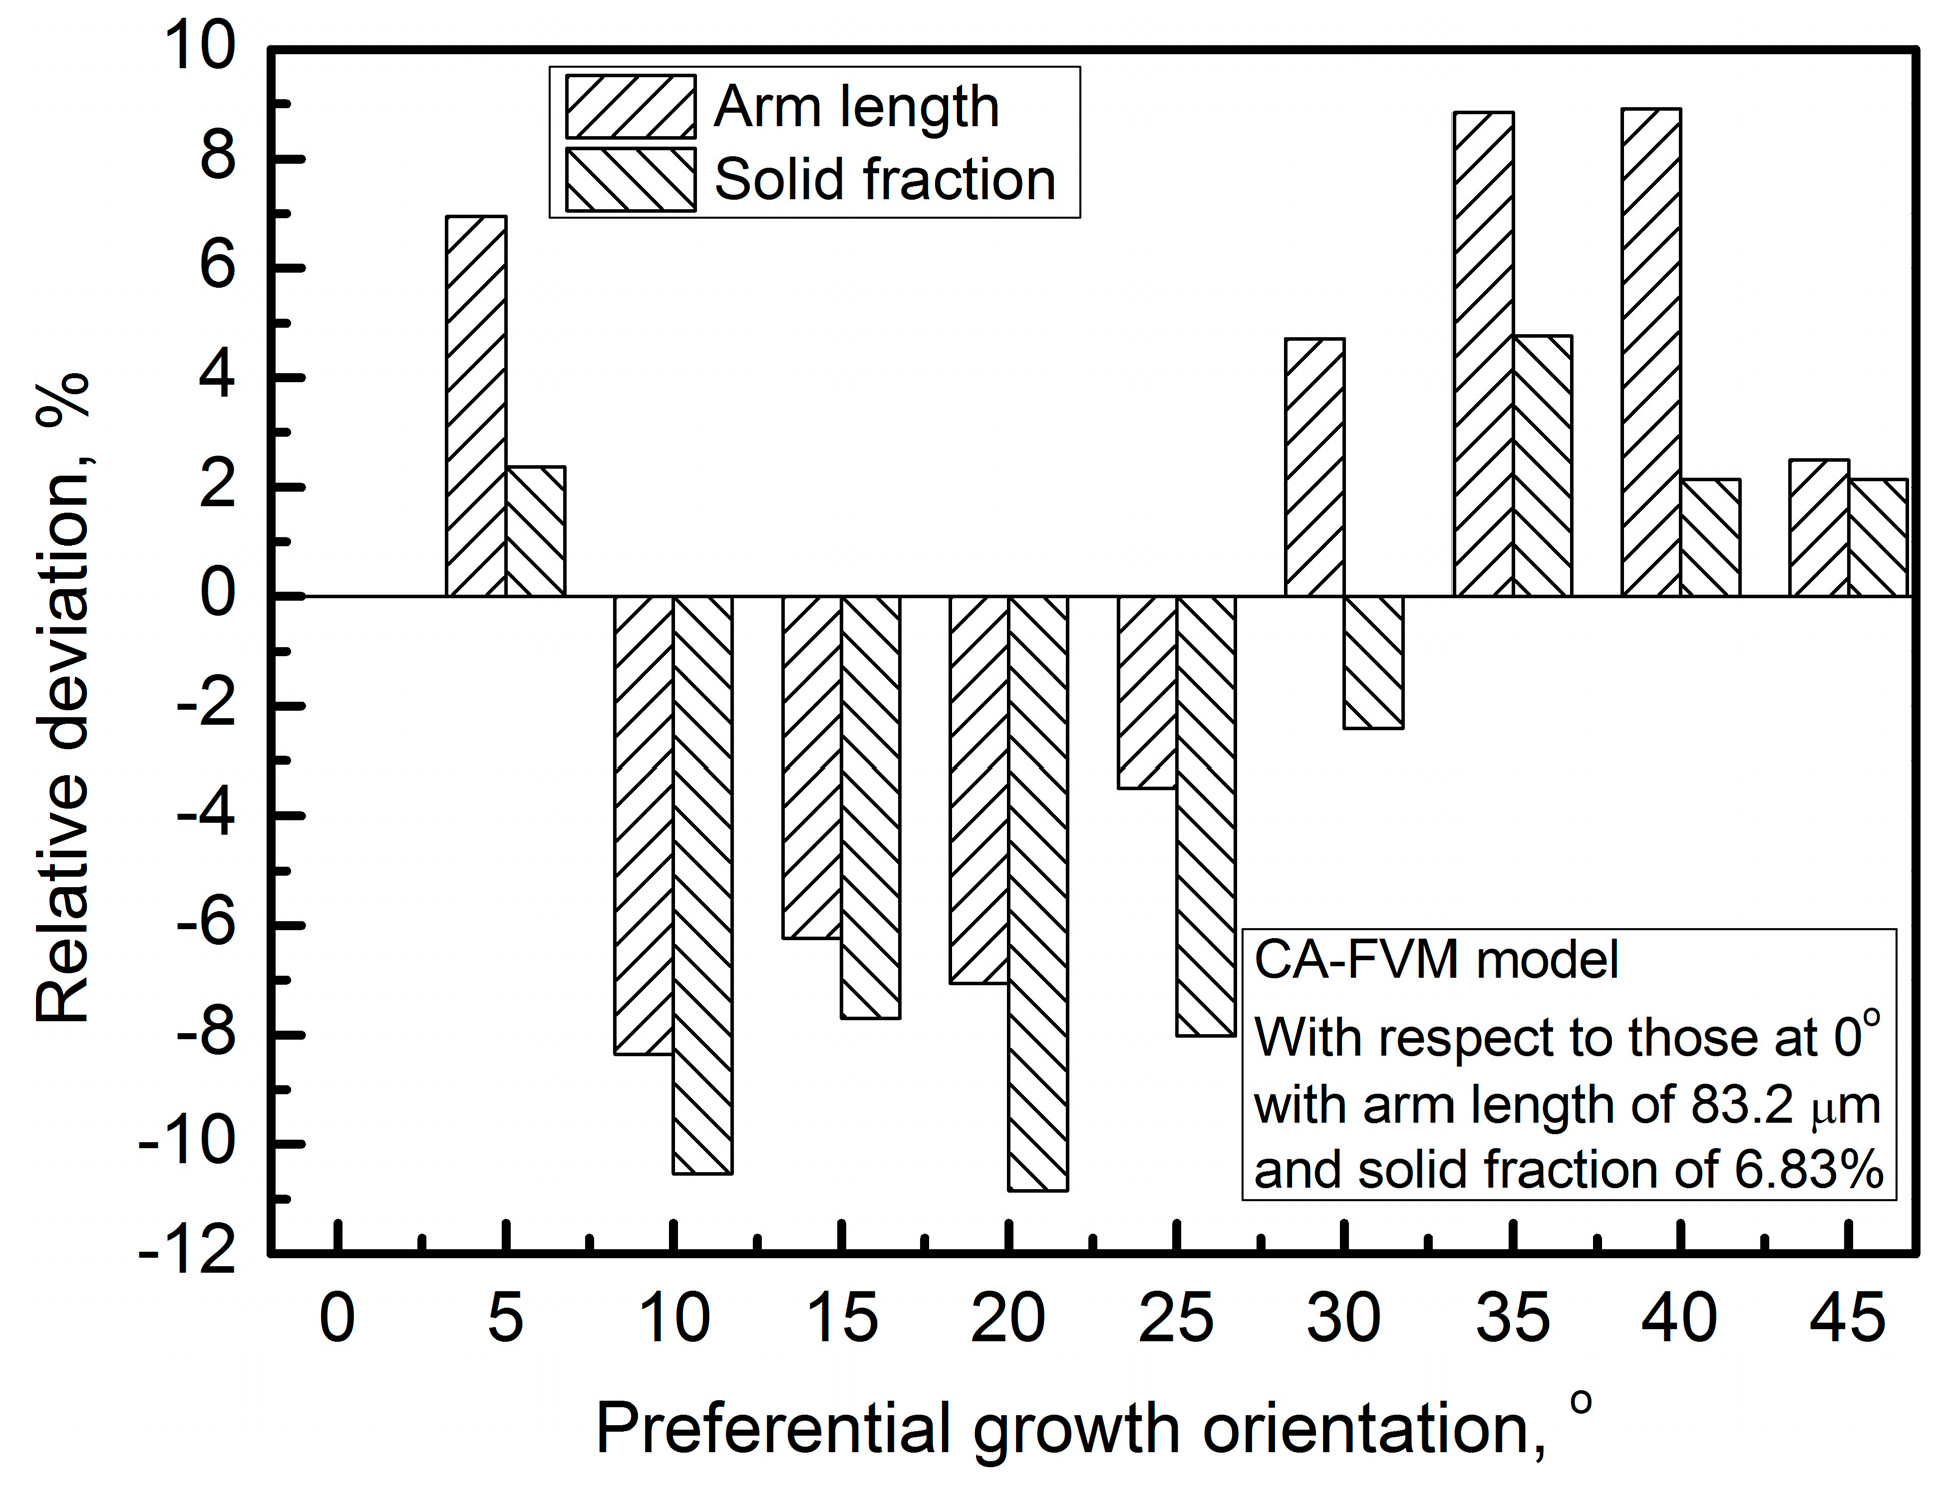
3.1. Free Growth of Equiaxed Dendrite

The present work designs a n μm × n μm modeling domain, meshes it into 1 μm × 1 μm cells, and places a nucleus with the preferential growth orientation of 0° in the center of the domain. The temperature in the domain is constant according to the preset melt undercooling ΔT. Meanwhile, the solute field is initialized at 0.82 wt%, with the solute flux of 0 at boundaries. Therefore, the free equiaxed dendritic growth of Fe–0.82C alloy is simulated and compared with the Lipton–Glicksman–Kurz (LGK) analytical model [40]. In addition, the stability constant σ* is 0.1785 as the anisotropy parameter of 0.04 [41].
In order to determine the steady state, the average growth velocity V ¯ n is defined by the cell size and the time interval as the cell stays at interface state [37]. Figure 2 shows V ¯ n of dendritic tips at melt undercoolings of 5 K and 8 K. According to the dendritic growth theory [9,42], the solidification time and length needed by the equiaxed dendrite to reach the steady state should be on the orders of D l V ¯ n 2 and 5 D l k 0 1 V ¯ n 1 , respectively. For example, the transient time and length are 19.4 s and 4.6 mm as ΔT is 5 K, according to the steady tip growth velocity (16.1 μm∙s−1) predicted by the LGK model. Therefore, before the dendritic growth reaches the steady state at ΔT = 5 K, it will be influenced by boundary conditions. Beltran-Sanchez and Stefanescu [7] proposed that the steady state can be determined as the concentration at the boundary contrary to the dendritic tip reaches 1.01 times the initial value. So, the domain size is adjusted according to the melt undercooling in the present work. Steady states at melt undercoolings of 5 K (n = 701) and 8 K (n = 301) are properly determined according to Beltran-Sanchez and Stefanescu [7], as shown in Figure 2. Figure 3 shows steady tip growth velocities of equiaxed dendrites predicted by CA-FVM model and the comparison with analytical results. Steady tip growth velocities agree with analytical results. Meanwhile, compared with our previous model based on Neumann rule [37,38,41], the accuracy is much improved. However, because the present approach is deterministic and depends on the mesh layout, the mesh size greatly influences the dendritic radius.

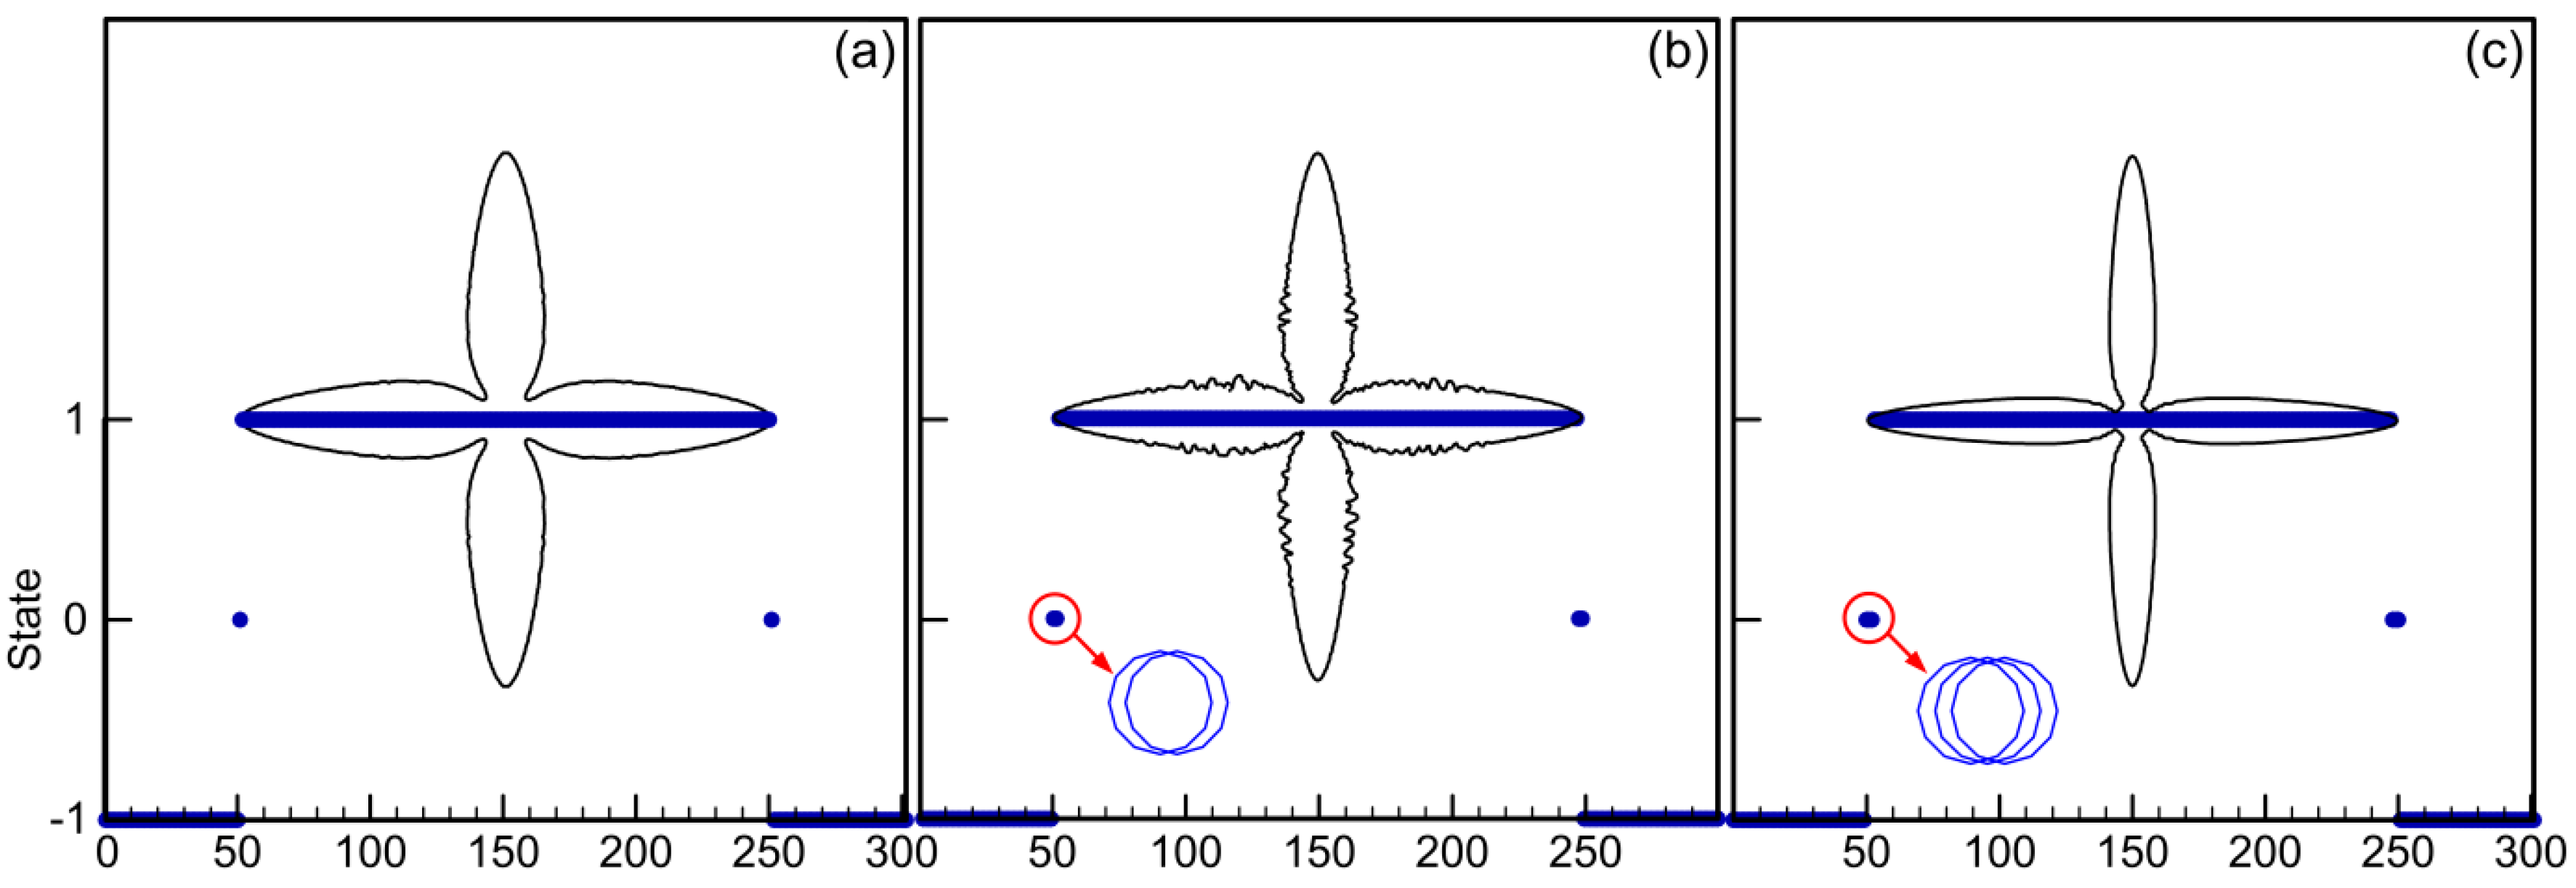
3.2. Interface Type and Growth Consistence

In order to ensure the physical background of the present CA-FVM model to deal with the dendritic solidification problem, its interface type is investigated and compared with the prediction by Luo and Zhu [34], and that with 2 Δ x as the maximum half length of the square diagonal. Figure 4 shows the distribution of the cell state in the horizontal centerline during the free growth of a single equiaxed dendrite. There exists one interface cell in front of the equiaxed dendritic tip, therefore the present CA-FVM model can keep a sharp interface. However, models developed by Luo and Zhu [34] and with 2 Δ x produce two and three interface cells in front of the tip, as shown in Figure 4b,c. Therefore, the present CA-FVM model is better for simulating the dendritic solidification of alloys due to a more reliable physical basis.
Figure 5 shows the equiaxed dendritic morphology predicted by CA-FVM model at the melt undercooling of 9 K and the solidification time of 0.6 s. Equiaxed dendrites grow along the preferential orientations as preset, meanwhile lengths of primary arms are similar, especially as preferential growth orientations are 0° and 45°. Primary arms are symmetrical according to the centerlines and the diagonals in 0° and 45° cases. However, the symmetry of primary arms is influenced by the mesh in the 15° case. Figure 6 shows the relative deviations of the primary arm length and the solid fraction with respect to the 0° case. The bases of the primary arm length and the solid fraction of the equiaxed dendrite are 83.2 μm and 6.83%, as shown in Figure 5a. Therefore, as the preferential growth orientation varies from 5° to 45°, relative deviations of the primary arm length and the solid fraction are within −8.36% to 8.91% and −10.85% to 4.77%, respectively. The Cartesian grid inevitably induces anisotropy [43], however the present CA-FVM model reduces it into a reasonable and acceptable level.

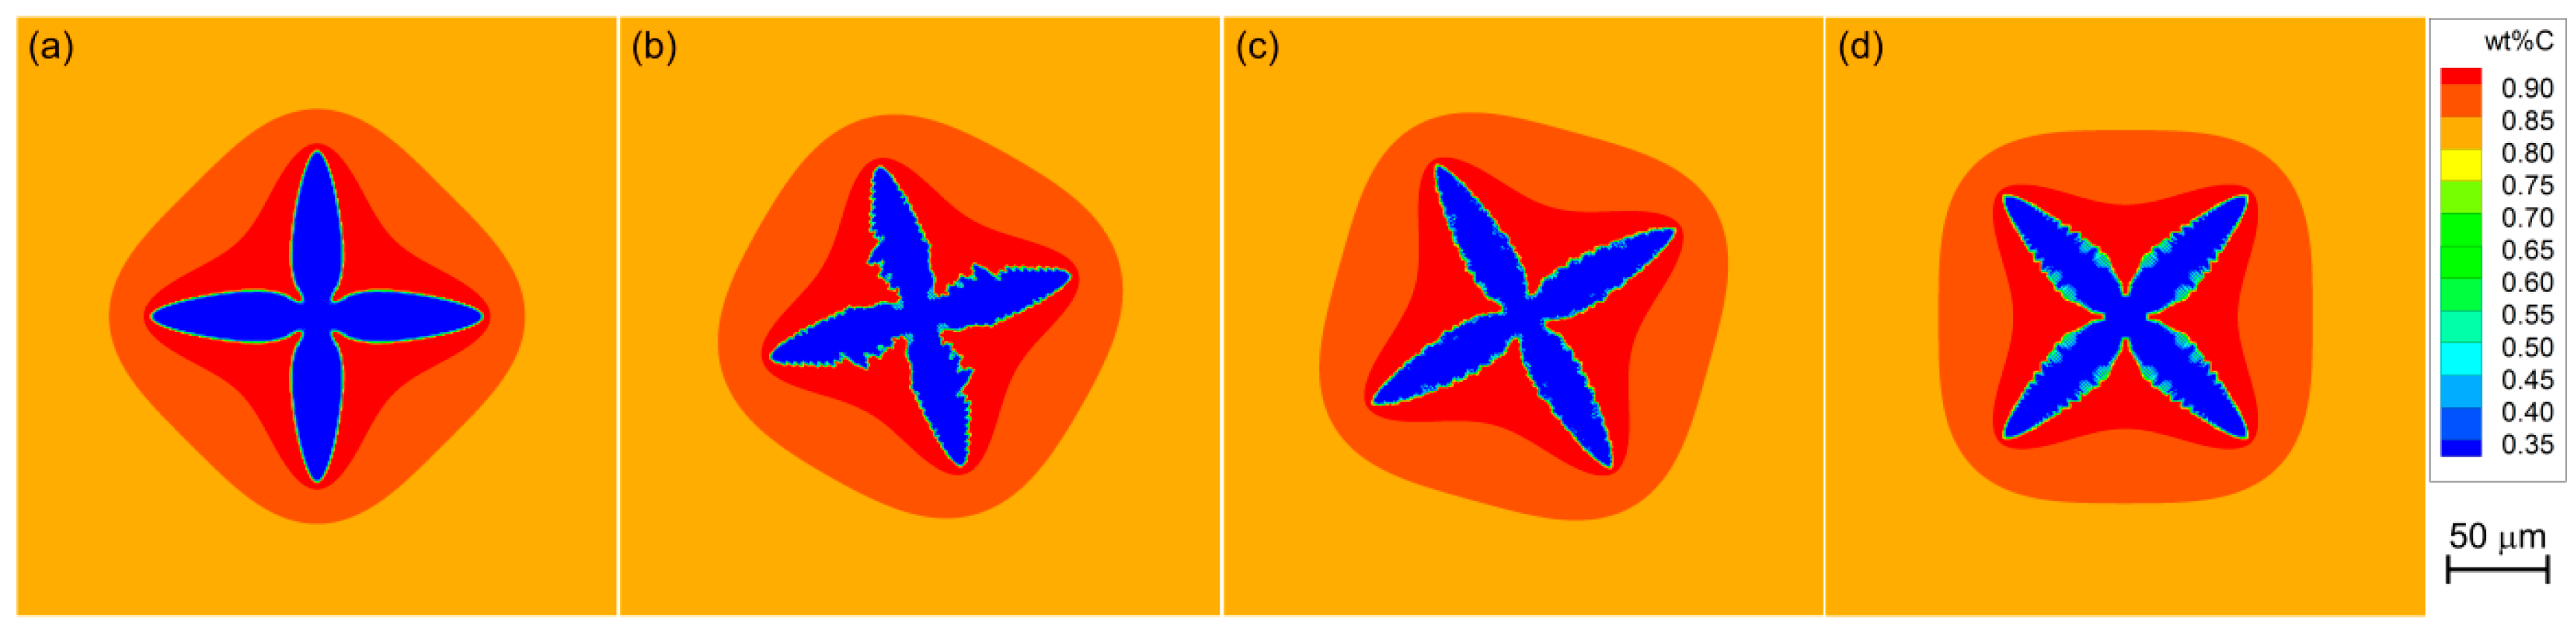
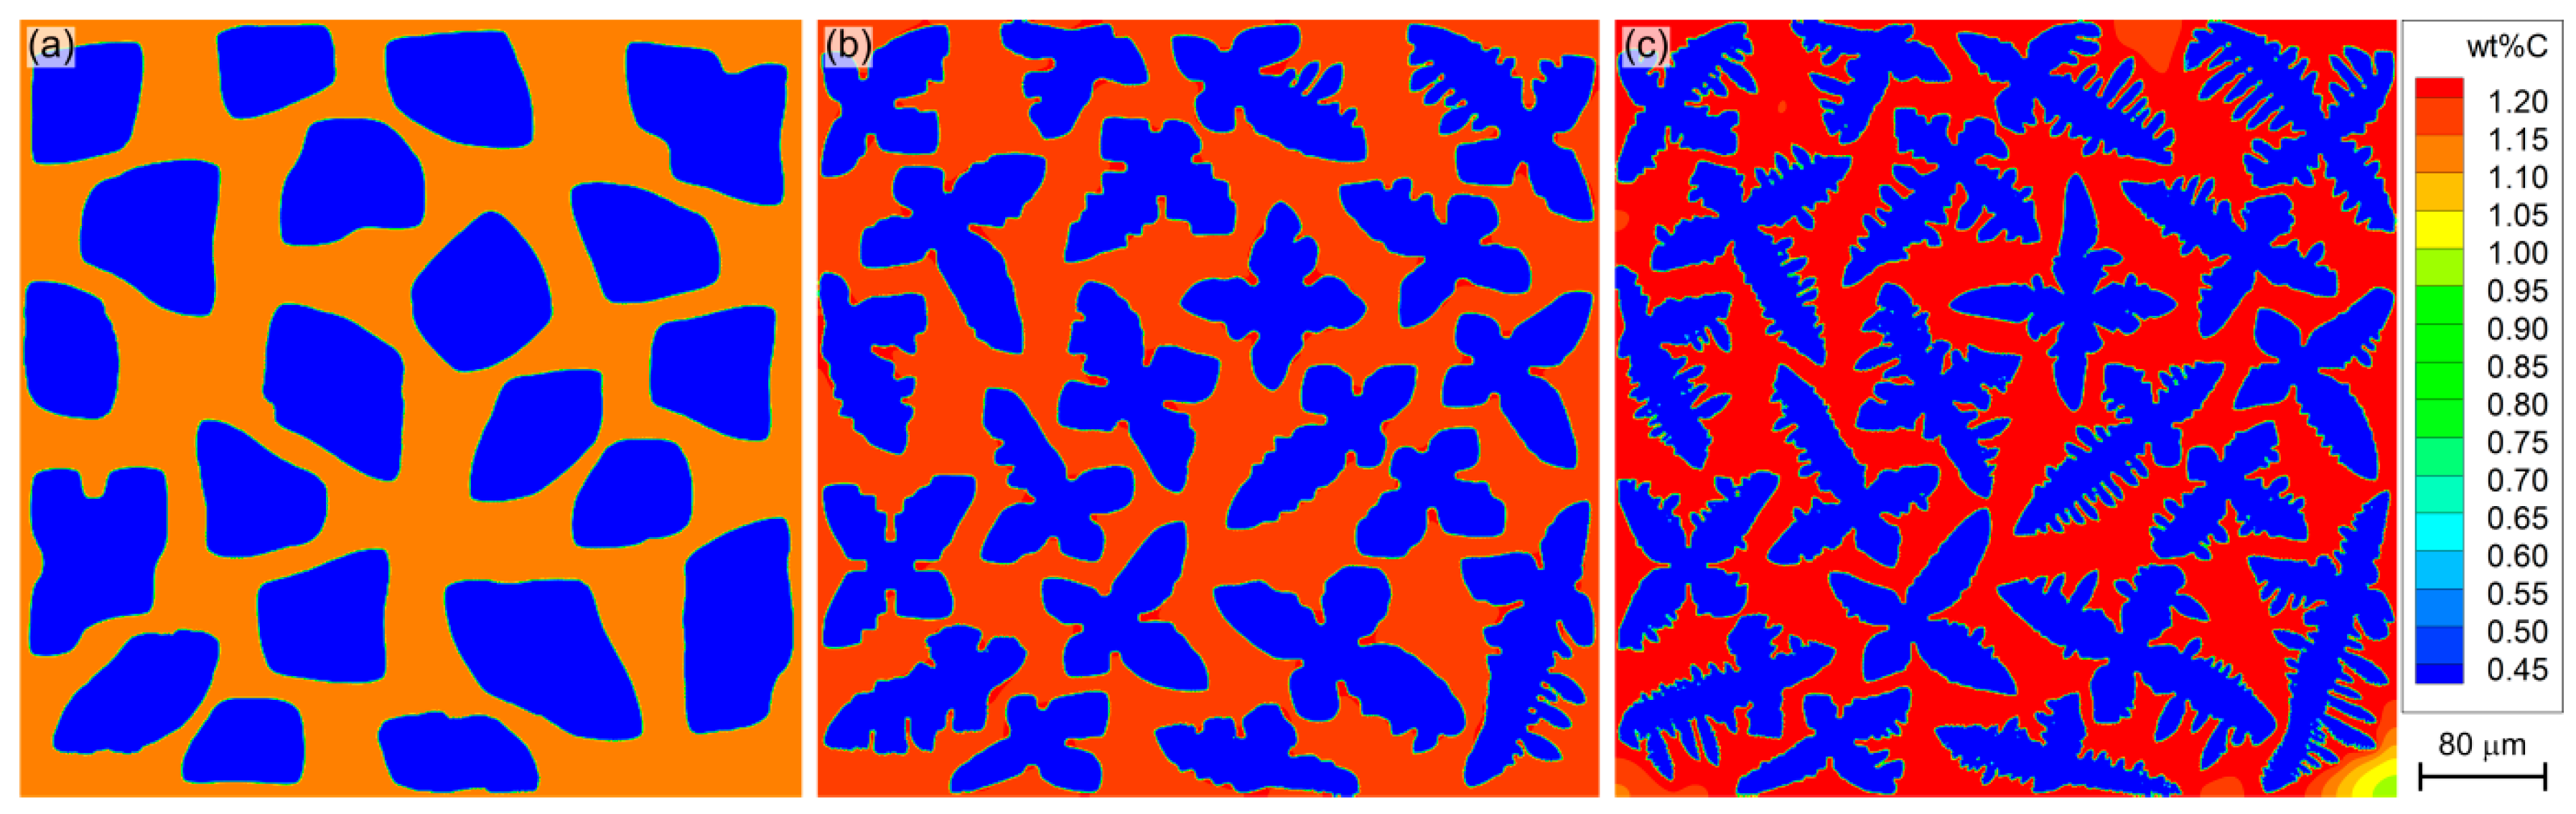
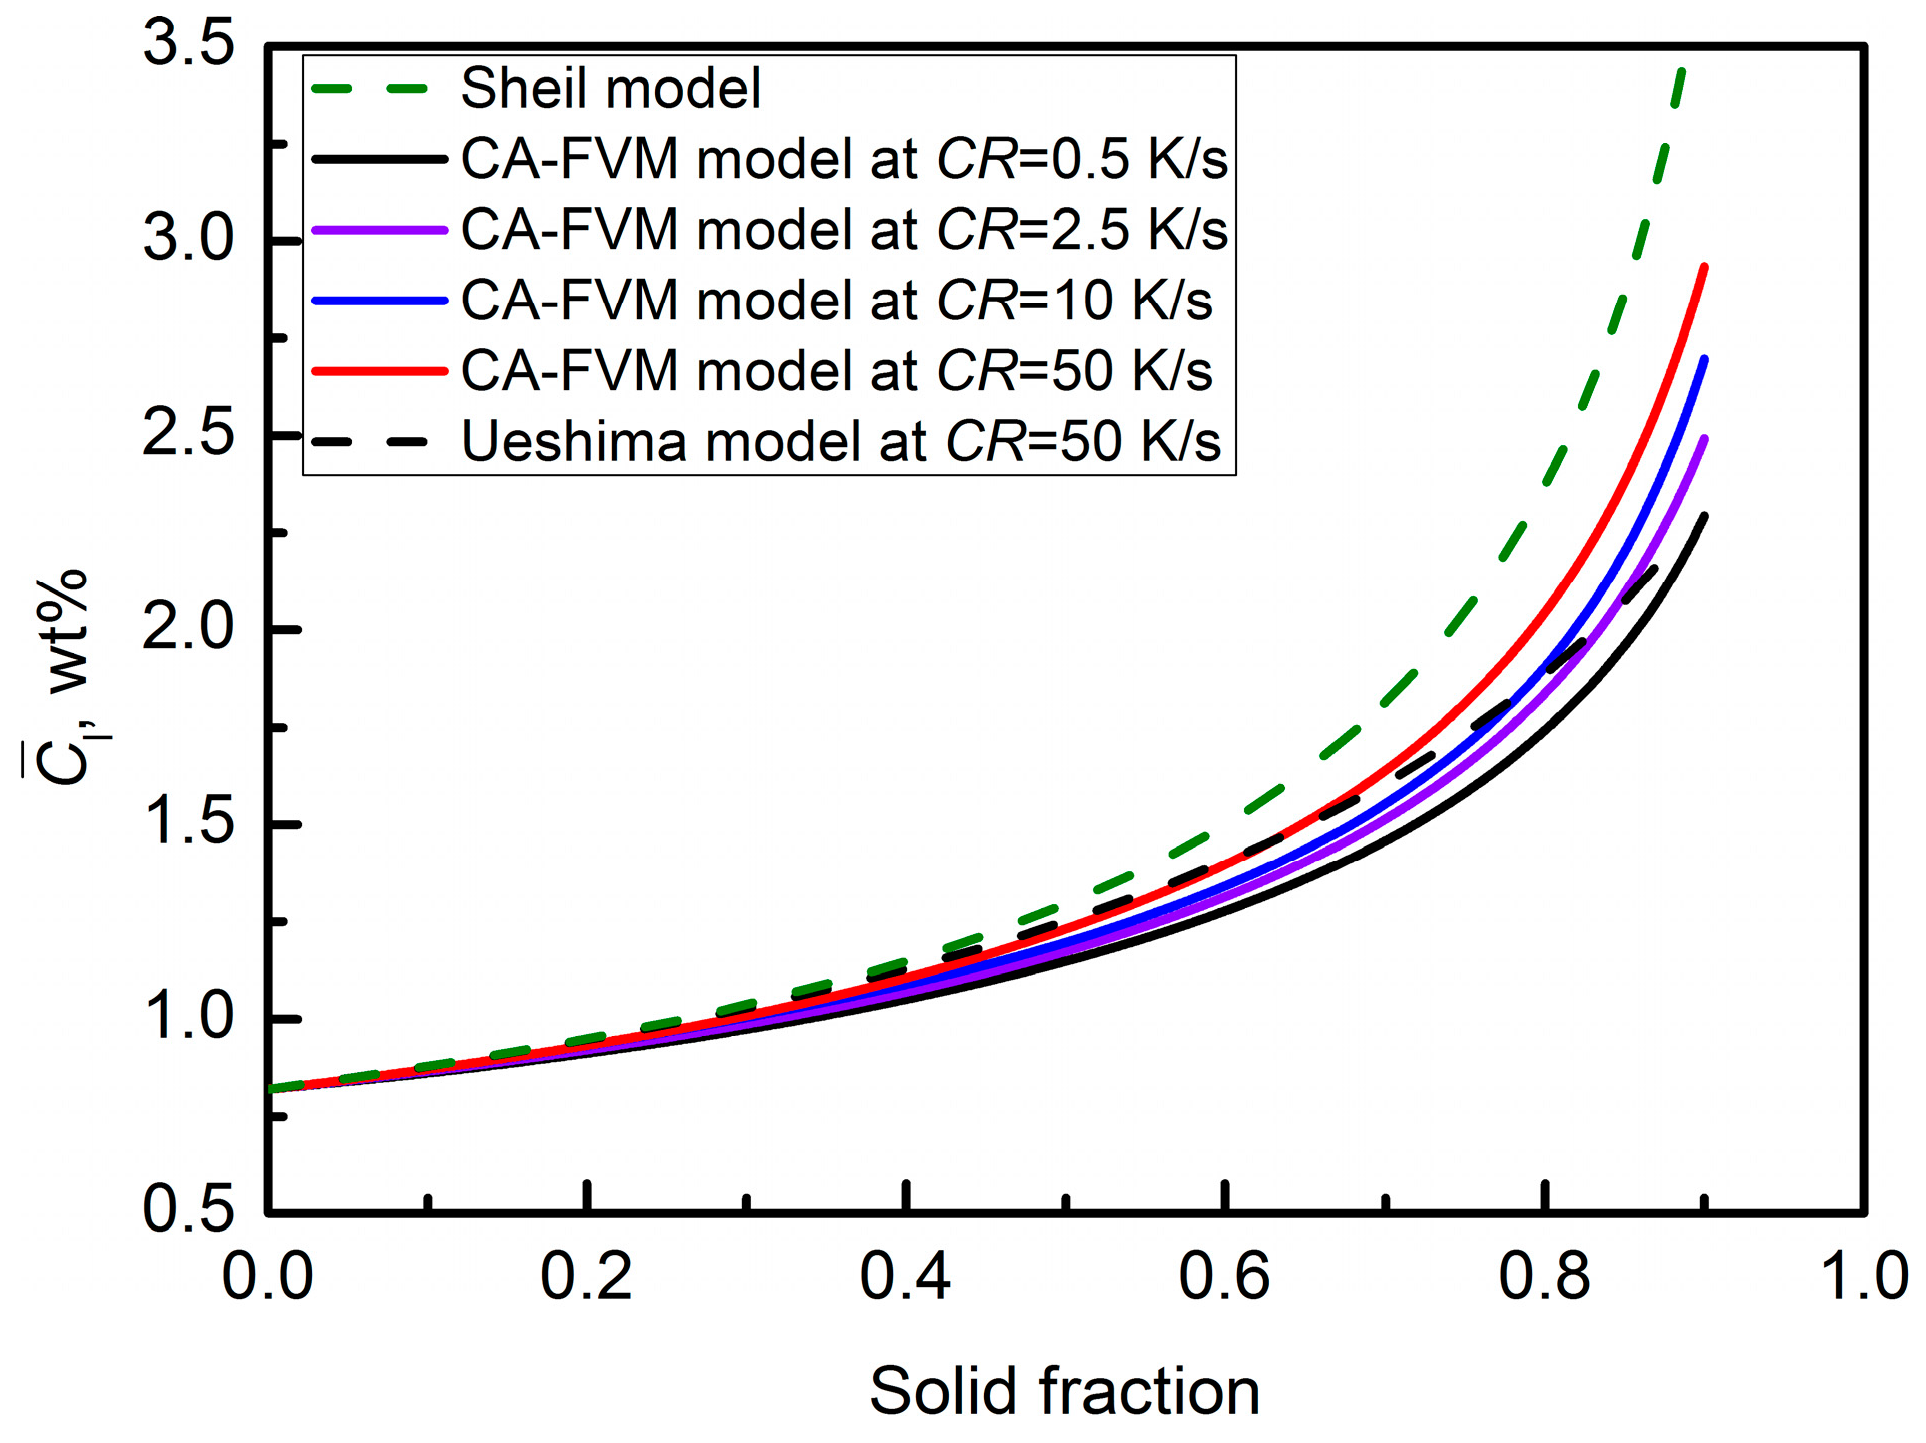
3.3. Segregation among Equiaxed Dendrites

In a 500 μm × 500 μm domain meshed with 1 μm × 1 μm cells, 21 nuclei with different preferential growth orientations are randomly placed. Meanwhile, the melt of Fe–0.82C alloy in the domain is gradually cooled from Tl according to the preset cooling rate. Figure 7 shows the solute distribution around equiaxed dendrites at the solid fraction of 0.5, as the cooling rate (CR) varies from 0.5 K·s−1 to 50 K·s−1. As CR is 0.5 K·s−1, the nuclei develop as cellular structures. With the improvement of CR, the equiaxed dendritic structure gradually forms (as shown in Figure 7b). As CR increases to 50 K·s−1, primary arms become thinner, with developed secondary arms.
Figure 8 shows the variation of the average solute concentration in liquid phase C ¯ l with the solid fraction, and the comparison with the prediction by Scheil [3] and Ueshima [44] models. Both Scheil and Ueshima models assume that the solute mixes uniformly in the liquid phase [3,44]. Ueshima model [44] considers the finite solute diffusion in the solid phase, while Scheil model does not. According to the statistics, the average distance between equiaxed dendrite is 98.8 μm, which is twice the domain size used in Ueshima model. With the proceeding of the solidification, solute enrichment becomes more severe, especially near the final solidification. Meanwhile, C ¯ l increases with the improvement of CR due to the fast solidification and the development of secondary arms, as shown in Figure 7 and Figure 8. When CR is 50 K/s, C ¯ l predicted by the CA-FVM model is similar to the calculation by Ueshima model. However, the present prediction is significantly higher near the final solidification. Additionally, Scheil’s prediction is always higher than that by the CA-FVM model.

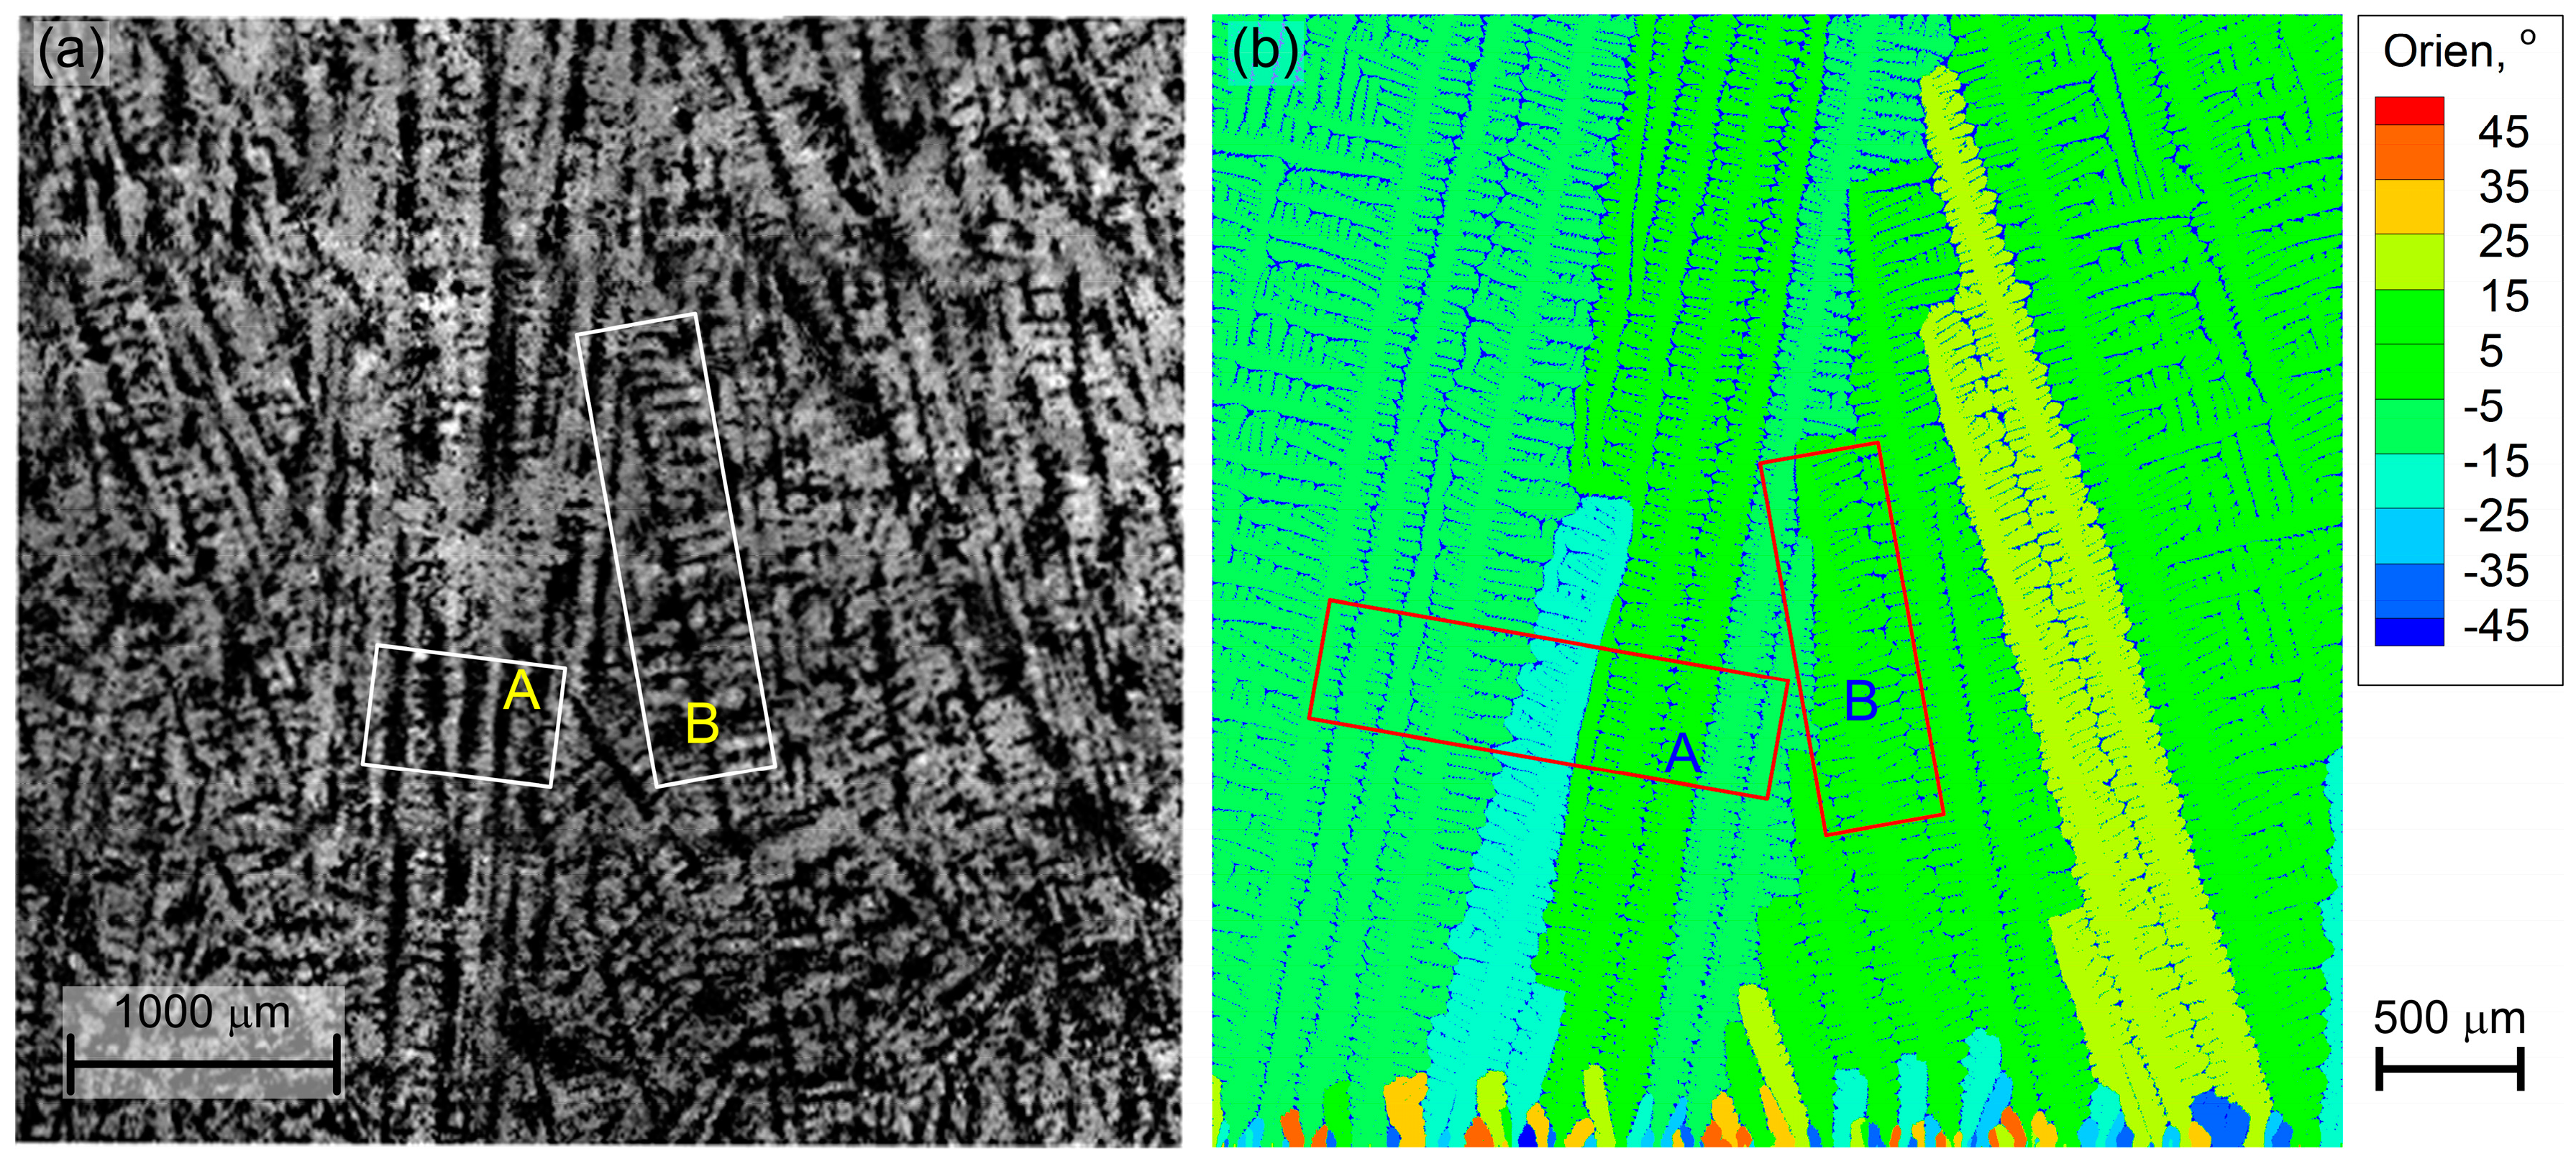
3.4. Constrained Growth of Columnar Dendrite

The present work designs a 4 mm × 4 mm domain, meshes it into 2.5 μm × 2.5 μm cells, sets the initial temperature at Tl, and cools the domain down with the average heat flux according to the mold cooling condition of SWRH82B steel billet [37], accordingly simulating the unidirectional solidification of Fe–0.82C alloy. Initial and boundary conditions for the solute diffusion are the same as those mentioned above. Figure 9 shows the comparison between the predicted columnar dendritic morphology and the experimental observation. Some columnar dendrites win from the initial competition, and are with strong primary branches and well developed secondary, even higher-order arms. Moreover, columnar dendrites with contrary growth directions alternately restrict each other, which is similar to the experimental observation. Additionally, average primary and secondary dendrite arm spacings (λ1 and λ2) in regions A and B are concerned. The predicted λ1 and λ2 are 182.8 μm and 69.8 μm, while the corresponding experimental measurements are 142.2 μm and 101.5 μm, respectively. On the one hand, dendritic arms become ripened with repeated temperature cycles, rising up and going down in secondary and radiation cooling zones during the continuous casting of SWRH82B steel billet. On the other hand, λ1 is determined before being adjusted by tertiary arms in the simulation, while secondary arms are promoted by the higher heat flux and the finer mesh. Additionally, the lack of one-dimensional space also contributes to the numerical deviation.
The present modification still contains several defects, such as low growth velocity, mesh size-dependent tip radius, and mesh anisotropy at some orientations. Meanwhile, future work should be concerned with the depiction of dendrites with orientations close to the mesh. Additionally, a 3D model is necessary to authentically simulate dendritic growth.

4. Conclusions

Based on DCSA, a 2D CA-FVM model is developed to simulate the multi-oriented dendritic growth of Fe–0.82C alloy. The half length of the square diagonal is determined according to the preferential growth orientation, meanwhile an interface geometry factor is introduced. The results show that the present modification can ensure the physical basis of CA approach—that is, the sharp interface—and reasonably keep the growth consistence of dendrites.
The steady tip growth velocities of equiaxed dendrites predicted by CA-FVM model agree with LGK’s results as the melt undercooling varies from 4.0 K to 8.0 K. The predicted average solute concentrations in the liquid phase are always lower than Scheil’s results, but agree with those from the Ueshima model at the initial solidification stage when the cooling rate is 50 K/s. The predicted alternant growth of columnar dendrites with contrary orientations is similar to the experimental observation. Meanwhile, calculated primary and secondary arm spacings agree with the measurements to some extent.

Acknowledgments

This work was financially supported by the National Natural Science Foundation of China (Contract Numbers: U1560208 and 51404062), and the Outstanding Talent Cultivation Project of Liaoning Province (Contract Number: 2014029101).

Author Contributions

Weiling Wang and Sen Luo developed the models, performed the computations, analyzed the results and wrote the paper. Miaoyong Zhu conceived the idea.

Conflicts of Interest

The authors declare no conflict of interest.

References

  1. Presoly, P.; Pierer, R.; Bernhard, C. Identification of defect prone peritectic steel grades by analyzing high-temperature phase transformations. Metall. Mater. Trans. A 2013, 44, 5377–5388. [Google Scholar] [CrossRef]
  2. Ogibayashi, S. Mechanism of centerline segregation in continuous casting and current status of the mathematical model and future subject. Sanyo Tech. Rep. 2012, 19, 2–14. [Google Scholar]
  3. Stefanescu, D.M. Science and Engineering of Casting Solidification, 3rd ed.; Springer International Publishing: Cham, Switzerland, 2015; pp. 1–5. [Google Scholar]
  4. Ji, C.; Luo, S.; Zhu, M.Y. Analysis and application of soft reduction amount for bloom continuous casting process. ISIJ Int. 2014, 54, 504–510. [Google Scholar] [CrossRef]
  5. Zhu, M.F.; Stefanescu, D.M. Virtual front tracking model for the quantitative modeling of dendritic growth in solidification of alloys. Acta Mater. 2007, 55, 1741–1755. [Google Scholar] [CrossRef]
  6. Reuther, K.; Rettenmayr, M. Perspectives for cellular automata for the simulation of dendritic solidification—A review. Comput. Mater. Sci. 2014, 95, 213–220. [Google Scholar] [CrossRef]
  7. Beltran-Sanchez, L.; Stefanescu, D.M. A quantitative dendrite growth model and analysis of stability concepts. Metall. Mater. Trans. A 2004, 35, 2471–2485. [Google Scholar] [CrossRef]
  8. Shin, Y.H.; Hong, C.P. Modeling of dendritic growth with convection using a modified cellular automaton model with a diffuse interface. ISIJ Int. 2002, 42, 359–367. [Google Scholar] [CrossRef]
  9. Zhu, M.F.; Chen, J.; Sun, G.X.; Hong, C.P. Numerical modeling of dendritic growth. Acta Metall. Sin. 2005, 41, 583–587. [Google Scholar]
  10. Zhang, X.F.; Zhao, J.Z. Effect of forced flow on three dimensional dendritic growth of Al-Cu alloys. Acta Metall. Sin. 2012, 48, 615–620. [Google Scholar] [CrossRef]
  11. Yu, J.; Xu, Q.Y.; Cu, K.; Liu, B.C. Numerical simulation of microstructure evolution based on a modified CA method. Acta Metall. Sin. 2007, 43, 731–738. [Google Scholar]
  12. Zhan, X.H.; Wei, Y.H.; Dong, Z.B. Cellular automaton simulation of grain growth with different orientation angles during solidification process. J. Mater. Process. Technol. 2008, 208, 1–8. [Google Scholar] [CrossRef]
  13. Wei, L.; Lin, X.; Wang, M.; Huang, W.D. A cellular automaton model for the solidification of a pure substance. Appl. Phys. A 2010, 103, 123–133. [Google Scholar] [CrossRef]
  14. Wei, L.; Lin, X.; Wang, M.; Huang, W.D. Cellular automaton simulation of the molten pool of laser solid forming process. Acta Phys. Sin. 2015, 64, 018103. [Google Scholar]
  15. Krane, M.J.M.; Johnson, D.R.; Raghavan, S. The development of a cellular automaton-finite volume model for dendritic growth. Appl. Math. Model. 2009, 33, 2234–2247. [Google Scholar] [CrossRef]
  16. Rappaz, M.; Gandin, C.A. Probabilistic modelling of microstructure formation in solidification processes. Acta Metall. Mater. 1993, 41, 345–360. [Google Scholar] [CrossRef]
  17. Gandin, C.A.; Rappaz, M. A 3D cellular automaton algorithm for the prediction of dendritic grain growth. Acta Mater. 1997, 45, 2187–2195. [Google Scholar] [CrossRef]
  18. Rappaz, M. Modeling and characterization of grain structures and defects in solidification. Curr. Opin. Solid State Mat. Sci. 2016, 20, 37–45. [Google Scholar] [CrossRef]
  19. Wang, W.; Lee, P.D.; Mclean, M. A model of solidification microstructures in nickel-based superalloys: Predicting primary dendrite spacing selection. Acta Mater. 2003, 51, 2971–2987. [Google Scholar] [CrossRef]
  20. Dong, H.B.; Lee, P.D. Simulation of the columnar-to-equiaxed transition in directionally solidified Al-Cu alloys. Acta Mater. 2005, 53, 659–668. [Google Scholar] [CrossRef]
  21. Yuan, L.; Lee, P.D.; Djambazov, G.; Pericleous, K. Numerical simulation of the effect of fluid flow on solute distribution and dendritic morphology. Int. J. Cast. Met. Res. 2009, 22, 204–207. [Google Scholar] [CrossRef]
  22. Yuan, L.; Lee, P.D. Dendritic solidification under natural and forced convection in binary alloys: 2D versus 3D simulation. Model. Simul. Mater. Sci. Eng. 2010, 18, 055008. [Google Scholar] [CrossRef]
  23. Yuan, L.; Lee, P.D. A new mechanism for freckle initiation based on microstructural level simulation. Acta Mater. 2012, 60, 4917–4926. [Google Scholar] [CrossRef]
  24. Nakagawa, M.; Natsume, Y.; Ohsasa, K. Dendrite growth model using front tracking technique with new growth algorithm. ISIJ Int. 2006, 46, 909–913. [Google Scholar] [CrossRef]
  25. Yamazaki, M.; Satoh, J.; Ohsasa, K.; Matsuura, K. Numerical model of solidification structure formation in Fe-C alloy with peritectic transformation. ISIJ Int. 2008, 48, 362–367. [Google Scholar] [CrossRef]
  26. Zhao, Y.; Chen, D.F.; Long, M.J.; Arif, T.T.; Qin, R.S. A three-dimensional cellular automata model for dendrite growth with various crystallographic orientations during solidification. Metall. Mater. Trans. B 2014, 45, 719–725. [Google Scholar] [CrossRef]
  27. Yin, H.; Felicelli, S.D. Dendrite growth simulation during solidification in the LENS process. Acta Mater. 2010, 58, 1455–1465. [Google Scholar] [CrossRef]
  28. Yin, H.; Felicelli, S.D.; Wang, L. Simulation of a dendritic microstructure with the lattice Boltzmann and cellular automaton methods. Acta Mater. 2011, 59, 3124–3136. [Google Scholar] [CrossRef]
  29. Yin, H.B.; Felicelli, S.D. A cellular automaton model for dendrite growth in magnesium alloy AZ91. Model. Simul. Mater. Sci. Eng. 2009, 17, 075011. [Google Scholar] [CrossRef]
  30. Chen, R.; Xu, Q.Y.; Liu, B.C. A modified cellular automaton model for the quantitative prediction of equiaxed and columnar dendritic growth. J. Mater. Sci. Technol. 2014, 30, 1311–1320. [Google Scholar] [CrossRef]
  31. Chen, R.; Xu, Q.Y.; Liu, B.C. Cellular automaton simulation of three-dimensional dendrite growth in Al–7Si–Mg ternary aluminum alloys. Comput. Mater. Sci. 2015, 105, 90–100. [Google Scholar] [CrossRef]
  32. Han, R.H.; Dong, W.C.; Lu, S.P.; Li, D.Z.; Li, Y.Y. Modeling of morphological evolution of columnar dendritic grains in the molten pool of gas tungsten arc welding. Comput. Mater. Sci. 2014, 95, 351–361. [Google Scholar] [CrossRef]
  33. Han, R.H.; Lu, S.P.; Dong, W.C.; Li, D.Z.; Li, Y.Y. The morphological evolution of the axial structure and the curved columnar grain in the weld. J. Cryst. Growth 2015, 431, 49–59. [Google Scholar] [CrossRef]
  34. Luo, S.; Zhu, M.Y. A two-dimensional model for the quantitative simulation of the dendritic growth with cellular automaton method. Comput. Mater. Sci. 2013, 71, 10–18. [Google Scholar] [CrossRef]
  35. Tan, W.D.; Bailey, N.S.; Shin, Y.C. A novel integrated model combining cellular automata and phase field methods for microstructure evolution during solidification of multi-component and multi-phase alloys. Comput. Mater. Sci. 2011, 50, 2573–2585. [Google Scholar] [CrossRef]
  36. Tan, W.D.; Wen, S.Y.; Bailey, N.; Shin, Y.C. Multiscale modeling of transport phenomena and dendritic growth in laser cladding processes. Metall. Mater. Trans. B 2011, 42, 1306–1318. [Google Scholar] [CrossRef]
  37. Wang, W.L.; Luo, S.; Zhu, M.Y. Numerical simulation of dendritic growth of continuously cast high carbon steel. Metall. Mater. Trans. A 2015, 46, 396–406. [Google Scholar] [CrossRef]
  38. Wang, W.L.; Luo, S.; Zhu, M.Y. Dendritic growth of high carbon iron-based alloy under constrained melt flow. Comput. Mater. Sci. 2014, 95, 136–148. [Google Scholar] [CrossRef]
  39. Thévoz, P.; Desbiolles, J.L.; Rappaz, M. Modeling of equiaxed microstructure formation in casting. Metall. Trans. A 1989, 20, 311–322. [Google Scholar] [CrossRef]
  40. Lipton, J.; Glicksman, M.E.; Kurz, W. Dendritic growth into undercooled alloy metals. Mater. Sci. Eng. 1984, 65, 57–63. [Google Scholar] [CrossRef]
  41. Luo, S.; Wang, W.L.; Zhu, M.Y. Validation and simulation of cellular automaton model for dendritic growth during the solidification of Fe-C binary alloy with fluid flow. ISIJ Int. 2016, 56, 564–573. [Google Scholar] [CrossRef]
  42. Nastac, L. Analytical modeling of solute redistribution during the initial unsteady unidirectional solidification of binary dilute alloys. J. Cryst. Growth 1998, 193, 271–284. [Google Scholar] [CrossRef]
  43. Reuther, K.; Rettenmayr, M. Simulating dendritic solidification using an anisotropy-free meshless front-tracking method. J. Comput. Phys. 2014, 279, 63–66. [Google Scholar] [CrossRef]
  44. Wang, W.L.; Zhu, M.Y.; Cai, Z.Z.; Luo, S.; Ji, C. Micro-segregation behavior of solute elements in the mushy zone of continuous casting wide-thick slab. Steel Res. Int. 2012, 83, 1152–1162. [Google Scholar] [CrossRef]
Figure 1. Basic concept of decentered square algorithm (DCSA): (a) nucleation; (b) capture of first nearest neighboring cells; and (c) capture of second nearest neighboring cells.
Crystals 06 00147 g001
Figure 2. Average tip growth velocities: (a) ΔT = 5 K and (b) ΔT = 8 K. CA-FVM: cellular automaton-finite volume method.
Crystals 06 00147 g002
Figure 3. Comparison between predicted steady tip growth velocities and Lipton, Glicksman, and Kurz (LGK)’s results [40].
Crystals 06 00147 g003
Figure 4. Interface type: (a) CA-FVM; (b) Luo and Zhu [34]; and (c) 2 Δ x .
Crystals 06 00147 g004
Figure 5. Equiaxed dendritic morphology at ΔT = 9 K and t = 0.6 s, with preferential growth orientations of: (a) 0°; (b) 15°; (c) 30°; and (d) 45°.
Crystals 06 00147 g005
Figure 6. Relative deviations of arm lengths and solid fractions of equiaxed dendrites.
Crystals 06 00147 g006
Figure 7. Equiaxed dendritic morphology of Fe–0.82C alloy at fs = 0.5 when cooling rates are (a) 0.5 K·s−1; (b) 10 K·s−1; and (c) 50 K·s−1.
Crystals 06 00147 g007
Figure 8. Average solute concentration in liquid phase during the solidification of multi-equiaxed dendrites. CR: cooling rate.
Crystals 06 00147 g008
Figure 9. Columnar dendritic morphology of SWRH82B steel billet: (a) experimental observation [37] (Reproduced with permission from Weiling Wang, Sen Luo, Miaoyong Zhu, Metallurgical and Materials Transactions A; published by Springer, 2015); and (b) present prediction.
Crystals 06 00147 g009
Table 1. Physical properties of Fe–0.82C alloy [37,38].
Physical PropertySymbolUnitValue
Melt temperature of pure ironTmK1809.15
Liquidus line slope of Fe–C alloymlK·wt%−1−78.0
Thermal conductivityλW·m−1·K−133.0
Density of solid phaseρskg·m−37400
Density of liquid phaseρlkg·m−37020
Specific heat capacity of solid phasecp,sJ·kg−1·K−1648
Specific heat capacity of liquid phasecp,lJ·kg−1·K−1824
Specific heat capacity at mushy statecp,mJ·kg−1·K−1770
Solidification latent heatLJ·kg−127,200
Diffusion coefficient in solid phaseDscm2·s−10.0761exp(−16,185.2/T)
Diffusion coefficient in liquid phaseDlcm2·s−10.0767exp(−12,749.6/T)
Partition coefficientk0--0.34
Anisotropy parameterε--0.04
Gibbs–Thomson coefficientΓK·m1.9 × 10−7
Maximum nucleus densitynmaxm−116,736
Standard deviation of nucleation undercoolingΔTσK0.1
Average nucleation undercoolingΔTnK1.0

