1. Introduction
Intermetallic phases comprise a realm of staggering structural diversity. One of the best compasses for navigating this realm is the grouping of compounds according to the electronegativity differences (Δχ) of their component elements. At one extreme are the Zintl phases, whose large Δχ values allow for the conceptual division of their structures into cationic and anionic components, which individually satisfy molecular bonding schemes [
1,
2]. At the other extreme are the Hume-Rothery phases in which the low Δχ and χ values result in the vanishing of clear charge assignments or localized bonds [
3]. The divide between the Zintl and Hume-Rothery has inspired the synthetic probing of their border for new phases with unique bonding and structures [
4,
5,
6,
7,
8,
9,
10,
11,
12,
13,
14,
15,
16,
17]. A rich structural chemistry of polar intermetallic phases has resulted, which offers opportunities to chart how the close-shell electron configurations of the Zintl phases map to the delocalized bonding of the Hume-Rothery phases. In this article, we will approach this goal with an in-depth DFT-calibrated Hückel study of the recently reported compound, Ca
10Pt
7Si
3 (
Figure 1) [
18], for which a preliminary bonding analysis required the introduction of a large number of resonance structures.
Ca
10Pt
7Si
3 is one of an emerging series of compounds in which the combination of Pt with electropositive elements, such as the alkali metals or alkaline earth metals, leads to Pt with formally negative oxidation states [
19,
20,
21,
22,
23,
24,
25,
26]. From the relative electronegativities of Ca, Pt and Si (1.0, 2.28 and 1.90, respectively), Ca would be expected to transfer electrons to the Pt and Si atoms in the structure. Applying the Zintl concept would take this to the extreme of the Ca losing both of its valence electrons, leading to the ionic scheme, (Ca
2+)
10(Pt
7Si
3)
2−. The Pt/Si sublattice has then a large anionic charge that nearly guarantees a negative oxidation state on the Pt. Even if we fill the octets of the Si atoms to Si
4−, we are still left with eight extra electrons for the seven Pt atoms per formula unit. How is this electron-rich character expressed in the crystal structure of Ca
10Pt
7Si
3?
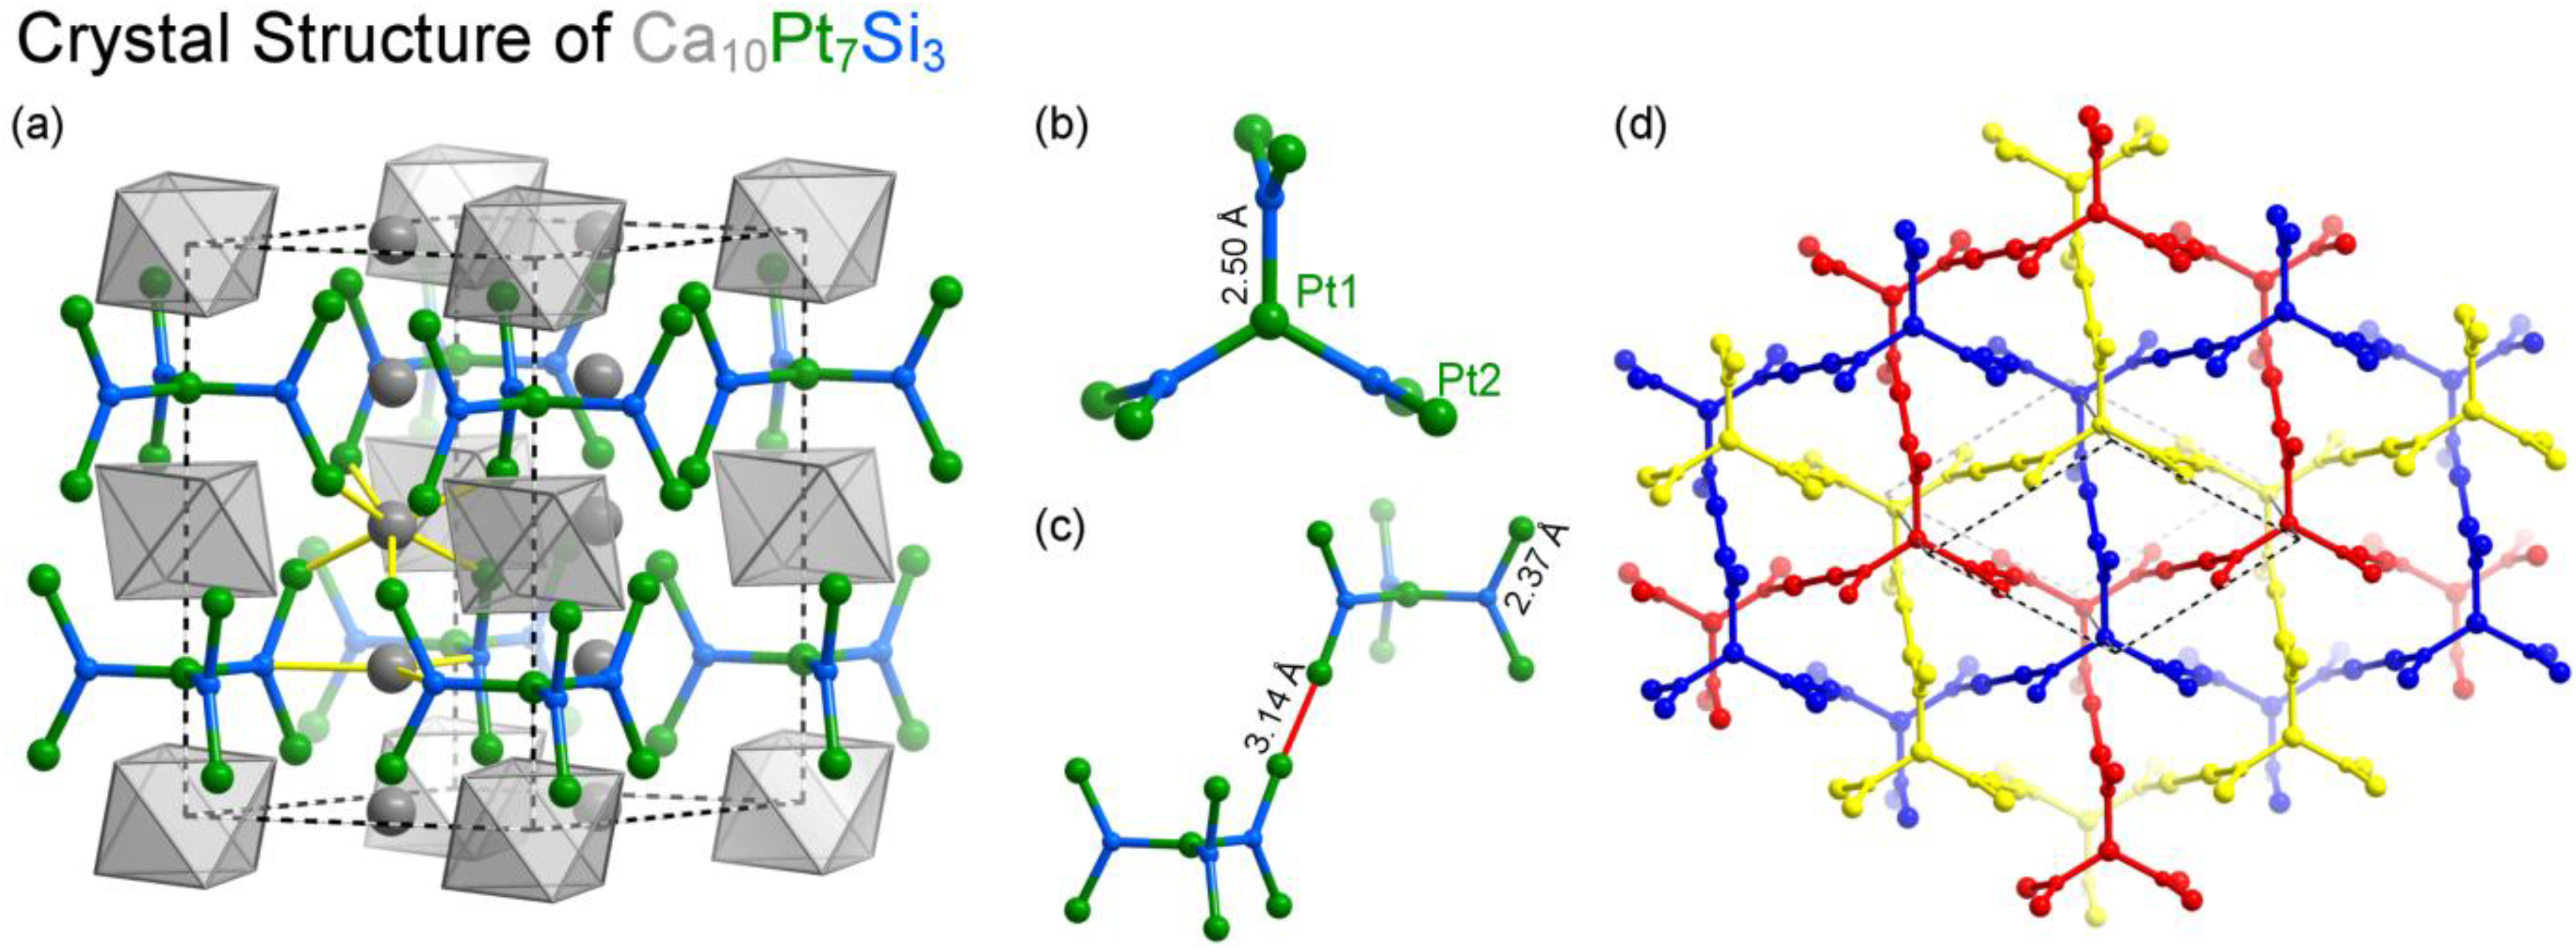
Figure 1.
The crystal structure of Ca10Pt7Si3: (a) the full unit cell; (b) the Pt7Si3 trefoil subunit; (c) an example of the Pt–Pt contacts occurring between the Pt7Si3 units; (d) interpenetrating polyanionic networks arising from Pt–Pt contacts between Pt7Si3 units.
Figure 1.
The crystal structure of Ca10Pt7Si3: (a) the full unit cell; (b) the Pt7Si3 trefoil subunit; (c) an example of the Pt–Pt contacts occurring between the Pt7Si3 units; (d) interpenetrating polyanionic networks arising from Pt–Pt contacts between Pt7Si3 units.
The most prominent structural motif in the structure is the Pt
7Si
3 trefoil cluster (
Figure 1b), in which three trigonal planar Si@Pt
3 units are linked in the triangular paddle wheel pattern through a shared Pt atom. The layers of Pt
7Si
3 clusters stack directly on top of each other, in a manner reminiscent of a primitive hexagonal lattice, but with an important difference: neighboring clusters along
c are rotated by 60° relative to each other about the stacking axis, so that the six outer Pt atoms of each Pt
7Si
3 unit make a close contact (3.14 Å;
Figure 1c) with a counterpart in a neighboring layer. When taking these Pt–Pt contacts into account, the Pt–Si sublattice of the structure traces out three interpenetrated 3D frameworks (
Figure 1d). The Ca atoms lie in the remaining space. Between each pair of trefoil units stacked along
c, six Ca atoms reside at the corners of an empty octahedron (gray polyhedra in
Figure 1a). Additional Ca atoms (gray spheres) occur individually in the hollows between the trefoils.
Over the course of this article, we will see that the electronic structure of this compound can largely be brought back under the Zintl concept with the recognition of a multi-center interaction isolobal to a Pt–Pt two-center two-electron bond, but involving substantial support from Ca orbitals. The resulting picture illustrates how the isolobal analogy [
27] can serve to extend the Zintl concept deeper into the range of polar intermetallics.
3. Orientation through DOS Curves and Valence Electron Density
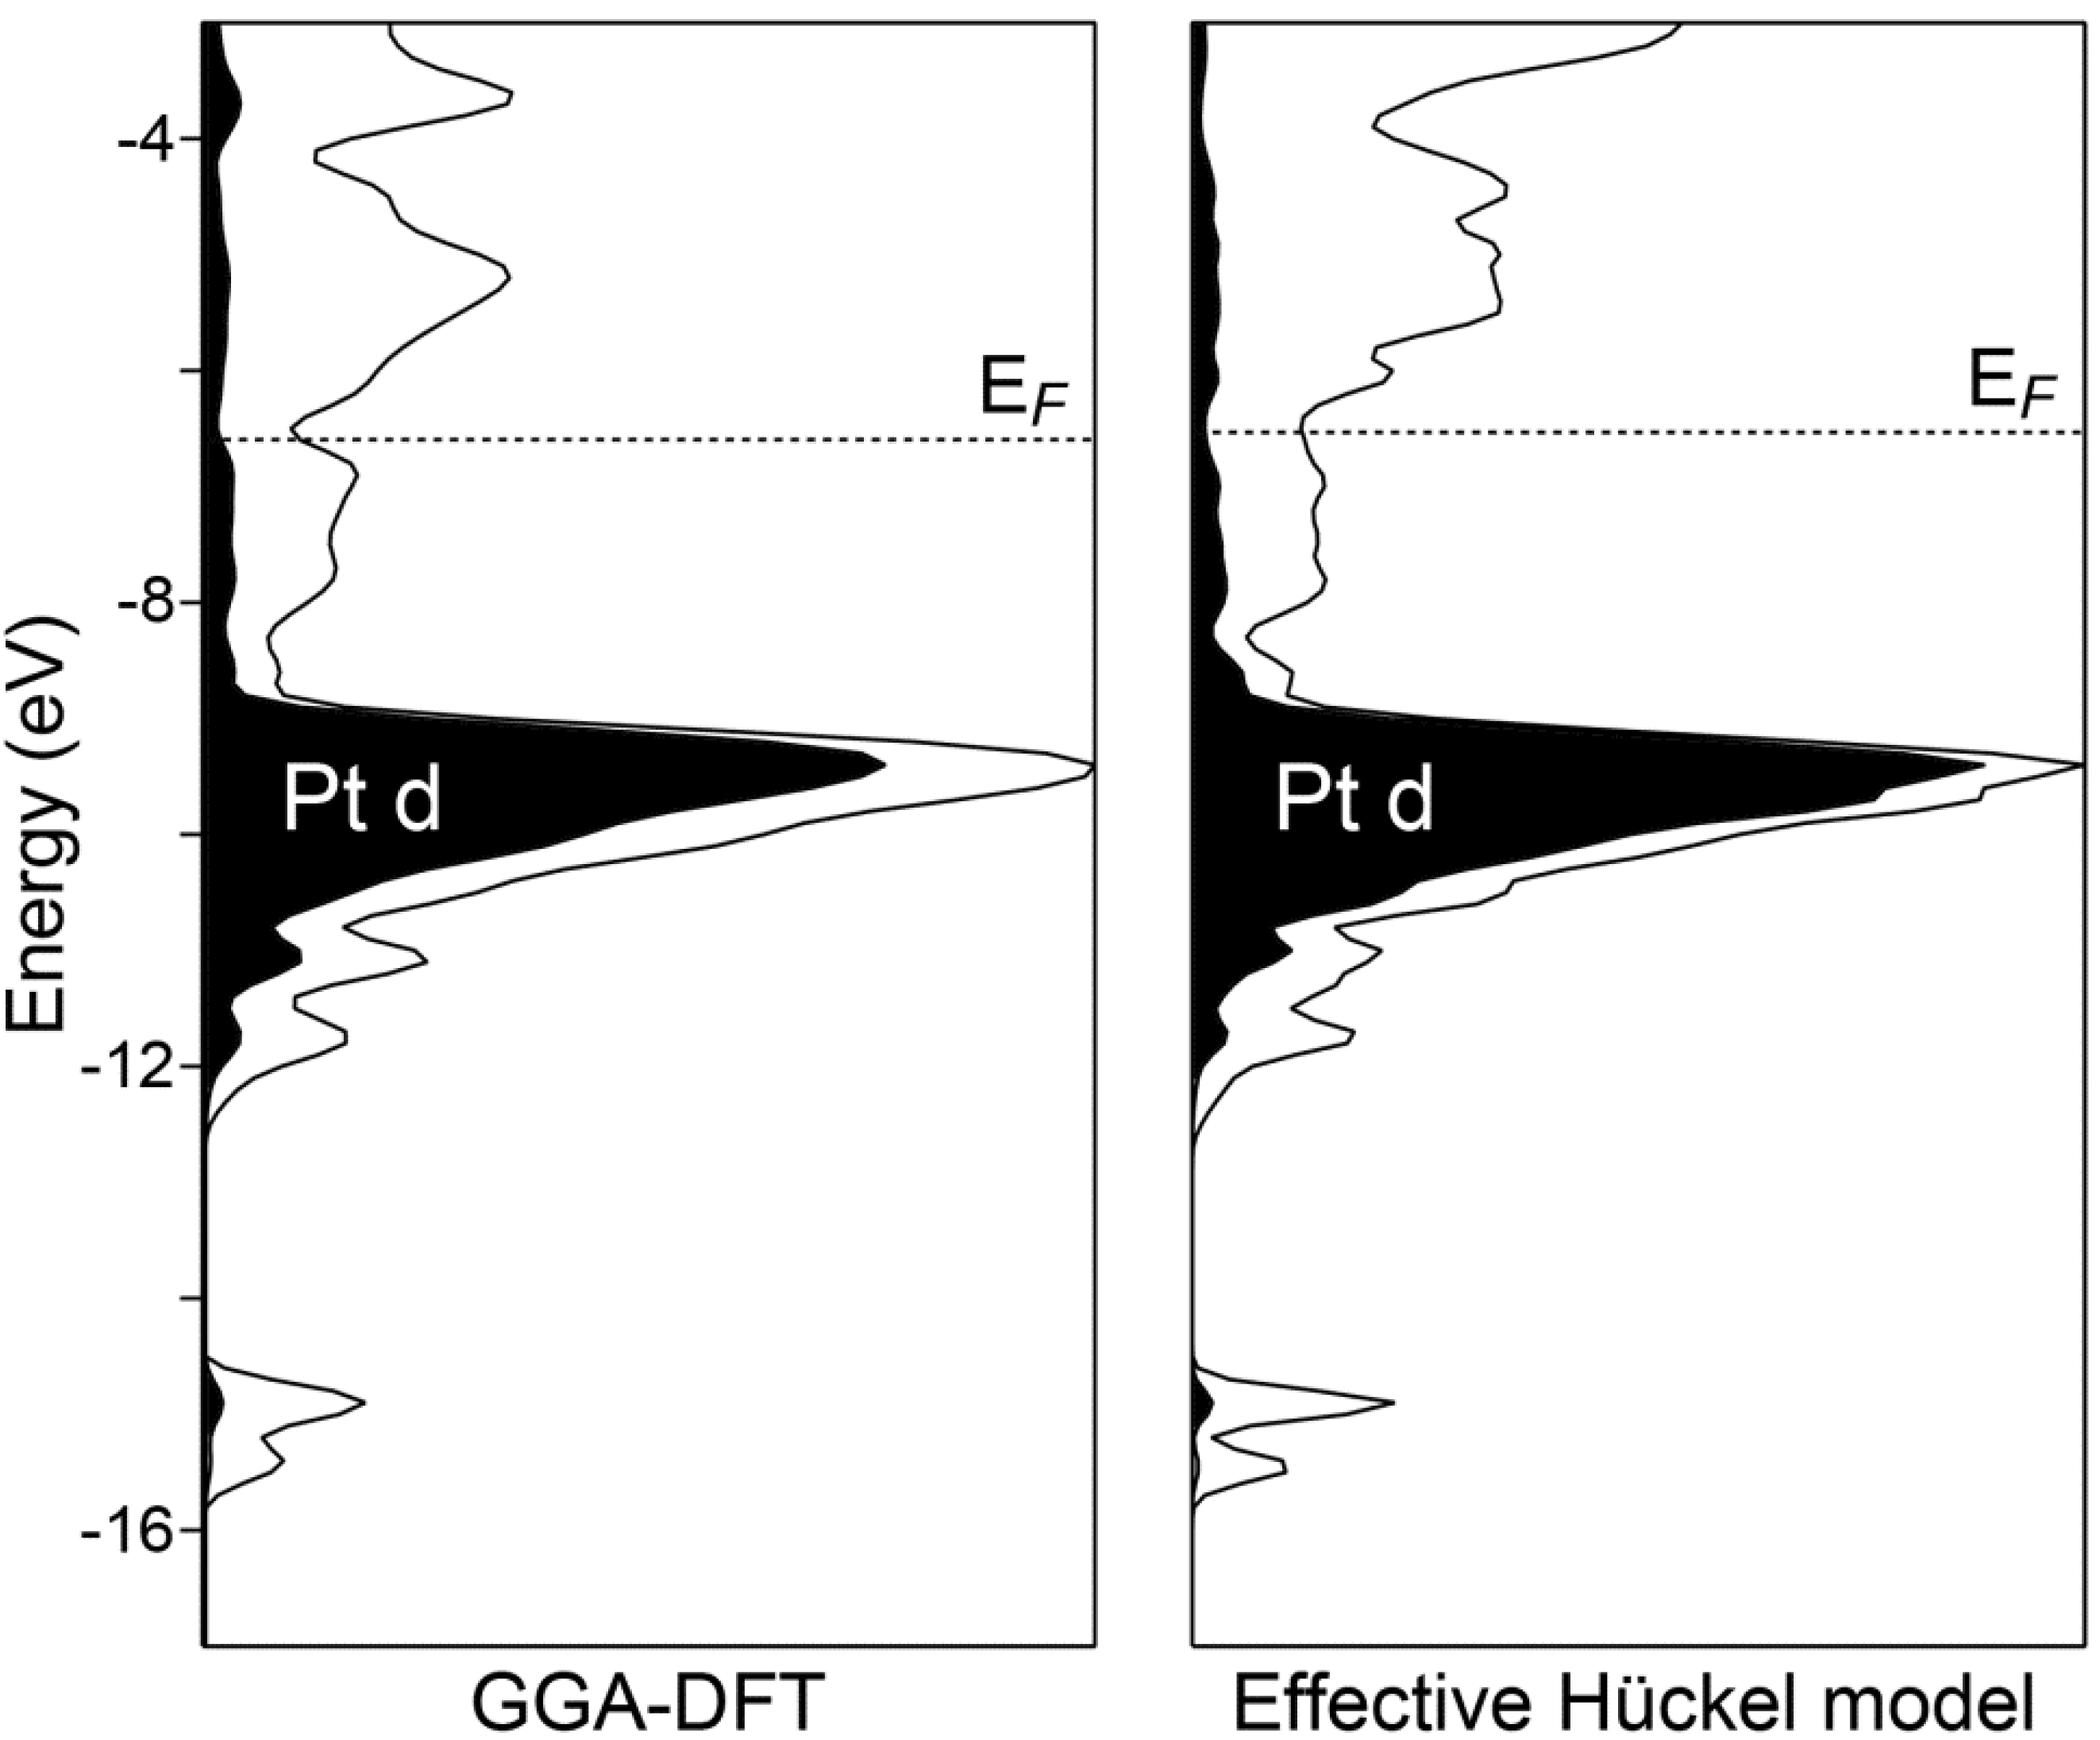
The electronic density of states (DOS) distribution calculated for Ca
10Pt
7Si
3 illustrates several points that help orient our discussion of the bonding in this compound. In the left panel of
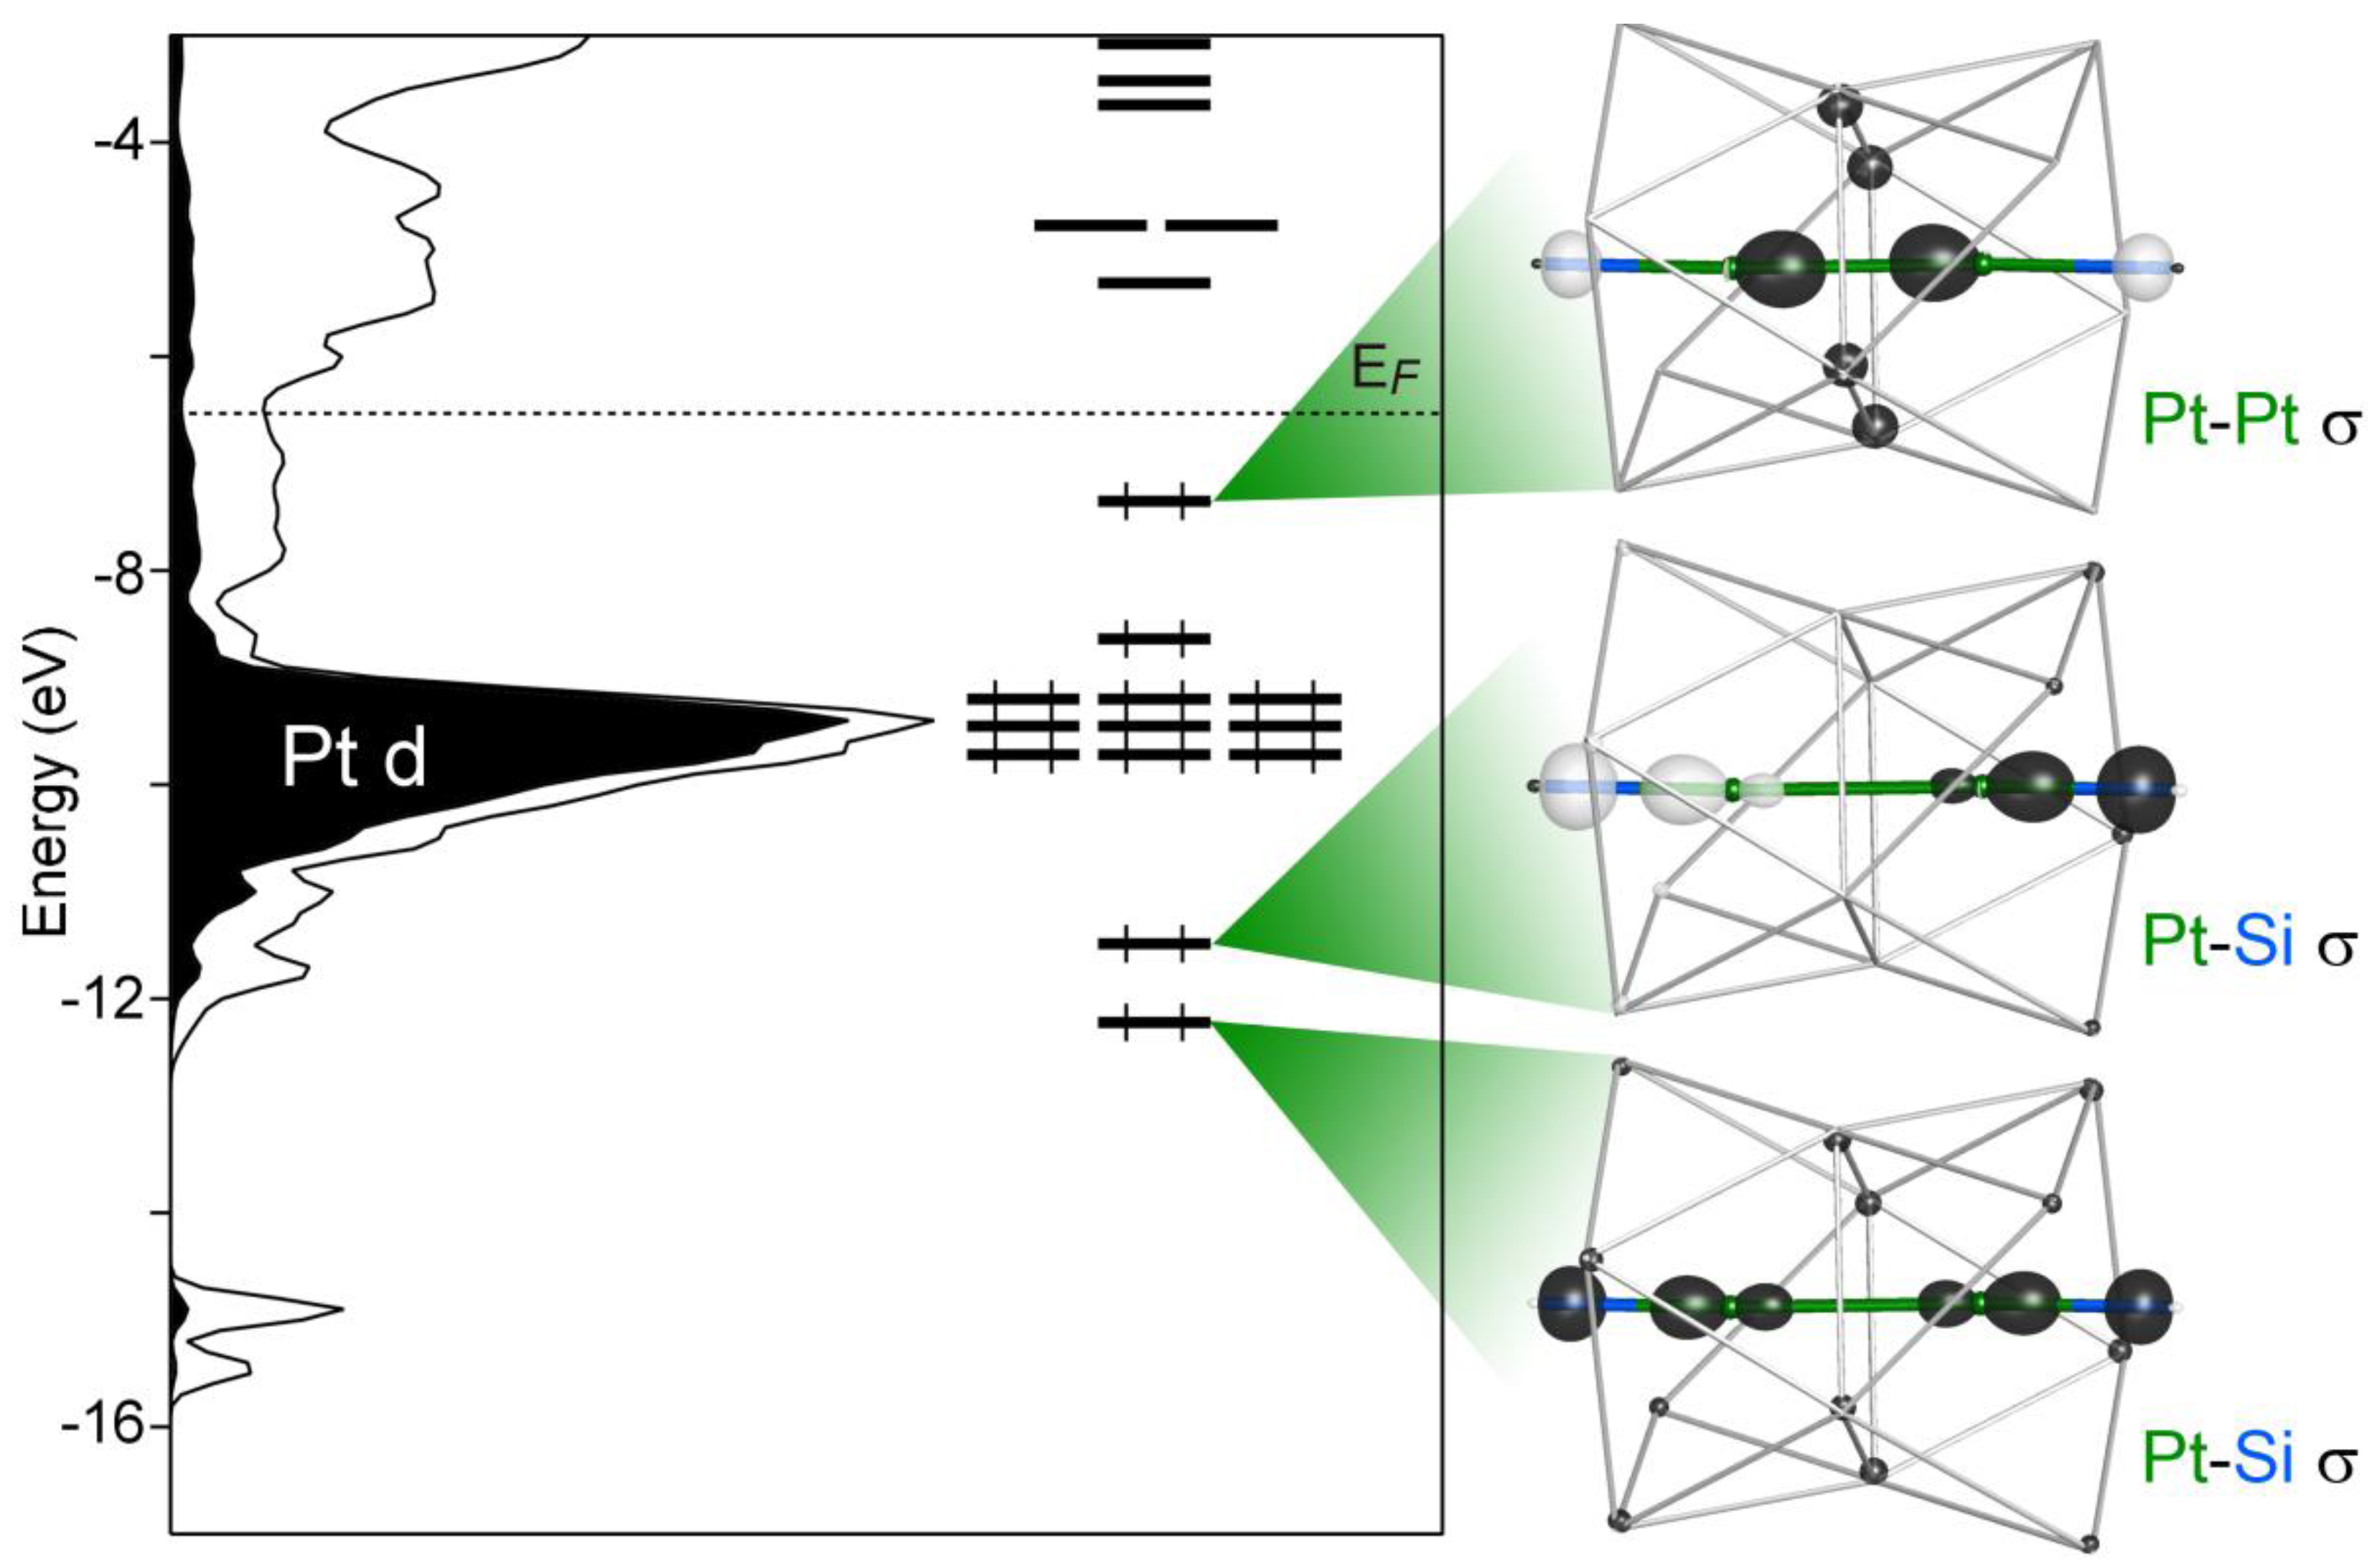
Figure 2, we show the DOS curve obtained from GGA-DFT calculations. The most prominent feature is a narrow peak centered just above −10 eV. A comparison of this peak with the Pt d projected DOS (shaded) identifies this as the Pt 5d levels. The Fermi energy (
EF) lies several eV above this peak, indicating that the bands based on the Pt 5d orbitals are filled. This is consistent with the expectation of anionic character on the Pt atoms. A small pseudogap is evident at the Femi energy, which is suggestive of an electronic contribution to the structure’s stability. The presence of the pseudogap, however small, is an encouraging sign in the search for a Zintl-like description of the bonding in this compound.
Figure 2.
The electronic density of states (DOS) distributions of Ca10Pt7Si3 calculated with GGA-DFT and a DFT-calibrated Hückel model. The DOS curves have been treated with Gaussian broadening to make their general features most apparent.
Figure 2.
The electronic density of states (DOS) distributions of Ca10Pt7Si3 calculated with GGA-DFT and a DFT-calibrated Hückel model. The DOS curves have been treated with Gaussian broadening to make their general features most apparent.
Clues to origins of this DOS pseudogap can be found by looking at the valence electron density distribution for the compound obtained from our DFT calculation. Visualizing isosurfaces of this distribution show that the valence electrons are heavily concentrated on the Pt–Si sublattice of the structure. Little electron density is found associated with the Ca, as is consistent with the view of these atoms as essentially 2+ cations.
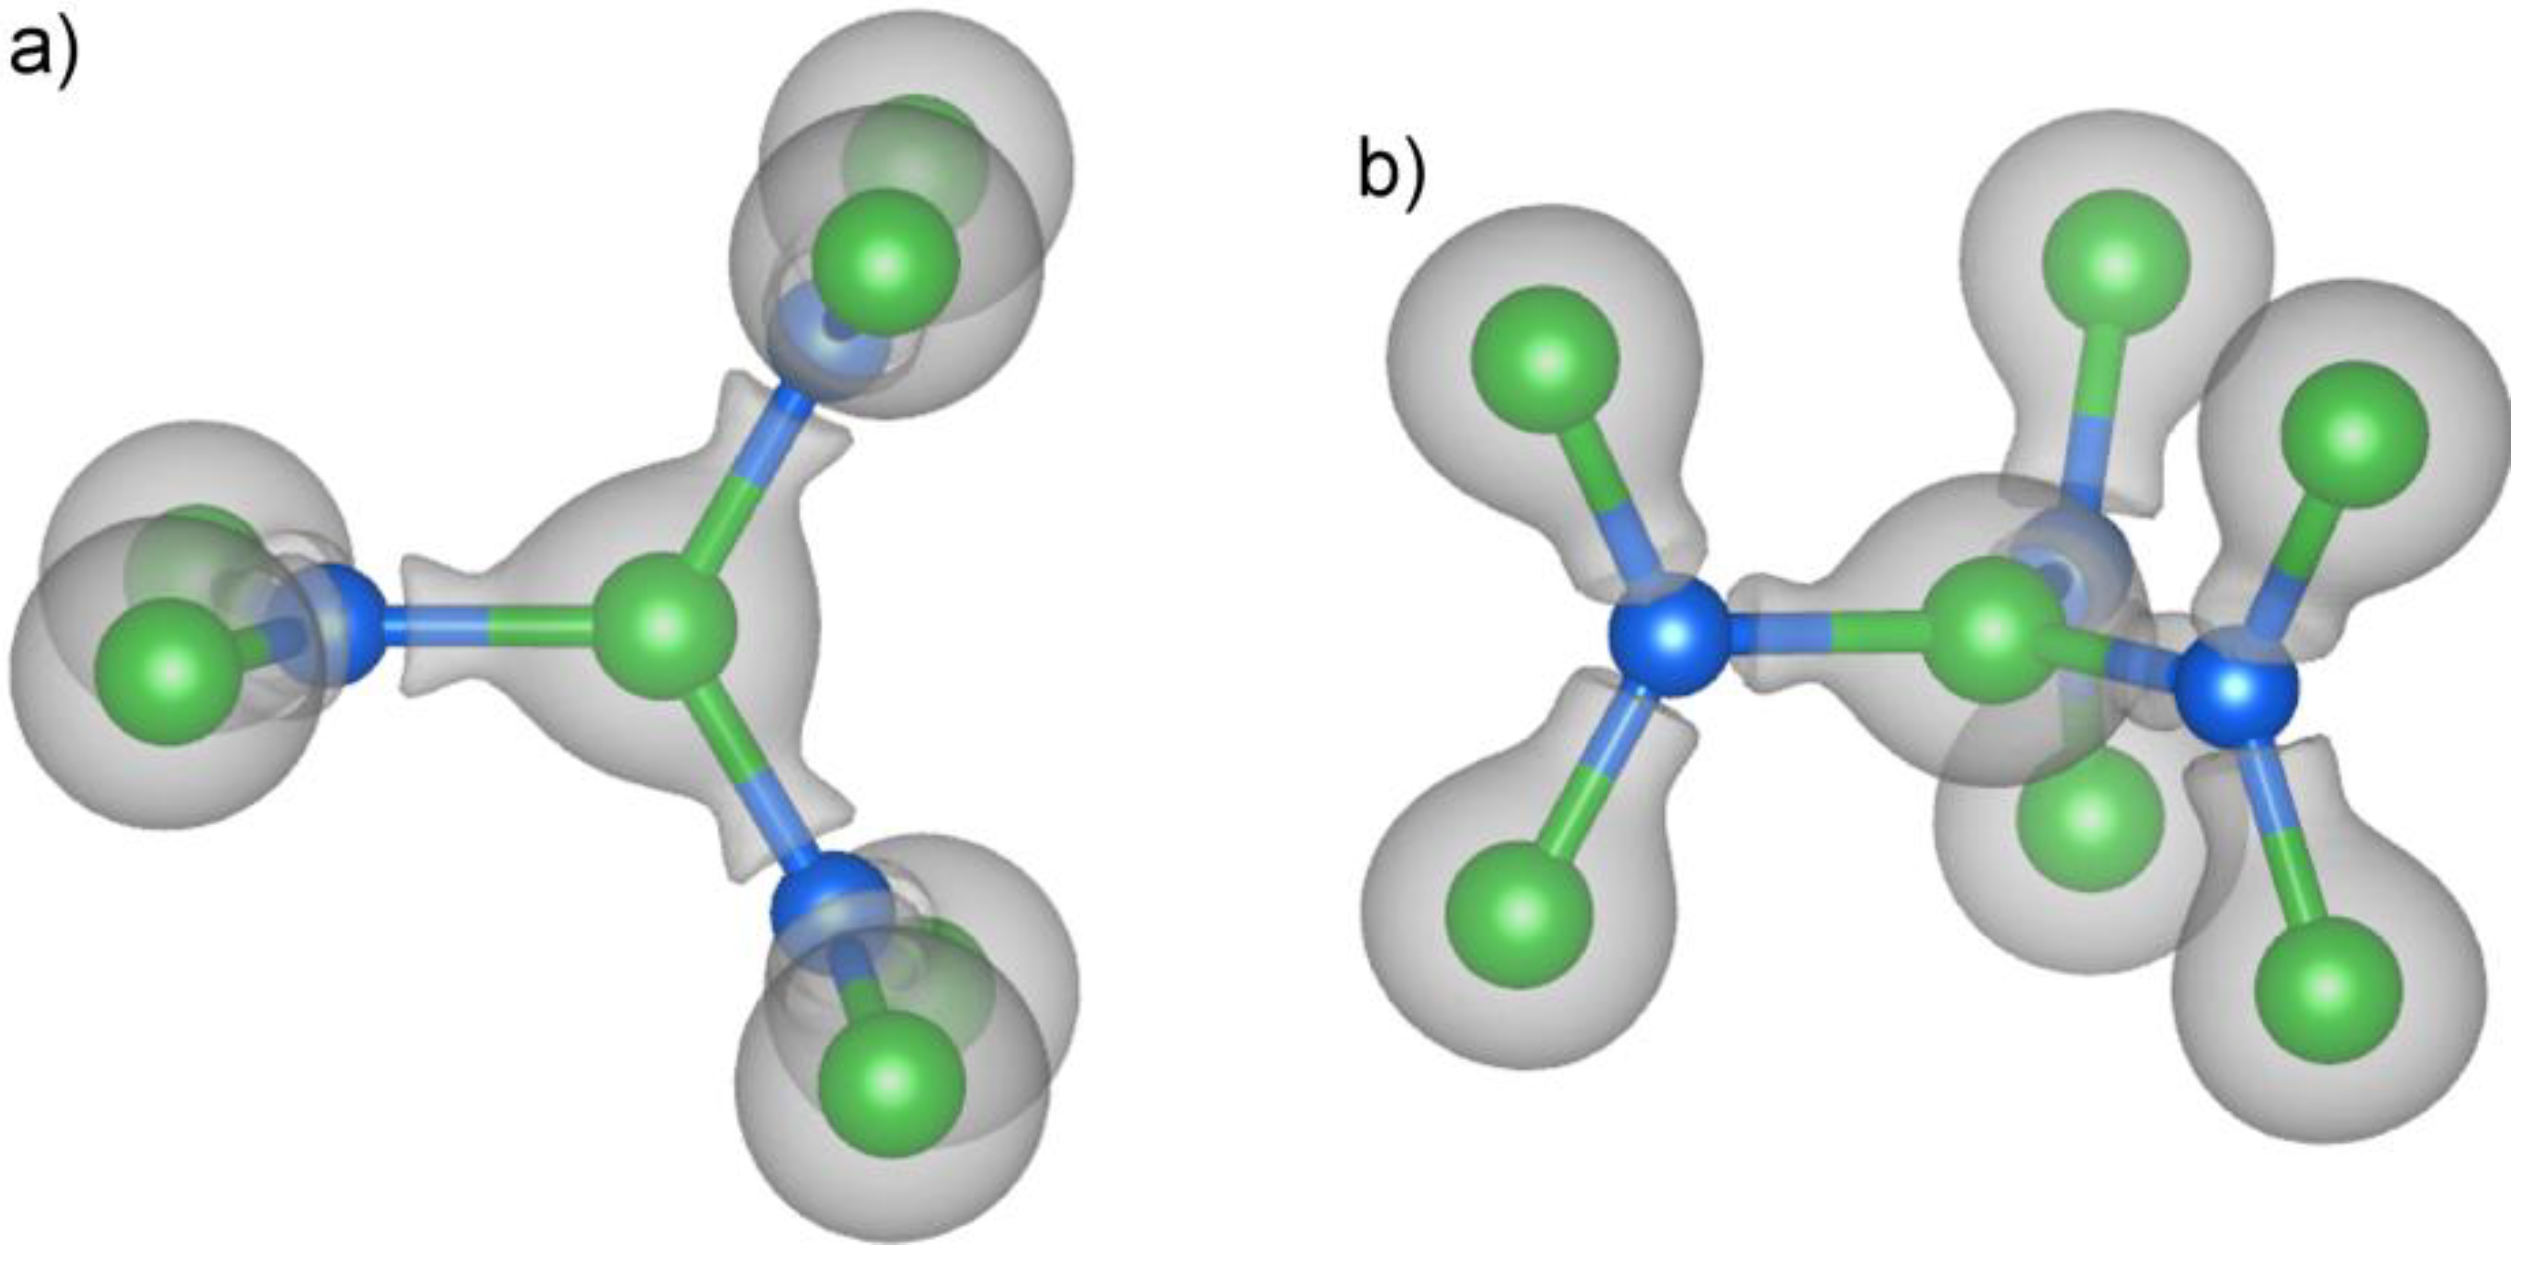
The isosurfaces also reaffirm the importance of the Pt
7Si
3 trefoil unit as a building block of the structure. In
Figure 3, we show two views of this unit overlaid with an isosurface of the electron density. The Pt atoms (green) appear here inside large, nearly spherical volumes enclosed by the surface. The size of these volumes reflects the presence of the highly concentrated Pt 5d electrons. Deviations from the nearly spherical symmetry are most evident along the Pt–Si contacts, where the Pt surfaces merge with protrusions from the Si atoms.
Figure 3.
The valence electron density isosurface around the Pt7Si3 trefoil subunit, viewed both (a) perpendicular to c and (b) along c. The triangular distribution of peaks emanating from each Si atom is suggestive of sp2 hybridization of the Si. Isosurface level: 0.4 electrons/Å3.
Figure 3.
The valence electron density isosurface around the Pt7Si3 trefoil subunit, viewed both (a) perpendicular to c and (b) along c. The triangular distribution of peaks emanating from each Si atom is suggestive of sp2 hybridization of the Si. Isosurface level: 0.4 electrons/Å3.
At this isosurface level, the Si atoms show no appreciable electron density on their nuclear positions. Instead, the electrons are concentrated into lobes directed at the three Pt atoms arranged around the Si atoms in trigonal planar fashion. The triangular distribution around the Si atoms is reminiscent of sp2 hybridization, in which every Si atom interacts with each of its Pt neighbors through an sp2 hybrid orbital. We could then envision the central Pt atom of the trefoil unit as being coordinated by three Si sp2 σ orbitals in a trigonal planar fashion.
4. Bonding at the Pt1 Site: sp2 Hybridization
As has been demonstrated for several transition metal-Si-Al phases [
35,
36], the bonding in such arrangements can be explored through molecular orbital (MO) models using DFT-calibrated Hückel calculations (other applications and advantages of DFT-calibrated Hückel models are discussed in [
33]). To develop such a MO scheme, we used the GGA-DFT electronic structure as the basis for the parameterization of a best-fit Hückel model (see the Computational Procedures section). The resulting DOS curve is presented alongside its DFT counterpart at the right of
Figure 2. As we described above, this model closely reproduces the band energies of the DFT electronic structure. The pair of DOS curves in
Figure 2 demonstrates that the model also captures essential features of the distribution of states: the peak of Pt d states at
ca. −9.5 eV, as well as the placement of the
EF well above the Pt d levels in a shallow DOS minimum. The DFT-calibrated Hückel model can thus be considered a successful translation of the DFT band structure into a scheme of orbital interactions.
With this model in hand, we can now create bonding schemes for the Si atoms interaction with the Pt. For the trigonal planar Pt1 site, we consider how the Pt atom’s 5d, 6s and 6p orbitals will be affected by interactions with the orbitals of the surrounding atoms. This coordination environment includes the three Si atoms mentioned above, as well as a trigonal prism of Ca atoms, making the full coordination polyhedron a tricapped trigonal prism. At each Si atom, we place an sp2 hybrid orbital pointing toward the Pt center. The appropriate treatment for the Ca atoms is less straightforward, but, fortunately, is not crucial to the overall outcome of the bonding analysis. For the purposes of this discussion, we have approximated the contribution of the Ca to the bonding here by placing on them sp2 hybrid orbitals pointing toward the Pt atom.
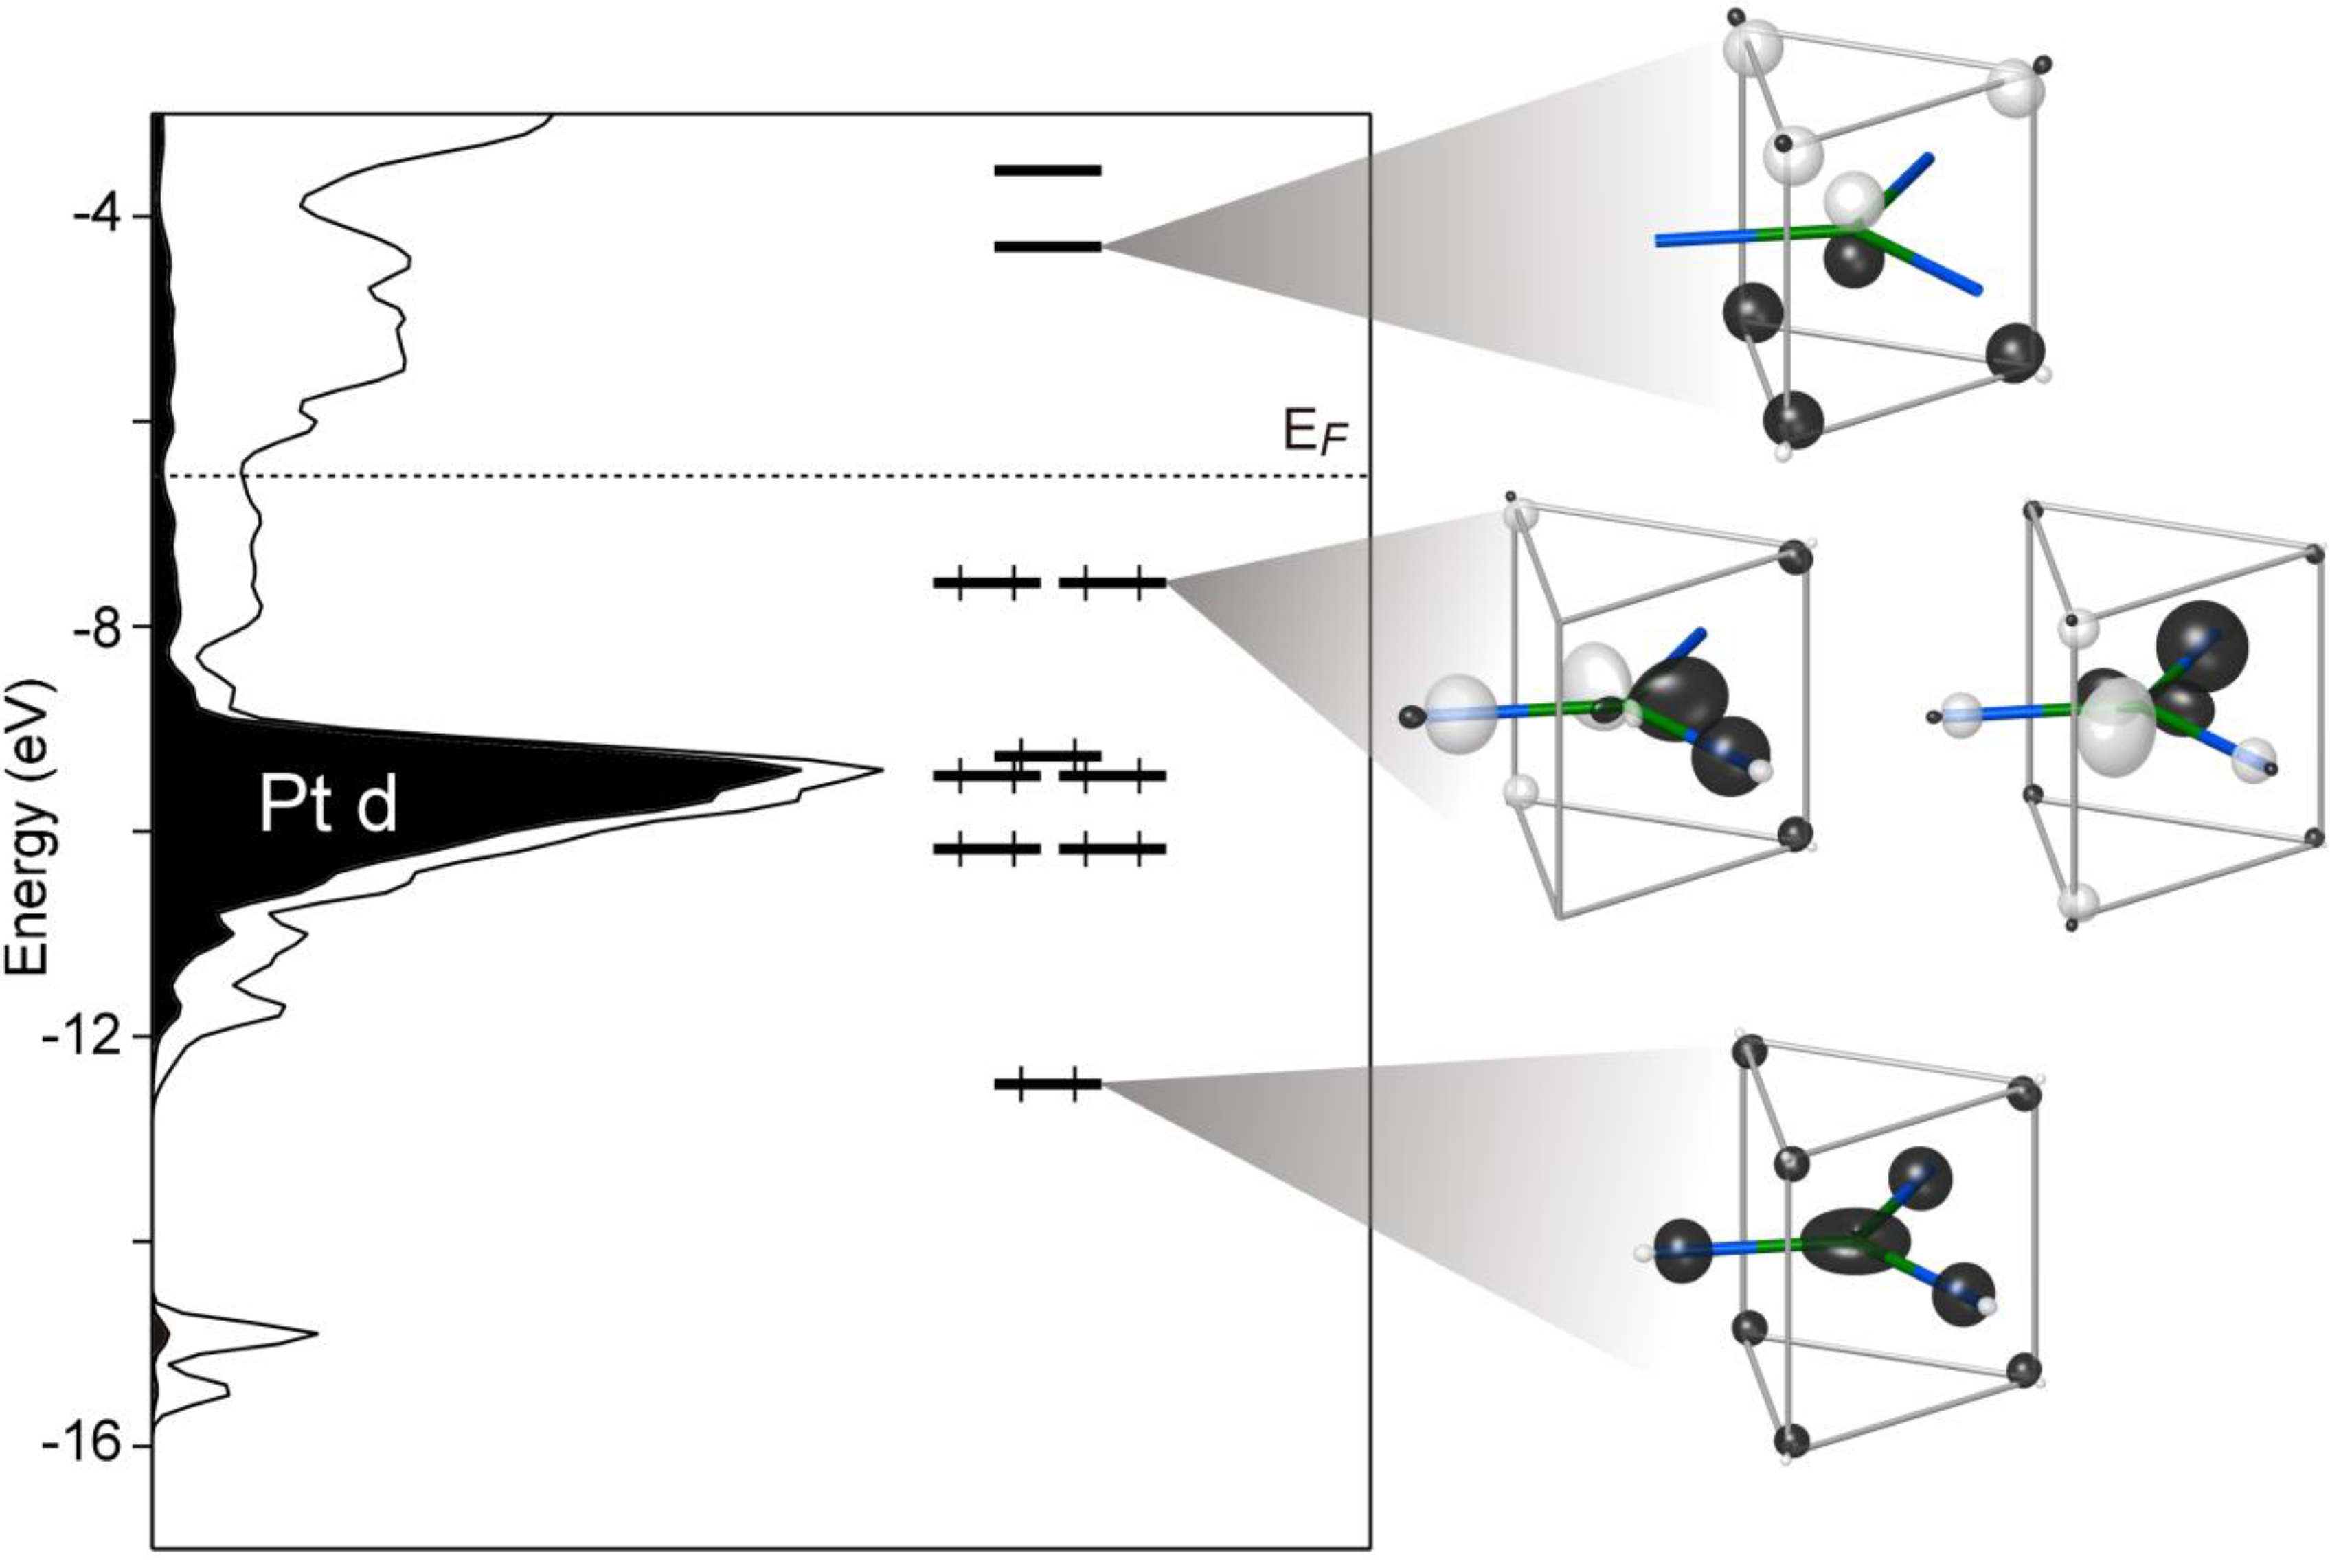
The MO diagram resulting from the interactions between these orbitals is drawn alongside the Ca
10Pt
7Si
3 Hückel DOS curve in
Figure 4. Eight MOs lie below the Ca
10Pt
7Si
3 EF, for an electron count of 16 for the Pt. These orbitals are followed by a sizable energy gap of about 3 eV. The states above and below this gap straddle the shallow pseudogap at the full compound’s
EF. This correspondence hints that the contribution to the pseudogap from this portion of the structure arises from a special stability of the 16 electron configuration on the Pt atom.
Figure 4.
A molecular orbital (MO) interaction diagram showing the interaction of a Pt1 atom with σ-orbitals on its neighboring Ca and Si atoms. The DFT-calibrated Hückel DOS distribution is plotted alongside the MO diagram for comparison.
Figure 4.
A molecular orbital (MO) interaction diagram showing the interaction of a Pt1 atom with σ-orbitals on its neighboring Ca and Si atoms. The DFT-calibrated Hückel DOS distribution is plotted alongside the MO diagram for comparison.
Comparing the distribution of orbitals in the MO diagram with other features of the DOS curve can help us determine why this electron count is so favorable. Of the eight orbitals below the EF, five coincide closely with the Pt 5d peak in the DOS distribution. Not surprisingly, these orbitals are mainly composed of the Pt 5d, and their occupation amounts to the filling of the 5d subshell of the Pt.
The remaining three orbitals (
Figure 4, right) have more significant contributions from the Pt 6s or 6p. The lowest energy orbital at
ca. −12.5 eV exhibits a saucer shaped function on the Pt atom, which is constructed from the superposition of a Pt 6s and 5d
z2 orbital, such that constructive interference occurs around the d
z2 orbital’s torus (ψ
1 in
Figure 5). Each of the Si atoms contributes to this orbital in a bonding fashion, along with the Ca atoms to a lesser degree. Overall, this orbital represents the totally symmetric, node-free bonding function present at the bottom of most MO diagrams.
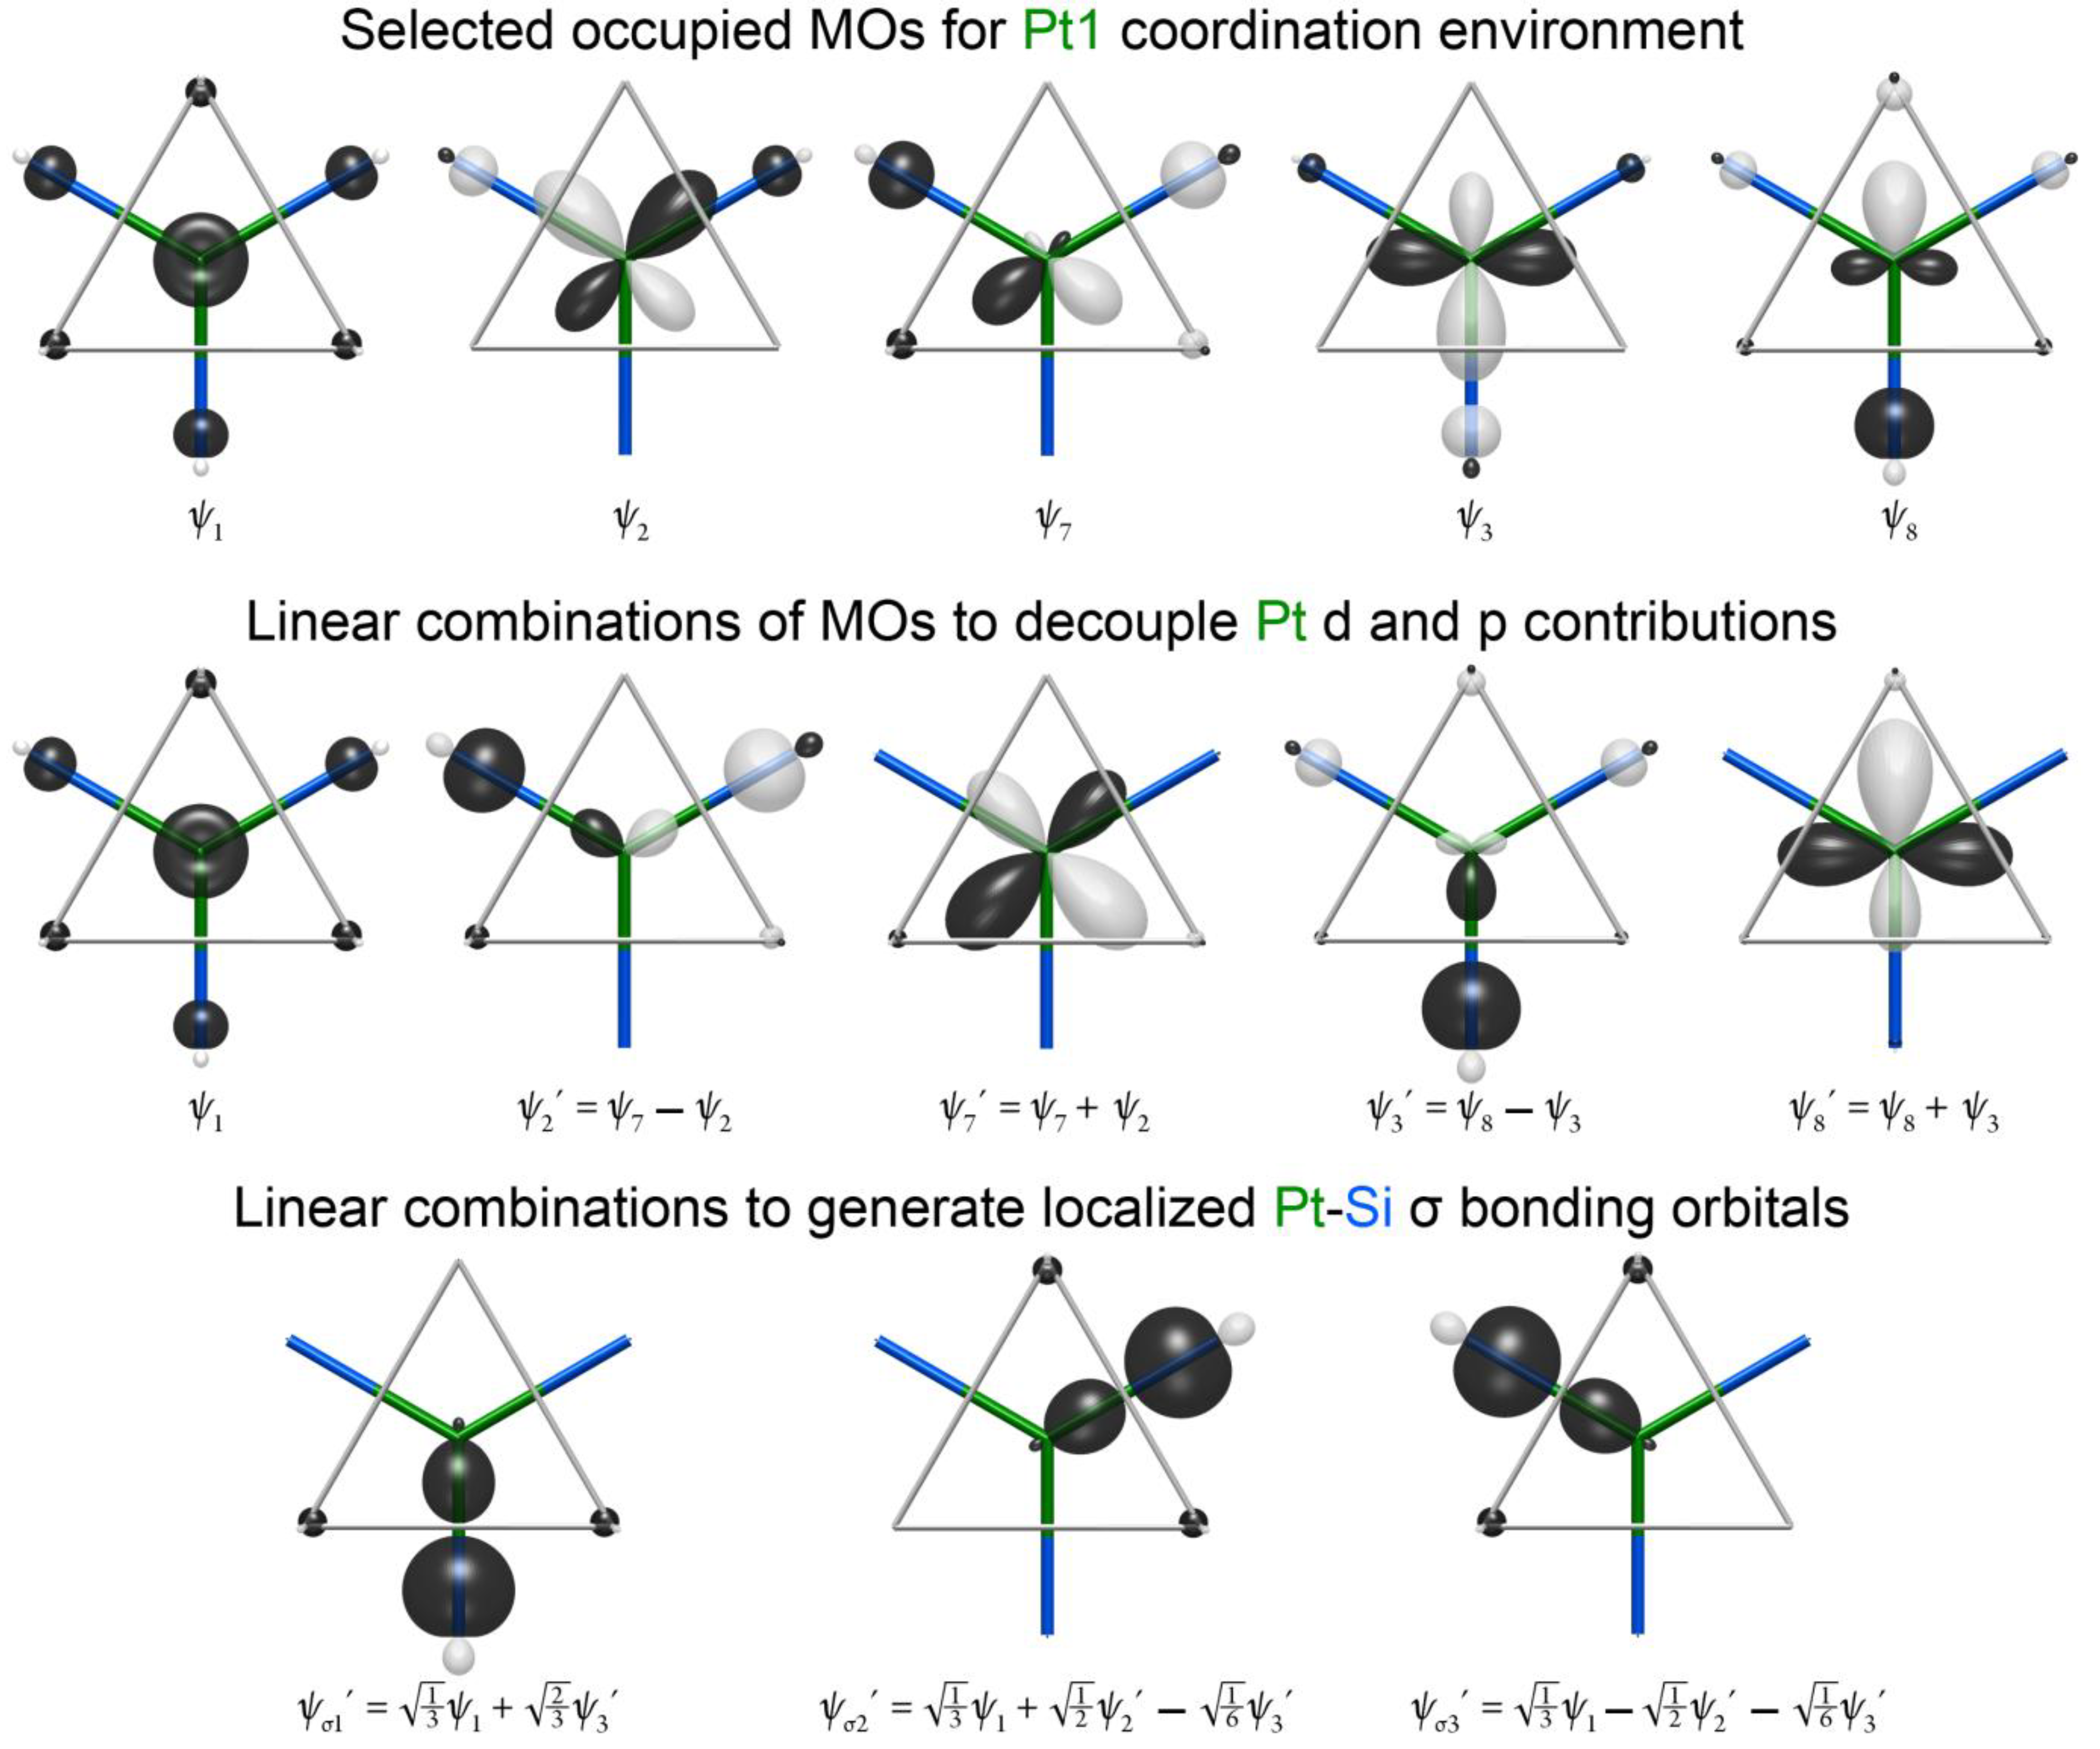
The shapes of the higher energy HOMO orbitals are more complex. The key to interpreting these orbitals is to recognize that they are based on a combination of Pt 5d and Pt 6p character. The relative phases of these Pt-centered atomic orbitals leads to their constructive interference away from the Pt–Si contacts, as is seen in more detail at the top of
Figure 5 (ψ
7, ψ
8). This hybridization makes the orbital essentially Pt–Si nonbonding. The presence of these intermediate energy nonbonding orbitals hints at the existence of corresponding bonding functions, in which the Pt 5d and 6p combine with the opposite relative phases. These are indeed found in the lower energy MOs 2 and 3 (ψ
2, ψ
3 in
Figure 5). Altogether, this makes five MOs that are concentrated in the plane of the fragment: ψ
1, ψ
2, ψ
3, ψ
7 and ψ
8.
A familiar picture for the bonding here can be obtained by taking linear combinations of these MOs to obtain more localized functions. We begin in the middle of
Figure 5 by decoupling the Pt 5d and 6p in orbitals of ψ
2, ψ
3, ψ
7 and ψ
8 by taking sums and differences of the functions with the same symmetry properties. Adding and subtracting ψ
2 and ψ
7 resolves the pair of orbitals into a bonding function based on a Pt 6p orbital (ψ
2′) and a non-bonding Pt 5d orbital (ψ
7′). Similar results are obtained for ψ
3 and ψ
8, leading to the bonding ψ
3′ and nonbonding ψ
8′ function.
Figure 5.
The generation of localized Pt1–Si bonding orbitals from linear combinations of the occupied MOs in
Figure 4.
Figure 5.
The generation of localized Pt1–Si bonding orbitals from linear combinations of the occupied MOs in
Figure 4.
The triad of functions, ψ
1, ψ
2′ and ψ
3′, bear a close relationship to the symmetry adapted linear combinations arising from the group theoretical reduction of three σ bonds arranged in a trigonal planar geometry [
37]. In fact, by taking linear combinations of these functions, three localized bonding orbitals, one for each of the Pt–Si contacts of this fragment, can be obtained (ψ
σ1′, ψ
σ2′ and ψ
σ3′ in
Figure 5). In essence, then, the five MOs that lie in the place of the fragment are built from three Pt–Si σ bonds and two nonbonding Pt 5d orbitals. As the Pt contributions to the Pt–Si σ bonds are from the Pt 6s and 6p, the Pt can be envisioned as being sp
2 hybridized, just as the Si atoms are. The remaining p orbital perpendicular to the plane of the orbital ends up in the LUMO orbital of the fragment (
Figure 4), where it experiences bonding with the surrounding Ca atoms, but is not sufficiently stabilized to dip below the
EF of the compound.
To summarize our results thus far, the Pt1 site has a filled 5d block and participates in σ-bonds with its surrounding Si atoms via sp2 hybrid orbitals. The charge on the Pt1 site can be viewed in a number of ways depending on how polar we consider the Pt–Si bonds. If we were to view the Si atoms as Si4−, the Pt–Si electron pairs would then be dative bonds, with both electrons coming from the Si. The Pt1 atoms would then be Pt0. If, instead, we view the electron pair as being equally shared between the Pt and Si, as would be more consistent with their relative electronegativities, the Pt1 sites would then be Pt3−.
5. Bonding at the Pt2 Site: Ca-Supported Pt–Pt Bonds
A similar bonding scheme can be found for the Pt2 sites in the Ca
10Pt
7Si
3 structure. Here, however, it is difficult to obtain a reasonable fragment involving only a single Pt atom. The Pt2 sites occur as dimers, with Pt–Pt distances of 3.14 Å. This distance is large relative to that expected for a single bond, but is not large enough for the interaction between the two Pt atoms to be considered negligible. The bonding of the Pt2 environments can then be explored by starting with one of these Pt pairs, then including its Ca and Si neighbors, as is shown on the right of
Figure 6. The Pt and Si atoms form an essentially linear Si–Pt–Pt–Si chain, with the Ca atoms forming distorted square antiprisms around the Pt atoms. A shared face between these square antiprisms leads to a square of Ca atoms serving as bridges between the Pt2 sites.
To model the bonding situation here, we place sp2 hybrid orbitals on the Si atoms pointing toward the Pt atoms. For the Ca atoms, we use sp hybrid orbitals (again, the actual hybrid combination used is not essential) and direct them either toward the closest Pt atom in the dimer or, for those bridging the Pt atoms, toward the center of the Pt–Pt contact.
The MO diagram for this system is drawn alongside the Ca
10Pt
7Si
3 DOS distribution in
Figure 6, where, again, the pseudogap and
EF for the full compound coincide with a sizeable gap between MO energy levels. Thirteen MOs lie below the
EF, corresponding to 26 electrons/Pt dimer or 13 electrons per Pt atom. Ten of these orbitals lie especially close in energy to the Pt 5d peak in the DOS and correspond to filled Pt 5d sets on the two Pt atoms.
Strong interatomic interactions occur in the remaining three MOs. Two of them lie several eV below the Pt 5d levels. They consist of in-phase and out-of-phase combinations of the Pt–Si σ bonds, similar to those seen in the bottom row of
Figure 5. The Pt contributions to these orbitals are lobes pointed toward the Si atoms and away from the Pt–Pt contacts. These can be viewed as Pt sp hybrid orbitals (with some admixture of Pt 5d).
Figure 6.
MO diagram for the Pt2 dimer in the context of its coordination environment. Inset: the molecular orbital giving rise to a Ca-supported Pt–Pt bond.
Figure 6.
MO diagram for the Pt2 dimer in the context of its coordination environment. Inset: the molecular orbital giving rise to a Ca-supported Pt–Pt bond.
The final occupied MO occurs just below the EF and represents the highest occupied molecular orbital (HOMO) of the fragment. Again, sp hybrid orbitals appear on the Pt atoms, but this time, they are hybridized away from the Pt–Si contacts. Instead, the Pt sp orbitals point along the Pt–Pt contact and form a bonding interaction with each other. This bonding interaction is strengthened through the support of the neighboring Ca atoms, creating a domain of constructive interference that is delocalized over six atoms: the two Pt atoms of the dimer and their four bridging Ca atoms.
There are several ways of interpreting this HOMO level. One could consider it as corresponding to a six-center two-electron bond. This is supported by a look at how the energy of the orbital is affected by removing the Ca contributions. Upon turning off the interactions of the fragment with the Ca, the HOMO level is destabilized by several eV. The orbital is in fact raised to 1.5 eV above the compound’s EF. While Ca contributions appear relatively small in the figure, the occupation of the level is highly dependent on these bridging interactions.
Another view of the HOMO orbital that stays closer to the Zintl concept is to recognize that this interaction shares the same nodal characteristics of a classical Pt–Pt σ bond. In this sense, the orbital is isolobal to a Pt–Pt single bond. Its electrons can then be treated in terms of electron counting as a covalently shared electron pair between the Pt atoms.
These considerations can be summarized in simple charge assignments to the Pt2 atoms. The Pt2 atoms each have filled 5d orbitals and participate in two bonds in a linear arrangement. One bond is to a Si atom, while the other is to the other Pt atom in the Pt2 dimer. When the electrons in the Pt–Pt bond are split equally between the two atoms, and the Si atoms are considered as Si4−, we arrive at a charge assignment of Pt1−. If the electrons in the Pt-Si bond are treated as equally shared, then the formal charge of the Pt2 site becomes 2−.
6. A Zintl View of Ca10Pt7Si3
Having now discussed the bonding schemes for all of the Pt sites in the Ca10Pt7Si3 structure using DFT-calibrated MO models, we are ready to build a Zintl view for the full compound. There are one Pt1 and six Pt2 positions per formula unit. The Pt1 atoms participate in two-center two-electron bonds with three Si neighbors via sp2 hybrid orbitals, while each Pt2 atom uses sp hybrid orbitals to bind to one Si atom and one other Pt2 atom. The formal charges that result depend on the degree of polarity we attribute to the Pt–Si bonds. If we treat the Pt–Si bonds as being completely polarized toward the Si atoms to create Si4− ions, as is most comfortable in applying the Zintl concept, we arrive at a nearly charge-balanced scheme, Ca10Pt7Si3 = (Ca2+)10(Pt0)1(Pt1−)6(Si4−)3∙2e−, in which the compound is found to be two electrons (2%) over the electron count predicted by our simple bonding picture. A more covalent view of the Pt–Si bonds leads to a shuffling of the anionic charge between the Pt and Si, Ca10Pt7Si3 = (Ca2+)10(Pt3−)1(Pt2−)6(Si1−)3∙2e−, but, of course, yields the same electron excess.
How should we consider these extra electrons? So far, in our bonding analysis, we have not considered the possibility of Ca–Ca bonding in the phase. In fact, a simple Hückel calculation on the Ca sublattice of the structure reveals a small number of levels that pass below the
EF of the full compound. The extra electrons can then be viewed as delocalized over the Ca atoms in the structure. This would correspond to incomplete electron transfer from the Ca atoms to the Pt and Si, such that the formal charge on the Ca would be Ca
1.8+ instead of Ca
2+. Similar excess electrons over the Zintl counts have been found for Yb
3Ag
2, Ca
5Au
4 and Ca
3Hg
2 [
38]. It could be interesting in such cases to experimentally examine the role of these electrons in stabilizing the structure by attempts to synthetically deplete them through partial elemental substitution with alkali metals.
7. Conclusions
In this article, we have carried out a bonding analysis of the intermetallic Ca
10Pt
7Si
3, using DFT-calibrated Hückel calculations. The compound is found to be nearly in accord with the Zintl concept, when we consider covalent bonding to occur both along Pt–Si and rather long Pt–Pt contacts (3.14 Å) through the support of bridging Ca atoms. In their geometries and bonding, reminiscent of sp and sp
2 hybridization, the anionic Pt atoms indeed appear to behave as main group elements, as anticipated by Whangbo, Lee and Köhler [
24]. The observed electron count is found to be in excess of that predicted by 2%, which is attributed to incomplete ionization of the Ca atoms,
i.e., two electrons per formula unit occupy Ca-based orbitals.
The multicenter interactions focused on the Pt–Pt contacts point to one way in which the localized bonding of the Zintl phases might gradually delocalize as one moves into the domain of polar intermetallic compounds. Here, the isolobal relationship to a classic two-center two-electron bond is maintained, while spreading it over more centers in accord with the relatively high energy of the Pt 6p orbitals needed for the creation of sp hybrid functions. Similar supported bonds between transition metals were recently reported for the incommensurately modulated Co
3Al
4Si
2 [
36]. One of our research groups (DCF) is currently pursuing how similar isolobal analogies to localized bonds might be used to explain the DOS pseudogaps observed for a wide variety of intermetallic phases.
In our endeavor to derive a bonding description of Ca10Pt7Si3 in terms of the Zintl concept, we must embrace the usual tension between the usefulness of recognizing localized bonds and the complex reality of the phase’s electronic structure. The MO energy levels described here will of course undergo broadening into bands when returned to the context of the periodic crystal structure. One indication of this is that around the sp2 hybridized Si atoms, no peak in the valence electron density is visible in the region expected to house the unhybridized 3p orbital. This suggests substantial delocalization of these electrons among the surrounding Ca and Pt atoms. However, just as for Zintl phases, the evocation of electron pairs at specific interatomic contacts provides a simple rationalization of the structural features of this compound, as well as its DOS pseudogap at the EF.


