Properties of Mn2+ and Π-Electron Spin Systems Probed by 1H and 13C NMR in the Organic Conductor κ-(BETS)2Mn[N(CN)2]3

 , ,
, , 
Abstract
:1. Introduction
 ) of crystal structure of κ-(BETS)2Mn[N(CN)2]3; (b) BETS molecule with 13C in positions of the central C = C bond; (c) Top view of schematic crystal structure of the conducting BETS layer. The circled pairs of lines represent (BETS)2 dimers; (d) Side view of BETS dimer with site definition of the central C = C carbons; (e) Top view of the anion layer.
) of crystal structure of κ-(BETS)2Mn[N(CN)2]3; (b) BETS molecule with 13C in positions of the central C = C bond; (c) Top view of schematic crystal structure of the conducting BETS layer. The circled pairs of lines represent (BETS)2 dimers; (d) Side view of BETS dimer with site definition of the central C = C carbons; (e) Top view of the anion layer.
) of crystal structure of κ-(BETS)2Mn[N(CN)2]3; (b) BETS molecule with 13C in positions of the central C = C bond; (c) Top view of schematic crystal structure of the conducting BETS layer. The circled pairs of lines represent (BETS)2 dimers; (d) Side view of BETS dimer with site definition of the central C = C carbons; (e) Top view of the anion layer. 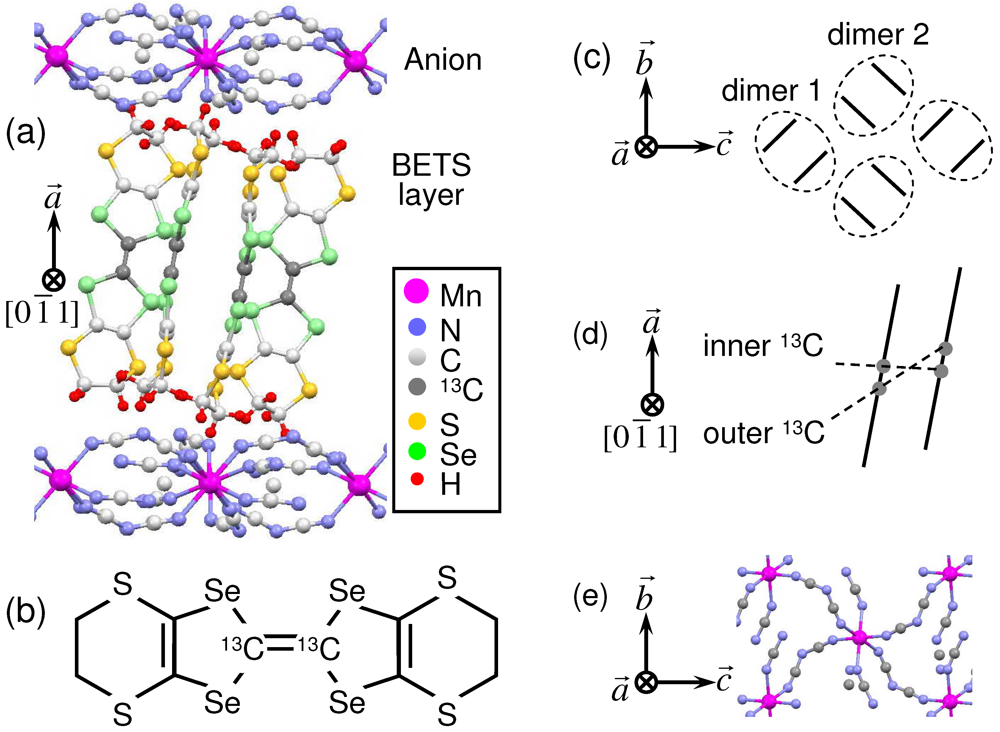
2 Results and Discussion
2.1. 1H NMR
 towards
  direction. The spectrum is shown with respect to 1v0 = 1γH0, where 1γ = 42.5759 MHz/T is the proton gyromagnetic ratio. For the chosen geometry
  , the two different orientations of the BETS dimer shown in Figure 1c become magnetically equivalent which reduces the total number of peaks to 8. Arrows in Figure 2 indicate the 8 peaks.towards
 direction. The spectrum is shown with respect to 1v0 = 1γH0 .
towards direction. The spectrum is shown with respect to 1v0 = 1γH0 .
direction. The spectrum is shown with respect to 1v0 = 1γH0 .
towards direction. The spectrum is shown with respect to 1v0 = 1γH0 . 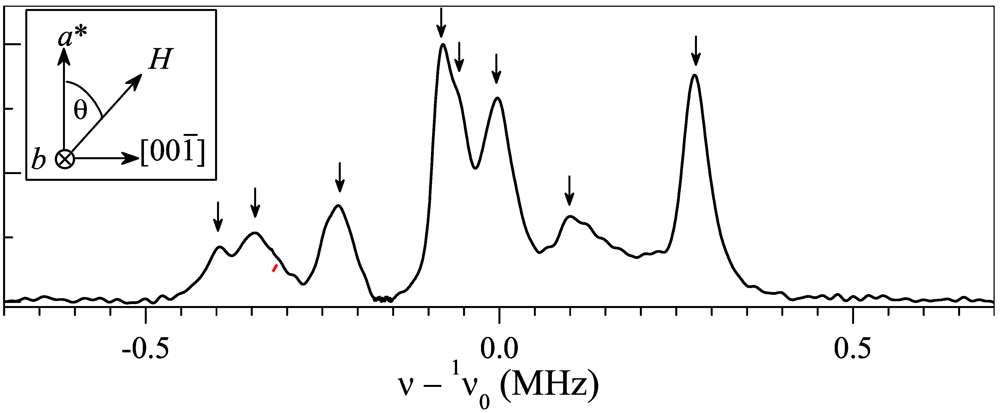 direction towards .
 we model the spectrum as


 geometry vs. temperature in H = 1.4 and 7 T; (c) Position of the peak for the temperature range 4-150 K, in function of the DC magnetization per Mn ion, μMn = M/NA, measured at the same temperatures and fields and expressed in terms of the Bohr magneton, μB. Open red circles and closed black circles correspond to the fields 1.4 and 7 T, respectively.
geometry vs. temperature in H = 1.4 and 7 T; (c) Position of the peak for the temperature range 4-150 K, in function of the DC magnetization per Mn ion, μMn = M/NA, measured at the same temperatures and fields and expressed in terms of the Bohr magneton, μB. Open red circles and closed black circles correspond to the fields 1.4 and 7 T, respectively.
geometry vs. temperature in H = 1.4 and 7 T; (c) Position of the peak for the temperature range 4-150 K, in function of the DC magnetization per Mn ion, μMn = M/NA, measured at the same temperatures and fields and expressed in terms of the Bohr magneton, μB. Open red circles and closed black circles correspond to the fields 1.4 and 7 T, respectively. 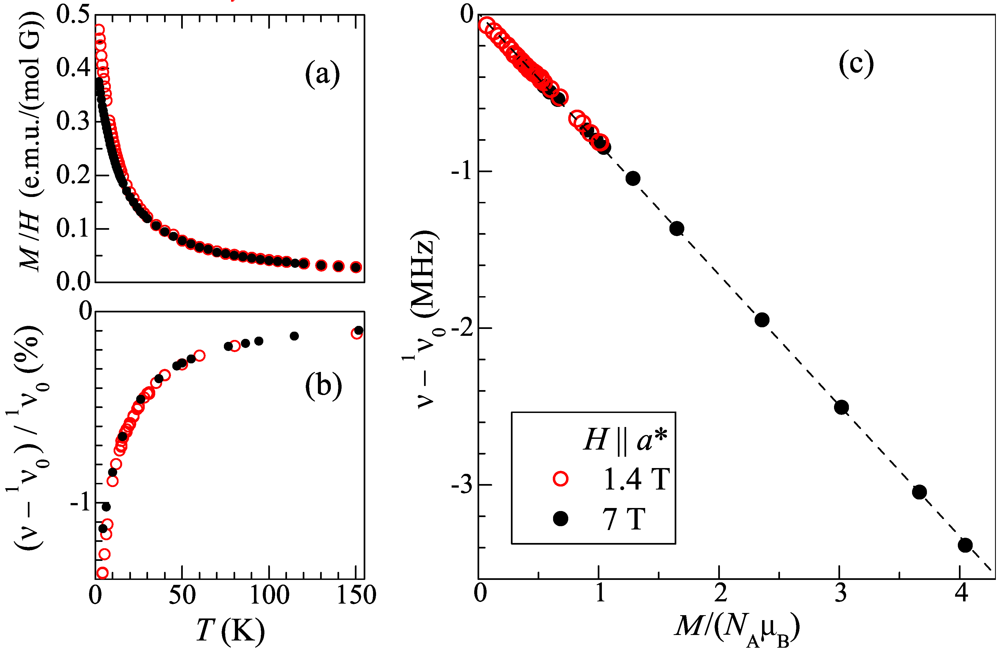 ) with temperature. As can be seen, the frequency span of the spectrum increases with decreasing temperature while its shape is maintained down to ~20 K. At lower temperature the peaks broaden rapidly, which is more pronounced on the right-hand side of the spectrum. Figure 5b depicts the temperature dependence of the half width at half hight,
  , for the leftmost and the rightmost peaks in the spectrum. As one can see in Figure 5, the linewidth is relatively flat above TMI ≈ 23 K (especially for the leftmost peak) and increases sharply below this temperature. Figure 5c demonstrates the plot of the linewidths in function of the DC magnetization. One can see in Figure 5c a crossover in the linewidth behavior at TMI which is observed as an upturn from the linear M-dependence (shown by solid lines) obeyed at higher temperatures.; (b) Temperature dependence of the half-linewidth of the leftmost (circles) and the rightmost (squares) peaks; (c) The leftmost and the rightmost peak half-linewidths in function of the DC magnetization. Solid lines extrapolate the linewidth behavior above 25 K to low temperatures. Dashed lines with numbers on top mark measurement temperatures.
; (b) Temperature dependence of the half-linewidth of the leftmost (circles) and the rightmost (squares) peaks; (c) The leftmost and the rightmost peak half-linewidths in function of the DC magnetization. Solid lines extrapolate the linewidth behavior above 25 K to low temperatures. Dashed lines with numbers on top mark measurement temperatures.
, for the leftmost and the rightmost peaks in the spectrum. As one can see in Figure 5, the linewidth is relatively flat above TMI ≈ 23 K (especially for the leftmost peak) and increases sharply below this temperature. Figure 5c demonstrates the plot of the linewidths in function of the DC magnetization. One can see in Figure 5c a crossover in the linewidth behavior at TMI which is observed as an upturn from the linear M-dependence (shown by solid lines) obeyed at higher temperatures.; (b) Temperature dependence of the half-linewidth of the leftmost (circles) and the rightmost (squares) peaks; (c) The leftmost and the rightmost peak half-linewidths in function of the DC magnetization. Solid lines extrapolate the linewidth behavior above 25 K to low temperatures. Dashed lines with numbers on top mark measurement temperatures.
; (b) Temperature dependence of the half-linewidth of the leftmost (circles) and the rightmost (squares) peaks; (c) The leftmost and the rightmost peak half-linewidths in function of the DC magnetization. Solid lines extrapolate the linewidth behavior above 25 K to low temperatures. Dashed lines with numbers on top mark measurement temperatures.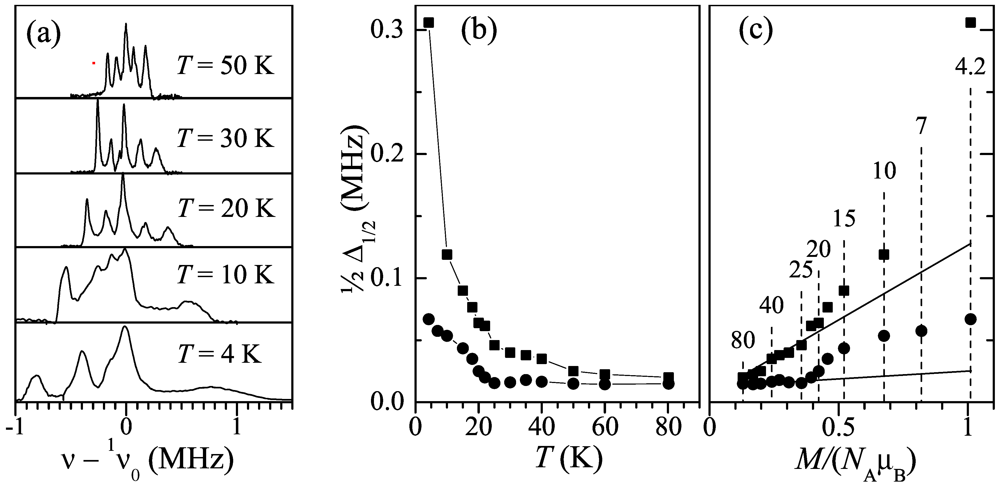 direction, as discussed in [14]. However, all of them should make the linewidth as linear in the magnetization as the peak position itself is (Figure 4c). The upturn of the linewidth M-dependence below TMI ≈ 23 K (Figure 5c) indicates the onset of yet another broadening mechanism. Provided that the crystal lattice is intact, this should be related with local-level scatter of the dipolar fields from Mn2+ at the hydrogen site, for example, a variable from site to site tilt of the Mn2+ static moments. This site variation of the tilt is apparently random or incommensurate with the crystal lattice, because otherwise a splitting of 1H NMR peaks would take place instead of the featureless broadening observed in the experiment (Figure 5a). The tilt of the Mn2+ moments emerging below TMI, together with the deviation of the magnetization from the Curie-Weiss behavior [3], indicates apparently the tendency of the Mn2+ spin system towards the AF order. Frustrated geometrically by triangular arrangement of Mn in the anion layer (Figure 1e), Mn2+ system is resolved into a disordered (like spin-glass) or an incommensurate spin structure.
2.2. 13C NMR
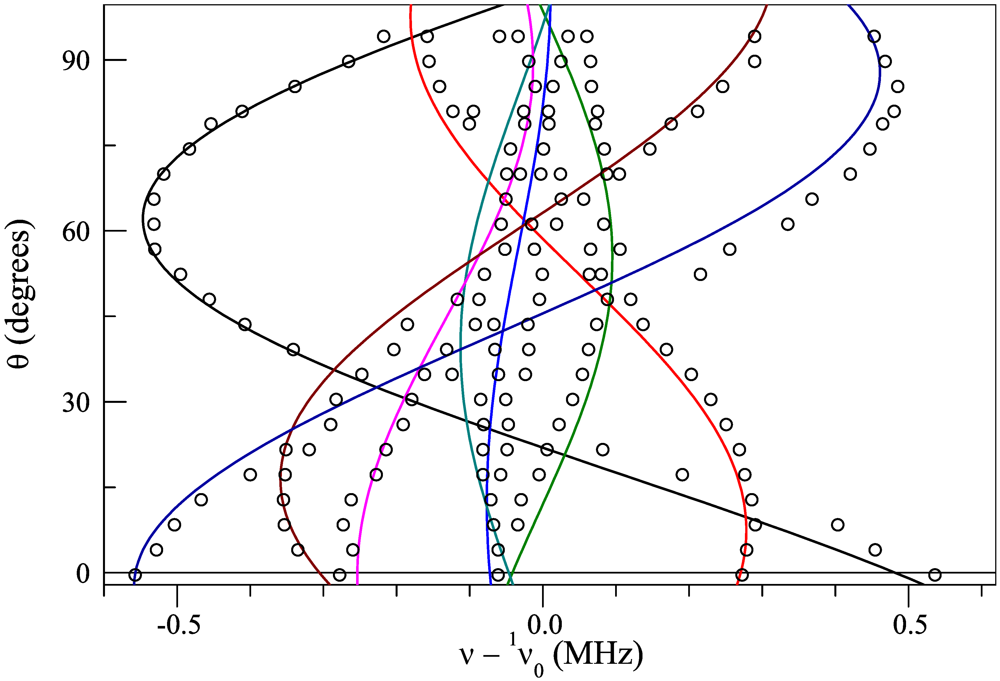
at 45°to . For this experimental geometry, the metallic-state spectrum in theory is represented by four peaks arising from the two magnetically different orientations of the BETS dimers (Figure 1c) and nonequivalent(“inner” and “outer”) carbon sites of the central C=C bond within the dimer (Figure 1d) [15]. The dipolar interaction between 13C spins in the C=C bond, which in general provides another factor of two to the number of peaks, is nearly zero for this field orientation. at 45° to . The spectra are shown with respect to 13v0 = 74.946 MHz. (a) The spectrum at T = 50 K. Blue solid lines indicate positions of the resonance peaks calculated with the shift tensor of κ-(ET)2Cu[N(CN)2]Br [15]; (b) The evolution of the 13C NMR spectrum with temperature.
at 45° to . The spectra are shown with respect to 13v0 = 74.946 MHz. (a) The spectrum at T = 50 K. Blue solid lines indicate positions of the resonance peaks calculated with the shift tensor of κ-(ET)2Cu[N(CN)2]Br [15]; (b) The evolution of the 13C NMR spectrum with temperature. 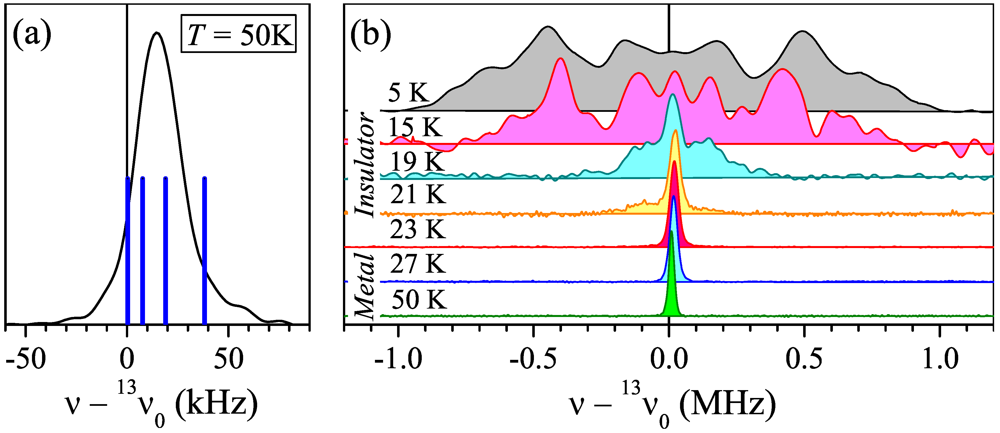
 ) produce opposite local fields at carbon sites i and j:
  , where
  and
and  are the nuclear and electron spin operators, respectively, and A is the hyperfine tensor. In turn, this signifies the AF exchange interaction between the localized spins. The staggered component of the spin magnetization lies apparently somewhere in the plane perpendicular to the magnetic field, since the anisotropic AF exchange term is usually much smaller than 7 T, the external field of this experiment.
3 Experimental
4 Conclusions
Acknowledgements
References
- Zverev, V.N.; Kartsovnik, M.V.; Biberacher, W.; Khasanov, S.S.; Shibaeva, R.P.; Ouahab, L.; Toupet, L.; Kushch, N.D.; Yagubskii, E.B.; Canadell, E. Temperature-pressure phase diagram and electronic properties of the organic metal κ-(BETS)2Mn[N(CN)2]3[N(CN)2]3. Phys. Rev. B 2010, 82, 155123:1–155123:9. [Google Scholar]
- Kushch, N.D.; Yagubskii, E.B.; Kartsovnik, M.V.; Buravov, L.I.; Dubrovskii, A.D.; Chekhlov, A.N.; Biberacher, W. Donor BETS based bifunctional superconductor with polymeric dicyanamidomanganate(II) anion layer: κ-(BETS)2Mn[N(CN)2]3[N(CN)2]3. J. Am. Chem. Soc. 2008, 130, 7238–7240. [Google Scholar]
- Vyaselev, O.M.; Kartsovnik, M.V.; Biberacher, W.; Zorina, L.V.; Kushch, N.D.; Yagubskii, E.B. Magnetic transformations in the organic conductor κ-(BETS)2Mn[N(CN)2]3[N(CN)2]3at the metal-insulator transition. Phys. Rev. B 2011, 83, 094425:1–094425:6. [Google Scholar]
- Brossard, L.; Clerac, R.; Coulon, C.; Tokumoto, M.; Ziman, T.; Petrov, D.K.; Laukhin, V.N.; Naughton, M.J.; Audouard, A.; Goze, F.; et al. Interplay between chains of S = 5/2localised spins and two-dimensional sheets of organic donors in the synthetically built magnetic multilayer λ-(BETS)2FeCl4. Eur. Phys. J. B 1998, 1, 439–452. [Google Scholar] [CrossRef]
- Uji, S.; Brooks, J.S. Magnetic-field-induced superconductivity in organic conductors. J. Phys. Soc. Jpn. 2006, 75, 051014:1–051014:10. [Google Scholar]
- Kagawa, F.; Miyagawa, K.; Kanoda, K. Magnetic Mott criticality in a κ-type organic salt probed by NMR. Nat. Phys. 2009, 5, 880–884. [Google Scholar] [CrossRef]
- Welp, U.; Fleshler, S.; Kwok, W.K.; Crabtree, G.W.; Carlson, K.D.; Wang, H.H.; Geiser, U.; Williams, J.M.; Hitsman, V.M. Weak ferromagnetism in κ-(ET)2Cu[N(CN)2]Cl, where (ET) is bis-(ethylenedithio)tetrathiafulvalene. Phys. Rev. Lett. 1992, 69, 840–843. [Google Scholar] [CrossRef]
- Yoneyama, N.; Miyazaki, A.; Enoki, T.; Saito, G. Magnetic properties of (BEDT-TTF)2X with localized spins. Synth. Met. 1997, 86, 2029–2030. [Google Scholar] [CrossRef]
- Akiba, H.; Nakano, S.; Nishio, Y.; Kajita, K.; Zhou, B.; Kobayashi, A.; Kobayashi, H. Mysterious paramagnetic states of Fe 3d spin in antiferromagnetic insulator of κ-BETS2FeCl4system. J. Phys. Soc. Jpn. 2009, 78, 033601:1–033601:3. [Google Scholar]
- Waerenborgh, J.C.; Rabaça, S.; Almeida, M.; Lopes, E.B.; Kobayashi, A.; Zhou, B.; Brooks, J.S. Mössbauer spectroscopy and magnetic transition of κ-(BETS)2FeCl4. Phys. Rev. B 2010, 81, 060413:1–060413:4. [Google Scholar]
- Klutz, T.; Hennig, I.; Haeberlen, U.; Schweitzer, D. Knight shift tensors and π-spin densities in the organic metals αt-(BEDT-TTF)2I3and (BEDT-TTF)2Cu(NCS)2. Appl. Mag. Res. 1991, 2, 441–463. [Google Scholar] [CrossRef]
- Kanoda, K. Recent progress in NMR studies on organic conductors. Hyperfine Interact. 1997, 104, 235–249. [Google Scholar] [CrossRef]
- Uritskii, M.; Irkhin, V. Calculation of dipole fields at interstices of rare-earth metals. Phys. Solid State 2000, 42, 399–405, Fizika Tverdogo Tela 2000, 42, 390-396.. [Google Scholar] [CrossRef]
- Vyaselev, O.M.; Kushch, N.D.; Yagubskii, E.B. Proton NMR study of the organic metal κ-(BETS)2Mn[N(CN)2]3[N(CN)2]3. J. Exp. Theor. Phys. 2011, 113, 835–841, Zh. Eksp. Teor. Fiz. 2011, 140, 961-967.. [Google Scholar] [CrossRef]
- de Soto, S.M.; Slichter, C.P.; Kini, A.M.; Wang, H.H.; Geiser, U.; Williams, J.M. 13C NMR studies of the normal and superconducting states of the organic superconductor κ-(ET)2Cu[N(CN)2]Br. Phys. Rev. B 1995, 52, 10364–10368. [Google Scholar] [CrossRef]
- Smith, D.F.; de Soto, S.M.; Slichter, C.P.; Schlueter, J.A.; Kini, A.M.; Daugherty, R.G. Dzialoshinskii-Moriya interaction in the organic superconductor κ-(BEDT-TTF)2Cu(N[CN]2)Cl. Phys. Rev. B 2003, 68, 024512:1–024512:9. [Google Scholar]
- Eto, Y.; Kawamoto, A. Antiferromagnetic phase in β΄-(BEDT-TTF)2ICl2 under pressure as seen via 13C NMR. Phys. Rev. B 2010, 81, 020512:1–020512:4. [Google Scholar]
- Cambridge Crystallographic Data Centre. Available online: http://www.ccdc.cam.ac.uk/data_request/cif (accessed on 10 April 2012).
- Kushch, N.D.; Buravov, L.I.; Chekhlov, A.N.; Spitsina, N.G.; Kushch, P.P.; Yagubskii, E.B.; Herdtweck, E.; Kobayashi, A. The first BETS radical cation salts with dicyanamide anion: Crystal growth, structure and conductivity study. J. Solid State Chem. 2011, 184, 3074–3079. [Google Scholar]
- Kato, R.; Kobayashi, H.; Kobayashi, A. Synthesis and properties of bis(ethylenedithio) tetraselenafulvalene (BEDT-TSeF) compounds. Synth. Met. 1991, 42, 2093–2096. [Google Scholar] [CrossRef]
- Kagawa, F.; Kurosaki, Y.; Miyagawa, K.; Kanoda, K. Field-induced staggered magnetic moment in the quasi-two-dimensional organic Mott insulator κ-(BEDT-TTF)2Cu[N(CN)2]Cl. Phys. Rev. B 2008, 78, 184402–1. [Google Scholar]
© 2012 by the authors; licensee MDPI, Basel, Switzerland. This article is an open-access article distributed under the terms and conditions of the Creative Commons Attribution license (http://creativecommons.org/licenses/by/3.0/).
Share and Cite
Vyaselev, O.M.; Kato, R.; Yamamoto, H.M.; Kobayashi, M.; Zorina, L.V.; Simonov, S.V.; Kushch, N.D.; Yagubskii, E.B. Properties of Mn2+ and Π-Electron Spin Systems Probed by 1H and 13C NMR in the Organic Conductor κ-(BETS)2Mn[N(CN)2]3. Crystals 2012, 2, 224-235. https://doi.org/10.3390/cryst2020224
Vyaselev OM, Kato R, Yamamoto HM, Kobayashi M, Zorina LV, Simonov SV, Kushch ND, Yagubskii EB. Properties of Mn2+ and Π-Electron Spin Systems Probed by 1H and 13C NMR in the Organic Conductor κ-(BETS)2Mn[N(CN)2]3. Crystals. 2012; 2(2):224-235. https://doi.org/10.3390/cryst2020224
Chicago/Turabian StyleVyaselev, Oleg M., Reizo Kato, Hiroshi M. Yamamoto, Megumi Kobayashi, Leokadiya V. Zorina, Sergey V. Simonov, Nataliya D. Kushch, and Eduard B. Yagubskii. 2012. "Properties of Mn2+ and Π-Electron Spin Systems Probed by 1H and 13C NMR in the Organic Conductor κ-(BETS)2Mn[N(CN)2]3" Crystals 2, no. 2: 224-235. https://doi.org/10.3390/cryst2020224
APA StyleVyaselev, O. M., Kato, R., Yamamoto, H. M., Kobayashi, M., Zorina, L. V., Simonov, S. V., Kushch, N. D., & Yagubskii, E. B. (2012). Properties of Mn2+ and Π-Electron Spin Systems Probed by 1H and 13C NMR in the Organic Conductor κ-(BETS)2Mn[N(CN)2]3. Crystals, 2(2), 224-235. https://doi.org/10.3390/cryst2020224