Abstract
Lithium lanthanum titanate (LLTO) is a promising solid electrolyte for all-solid-state lithium-ion batteries (ASSLIBs), and its total conductivity is dramatically influenced by the ceramic microstructure. Here we report a novel aerodynamic levitation rapid solidification method to prepare dense LLTO ceramics with a dendrite-like microstructure, which can be hardly obtained by conventional sintering. At optimal nominal lithium content and cooling rate, the solidified LLTO ceramic achieved a high total conductivity of 2.5 × 10⁻⁴ S·cm−1 at room temperature, along with excellent mechanical properties such as a high Young’s modulus of 240 GPa and a high hardness of 16.7 GPa. Results from this work suggest that aerodynamic levitation rapid solidification is an effective processing method to manipulate the microstructure of LLTO ceramics to minimize the GBs’ contribution to the total conductivity, which may be expanded to prepare other oxide-type lithium electrolytes.
1. Introduction
All-solid-state lithium-ion batteries (ASSLIBs) with high energy density and significantly improved safety have emerged as a pivotal next-generation energy storage technology and are currently at the forefront of electrochemical research [1,2,3]. Solid electrolytes with high lithium-ion conductivity represent a critical component for the development of high-performance ASSLIBs, and have attracted extensive and sustained global research efforts [4,5]. In the past decades, different types of solid electrolytes, including oxides [6], sulfides [7], halides [8], polymers [9], etc., have been reported, among which the perovskite-structured oxide, lithium lanthanum titanate (LixLa2/3−x/3TiO3 or Li3xLa2/3−xTiO3, LLTO), has been identified as one of the most promising electrolyte materials due to its high ionic conductivity, good thermal stability, large electrochemical stability window, excellent mechanical properties and non-toxicity [10]. Since its first report by Inaguma et al. in 1993 [11], LLTO has been a research hotspot for decades, and continues to be actively studied worldwide as evidenced by ongoing studies in the past 2–3 years [12,13,14,15,16,17,18,19,20].
Dense LLTO ceramics are commonly prepared by sintering, in which LLTO powders synthesized by solid-state reaction, sol–gel or other methods are compacted under uni-axial or isostatic pressure and then subjected to a high-temperature densification process. The resultant LLTO ceramics usually display a typical equiaxial grain structure. For such ceramics, the total resistance consists of contributions from the bulk (grain) and the grain boundaries (GBs). GBs in LLTO are known to impede lithium-ion migration and result in a low GB conductivity of ~10−5 S·cm−1 at room temperature, which is approximately two orders of magnitude lower than the bulk conductivity [21]. Due to the compositional and structural complexities of GBs, the origin of the strong blocking effect of GBs in LLTO is still under debate and different mechanisms have been proposed. For example, Ma et al. [22] attributed the poor GB conductivity to the severe structural and chemical deviations of GBs from the perovskite framework. They revealed that GBs consists of a thin layer of a crystalline Ti-O binary compound, which prohibits the abundance and transport of Li ions. Later studies [23,24] attributed the low GB conductivity to depletion of lithium ions in the space charge layer caused by the positively charged crystallographic GBs. A recent study by Peng et al. [25] found that GBs are uniformly subject to subsurface segregation of La atoms, which causes local depletion of A-site vacancies and hence induces a significant deleterious effect on Li-ion conductions through GBs. Nevertheless, the large GB resistance results in a total conductivity of only ~10−5 S·cm−1, and thus limits the practical application of LLTO [26].
To enhance the total lithium-ion conductivity of LLTO, efforts have been made from two aspects: (1) improving the bulk and/or GB conductivity by varying the Li content [11,27] or chemical doping [13,14,28,29,30,31,32,33,34]; (2) minimizing the grain boundary resistance by manipulating the ceramic microstructure [35]. In terms of the bulk conductivity, an early review by Stramare et al. [36] pointed out that the highest bulk conductivity of 1.0 × 10⁻³ S·cm−1 can be achieved in Li3xLa2/3−xTiO3 when x ≈ 0.10. In a recent study, Geng et al. [27] prepared Li3xLa2/3−xTiO3 ceramics with nominal lithium content (3x) varying between 0.03 and 0.75, and found that the conductivity of the sintered ceramics is highly dependent on the lithium content and the sintering temperature. They reported that the highest bulk conductivity (~9.5 × 10⁻⁴ S·cm−1 at room temperature) was achieved when the nominal lithium content 3x = 0.39 and was sintered at 1350 °C. Enhancement of the bulk conductivity of LLTO was achieved by chemical doping, for example, partial replacement of La by Sr on the A-site [28] or Ti by Ga on the B-site [30], where bulk conductivity values of 1.5 × 10⁻³ and 4.15 × 10⁻³ S·cm−1 at room temperature were reported, respectively. On the other hand, chemical doping was also found effective at enhancing the GB conductivity. For example, Wang et al. [34] incorporated Ag into LLTO and achieved an optimum total conductivity of 1.54 × 10⁻⁴ S·cm−1 at room temperature, which was higher than the value (2.84 × 10⁻⁵ S·cm−1) for undoped LLTO. The improved conductivity originated from an enlarged migration path for Li ions in the lattice by Ag doping, as well as the reduced GB resistance caused by Ag inclusions at GBs. Gao et al. [14] achieved a total ionic conductivity of 3.0 × 10⁻⁴ S·cm−1 by Ta and Sr co-doping into LLTO, showing a 280% enhancement over the undoped sample. The enhancement was attributed to the balance of the structural symmetry, Li ion concentration, GBs, domain boundaries, and the lattice defects, which simultaneously enhanced the bulk and GB conductivity.
In contrast to the success of enhancing the bulk and GB conductivity of LLTO by chemical doping, minimizing the grain boundary resistance by microstructure control remains a challenging task. For sintered ceramics, increasing the sintering temperature and/or prolonging the holding time are the most widely used methods to manipulate the ceramic microstructure. For example, the total conductivity of LLTO ceramics was enhanced one order of magnitude when the sintering temperature increased from 1250 to 1350 °C [27]. However, it is worth noting that increasing the sintering temperature or holding time may lead to a change in the composition considering the volatility of Li, which may reduce the bulk conductivity or cause the formation of the secondary phase. Thus, to minimize the grain boundary resistance, alternative processing methods more effective to control the microstructure are required. For this purpose, novel methods were adopted to prepare dense LLTO ceramics [37,38,39,40,41]. Leyet et al. [37] employed spark plasma sintering (SPS) to densify Li0.24La0.59TiO3 and obtained 95.5% of theoretical density when sintered at 1100 °C for 5 min following a post-sintering annealing treatment at 850 °C for 3 h. However, possibly due to the small grain sizes (50–150 nm), the total conductivity of the SPS LLTO was very low (~10−8 S·cm−1 at room temperature [38]) due to the presence of a large number of GBs. Avila et al. [39] reported densification of Li0.5La0.5TiO3 at 800 °C in a few seconds by reactive flash sintering. The sintered LLTO showed a dense equiaxial grain structure with average grain size <1 μm, showing a bulk conductivity of 5.0 × 10⁻⁴ S·cm−1 at room temperature. However, the total conductivity, although the value was not directly reported, was substantially lower (10−7~10−6 S·cm−1 based on their impedance plots). Silva et al. [40] prepared Li0.5La0.5TiO3 ceramics by a laser sintering technique; however, the GB conductivity was lower than that for conventional sintered ceramics, possibly due to a reduced grain size. A recent study by Lin et al. [41] applied mechanical pressure to reduce the sintering temperature and dwell time during field-assisted sintering technology (FAST)/SPS. They reported a total conductivity of ~10−6 S·cm−1 at room temperature for Li0.33La0.55TiO3. It can be seen that the above-mentioned fast synthesis methods have limited effects on reducing the GB resistance by tuning the microstructure as the ceramics still show equiaxial grains, not to mention the paradox between the fast synthesis required to minimize Li loss and large grains required to reduce the number of GBs. A novel synthesis method with the ability to obtain diverse microstructures is required.
Motivated by the above considerations, we prepared dense LLTO ceramics by an aerodynamic levitation (ADL) containerless solidification method, where the deep undercooled LLTO melt was subjected to rapid solidification to form a dense ceramic with a dendrite-like microstructure, which can be hardly obtained by conventional sintering. Comprehensive analysis on the impedance spectroscopy suggests an absence of the grain boundary response in the solidified ceramics, showing a high total conductivity of 2.5 × 10⁻⁴ S·cm−1 at room temperature, which is among the highest values reported in the literature (e.g., 3.0 × 10⁻⁴ S·cm−1 [14]). Apart from competing electrical conductivity, the solidified ceramics also present excellent mechanical properties, such as a high Young’s modulus of 240 GPa and a high hardness of 16.7 GPa, as revealed by nano-indentation tests. Results from this work suggest that deep undercooling rapid solidification is an effective processing method to manipulate the microstructure of LLTO ceramics to minimize the GBs’ contribution to the total conductivity. Moreover, with the advantages of being containerless (to avoid contamination from any crucibles) and one-step and having fast processing (the whole process can be completed in 30 s), deep undercooling rapid solidification may be expanded to other oxide-type lithium electrolytes to obtain high conductivity and superior mechanical properties.
2. Experimental Section
2.1. Sample Preparations
LLTO ceramics were prepared by an aerodynamic levitation (ADL) containerless solidification method. Li2CO3 (99.99% metals basis, Aladdin, Shanghai, China), La2O3 (99.999% metals basis, Alfa Aesar, Shanghai, China) and TiO2 (99.99% metals basis, Aladdin, Shanghai, China) were used as the starting materials. The above powders were weighed according to the nominal composition LixLa(2−x)/3TiO3 (0.3 ≤ x ≤ 0.6) with 10 wt.% excess Li2CO3 added to compensate the Li loss during synthesis. The reagents were mixed gently and thoroughly by hand grinding in an agate mortar and pestle using ethanol as grinding media. To avoid possible contamination from different batches, the mortar and pestle were polished by Peek metal polish paste, successively cleaned by ethanol and de-ionized water and dried after each use. After drying, the mixture was cold-pressed at 2 MPa for 30 min to form a tablet of 20 mm diameter and 2 mm thickness, which was subsequently heat treated at 1273 K for 2 h in a muffle furnace to obtain a pellet with certain mechanical strength, which was crushed into small pieces for later use.
A piece ~30 mg from the crushed pellet was suspended by a stable stream of argon flow in the ADL furnace, and melted by a 100 W CO2 laser (Synrad Inc., Mukilteo, Washington, USA). Temperature of the sample was recorded by a high-speed infrared ray (IR) pyrometer (LumaSense, Lorraach, Germany), and the suspension status was monitored by a CCD camera (Hitachi, Tokyo, Japan). After holding at 2273 K for 5 s, the stably suspended molten droplet was cooled down to room temperature at 10, 30 and 60 K/s. The cooling rate was controlled by infrared temperature measurement and real-time laser power feedback. Prior to ADL experiments, the desired cooling rate was set on the self-developed control software. During ADL, the sample temperature recorded by the infrared thermometer was real-time fed back to the software, based on which the laser power was adjusted simultaneously to ensure a constant cooling rate during solidification until the temperature reached 300 °C. A schematic diagram of the ADL processing is shown in Figure 1a. For each cooling rate, more than 30 solidified spheres were prepared for general characterizations and electrical/mechanical measurements.
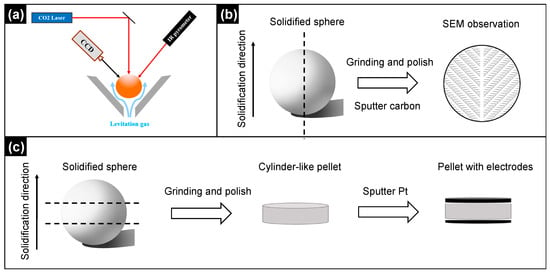
Figure 1.
Schematic diagrams of (a) the ADL processing; (b) sample preparation for SEM observation; (c) sample preparation for impedance spectroscopy measurements.
2.2. Characterizations
Phase compositions of the solidified samples were determined by X-ray powder diffraction (Bruker, Karlsruhe, Germany) using Cu Kα radiation in the 2θ range between 10 and 90°. Before XRD measurements, the solidified spheres were crushed and ground to powder, and then annealed at 400 °C for 4 h to eliminate any stress caused by crushing and grinding. Crystal structures of the main and secondary phases were further verified by transmission electron microscopy (Thermo Scientific, Waltham, NC, USA) on selected regions sliced using focus ion beam (Tescan, Brno, Czech Republic). Raman spectroscopy was carried out using a Renishaw inVia Qontor confocal Raman microscope (Renishaw, Gloucestershire, UK), using a 532 nm laser as the light source.
Microstructures of the solidified samples were characterized by scanning electron microscopy (PhenomWorld, Eindhoven, The Netherlands). Prior to SEM, the solidified sphere was mounted in epoxy and ground perpendicularly to the solidification direction to the plane passing through its center point, and then polished to mirror finish. The mirror-finished surface was subsequently coated with carbon for SEM observation. A schematic diagram for SEM sample preparation is illustrated in Figure 1b. To evaluate the sample-to-sample variation, SEM observations were carried out on 2 randomly selected samples for each composition/cooling rate. The contents of Li, La and Ti in the solidified ceramics were determined using inductive coupled plasma atomic emission spectroscopy (ICP-AES, Avio 500, PerkinElmer, Singapore).
Electrical properties of the solidified LLTO were investigated by impedance spectroscopy using an Agilent E4980A impedance analyzer (Agilent Technologies Inc., Santa Clara, CA, USA). Before measurements, the solidified spheres (diameter ~ 2 mm) were ground carefully from the top and the bottom by SiC sandpapers to obtain flat and parallel surfaces. Prior to measurements, the surfaces were coated by sputtering Pt to work as electrodes. The sputtering time for each surface was 2 min. The sample preparation procedure for impedance measurements is illustrated in Figure 1c. The resultant tablet-like specimen with a thickness ~ 1.2 mm was clamped in a home-made high-temperature jig. Impedance spectra were collected over a frequency range between 2 MHz and 20 Hz in the temperature range between 25 and 200 °C. Equivalent circuit fitting was performed using ZView software Version 3.1 (Scribner Associates, Inc., Southern Pines, NC, USA). For each composition/cooling rate, two samples were tested.
Elastic modulus and hardness were measured by instrumented nano-indentation (NanoTest Vantage, MML Co., Ltd., Wrexham, UK). The indentation measurements were performed on the polished cross-sections of the ceramics with a maximum load of 30 mN, and the hardness and Young’s modulus values were obtained from the unloading curves. Statistics were made based on 10 indentations on each sample to obtain the average value and the error bar.
3. Results and Discussion
3.1. Phase Purity, Crystal Structure and Microstructure
Figure 2a displays the XRD patterns of the solidified LixLa(2−x)/2TiO3 (x = 0.3) ceramics prepared under different cooling rates. At all three cooling rates (10, 30 and 60 K/s), the XRD patterns show LLTO as the predominant phase with all the peaks from this phase matching well the standard PDF card #87-0935, showing a tetragonal structure with the space group P4/mmm. At 10 and 30 K/s, Li2Ti3O7 and TiO2 can be identified as the secondary phases, as indicated by the small XRD peaks at 2θ ≈ 20.1° and 27.7°, respectively. When the cooling rate increases to 60 K/s, only a small peak from Li2Ti3O7 at 2θ ≈ 20.1° can be observed. Quantitative analysis on the phase fraction in the solidified LLTO, as listed in Table 1, shows that the weight percentage of the LLTO phase increases from 90.0% when cooled at 10 K/s, to 93.2% at 30 K/s and to 95.0% at 60 K/s. Thus, it can be concluded that increasing cooling rate is beneficial to improving the phase purity of the solidification product.
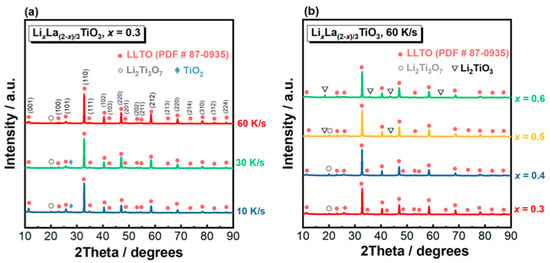
Figure 2.
XRD patterns of the solidified LixLa(2−x)/3TiO3 ceramics. (a) x = 0.3, solidified under different cooling rates; (b) varying x, solidified under 60 K/s.

Table 1.
Fraction of each phase in the solidified LixLa(2−x)/3TiO3 ceramics with varying cooling rates and lithium contents determined from XRD.
The XRD patterns of the LixLa(2−x)/2TiO3 ceramics with varying x solidified at a fix cooling rate of 60 K/s are presented in Figure 2b. For x = 0.3 and 0.4, the solidified products consist of LLTO as the main phase and Li2Ti3O7 as the secondary phase. When x increases to 0.5 and 0.6, additional peaks from Li2TiO3 can be identified from the XRD patterns. Peak intensity of the Li2TiO3 phase increases with increasing x. As also listed in Table 1, the weight percentage of the LLTO phase decreases continuously with increasing x, i.e., from 95.0% for x = 0.3 to 89.9% for x = 0.6. Therefore, a smaller x is beneficial to improving the phase purity of the solidification product when cooled at 60 K/s. Moreover, the intensity of the (001), (101) and (111) diffraction peaks of the LLTO phase is reduced with increasing x, suggesting the crystal structure has a tendency to change from tetragonal to pseudo-cubic.
To further analyze the crystal structure of the solidified LLTO samples, Raman spectroscopy measurements were carried out at room temperature and the results are presented in Figure 3. The Raman spectra for x = 0.3 solidified at different cooling rates show similar features, where six bands can be clearly identified on each spectrum (Figure 3a). The peaks located at ~142, 240, 320, 455, 528 and 586 cm−1 are attributed to the vibration modes in the tetragonal structure [41], among which the three prominent peaks at 142, 240 and 528 cm−1 are assigned to the Eg vibrations and those at ~320, 455 and 586 cm−1 belong to the A1g modes. The observed Raman spectra agree well with those reported in the literature [42,43,44]. Figure 3b shows the Raman spectra for the LLTO ceramics with different nominal Li contents (x) solidified at 60 K/s. With increasing x, two notable changes on the Raman spectra can be observed: (1) broadening and weakening of the peak at ~140 cm−1; (2) declined intensity of the A1g peak at ~320 cm−1. These two changes may be related to a mitigation effect caused by more Li occupation at the A-site which interrupts the symmetry of Ti-O bonding [45]. Broadening and reduced intensities of the Raman peaks with increasing Li content observed here agree with the previous report in lithium content-dependent Raman spectra [46,47]. Moreover, an additional peak at ~670 cm−1 is observed when x = 0.6. This may originate from the Li2TiO3 secondary phase, which shows an intensive Raman peak at 658 cm−1 [48].
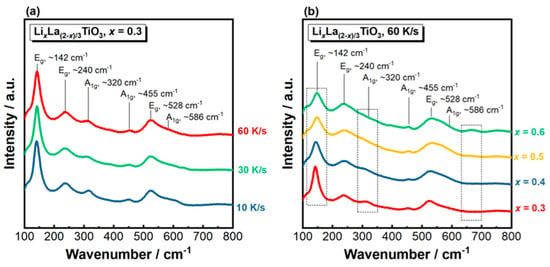
Figure 3.
Raman spectra of the solidified LixLa(2−x)/3TiO3 ceramics. (a) x = 0.3, solidified under different cooling rates; (b) varying x, solidified under 60 K/s.
Cross-sectional SEM images of the solidified LixLa(2−x)/3TiO3 ceramics are presented in Figure 4. For x = 0.3 solidified at different cooling rates (Figure 4a–c), the solidified LLTO show characteristics of dendrite-like microstructures, which are very different from the equiaxial grain structure commonly observed in sintered ceramics. With increasing x, the dendrite microstructure (x = 0.3 and 0.4, Figure 4c,d) changes to an irregular, ill-defined microstructure (x = 0.5, Figure 4e), and to a maze-like microstructure (x = 0.6, Figure 4f). The presence of the secondary phase can be clearly identified for x = 0.6 based on the contrast with the main phase. Thus, the nominal Li content, x, has a more significant impact on the microstructure than the cooling rate. It is worth mentioning that SEM observations on the two randomly selected samples for each composition/cooling rate show almost identical microstructures, suggesting negligible microstructural sample-to-sample variation at each condition.
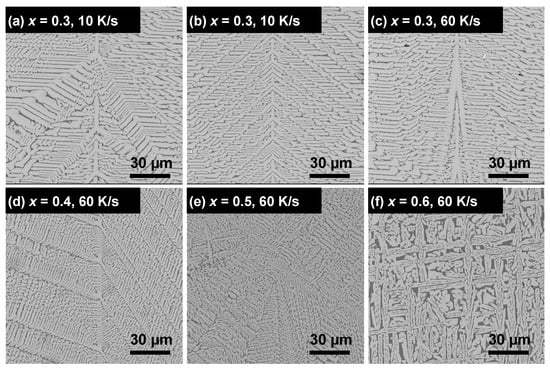
Figure 4.
Cross-sectional SEM images of the solidified LixLa(2−x)/3TiO3 ceramics with varying x and cooling rates. (a) x = 0.3, 10 K/s; (b) x = 0.3, 30 K/s; (c) x = 0.3, 60 K/s; (d) x = 0.4, 60 K/s; (e) x = 0.5, 60 K/s; (f) x = 0.6, 60 K/s.
Oxide materials are generally considered to follow a faceted growth mechanism to form facet crystals. The unique, dendrite-like microstructure observed in LLTO suggests a transition from faceted to non-faceted growth, which may be closely related to the large undercoolings achieved by ADL. A study is in progress to focus on the solidification kinetics to identify the critical undercooling required for dendritic formation.
The above XRD, Raman and SEM results suggest that x = 0.3 solidified at 60 K/s has the highest phase purity. To further identify the crystal structure of the main phase and the secondary phase of the solidification product, TEM analysis was carried out. As shown in Figure 5a, the HRTEM image of the main phase shows clearly resolved lattice fringes with an interplanar spacing of d = 0.274 nm corresponding to the (110) crystallographic plane of LLTO with a tetragonal structure. The SAED pattern shows diffraction dots from a superlattice structure (as indicated by the dashed green rectangle in the inset figure), which further confirms the tetragonal structure of the main phase. An HRTEM image of the secondary phase (Figure 5b) shows lattice fringes with d = 0.253 nm corresponding to the interplanar spacing of the (101) plane of Li2Ti3O7 with an orthorhombic structure, which is supported by the SAED pattern in the inset figure. These TEM results agree with the phase analysis from XRD.
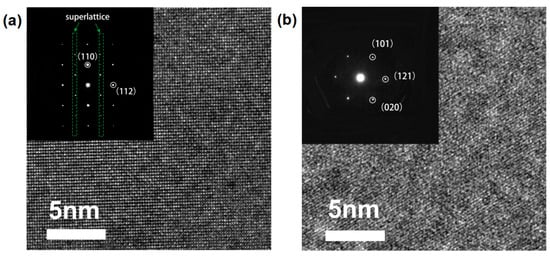
Figure 5.
HRTEM image and SAED pattern for the solidified LixLa(2−x)/3TiO3 (x = 0.3, 60 K/s): (a) the main phase; (b) the secondary phase.
As the LLTO ceramics were melted at high temperatures and subjected to rapid solidification, ICP analysis was performed to evaluate the Li loss during processing. The Li, La and Ti contents in the solidified LLTO ceramics cooled at 60 K/s determined by ICP are listed in Table 2. Small deviations in the Li content from the nominal values (x) can be observed. This suggests that Li loss during ADL solidification is reasonable, as the whole heating and solidification processes can be finished in ~30 s.

Table 2.
Li, La and Ti contents in the solidified LixLa(2−x)/3TiO3 ceramics cooled at 60 K/s determined by ICP.
3.2. Impedance Spectroscopy and Electrical Conductivity
To investigate the electrical properties of the solidified LixLa(2−x)/3TiO3 ceramics, impedance spectroscopy measurements were carried out. For each composition/cooling rate, two randomly selected samples were tested to evaluate the electrical sample-to-sample variation. Results show that impedance spectra of two measured samples show similar features, and the calculated conductivities of the two samples are overlapped on the Arrhenius plots, suggesting the negligible sample-to-sample variation for the solidified LLTO prepared from the same batch.
As the solidified ceramics present complex microstructures, impedance data were analyzed from various formalisms including the Z* plot (Nyquist plot), spectroscopic plots of the imaginary components of impedance (Z’’), imaginary component of electric modulus (M’’) and real component of the capacitance (C’), as they weigh impedance data differently and have different sensitivities to electrically active regions [49]. The Nyquist plot was used to overview the impedance responses with a special interest on the low-frequency electrode effect as evidence for ionic conduction. Z’’ and M’’ spectroscopic plots were combined to identify the bulk response from their peak positions, and C’-logf plots were used to further identify the different impedance components from the magnitude of the associated capacitance values. Y’ and the above parameters were combined to evaluate the quality of equivalent circuit fitting where applicable.
As the impedance spectra for some of the solidification products show similar features, here only two samples (x = 0.3, 60 K/s and x = 0.6, 60 K/s) with distinct microstructures and impedance responses are presented to avoid unnecessary repeat. Comprehensive analyses on their impedance spectra are described below.
- (1)
- x = 0.3, 60 K/s
As shown in Figure 6a, the Nyquist plot at room temperature features a small arc at high frequency and a large spike at low frequencies. Combined Z’’/M’’ spectroscopic plots, as shown in Figure 6b, exhibit a continuous rise in M’’ with increasing frequency when f ≥ 104 Hz and a Z’’ peak centered at 1.3 MHz, suggesting the high-frequency arc on the Nyquist plot originates from the bulk. The absence of an M’’ peak suggests the characteristic frequency, fmax, is beyond the highest measurement frequency (2 MHz). In the low-frequency range, i.e., f < 104 Hz, Z’’ increases continuously with decreasing frequency and the M’’-logf plot remains flat, showing the characteristic interface behavior such as a grain boundary response or an electrode effect. Furthermore, the C’-logf spectroscopic plot (Figure 6c) shows a high-frequency value of ~ 2.0 × 10⁻¹¹ F·cm−1 at 2 MHz corresponding to a capacitance value of 6.0 × 10⁻¹² F considering the sample geometry, which agrees with the magnitude of a bulk capacitance [50]. With decreasing frequency, C’ shows a continuous rise with the value approaching ~1.2 × 10⁻⁷ F·cm−1 (3.6 × 10⁻⁸ F) at 20 Hz, which is ~6000 times that of the bulk C’ value. As the grain boundary capacitance is usually 1–3 orders of magnitude larger than the bulk capacitance [51], such a high C’ value observed here is more likely to be indicative of the electrode effect associated with ionic conduction [50]. The Y’-logf plot (Figure 6d) shows an almost frequency-independent plateau over 103 and 105 Hz. In the lower frequency range, i.e., f < 103 Hz, a dispersion to low conductivities is observed, which is associated with the charge blocking at the sample–electrode interface [52]. At high frequencies, i.e., f > 105 Hz, a dispersion to higher conductivity values is observed and is attributable to Jonscher’s power law behavior of the bulk conductivity [53]. Based on the above analysis, it can be concluded that the high-frequency arc represents the bulk response, and the low-frequency spike corresponds to the electrode effect. Thus, the spectrum can be fitted by an equivalent circuit displayed in the inset figure in Figure 6a, where the parallel R1-constant phase element 1 (CPE1) element represents the bulk response, and the second parallel circuit represents the electrode effect. The fitting results agree well with the experimental data, as evaluated by the four formalisms shown in Figure 6a–d, giving confidence to the validity of the selected equivalent circuit. Grain boundary response is absent in the solidified ceramic. Thus, the bulk resistance equals the total resistance, as indicated by the arrow in Figure 6a.
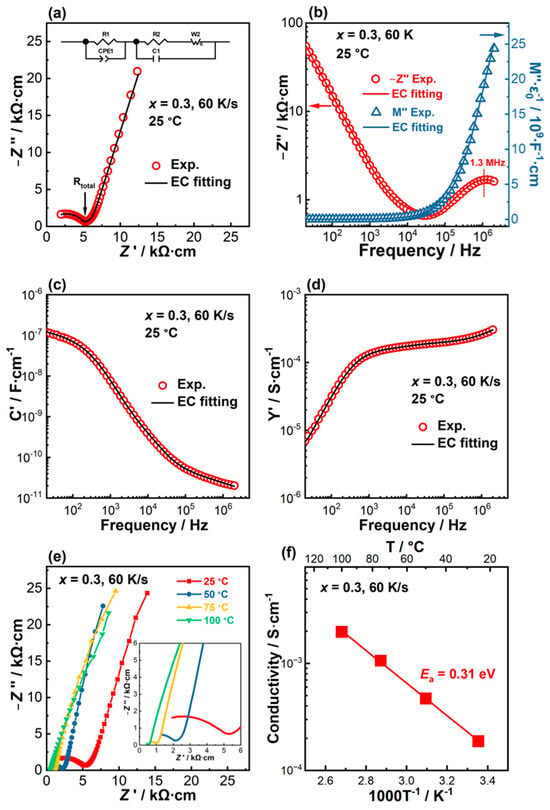
Figure 6.
Impedance spectra for x = 0.3 solidified at 60 K/s measured at room temperature. (a) Nyquist plot. The top inset figure is the equivalent circuit (EC) used for fitting. (b) Combined Z’’ and M’’-logf spectra; (c) C’-logf spectroscopic plot; (d) Y’-logf spectroscopic plot. The open symbols are the experimental data and the solid lines across the symbols are the EC fitting curves. (e) Nyquist plots measured between 25 and 100 °C. The inset figure is an expanded view of the dashed rectangular region. (f) Arrhenius plot and the associated activation energy.
At elevated temperatures, Nyquist plots are still predominated by a small arc representing the bulk response at high frequencies, and a large spike from the electrode effect at lower frequencies, as shown in Figure 6e. With increasing temperature, the size of the high-frequency arc is reduced (inset figure in Figure 6e). The total resistance, evaluated by the diameter of the high-frequency arc, is converted to conductivity and plotted as a function of the reciprocal of absolute temperature (Arrhenius plot, Figure 6f). Linear fitting of the conductivity-T−1 relationship gives an activation energy (Ea) of 0.31 eV. Without the grain boundary response, the solidified LLTO shows a high total conductivity with a room-temperature value of 1.9 × 10⁻⁴ S·cm−1.
- (2)
- x = 0.6, 60 K/s
Impedance spectra for x = 0.6 solidified at 60 K/s are displayed in Figure 7. As the room-temperature data at low frequencies are noisy, the impedance spectra measured at 50° are selected to present the features. As shown in Figure 7a, the Nyquist plot is predominated by a large distorted arc followed by a spike. An expanded view of the dashed rectangular region near the origin shows another poorly resolved, distorted arc at high frequencies (inset figure in Figure 7a). The M’’ spectroscopic plot (Figure 7b) shows a continuous increase with increasing frequency when f > 105 Hz, suggesting the presence of a response with a characteristic frequency >2 MHz. In the intermediate-frequency range, i.e., 103–105 Hz, a broad and poorly resolved peak is observed, which coincides with the Z’’ peak centered at 3.4 kHz on the Z’’-logf plot. The coincidence of the M’’ and Z’’ peaks suggests that the mid-frequency arc on the Nyquist plot is a bulk response, rather than a grain boundary response. The C’-logf spectroscopic plot (Figure 7c) shows a high-frequency value of ~ 2.0 × 10⁻¹¹ F·cm−1 at 2 MHz, which agrees with the magnitude of a bulk capacitance. In the intermediate-frequency range, C’ shows a plateau of ~3 × 10⁻¹⁰ F·cm−1, which is only one order of magnitude lower than that of the bulk C’ value. With a further decrease in the frequency, C’ shows a continuous rise with the value approaching 2.4 × 10⁻⁸ F·cm−1 at 20 Hz. The Y’-logf plot (Figure 7d) shows two weak frequency-dependent plateaus at f > 105 Hz and 102 Hz < f < 104 Hz, corresponding to the two bulk responses, respectively. The dispersion to low conductivities at f < 102 Hz is associated with the electrode effect. Combining the above, it can be concluded that the poorly resolved high-frequency arc represents a bulk response with high conductivity, the second intermediate-frequency arc represents a second bulk response with lower conductivity and the low-frequency spike corresponds to the electrode effect. Thus, the total resistance of the sintered ceramic equals the sum of the resistances of the two bulk responses, which can be roughly estimated by the Z’ value of the intersection of the second arc and the electrode spike, as indicated by the arrow in Figure 7a.
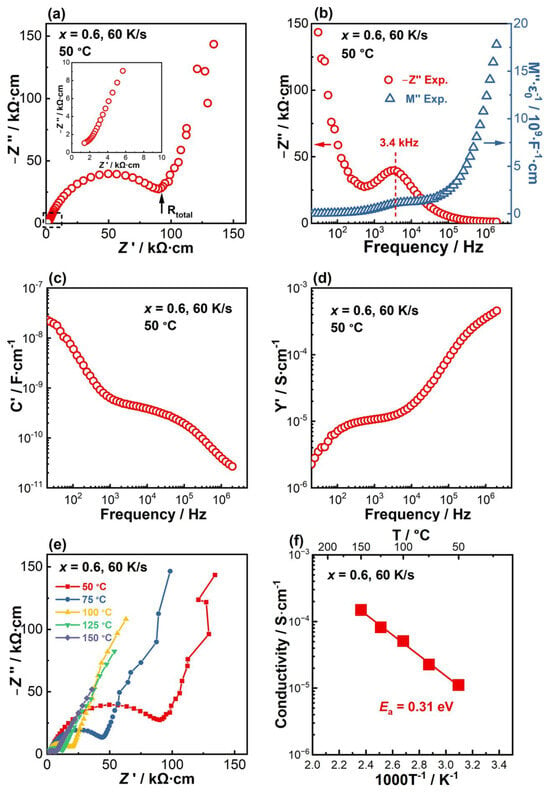
Figure 7.
Impedance spectra for x = 0.6 solidified at 60 K/s. (a) Nyquist plot measured at 50 °C. The inset figure is an expanded view of the high-frequency region marked by the dashed rectangle. (b) Combined Z’’ and M’’-logf spectra at 50 °C. (c) C’-logf spectroscopic plot at 50 °C. (d) Y’-logf spectroscopic plot at 50 °C. (e) Nyquist plots measured between 50 and 150 °C. (f) Arrhenius plot and the associated activation energy.
At elevated temperatures (e.g., 75–150 °C), Nyquist plots display similar features, showing a poorly resolved high-frequency bulk response, a well-defined arc at intermediate frequencies and a large spike from the electrode effect at lower frequencies (Figure 7e). With increasing temperature, the sizes of the high- and intermediate-frequency arcs are reduced. The total conductivity calculated from the total resistance shows a linear relationship with T−1, with an activation energy (Ea) of 0.31 eV (Figure 7f). With the presence of the second bulk response, the solidified LLTO shows a low total conductivity. The room-temperature value extrapolated from the Arrhenius plot is ~4.3 × 10⁻⁶ S·cm−1, which is ~ two orders of magnitude lower than the value shown in Figure 6f for x = 0.3, 60 K.
Arrhenius plots for the solidified LixLa(2−x)/3TiO3 cooled at 60 K/s, along with the conductivity values for LLTO collated from the literature, are presented in Figure 8. The conductivity values for the secondary phases identified by XRD including Li2Ti3O7 [54] and Li2TiO3 [55] are also included for later discussion. The following information can be extracted from Figure 8. First, the total conductivity of the solidified LixLa(2−x)/3TiO3 ceramics decreases slightly with increasing x when x varies between 0.3 and 0.5, but it shows a significant drop (~two orders of magnitude) when x increases to 0.6. This is related to the distinctly different microstructure features, which will be discussed later. Second, the solidified LixLa(2−x)/3TiO3 (0.3 ≤ x ≤ 0.5) show higher total conductivity values than those reported in the literature for sintered LLTO pellets. For example, Geng et al. [27] prepared a series of LLTO ceramics with nominal lithium contents. The total conductivity values for LLTO sintered at 1350 °C with nominal lithium content varying between 0.15 and 0.75 reside in the dashed region with the highest conductivity achieved when the lithium content is ~0.33 (as indicated by the open circles) and the lowest is ~0.12 (the open triangles). Lv et al. [35] prepared a Li0.33La0.557TiO3 pellet by hot pressing at 1000 °C, and reported a room-temperature conductivity ~1.8 × 10⁻⁵ S·cm−1 with an activation energy of 0.41 eV, as indicated by (2) in Figure 8. Mahfuz et al. [30] reported a room-temperature conductivity of 2.04 × 10⁻⁴ S·cm−1 for Li0.33La0.56TiO3 sintered at 1100 °C (indicated by the ‘+’ symbol). However, it is also noticed that although the grain boundary response is absent, the total conductivity values for the solidified LixLa(2−x)/3TiO3 (0.3 ≤ x ≤ 0.5) ceramics are lower than the bulk conductivity values reported by previous studies; for example, ~8.7 × 10⁻⁴ S·cm−1 at room temperature for Li0.33La0.56TiO3 sintered at 1220 °C for 6 h (as indicated by the ‘’ symbol) reported by Jiang et al. [31], and ~1.0 × 10⁻³ S·cm−1 reported in an earlier work by Inaguma et al. [11] for Li0.34La0.51TiO2.94 sintered at 1350 °C for 6 h. This might be related to the presence of a Li-rich secondary phase, as also discussed below. Third, the solidified LLTO ceramics show significantly higher conductivity than that for LaTiO3 [56]. This gives additional evidence to the ICP results that exposure at high temperature for several seconds during solidification will not cause severe lithium loss.
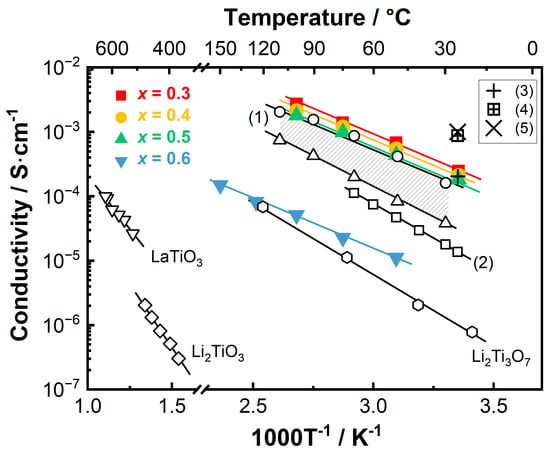
Figure 8.
Arrhenius plots for the solidified LixLa(2−x)/3TiO3 ceramics cooled at 60 K/s in comparison with the conductivities for LLTO collated from literature. In the figure, the dashed region marked with (1) represents the total conductivities of LLTO ceramics sintered at 1350 °C extracted from Ref. [27]; (2) represents the total conductivity of an LLTO pellet extracted from Ref. [35]. The ‘+’, ‘’ and ‘×’ symbols represent the room-temperature conductivities reported in Refs. [11,30,31], respectively. Conductivity values for Li2Ti3O7, Li2TiO3 and LaTiO3 were extracted from Refs. [54,55,56], respectively.
The microstructure–conductivity relationship of the solidified LLTO ceramics is illustrated in Figure 9. For x = 0.3 cooled at 60 K/s, the ceramic shows a dendrite-like microstructure with LLTO as the main phase and Li2Ti3O7 as the secondary phase. Li2Ti3O7 has a conductivity ~three orders of magnitude lower than the main phase [33] (Figure 8). As illustrated by the schematic diagram in Figure 9a, the LLTO dendrites are interconnected and the less-conductive Li2Ti3O7 secondary phase is isolated by the LLTO main phase. Thus, the conductive main phase and the less conductive secondary phase form a parallel circuit, and the conductive phase provides an easy path for electrical conduction. The electrical current is predominated by the conductive LLTO phase; as a result, the impedance spectrum only shows the response from the main phase, along with the electrode effect. In contrast, for x = 0.6 cooled at 60 K/s, the ceramic presents a maze-like microstructure with LLTO as the main phase and Li2TiO3 as the secondary phase, as illustrated by the schematic figure in Figure 9b. Li2TiO3 is an insulator with a very low conductivity of ~5 × 10⁻⁷ S·cm−1 at 400 °C [34] (Figure 8). The conductive LLTO main phase and the insulating Li2TiO3 secondary phase, both with complex morphologies, are alternatively arranged in space. The conductive main phase and the insulating secondary phase form a series circuit, and the electrical current passing through LLTO is impeded by the insulating Li2TiO3 secondary phase. Thus, the impedance spectrum shows the responses from both LLTO and Li2TiO3, along with the electrode effect. It can be concluded that the ceramic microstructure is critical to the total conductivity. High conductivity can be achieved in the unique dendrite-like microstructure obtained by rapid solidification.
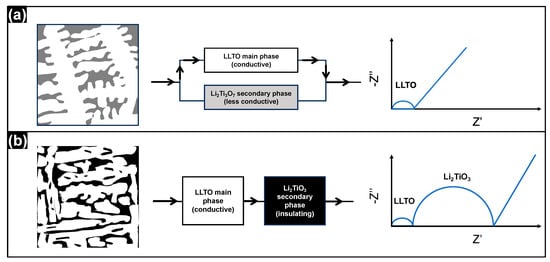
Figure 9.
Schematic diagrams of microstructure (left), conduction path (middle) and impedance response (right) of the solidified LLTO ceramics. (a) Dendrite-like microstructure; (b) maze-like microstructure. The arrows in the middle figures indicate the predominant current flow.
3.3. Young’s Modulus and Hardness
Besides the electrical conductivity, mechanical properties are also important for solid electrolyte materials [57]. Here we evaluated the Young’s modulus (E) and hardness (H) of the solidified LLTO ceramics by nano-indentation. The load–displacement curves for x = 0.3 solidified at different cooling rates are shown in Figure 10a, and the calculated E and H values are presented in Figure 10b. At all cooling rates, the solidified LLTO ceramics show high E values > 200 GPa, and high H values > 12 GPa. Notably, for the sample cooled at 60 K/s, E reaches 246 GPa and H reaches 16.7 GPa. Table 3 lists E and H values of LLTO ceramics reported in previous studies [58,59,60]. Admittedly, as E and H values depend on the testing method, it might be difficult to make a direct comparison of the values obtained by different methods. Nevertheless, the solidified LLTO ceramics show excellent mechanical properties, possibly due to their unique dendrite-like, dual-phase microstructure. Further study is in progress to establish the relationship between mechanical properties and solidification of microstructures.
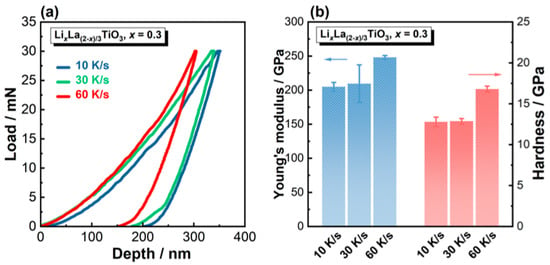
Figure 10.
Mechanical properties of the LixLa(2−x)/3TiO3 (x = 0.3) ceramics solidified at different cooling rates. (a) Load–displacement profiles during nano-indentation tests; (b) Young’s modulus and hardness. Error bars are from ten indentations on each sample.

Table 3.
Young’s modulus and hardness values of the solidified Li0.33La0.57TiO3 ceramics in comparison with literature data.
4. Conclusions
In this work, dense LLTO ceramics were prepared by an aerodynamic levitation (ADL) containerless solidification method. Evolution of the phase composition, crystal structure, microstructure, electrical and mechanical properties with varying cooling rates and Li contents was investigated. Major conclusions are listed below.
- (1)
- The phase composition of the solidified LLTO depends on the nominal Li content (x in LixLa(2−x)/3TiO3) and the cooling rate during solidification. At the optimal conditions, the solidification product consists of LLTO with a tetragonal structure as the main phase, and a small amount of Li2Ti3O7 as the secondary phase.
- (2)
- The nominal Li content has a dramatic impact on the microstructure of the solidification product. With increasing x, the ceramic microstructure changes from a dendrite-like microstructure, to an irregular, ill-defined microstructure and to a maze-like microstructure.
- (3)
- Microstructure has a critical role on the total electrical conductivity of the solidified ceramics. LLTO ceramics with a dendrite-like microstructure show a high total conductivity of 2.5 × 10⁻⁴ S·cm−1 at room temperature, which is among the highest values reported in the literature.
- (4)
- The solidified ceramics also show excellent mechanical properties such as a high Young’s modulus of 240 GPa and a high hardness of 16.7 GPa.
- (5)
- Deep undercooling rapid solidification is an effective processing method to manipulate the microstructure of LLTO ceramics to minimize the GBs’ contribution to the total conductivity, and to enhance the modulus and hardness to benefit their applications as solid electrolytes in ASSLIBs. The processing method may expand to tune the microstructure of other lithium-ion conductors to improve their electrical and mechanical properties.
- (6)
- ADL provides a fast and powerful technique to obtain diverse microstructures for studying/establishing the microstructure–property relationship in a variety of ceramic materials for research purposes. The samples prepared by ADL are small but future large-scale production may be possible by upgrading the ADL facility to suspend bigger samples if technical challenges are solved. The important message from this work is that high conductivity can be obtained in LLTO (and may be other ceramics) with a dendrite-like microstructure. It might be possible to achieve such a microstructure using other rapid solidification methods such as 3D printing, and further investigations are in progress.
Author Contributions
Conceptualization, F.Y. and Q.H.; methodology, Y.H.; software, Y.H.; validation, Y.H., F.Y. and Q.H.; formal analysis, Y.H. and F.Y.; investigation, Y.H.; resources, Q.H.; data curation, Y.H. and F.Y.; writing—original draft preparation, Y.H.; writing—review and editing, F.Y. and Q.H.; visualization, Y.H.; supervision, F.Y., J.L. and Q.H.; project administration, Q.H.; funding acquisition, Q.H. All authors have read and agreed to the published version of the manuscript.
Funding
This research was funded by [National Natural Science Foundation of China] grant number [52234010].
Data Availability Statement
The original contributions presented in this study are included in the article material. Further inquiries can be directed to the corresponding authors.
Acknowledgments
The authors acknowledge the Instrumental Analysis Center, Shanghai Jiao Tong University for providing characterization facilities, and the staff there for their help and useful discussions during tests.
Conflicts of Interest
The authors declare no conflicts of interest.
References
- Janek, J.; Zeier, W.G. A solid future for battery development. Nat. Energy 2016, 1, 16141. [Google Scholar] [CrossRef]
- Zheng, F.; Kotobuki, M.; Song, S.; Lai, M.O.; Lu, L. Review on solid electrolytes for all-solid-state lithium-ion batteries. J. Power Sources 2018, 389, 198–213. [Google Scholar] [CrossRef]
- Randau, S.; Weber, D.A.; Kotz, O.; Koerver, R.; Braun, P.; Weber, A.; Ivers-Tiffee, E.; Adermann, T.; Kulisch, J.; Zeier, W.G.; et al. Benchmarking the performance of all-solid-state lithium batteries. Nat. Energy 2020, 5, 259–270. [Google Scholar] [CrossRef]
- Famprikis, T.; Canepa, P.; Dawson, J.A.; Islam, M.S.; Masquelier, C. Fundamentals of inorganic solid-state electrolytes for batteries. Nat. Mater. 2019, 18, 1278–1291. [Google Scholar] [CrossRef] [PubMed]
- Han, G.; Vasylenko, A.; Daniels, L.M.; Collins, C.M.; Corti, L.; Chen, R.; Niu, H.; Manning, T.D.; Antypov, D.; Dyer, M.S.; et al. Superionic lithium transport via multiple coordination environments defined by two-anion packing. Science 2024, 383, 739–745. [Google Scholar] [CrossRef] [PubMed]
- Balaish, M.; Gonzales-Rosillo, J.C.; Kim, K.J.; Zhu, Y.; Hood, Z.D.; Rupp, J.L.M. Processing thin but robust electrolytes for solid-state batteries. Nat. Energy 2021, 6, 227–239. [Google Scholar] [CrossRef]
- Liu, D.; Zhu, W.; Feng, Z.; Guerfi, A.; Vijh, A.; Zaghib, K. Recent progresses in sulfide-based solid electrolytes for Li-ion batteries. Mater. Sci. Eng. B 2016, 213, 169–176. [Google Scholar] [CrossRef]
- Wang, C.; Liang, J.; Kim, J.T.; Sun, X. Prospects of halide-based all-solid-state batteries: From material design to practical application. Sci. Adv. 2022, 8, eadc9516. [Google Scholar] [CrossRef]
- Wang, H.; Sheng, L.; Yasin, G.; Wang, L.; Xu, H.; He, X. Reviewing the current status and development of polymer electrolytes for solid-state lithium batteries. Energy Storage Mater. 2020, 33, 188–215. [Google Scholar] [CrossRef]
- Chen, C.; Du, J. Lithium ion diffusion mechanism in lithium lanthanum titanate solid-state electrolytes from atomistic simulations. J. Am. Ceram. Soc. 2015, 98, 534–542. [Google Scholar] [CrossRef]
- Inaguma, Y.; Liquan, C.; Itoh, M.; Nakamura, T.; Uchida, T.; Ikuta, H.; Wakihara, M. High ionic conductivity in lithium lanthanum titanate. Solid State Commun. 1993, 86, 689–693. [Google Scholar] [CrossRef]
- Okos, A.; Mocioiu, A.; Dragut, D.V.; Matei, A.C.; Bogdanescu, C. Hydrothermal synthesis of lithium lanthanum titanate. Crystals 2021, 15, 241. [Google Scholar] [CrossRef]
- Luo, C.; Shen, Y.; Zhang, S.; Han, C.; Chen, H. Smoothing Li transport via weak metal-O bonds for improved ionic mobility in lithium lanthanum titanium oxide. Mater. Today Phys. 2025, 53, 101704. [Google Scholar] [CrossRef]
- Gao, C.; Zhou, X.; Yu, R.; Li, C.; Gao, X.; Yang, W.; Chao, D.; Chen, Y. Synergistic modulation of grain boundary and domain boundary enhances the ionic conductivity of Li0.33La0.56TiO3 solid electrolyte. ACS Nano 2025, 19, 10902–10911. [Google Scholar] [CrossRef]
- Araki, W.; Saito, K.; Arai, Y. First-principles study of the deformation and migration mechanisms of Li-La-Ti-O perovskite under uniaxial stress. Solid State Ion. 2025, 421, 116789. [Google Scholar] [CrossRef]
- Chambers, M.S.; Chen, J.; Sacci, R.L.; MaAuliffe, R.D.; Sun, W.; Veith, G.M. Memory effect on the synthesis of perovskite-type Li-ion conductor LixLa2/3-x/3TiO3 (LLTO). Chem. Mater. 2024, 36, 1197–1213. [Google Scholar] [CrossRef]
- Kou, W.; Zhang, J.; Wang, C.; Wu, W.; Zhang, J.; Yang, Z.; Dai, K.; Wang, J. Oriented crystal growth of Li0.33La0.557TiO3 nanowire induced by one-dimensional polymer sheath toward rapid lithium-ion transfer. ACS Nano 2024, 18, 27683–27693. [Google Scholar] [CrossRef]
- Dato, M.A.; Hu, L.; McElheny, D.; Cabana, J. One-step solvothermal synthesis of perovskite-type Li3xLa2/3−x□1/3−2xTiO3 nanomaterials. Chem. Mater. 2024, 36, 8349–8358. [Google Scholar] [CrossRef]
- Hasegawa, G.; Kuwata, N.; Hashi, K.; Tanaka, Y.; Takada, K. Lithium-ion diffusion in perovskite-type solid electrolyte lithium lanthanum titanate revealed by pulsed-filed gradient nuclear magnetic resonance. Chem. Mater. 2023, 35, 3815–3824. [Google Scholar] [CrossRef]
- Lu, X.; Duan, M.; Li, J. Increase of the ionic conductivity of peroskite-type lithium-ion conductor by bacteria cellulose templating. Ceram. Int. 2023, 49, 24981–24988. [Google Scholar] [CrossRef]
- Xu, L.; Zhang, L.; Hu, Y.; Luo, L. Structural origin of low Li-ion conductivity in perovskite solid-state electrolyte. Nano Energy 2022, 92, 106758. [Google Scholar] [CrossRef]
- Ma, C.; Chen, K.; Liang, C.; Nan, C.; Ishikawa, R.; More, K.; Chi, M. Atomic-scale origin of the large grain-boundary resistance in perovskite Li-ion-conducting solid electrolytes. Energy Environ. Sci. 2014, 7, 1638–1642. [Google Scholar] [CrossRef]
- Wu, J.; Guo, X. Origin of the low grain boundary conductivity in lithium ion conducting perovskites: Li3xLa0.67-xTiO3. Phys. Chem. Chem. Phys. 2017, 19, 5880–5887. [Google Scholar] [CrossRef] [PubMed]
- Sasano, S.; Ishikawa, R.; Sanchez-Santolino, G.; Ohta, H.; Shibata, N.; Ikuhara, Y. Atomistic origin of Li-ion conductivity reduction at (Li3xLa2/3-x)TiO3 grain boundary. Nano Lett. 2021, 21, 6282–6288. [Google Scholar] [CrossRef] [PubMed]
- Peng, S.; Chen, Y.; Zhou, X.; Tang, M.; Wang, J.; Wang, H.; Guo, L.; Huang, L.; Yang, W.; Gao, X. Atomistic origin of high grain boundary resistance in solid electrolyte lanthanum lithium titanate. J. Mater. 2024, 10, 1214–1221. [Google Scholar] [CrossRef]
- Sasano, S.; Ishikawa, R.; Kawahara, K.; Kimura, T.; Ikuhara, Y.H.; Shibata, N.; Ikuhara, Y. Grain boundary Li-ion conductivity in (Li0.33La0.56)TiO3 polycrystal. Appl. Phys. Lett. 2020, 116, 043901. [Google Scholar] [CrossRef]
- Geng, H.; Lan, J.; Mei, A.; Lin, Y.; Nan, C.W. Effect of sintering temperature on microstructure and transport properties of Li3xLa2/3-xTiO3 with different lithium contents. Electrochim. Acta 2011, 56, 3406–3414. [Google Scholar] [CrossRef]
- Inaguma, Y.; Chen, L.; Itoh, M.; Nakamura, T. Candidate compounds with perovskite structure for high lithium ionic conductivity. Solid State Ion. 1994, 70–71 Pt 1, 196–202. [Google Scholar] [CrossRef]
- Huang, Y.; He, L.; Zhu, X. Low temperature synthesis of Li0.33La0.55TiO3 solid electrolyte with Al3+ doping by a modified Pechini method. Ionics 2022, 28, 1739–1751. [Google Scholar] [CrossRef]
- Mahfuz, M.N.; Nura, A.F.; Islam, M.S.; Saha, T.; Chowdhury, K.R.; Hoque, S.M.; Gafur, M.A.; Ahmed, A.N.; Sharif, A. Ga-doped in Li0.33La0.56TiO3: A promising approach to boost ionic conductivity in solid electrolytes for high-performance all-solid-state lithium-ion batteries. RSC Adv. 2025, 15, 1060–1071. [Google Scholar] [CrossRef]
- Jiang, B.; Li, Y.; Li, K.; Guo, X.; Yuan, J.; Kwame, Y.E. Research on optimizing the crystal structure and enhancing the performance of LLTO solid electrolyte through doping with high-electronegativity Fe3+. J. Eur. Ceram. Soc. 2025, 45, 117368. [Google Scholar] [CrossRef]
- Jonderian, A.; Peng, R.; Davies, D.; MaCalla, E. Benefits and limitations of 226 substitutions into Li-La-Ti-O perovskites. Chem. Mater. 2023, 35, 6227–6234. [Google Scholar] [CrossRef]
- Wu, Z.; Wu, Z.; Wang, Z.; Peng, Y.; Li, Z.; Huang, Z.; Mei, W.; Liu, D.; Li, M.; Zhou, W.; et al. Effect of Bi2O3 on the ion migration and interfacial properties of Li0.33La0.557TiO3 solid electrolytes. Corros. Sci. 2023, 224, 111473. [Google Scholar] [CrossRef]
- Wang, L.; Shi, Z.; Feng, X.; Zhang, J.; Hu, G.; Zhang, H.; Han, Q.; Zhang, Q. Boosting electrochemical properties of Li0.33La0.55TiO3-based electrolytes with Ag incorporation. J. Alloys Compd. 2024, 981, 173720. [Google Scholar] [CrossRef]
- Lv, R.; Kou, W.; Guo, S.; Wu, W.; Zhang, Y.; Wang, Y.; Wang, J. Preparing two-dimensional ordered Li0.33La0.557TiO3 crystal in interlayer channel of thin laminar inorganic solid-state electrolyte towards ultrafast Li+ transfer. Angew. Chem. Int. Ed. 2022, 134, e202114220. [Google Scholar] [CrossRef]
- Stramare, S.; Thangadurai, V.; Weppner, W. Lithium lanthanum titanates: A review. Chem. Mater. 2003, 15, 3974–3990. [Google Scholar] [CrossRef]
- Leyet, Y.; Guerrero, F.; Anglada-Rivera, J.; Martinez, I.; Amorin, H.; Romaguera-Barcelay, Y.; Poyato, R.; Gallardo-Lopez, A. Obtention of Li3xLa2/3-xTiO3 ceramics from amorphous nanopowders by spark plasma sintering. Ferroelectrics 2016, 498, 62–66. [Google Scholar] [CrossRef]
- Pereira, J.S.; Guerrero, F.; Romaguera-Barcelay, Y.; Anglada-Rivera, J.; Sales, J.C.C., Jr.; Silva, R.S.; Zulueta, Y.; Poyato, R.; Gallardo, A.; Almeida, A.J. Agostinho Moreira and Y. Leyet. La0.59Li0.24TiO3 ceramics obtained by spark plasma sintering: Electric behavior analysis. Mater. Res. Express 2019, 6, 015504. [Google Scholar] [CrossRef]
- Avila, V.; Yoon, B.; Neto, R.R.I.; Silva, R.S.; Ghose, S.; Raj, R.; Jesus, L.M. Reactive flash sintering of the complex oxide Li0.5La0.5TiO3 starting from an amorphous precursor powder. Scr. Mater. 2020, 176, 78–82. [Google Scholar] [CrossRef]
- Lin, C.; Ihrig, M.; Kung, K.; Chen, H.; Scheld, W.S.; Ye, R.; Finsterbusch, M.; Guillon, O.; Lin, S. Low-temperature sintering of Li0.33La0.55TiO3 electrolyte for all-solid-state Li batteries. J. Eur. Ceram. Soc. 2023, 43, 7543–7552. [Google Scholar] [CrossRef]
- Romero, M.; Faccio, R.; Vazquez, S.; Davyt, S.; Mombru, A.W. Experimental and theoretical Raman study on the structure and microstructure of Li0.30La0.57TiO3 electrolyte prepared by the sol-gel method in acetic medium. Ceram. Int. 2016, 42, 15414–15422. [Google Scholar] [CrossRef]
- Lakshmanan, A.; Gurusamy, R.; Ramani, A.; Srinivasan, N.; Venkatachalam, A. Densification effect of perovskite-type Li3xLa2/3-xTiO3 solid-state electrolytes for energy storage applications. Ceram. Int. 2024, 50, 30240–30251. [Google Scholar] [CrossRef]
- Mei, A.; Wang, X.; Feng, Y.; Zhao, S.; Li, G.; Geng, H.; Lin, Y.; Nan, C. Enhanced ionic transport in lithium lanthanum titanium oxide solid state electrolyte by introducing silica. Solid State Ion. 2008, 179, 2255–2259. [Google Scholar] [CrossRef]
- Trong, L.D.; Thao, T.T.; Dinh, N.N. Characterization of the Li-ionic conductivity of La(2/3-x)Li3xTiO3 ceramics used for all-solid-state batteries. Solid State Ion. 2015, 278, 228–232. [Google Scholar] [CrossRef]
- Guo, X.; Maram, P.S.; Navrotsky, A. A correlation between formation enthalpy and ionic conductivity in perovskite-structured Li3xLa0.67-xTiO3 solid lithium ion conductors. J. Mater. Chem. A 2017, 5, 12951–12957. [Google Scholar] [CrossRef]
- Varez, A.; Sanjuan, M.L.; Laguna, M.A.; Pena, J.I.; Sanz, J.; de la Fuente, G.F. Microstructural development of the Li0.5Li0.5TiO3 lithium ion conductor processed by the laser floating zone (LFZ) method. J. Mater. Chem. 2001, 11, 125–130. [Google Scholar] [CrossRef]
- Le, H.T.T.; Kalubarme, R.S.; Ngo, D.T.; Yang, S.; Jung, K.; Shin, K.; Park, C. Citrate gel synthesis of aluminum-doped lithium lanthanum titanate solid electrolyte for application in organic-type lithium-oxygen batteries. J. Power Sources 2015, 274, 1188–1199. [Google Scholar] [CrossRef]
- Qi, Q.; Wang, J.; Xiang, M.; Zhang, Y.; Gu, S.; Luo, G. Mechanism of vacuum-annealing defects and its effect on release behavior of hydrogen isotopes in Li2TiO3. Int. J. Hydrogen Energy 2018, 43, 11295–12301. [Google Scholar] [CrossRef]
- Heath, J.P.; Harding, J.H.; Sinclair, D.C.; Dean, J.S. The analysis of impedance spectra for core-shell microstructures: Why a multiformalism approach is essential. Adv. Funct. Mater. 2019, 29, 1904036. [Google Scholar] [CrossRef]
- Irvine, J.T.S.; Sinclair, D.C.; West, A.R. Electroceramics: Characterization by impedance spectroscopy. Adv. Mater. 1990, 2, 132–138. [Google Scholar] [CrossRef]
- Dong, B.; Yan, J.; Walkley, B.; Inglis, K.K.; Blanc, F.; Hull, S.; West, A.R. Synthesis and characterisation of the new oxyfluoride Li+ ion conductor, Li5SiO4F. Solid State Ion. 2018, 327, 64–70. [Google Scholar] [CrossRef]
- Dong, B.; Jarkaneh, R.; Hull, S.; Reeves-McLaren, N.; Biendicho, J.J.; West, A.R. Synthesis, structure and electrical properties of N-doped Li3VO4. J. Mater. Chem. A 2016, 4, 1408–1413. [Google Scholar] [CrossRef]
- Jonscher, A.K. The ‘universal’ dielectric response. Nature 1977, 267, 673–679. [Google Scholar] [CrossRef]
- Boyce, J.B.; Mikkelsen, J.C., Jr. Anisotropic conductivity in a channel-structured superionic conductor: Li2Ti3O7. Solid State Commun. 1979, 31, 741–745. [Google Scholar] [CrossRef]
- Dash, U.; Sahoo, S.; Chaudhuri, P.; Parashar, S.K.S.; Parashar, K. Electrical properties of bulk and nano Li2TiO3 ceramics: A comparative study. J. Adv. Ceram. 2014, 3, 89–97. [Google Scholar] [CrossRef]
- Bradha, M.; Hussain, S.; Chakravarty, S.; Amarendra, G.; Ashok, A. Total conductivity in Sc-doped LaTiO3+δ perovskites. Ionics 2014, 20, 1343–1350. [Google Scholar] [CrossRef]
- Shoko, E.; Dang, Y.; Han, G.; Duff, B.B.; Dyer, M.S.; Daniels, L.M.; Chen, R.; Blanc, F.; Claridge, J.B.; Rosseinsky, M. Polymorph of LiAlP2O7: Combined computational, synthetic, crystallographic, and ionic conductivity study. Inorg. Chem. 2021, 60, 14083–14095. [Google Scholar] [CrossRef]
- Cho, Y.; Wolfenstine, J.; Rangasamy, E.; Kim, H.; Choe, H.; Sakamoto, J. Mechanical properties of the solid Li-ion conducting electrolyte: Li0.33La0.57TiO3. J. Mater. Sci. 2012, 47, 5970–5977. [Google Scholar] [CrossRef]
- Schell, K.G.; Lemke, F.; Bucharsky, E.C.; Hintennach, A.; Hoffmann, M.J. Microstructure and mechanical properties of Li0.33La0.567TiO3. J. Mater. Sci. 2017, 52, 2232–2240. [Google Scholar] [CrossRef]
- Cooper, C.; Sutorik, A.C.; Wright, J.; Arthur Luoto, E., III; Gilde, G.; Wolfenstine, J. Mechanical properties of hot isostatically pressed Li0.33La0.55TiO3. Adv. Eng. Mater. 2014, 16, 755–759. [Google Scholar] [CrossRef]
Disclaimer/Publisher’s Note: The statements, opinions and data contained in all publications are solely those of the individual author(s) and contributor(s) and not of MDPI and/or the editor(s). MDPI and/or the editor(s) disclaim responsibility for any injury to people or property resulting from any ideas, methods, instructions or products referred to in the content. |
© 2025 by the authors. Licensee MDPI, Basel, Switzerland. This article is an open access article distributed under the terms and conditions of the Creative Commons Attribution (CC BY) license (https://creativecommons.org/licenses/by/4.0/).