1. Introduction
Launching the high-speed rotating projectile results in an impact load surpassing 10,000 g, potentially causing harm to delicate components and leading to functional failure [
1]. As a result, suitable anti-impact measures must be selected to maintain the structure’s normal operation. Potting, isolation, and buffering are the primary technologies used to counteract impact at present. Figovsky et al. [
2] utilized polydiene polyurethane adhesive on electronic components, resulting in device consolidation and enhanced resilience to external shocks and vibrations. However, this technology is typically used in electronic components and is unsuitable for moving parts. A guided projectile has successfully integrated overload protection for weak components using isolation technology [
3], but due to its complex structure and space requirements, it is not suitable for structural integrated design. Therefore, the most commonly used method for impact protection is choosing the appropriate buffer structure.
Buffer structures commonly use honeycomb structures and structures with negative Poisson’s ratios due to their unique mechanical properties. Xia et al. [
4] created an AlSi10Mg honeycomb sandwich column buffer structure that has been shown to provide significant impact protection. Yu et al. [
5] studied the impact resistance of four bionic honeycomb structures (CH, ZPRH, SCH, and IBE) and found that ZPRH, SCH, and IBE structures demonstrated excellent impact resistance. Ji et al. [
6] analyzed the dynamic buffering and energy absorption properties of corrugated honeycomb composite sandwich structures in drop impact tests. Chang et al. [
7] tested the impact resistance and energy absorption of warp knitted fabrics with a negative Poisson’s ratio, finding that a larger absolute value of the negative Poisson’s ratio improved energy absorption and impact resistance. Zhang et al. [
8] investigated the impact mechanical properties of a new negative Poisson’s ratio lattice core interlayer composite structure. Wang et al. [
9] developed a new three-dimensional concave negative Poisson’s ratio structure and studied its impact behavior using a drop hammer machine and numerical simulation. The structures mentioned above may possess good impact resistance; however, they also exhibit low strength and a significant contact area post deformation. Consequently, this can result in contact friction torque when utilized in high-speed rotating bodies, ultimately impacting the performance of the control components.
Wen et al. [
10,
11] studied the fragmentation morphology of spheres impacting thin plates, determining the correlation between damage and impact velocity, as well as the plate thickness/sphere diameter ratio. They then examined the failure evolution of aluminum spheres impacting thin aluminum plates at hypervelocity and analyzed the connection between this process and the debris cloud. Piekutowski et al. [
12,
13] conducted experiments on spheres impacting aluminum plates at different speeds, establishing the relationship between impact velocity and the bumper thickness/projectile diameter ratio by analyzing X-ray films of fragment clouds. Subsequent tests determined the initial fracture threshold for aluminum spheres hitting aluminum plates at ultra-high speeds. Watson et al. [
14] used the discrete element method to simulate a sphere impact on a thin plate and examined the features of the resulting fragment cloud. Gong et al. [
15] investigated the ionization theory related to high-speed collisions between spherical aluminum alloy projectiles and aluminum alloy targets. They established theoretical frameworks for both primary and secondary collisions. While earlier studies focused on the crushing behavior of single spheres during high-speed impacts on thin plates, less consideration has been given to the sphere’s function as a buffering component or its deformation modes under projectile impact loading.
This article discusses the need for buffer structures in high-speed rotating bodies that can provide impact resistance and have a small contact area. A buffer structure with annularly distributed multi-sphere point contacts is designed based on Hertz contact theory. This structure is able to undergo plastic deformation to withstand impact and protect sensitive components from damage. The contact area after deformation is concentrated in the localized region where point contact occurs. The structure is made using WE43 magnesium alloy materials known for their good energy absorption properties. A finite element model was created using Abaqus/Explicit and validated through hydraulic shock tests. The impact resistance performance of the structure was analyzed by studying the effects of the diameter, quantity, and cavity radius of the hemispheres.
2. Structure Design
2.1. Theory
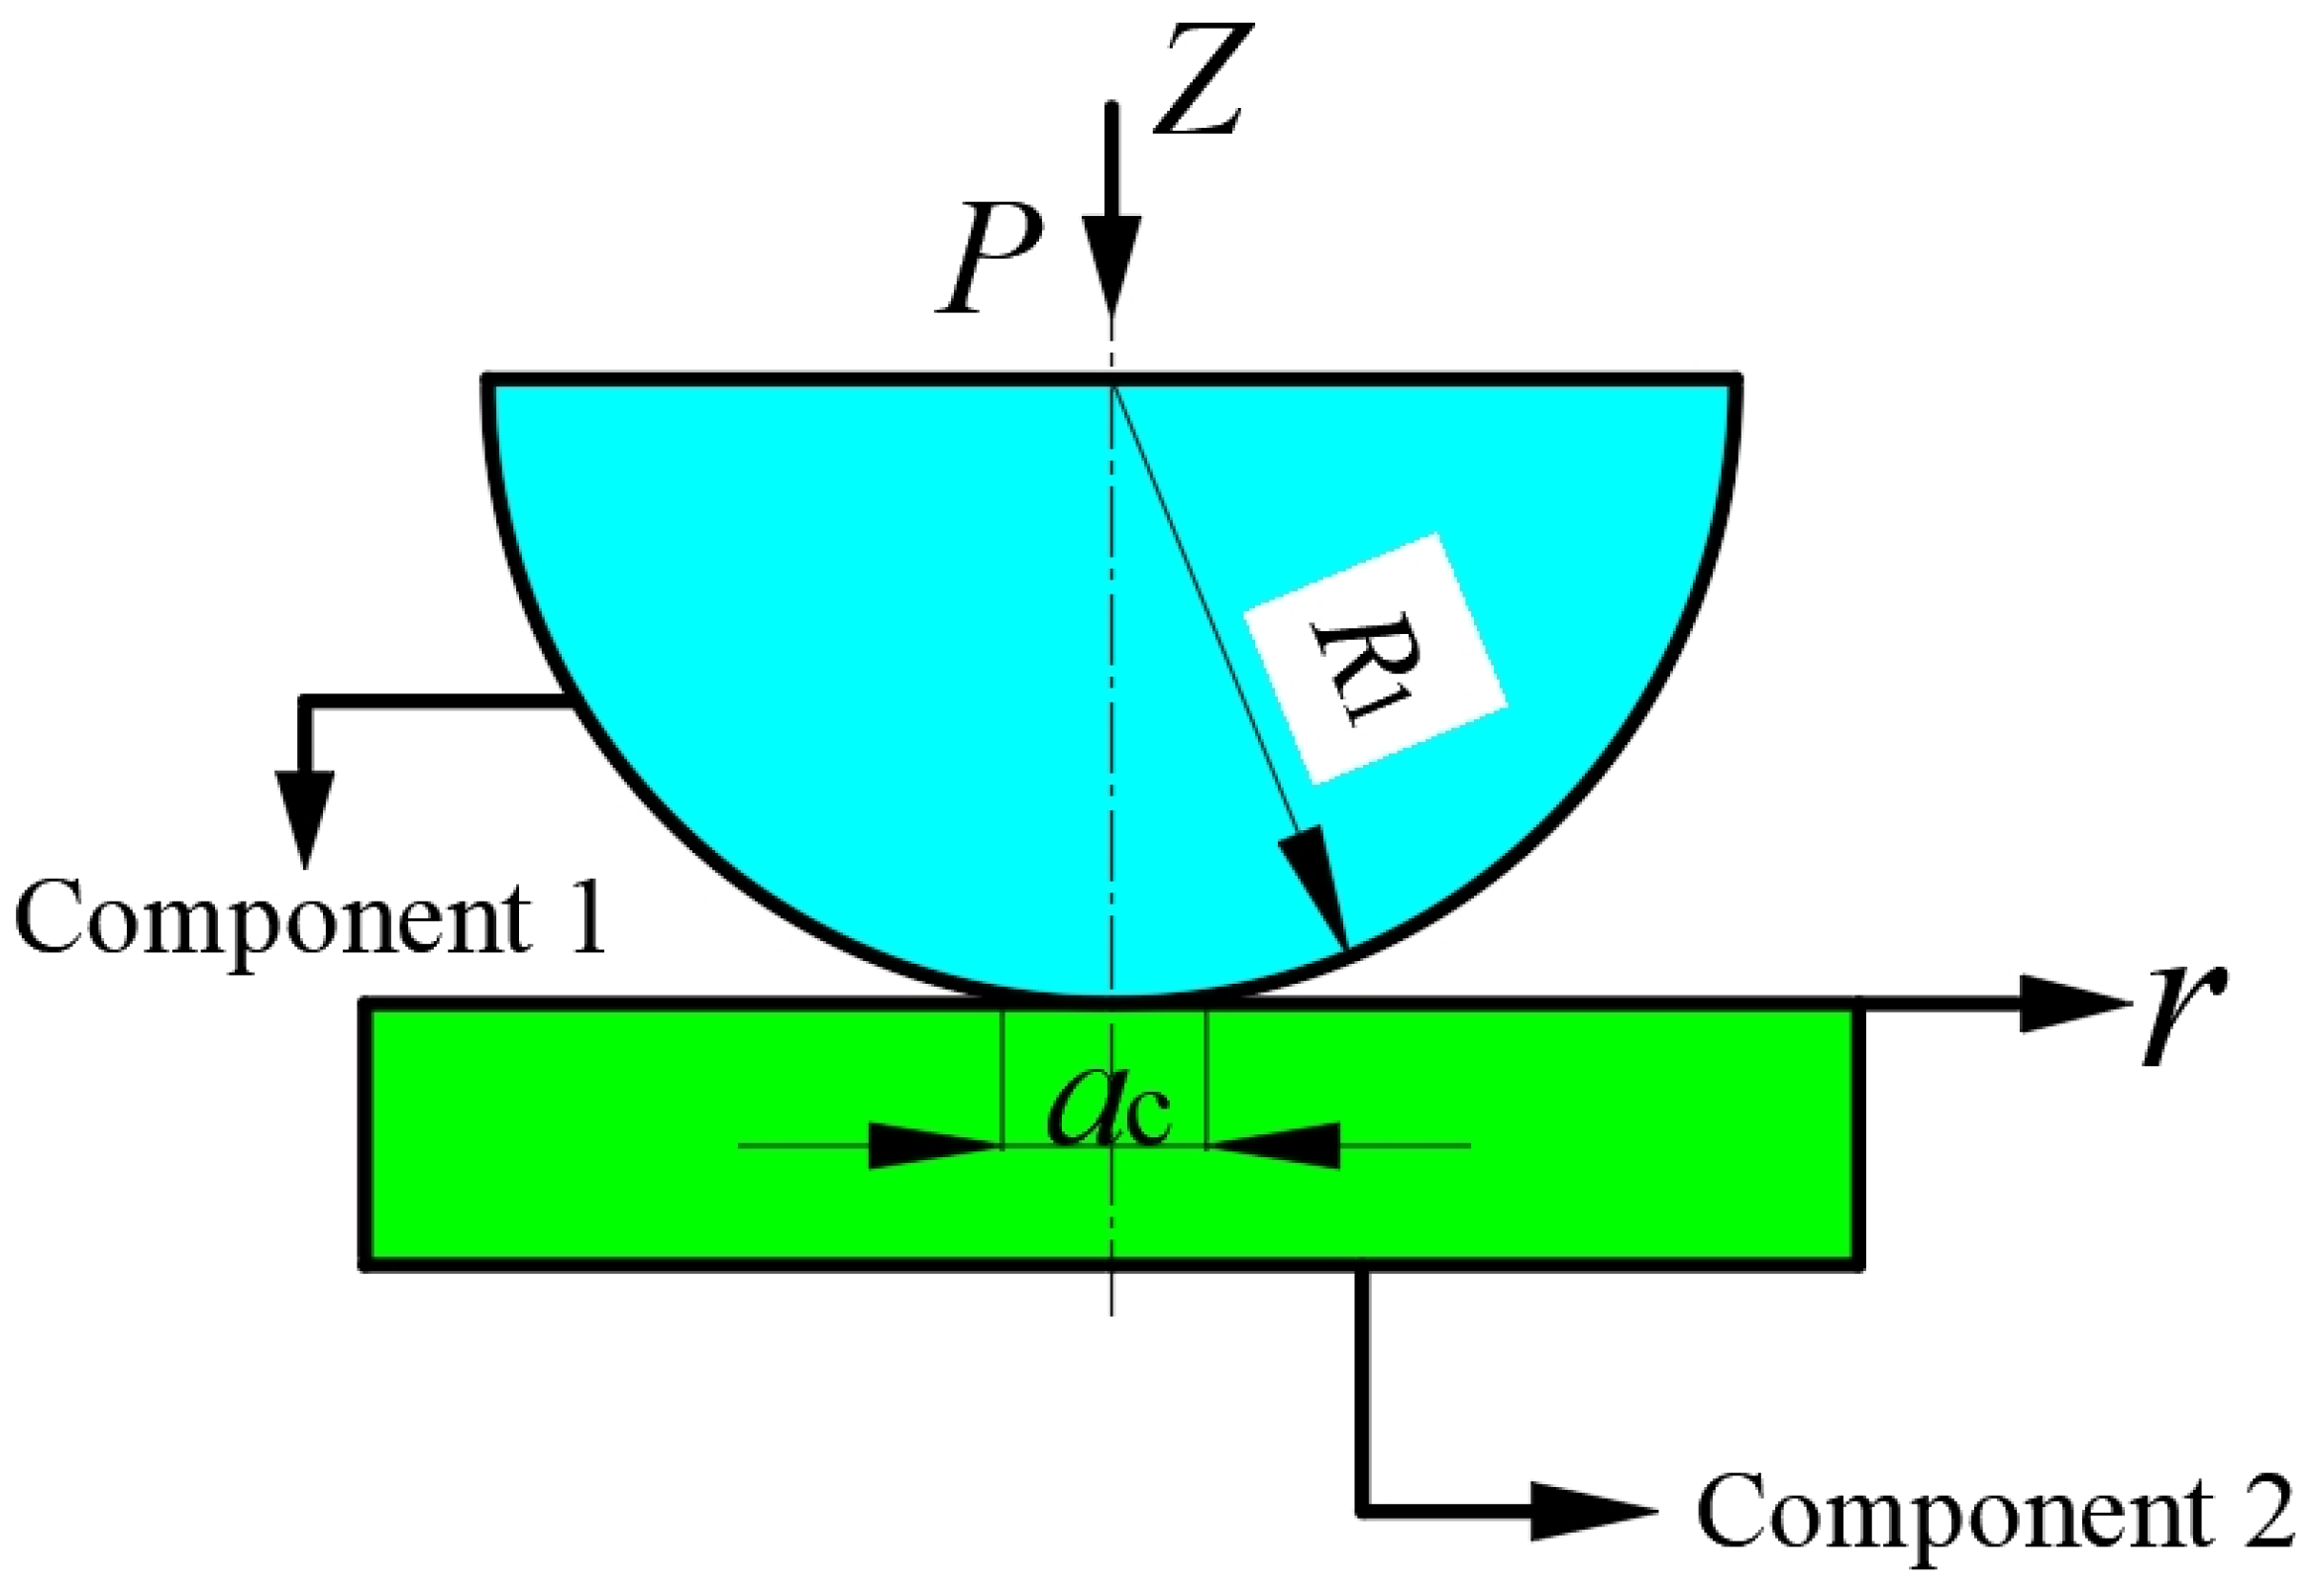
According to Hertz’s contact theory [
16], when two deformable components come into contact, they initially contact at a point and then contact over a limited area after being subjected to force. This area is relatively small compared to the dimensions of the two components, as shown in
Figure 1.
Assumptions in Hertz contact theory for determining stress and displacement distributions include (1) isotropic and elastic contacting bodies, (2) essentially flat and very small contact surfaces, and (3) completely smooth and frictionless contact surfaces.
The normal pressure
P causes the two components to come into contact, resulting in a contact pressure distributed in a small circle with a radius of
ac:
where
Eeq represents the equivalent elastic modulus, and
R1 is the equivalent radius.
Due to the local deformation of component 1, the relative displacement at the center caused by the total contact force
P is
The deformation amount under constant pressure is determined by the equivalent elastic modulus and the radius of component 1. If the equivalent elastic modulus remains constant, the deformation depends mainly on the radius of component 1, leading to stress concentration at the point contact area. Buffer components are crucial in high-speed rotating projectiles to protect vulnerable components from damage under high impact loads. To minimize the impact of high-speed rotational motion on control components, the contact area of buffer components should be kept as small as possible after being impacted. Although the Hertz contact theory is limited to elastic deformation regions, further research is required on the deformation of structures in the plastic zone through experiments and finite element simulations. Nonetheless, this theory does provide theoretical guidance for the design of multi-sphere point contact cushioning structures and for predicting small deformations.
2.2. Design of an Annularly Distributed Multi-Sphere Point Contact Structure
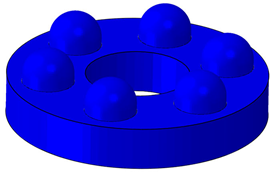
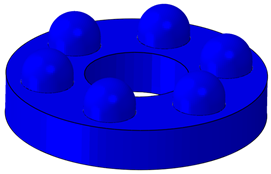
This paper designs an annularly distributed multi-sphere point contact structure based on the structural characteristics of the high-speed rotating projectile and the Hertz contact theory, as shown in
Figure 2. The structure is designed to undergo plastic deformation to withstand impact loads and shield vulnerable components from harm. The contact area post-impact deformation is primarily focused within the local range of point contact.
3. Impact Test
3.1. Specimen Preparation
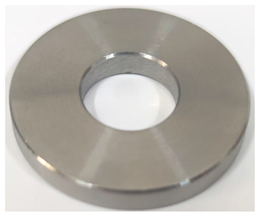
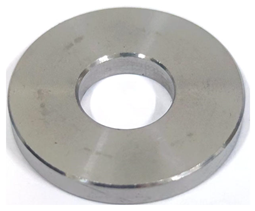
Equation (2) indicates that when the elastic modulus of the base plate contacting the hemisphere exceeds that of the hemisphere under impact loading, deformation concentrates primarily on the hemisphere. To avoid base plate deformation, the hemisphere is made from WE43 magnesium alloy for its excellent vibration damping and energy absorption properties, while the base plate is made of 35CrMnSiA and the connecting plate for sphere attachment is made of No. 45 steel. Start by using a through-hole machine to create the external thread on the hemisphere. Next, attach the threaded end of the hemisphere to special tooling and remove the protrusion. Drill six smooth holes evenly around the connecting plate and then tap internal threads. Finally, connect the hemisphere to the connecting plate through these threads. See
Figure 3 for the dimensions of the specimens and processed products.
3.2. Hydraulic Impact Test
The impact load of a specific high-speed rotating projectile is 13,000 g. A ground hydraulic impact platform is employed to assess the impact resistance of a multi-spherical point contact structure. By adjusting the height of the free fall of the load platform surface, the hydraulic impact stage imitates various overloads. The test object is linked to the platform surface and endures the impact directly to evaluate its overload resistance. The countertop is equipped with a standard acceleration sensor to provide real-time feedback on the actual overload value. The multi-sphere point contact structure was fixed onto the load table surface before the test. A base plate was inserted between the sphere structure and the table surface to prevent direct contact, with sleeves used for reinforcement. The multi-sphere structure was positioned between the projectile’s main body and the fuse, with a 1 kg counterweight installed at its upper end to balance the 1 kg fuse mass. The base plate and sleeve were made from 35CrMnSiA. The waveform generator on the shock-absorbing base was adjusted in thickness and hardness to achieve the required pulse width of the impact signal. The structure was powered on and allowed to stabilize for 20 s for normal sensor operation. The drop height of the load platform was set, followed by a no-load calibration to generate an impact overload of approximately 13,000 g. Five repeated tests were conducted to reduce test uncertainty. After the test, the impact resistance performance of the structure was evaluated by examining the deformation of the multi-sphere. Refer to
Figure 4 for the impact test.
3.3. Test Results
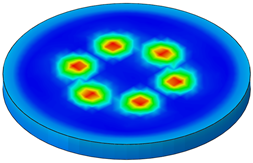
The impact signal spectrum from the standard acceleration sensor after the impact test is shown in
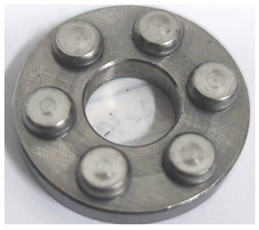
Figure 5a. The peak overload value during the impact phase is about 13,000 g, with a main pulse width of around 0.0002 s, allowing for the simulation of ballistic impact environments. After the impact, the base plate and multi-sphere are shown in
Figure 5b,c. Deformation of the annularly distributed multi-sphere structure is mainly concentrated at the point contact parts. Radial deformation is defined as the diameter of the circular contact surface with the base plate, while axial deformation is defined as the deformation perpendicular to this diameter direction, as shown in
Figure 5c. A hemisphere has a radial deformation of 4.64 mm and an axial deformation of 2.28 mm after the impact. The base plate remains undamaged. The results of the impact test show that the designed multi-sphere point contact structure has good impact resistance, with deformation primarily occurring in the annularly distributed hemisphere.
4. Finite Element Model
4.1. Material Constitutive
To ensure consistency with the hydraulic impact test settings, the finite element model features a hemisphere made of WE43 magnesium alloy, a sleeve made of 35CrMnSiA, and a connecting plate and counterweight made of No. 45 steel. All of these materials are metallic.
4.1.1. Metal Constitutive Model
Metals commonly employ the J-C constitutive model, which solves the yield surface issue in traditional constitutive theory, simplifies the constitutive equation form, and is ideal for simulation. This method primarily takes into account temperature, strain, and strain rate, with a few easily obtainable parameters [
17]. The expression of the Johnson–Cook constitutive model is
where
σ is the flow stress;
ε is the equivalent plastic strain;
ε* represents the plastic strain rate; in the dimensionless temperature term
T* = (
T −
Tr)/(
Tm −
Tr),
Tr is the reference temperature,
Tm is the melting temperature of the material, and
T is the current temperature. This model contains five undetermined empirical parameters. The meaning of each physical parameter is as follows:
A is the yield strength;
B and
n are the strain strengthening parameters;
C is the strain rate sensitivity coefficient;
M is the temperature softening coefficient; and
ε* = ε/ε0, where
ε0 is the reference plastic strain rate of the J-C model.
4.1.2. Metal Damage Model
The J-C damage model is a widely used failure criterion that considers factors like stress triaxiality, strain rate, and temperature effects. The Johnson–Cook damage model is formulated as follows:
where
T is the damage parameter; Δ
εp is the increment of time-order plastic strain; and Δ
εf represents the strain state, strain rate, and failure strain at the current time step temperature, and its expression is
where
D1,
D2,
D3,
D4, and
D5 are material parameters;
σ* = P/σeff = −σkk/σeff = −Rσ, where
P is pressure and
σeff is equivalent stress;
Rσ represents the triaxial degree of stress; and
ε* = ε/ε0, where
ε0 is the reference plastic strain rate of the J-C model.
4.1.3. Material Parameters
Performance parameters and Johnson–Cook parameters for WE43 magnesium alloy, No. 45 steel, and 35CrMnSiA are shown in
Table 1,
Table 2,
Table 3 and
Table 4.
4.2. Grid Division
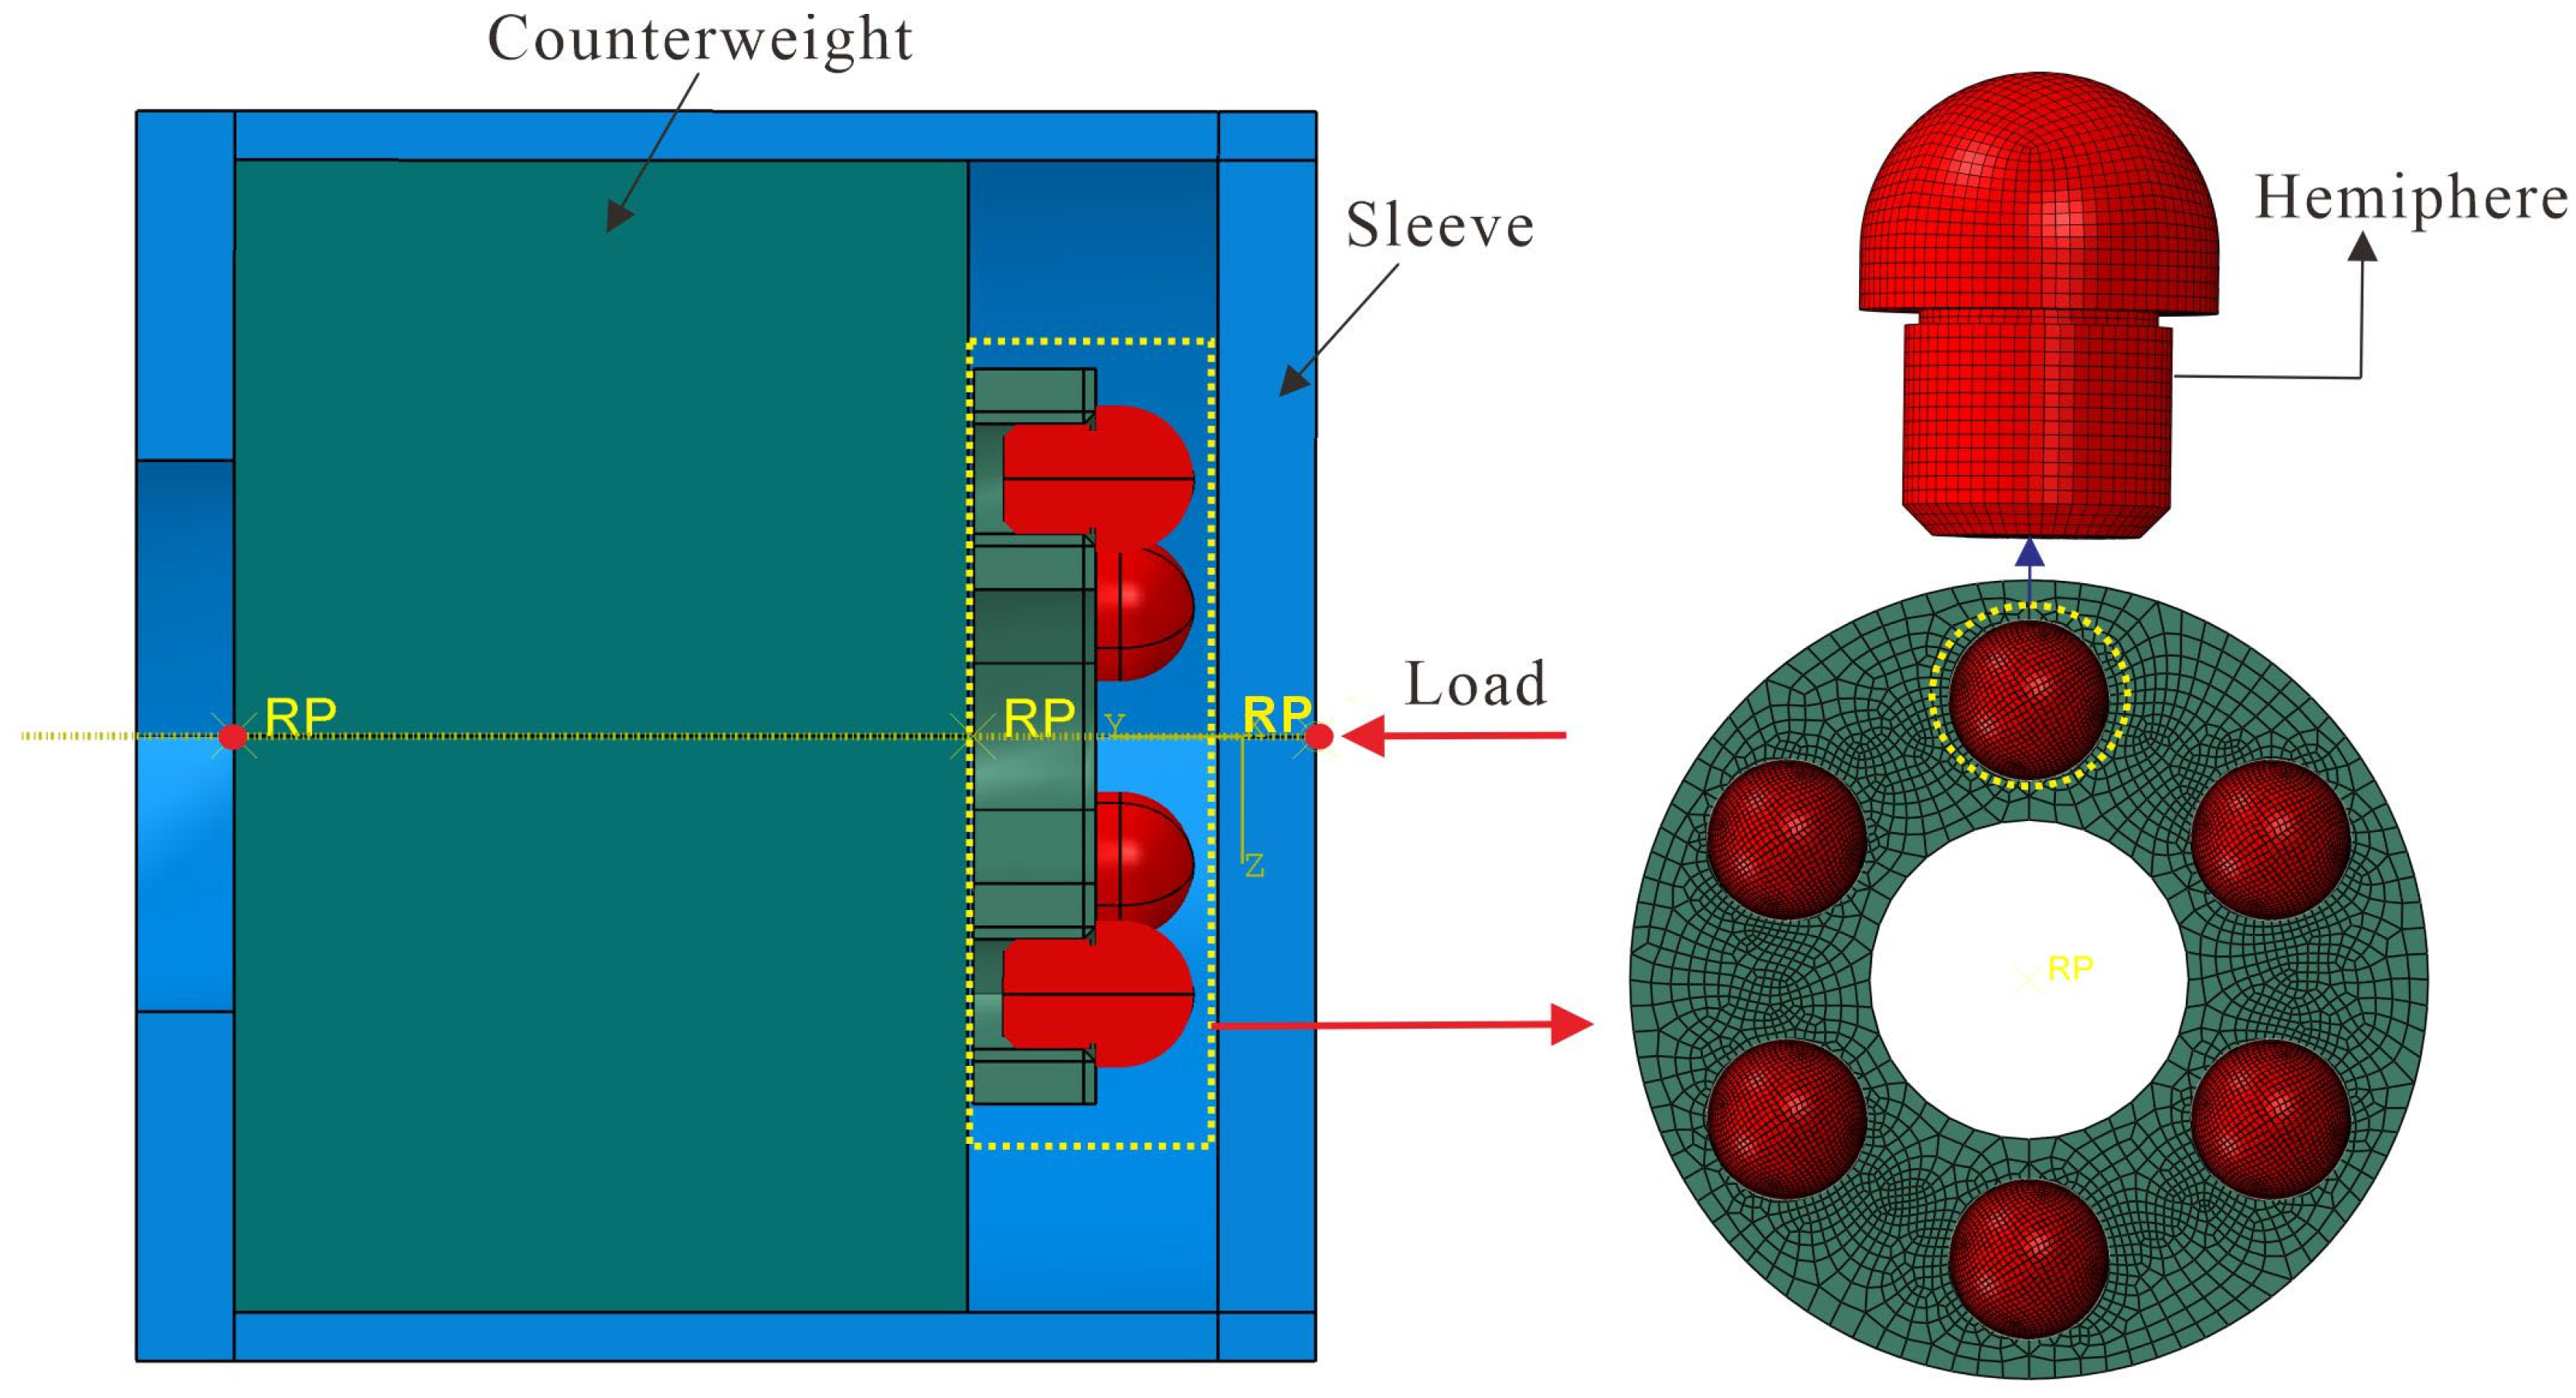
The modeling was done in SolidWorks 2023 and then imported into ABAQUS for impact dynamics analysis. A reference point was set on the right side of the sleeve, and a coupling constraint relationship was established with its surface. An inertial mass of 1 kg was applied on the left side of the counterweight block. Grids used C3D8R reductive integration and the hourglass control unit type for convergence. The number of cells for the hemisphere, connecting plate, and sleeve were 14,792, 15,684, and 3328, respectively.
4.3. Finite Element Model of Impact
In this study, ABAQUS/Explicit was used to simulate the dynamic impact process of an annularly distributed multi-sphere point contact structure. The initial analysis step included opening the geometric nonlinearity setting, creating a dynamic and display analysis step, and setting the time length to 0.0002 s. The contact surface between the hemisphere and the sleeve was set as surface-to-surface contact, while the others were set as general contact types with a friction coefficient of 0.15. Due to the complex geometric shape of the threaded part, a complete simulation would result in a complex mesh division of the model. To simplify, tie binding constraints were set between the hemisphere and the connecting plate. Coupling constraints were applied between the reference point on the right side of the sleeve and the end face. A semi-sinusoidal acceleration load with a peak value of 13,000 g and a pulse width of 0.0002 s, corresponding to the hydraulic impact test, was then applied. The sleeve was free in the direction of motion, with the other degrees of freedom fixed. The finite element model of the impact is illustrated in
Figure 6.
5. Results and Discussion
5.1. Verification of the Finite Element Model
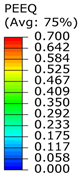
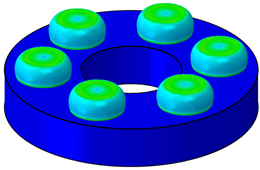
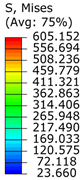
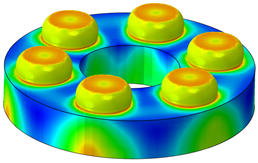
The stress and plastic strain cloud plot of the hemispheres in the annularly distributed multi-sphere point contact structure obtained from the finite element model were compared with the impact test, as shown in
Table 5. The impact caused the hemispheres’ deformation to transition from point contact to surface contact within a limited area. The stress was mainly concentrated at the end of the hemispheres, with a maximum stress of 605.152 MPa, exceeding the yield strength of the material. The plastic strain was 0.7, indicating that the hemispheres resisted the impact through plastic deformation. Comparing the deformation amounts of the hemisphere simulation and the test, the radial deformation error was 1.29% and the axial deformation error was 1.75%, confirming the accuracy of the finite element model.
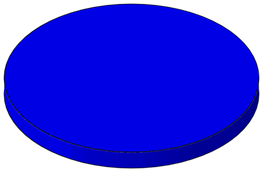
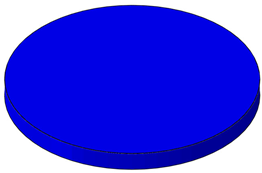
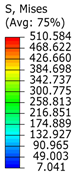
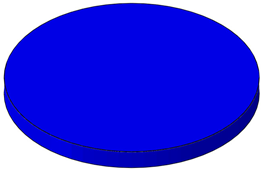
The multi-spherical point contact buffer component described in this paper is utilized in a high-speed rotating projectile to withstand impact loads. If the component in contact with the buffer component deforms, it may lead to a “gear meshing” effect due to the rotational motion of the projectile, potentially impacting its performance. The end of the sleeve in contact with the hemisphere in the finite element model was compared with the base plate in the impact test, as shown in
Table 6. The stress is mainly concentrated on the part in contact with the hemisphere during the impact process, reaching a maximum value of 510.584 MPa, which is below the material’s yield strength. The strain cloud diagram clearly shows that the structure has not undergone plastic deformation. The test and simulation results are in agreement, further confirming the accuracy of the simulation model.
5.2. Analysis of Hemisphere Diameter
5.2.1. Stress Analysis of Hemisphere Diameter
The experimentally verified impact finite element model was used to analyze the deformation law of the structure as the diameter of the hemisphere changed under the same impact load. The number of hemispheres remained constant, while the diameters of the spheres gradually increased. The structural parameters are detailed in
Table 7. In 6 × Φ 3 notation, 6 represents the number of hemispheres and Φ 3 represents the diameter.
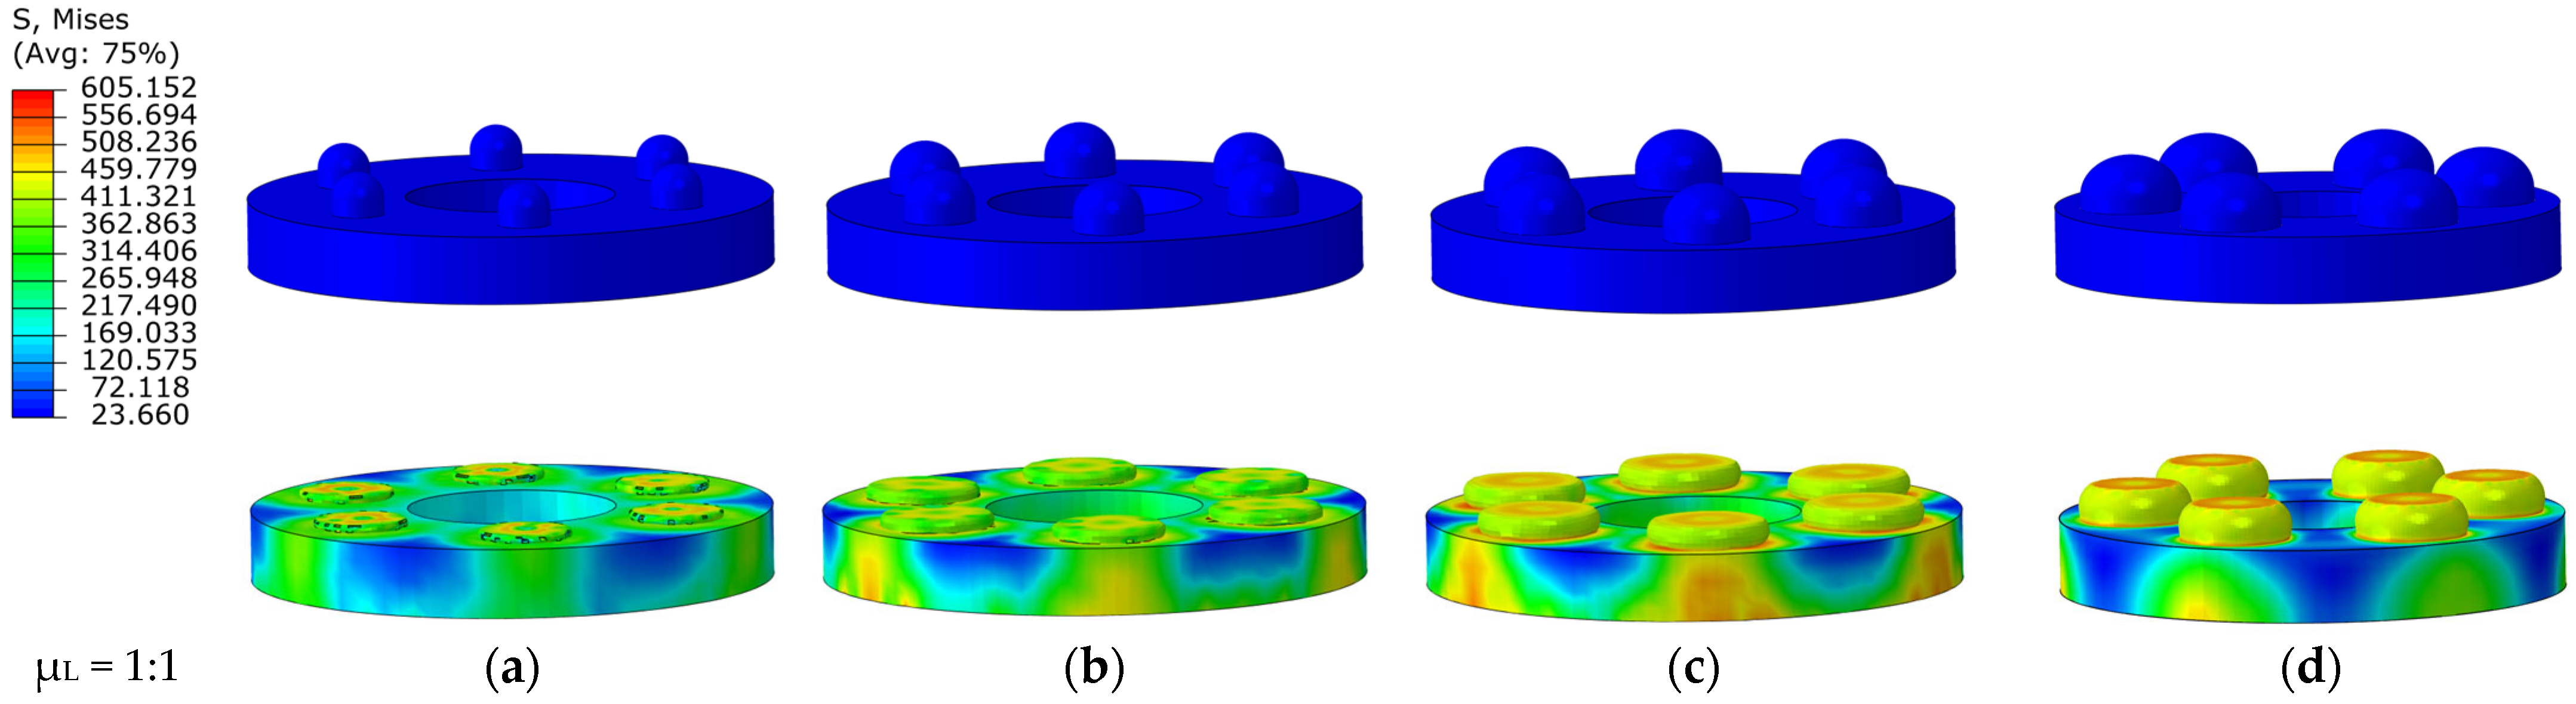
The stress variation cloud diagrams in
Figure 7 indicate that hemispheres of different diameters undergo permanent plastic deformation when subjected to impact load. Stress is concentrated at the point of contact and decreases along the sphere’s center. This aligns with the deformation model for sphere-on-plane contact from the Hertz contact theory. Larger hemispheres display less radial and axial deformation. Type A-1 is fully crushed under impact, reaching its deformation limit, while Type D-1 experiences minimal deformation.
5.2.2. Plastic Strain Analysis of Hemisphere Diameter
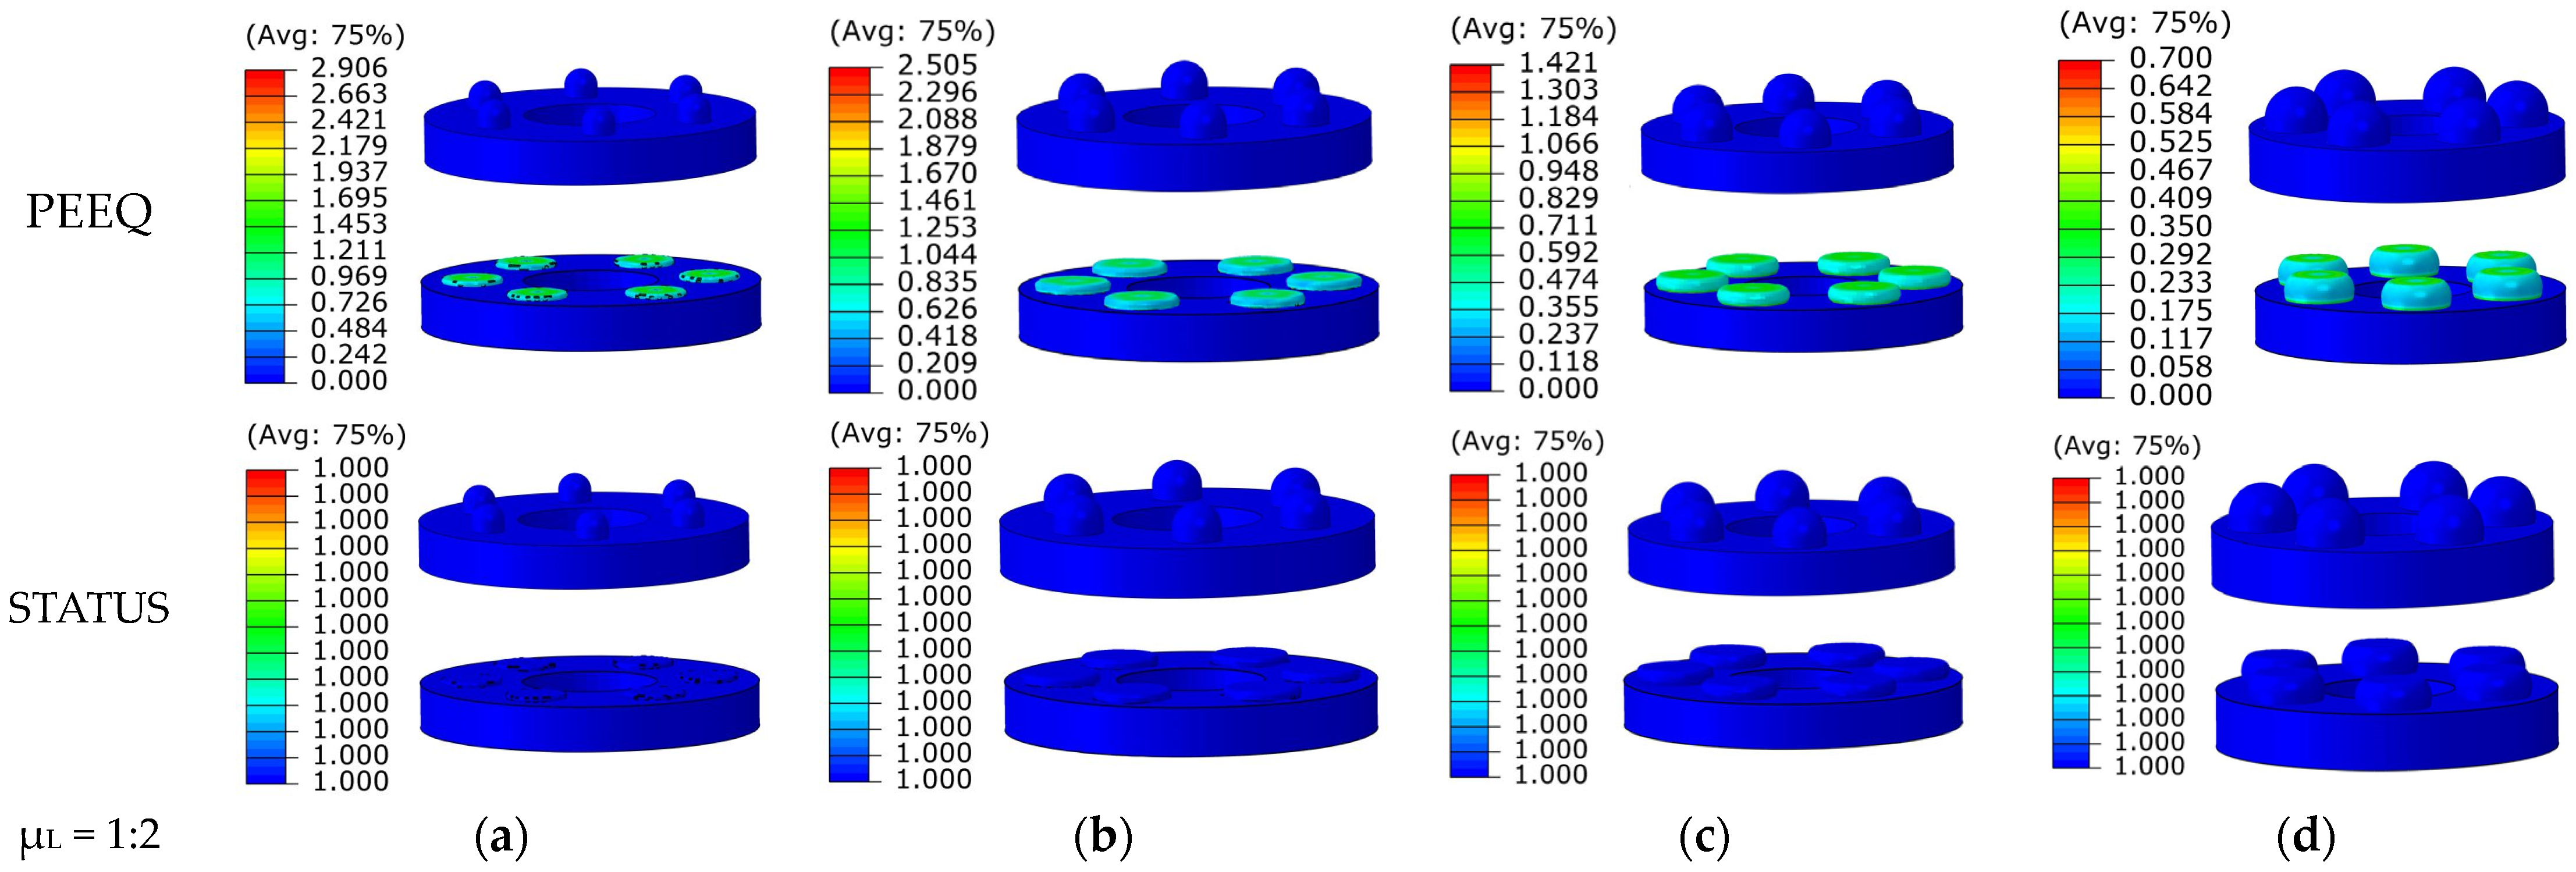
The plastic cloud plot and status cloud plot of the four structures are shown in
Figure 8. Permanent plastic deformation is observed in all structures, with the plastic strain decreasing as the hemispherical diameter increases. Type A-1 reaches a plastic strain of 2.906, while Type D-1 has a plastic strain of 0.7, showing a decrease of 75.9%. This indicates that larger hemispherical diameters result in smaller deformations under the same impact load. The status cloud plot shows that all four structures have a status value of 1 after impact, indicating that they have undergone plastic deformation but still retain a certain load-bearing capacity without failure.
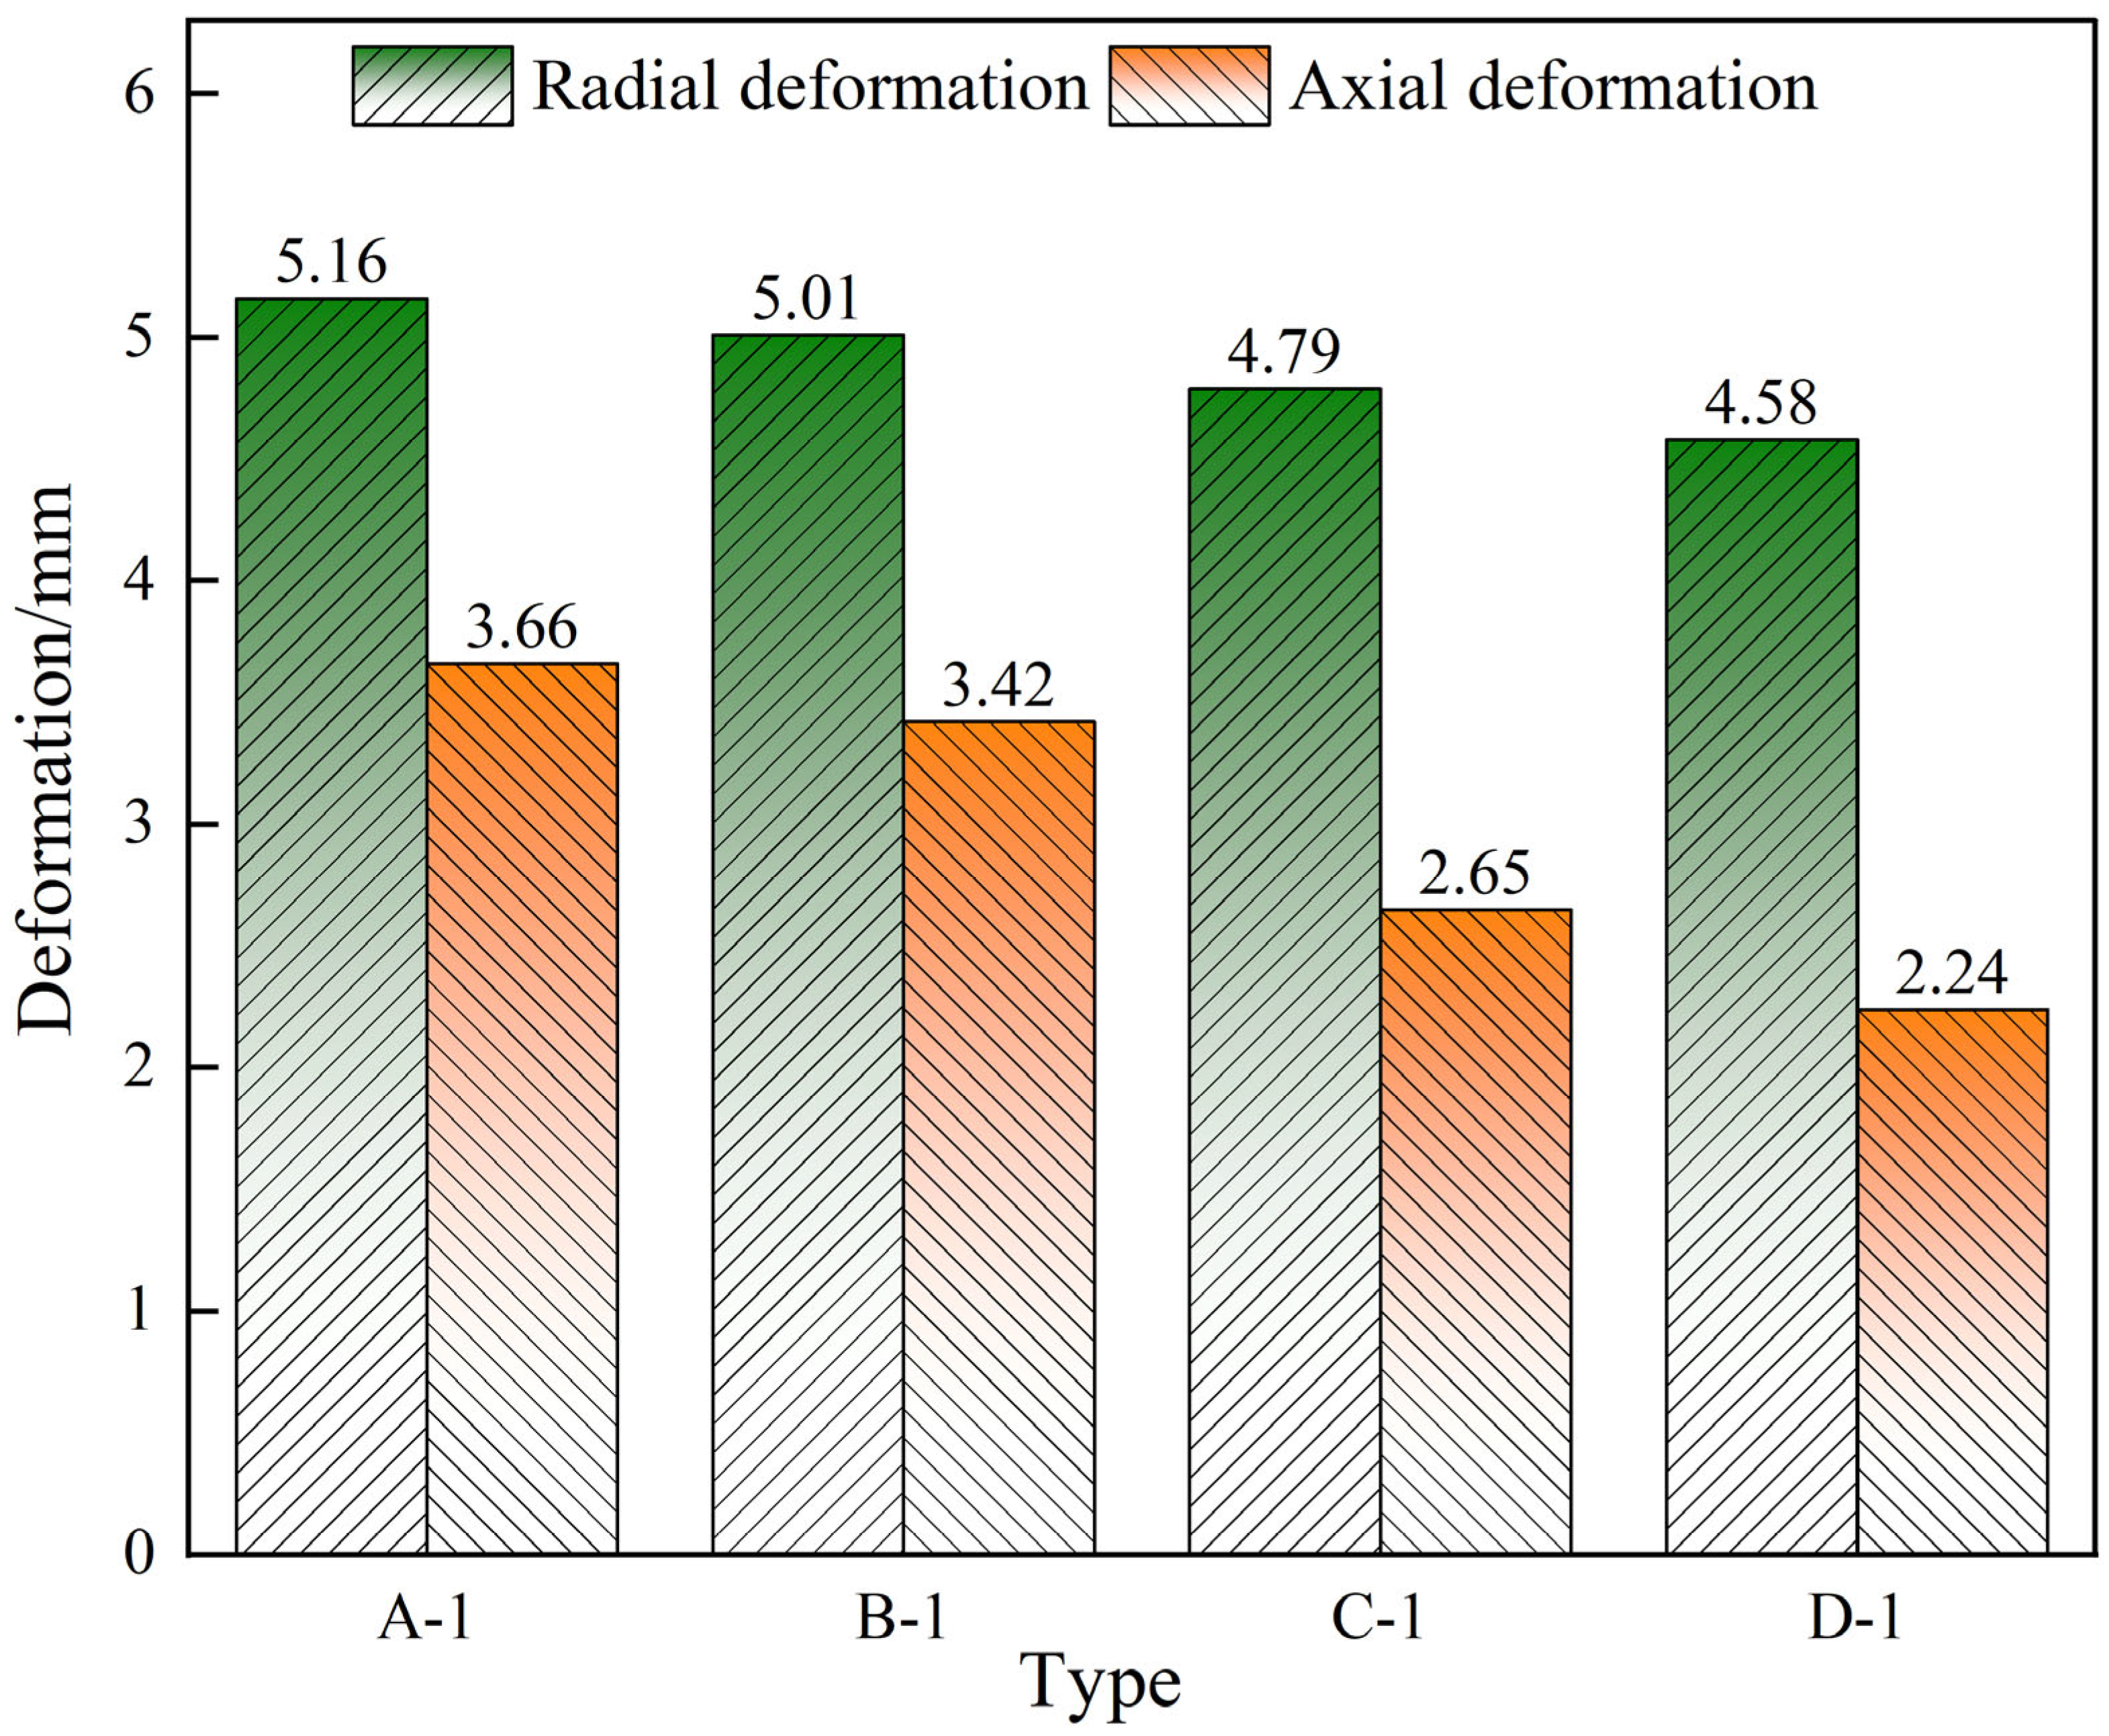
Figure 9 illustrates the deformation trends in the axial and radial directions for hemispheres of different diameters. Type A-1 has axial and radial deformations of 3.66 mm and 5.16 mm, with a contact area of 20.91 mm
2 for a single sphere. Type D-1 has axial and radial deformations of 2.24 mm and 4.58 mm, with a contact area of 16.47 mm
2 for the hemisphere. The simulation results indicate that the deformation of ring-distributed hemispheres is inversely proportional to the diameter under the same impact load. The deformation amount can be adjusted to meet different engineering requirements by changing the diameter of the hemisphere.
5.3. Analysis of Hemisphere Quantity
5.3.1. Stress Analysis of Hemisphere Quantity
As the diameter of the hemisphere increases, the impact deformation decreases. Thus, the maximum diameter can be selected while still meeting engineering requirements. In this study, we will examine how the structure deforms when the number of hemispheres changes under the same impact load, with a hemisphere diameter of Φ 6 mm.
Table 8 shows the structural parameters for various numbers of hemispheres.
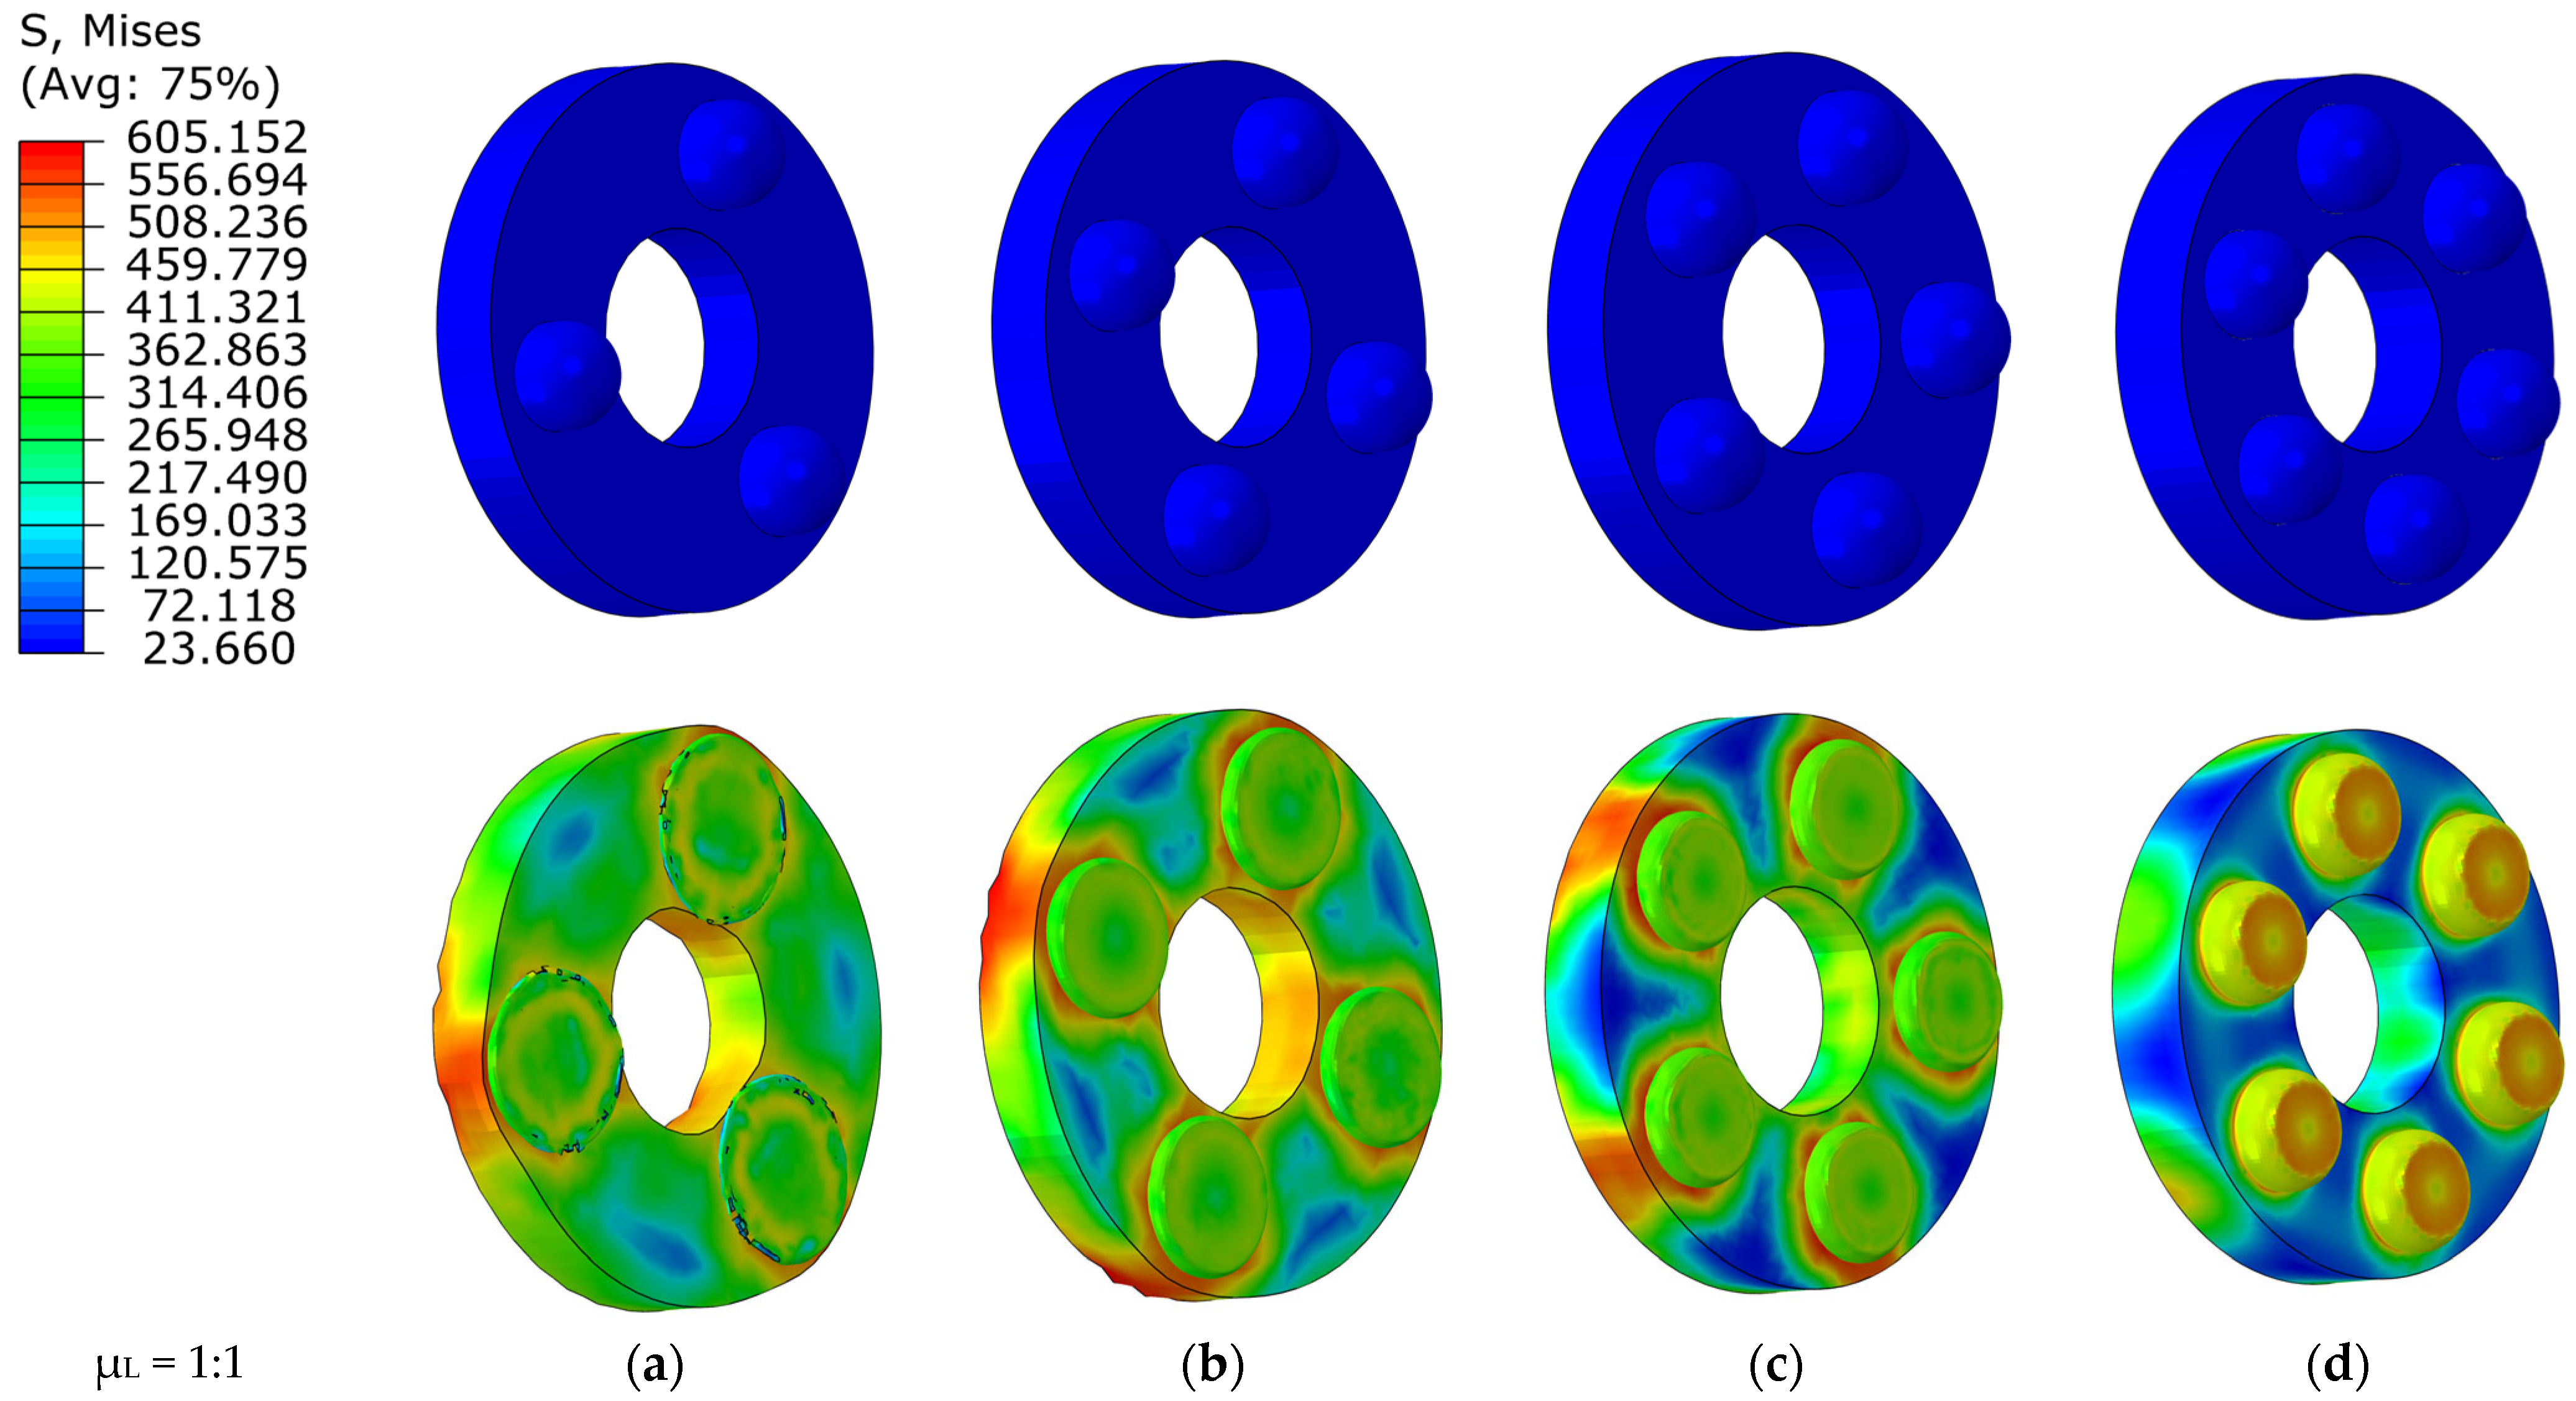
The stress cloud plot illustrates the change in the number of hemispheres before and after impact in
Figure 10. For hemispheres numbering 3, 4, and 5, the maximum stress shifts from the point to the contact area between the hemispheres and the connection plate. This occurs as the hemispheres deform rapidly under the impact load, causing the connection plate to be squeezed and leading to the distribution of maximum stress at the contact area. With 6 hemispheres, the impact load is predominantly carried by the hemispheres, leaving the connecting plates uncompressed. The maximum stress is concentrated at the contact points, displaying a ring-shaped distribution. This behavior is a result of the increased equivalent elastic modulus of the structure and the enhanced impact resistance. As the number of hemispheres increases, the axial and radial deformations of the structure decrease. The Type A-2 structure is crushed with deformation reaching the limit, while the Type D-2 structure has relatively small axial and radial deformations.
5.3.2. Plastic Strain Analysis of Hemisphere Quantity
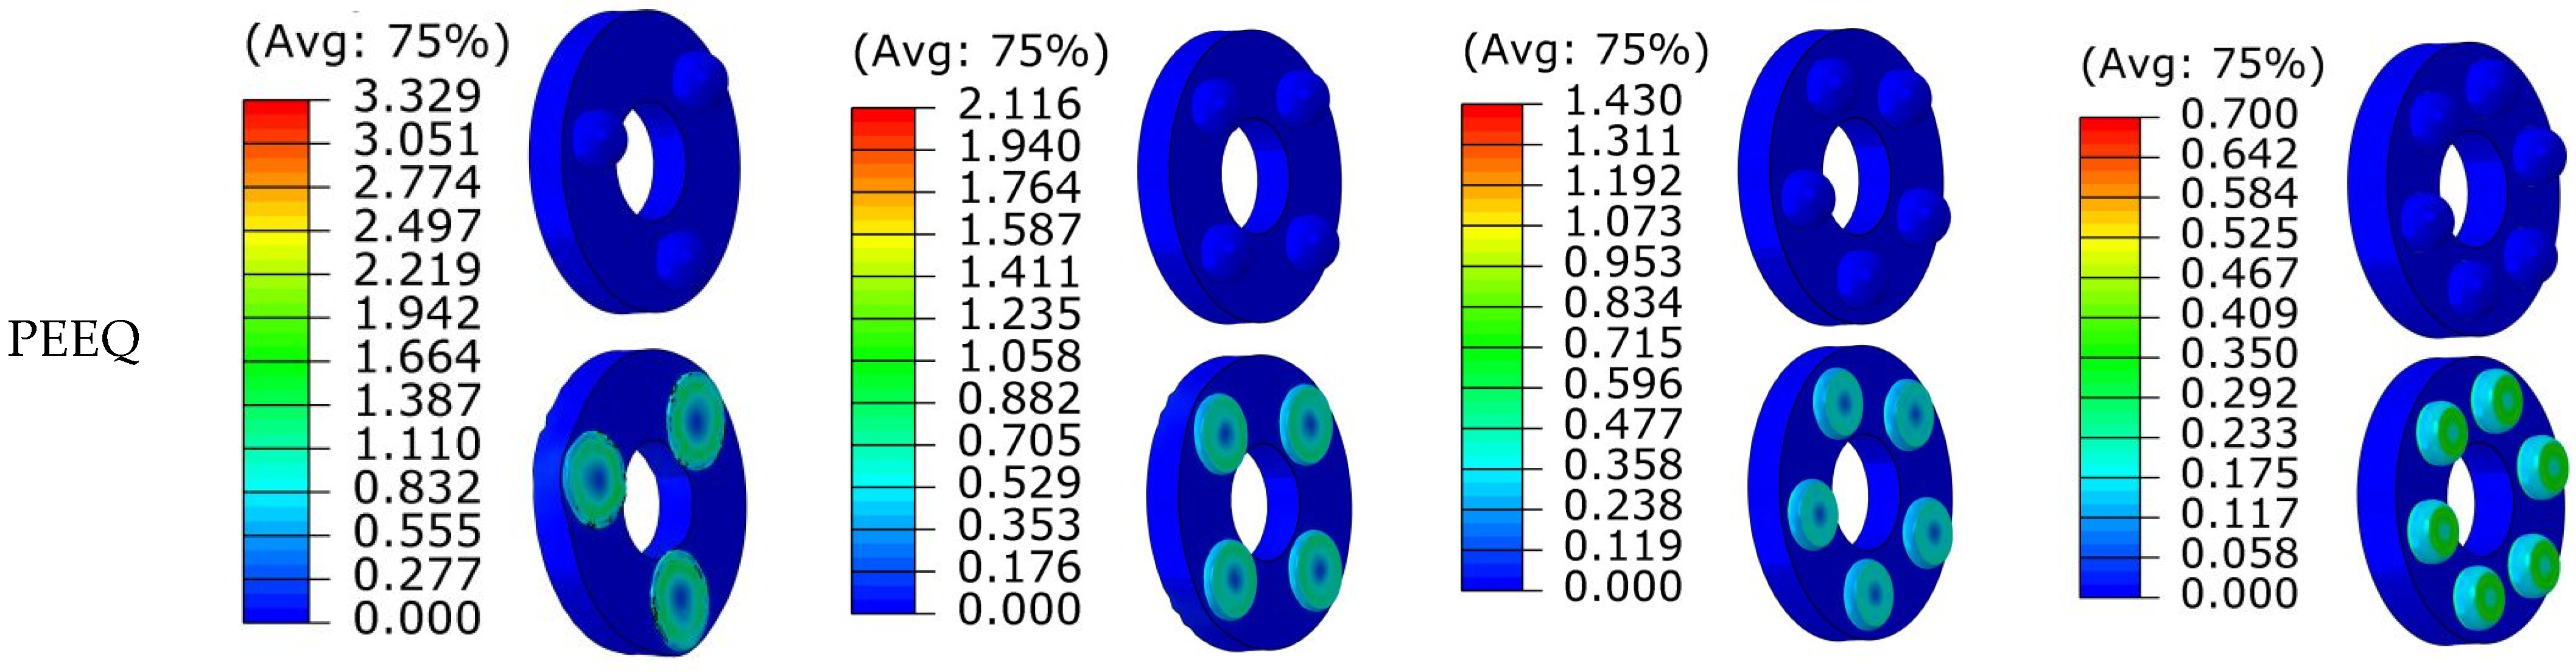
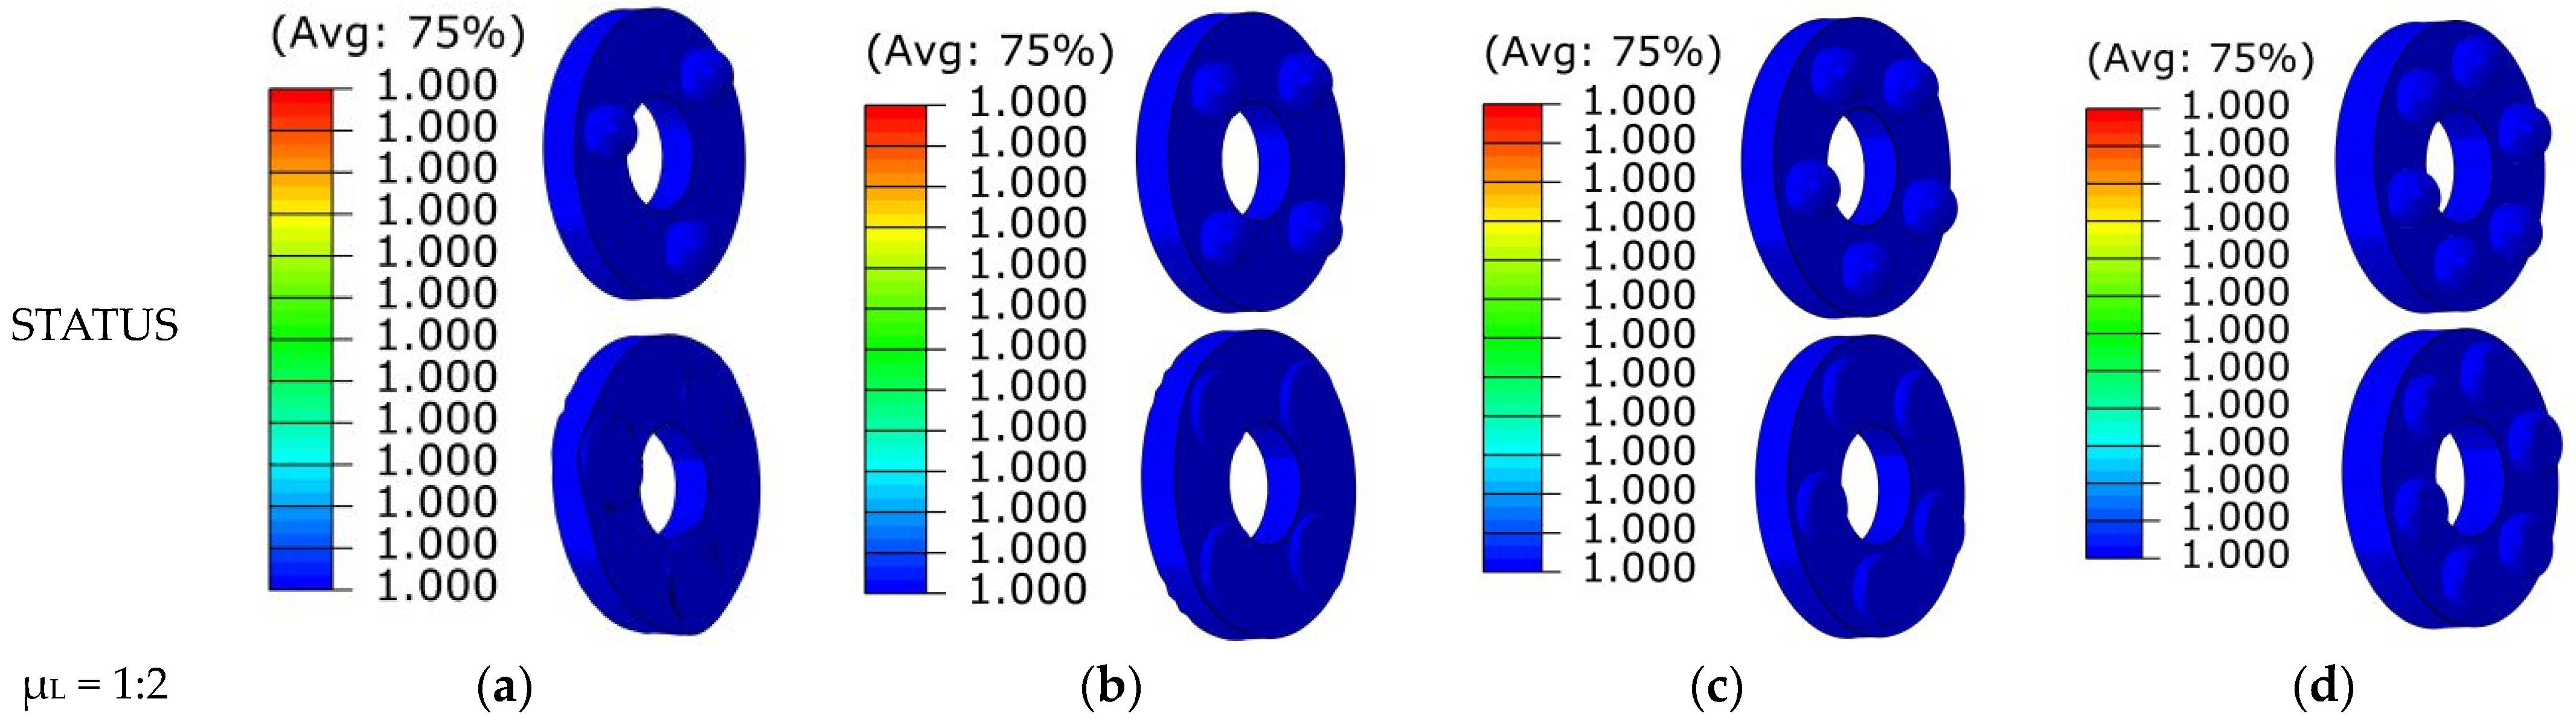
The plastic strain cloud plot and status cloud plot of the four structures before and after impact are shown in
Figure 11. It is observed that as the number of hemispheres increases, the plastic strain gradually decreases. The maximum plastic strain of Type A-2 is 3.329, while that of Type D-2 is 0.7. The maximum strain value decreases by 79%. The number of hemispheres has a greater influence on the strain value compared to the change in the diameter of the hemispheres. The status cloud plot show that the status values of the four structures after impact are all 1, demonstrating that they have not failed and continue to exhibit load-bearing capabilities despite differences in deformation.
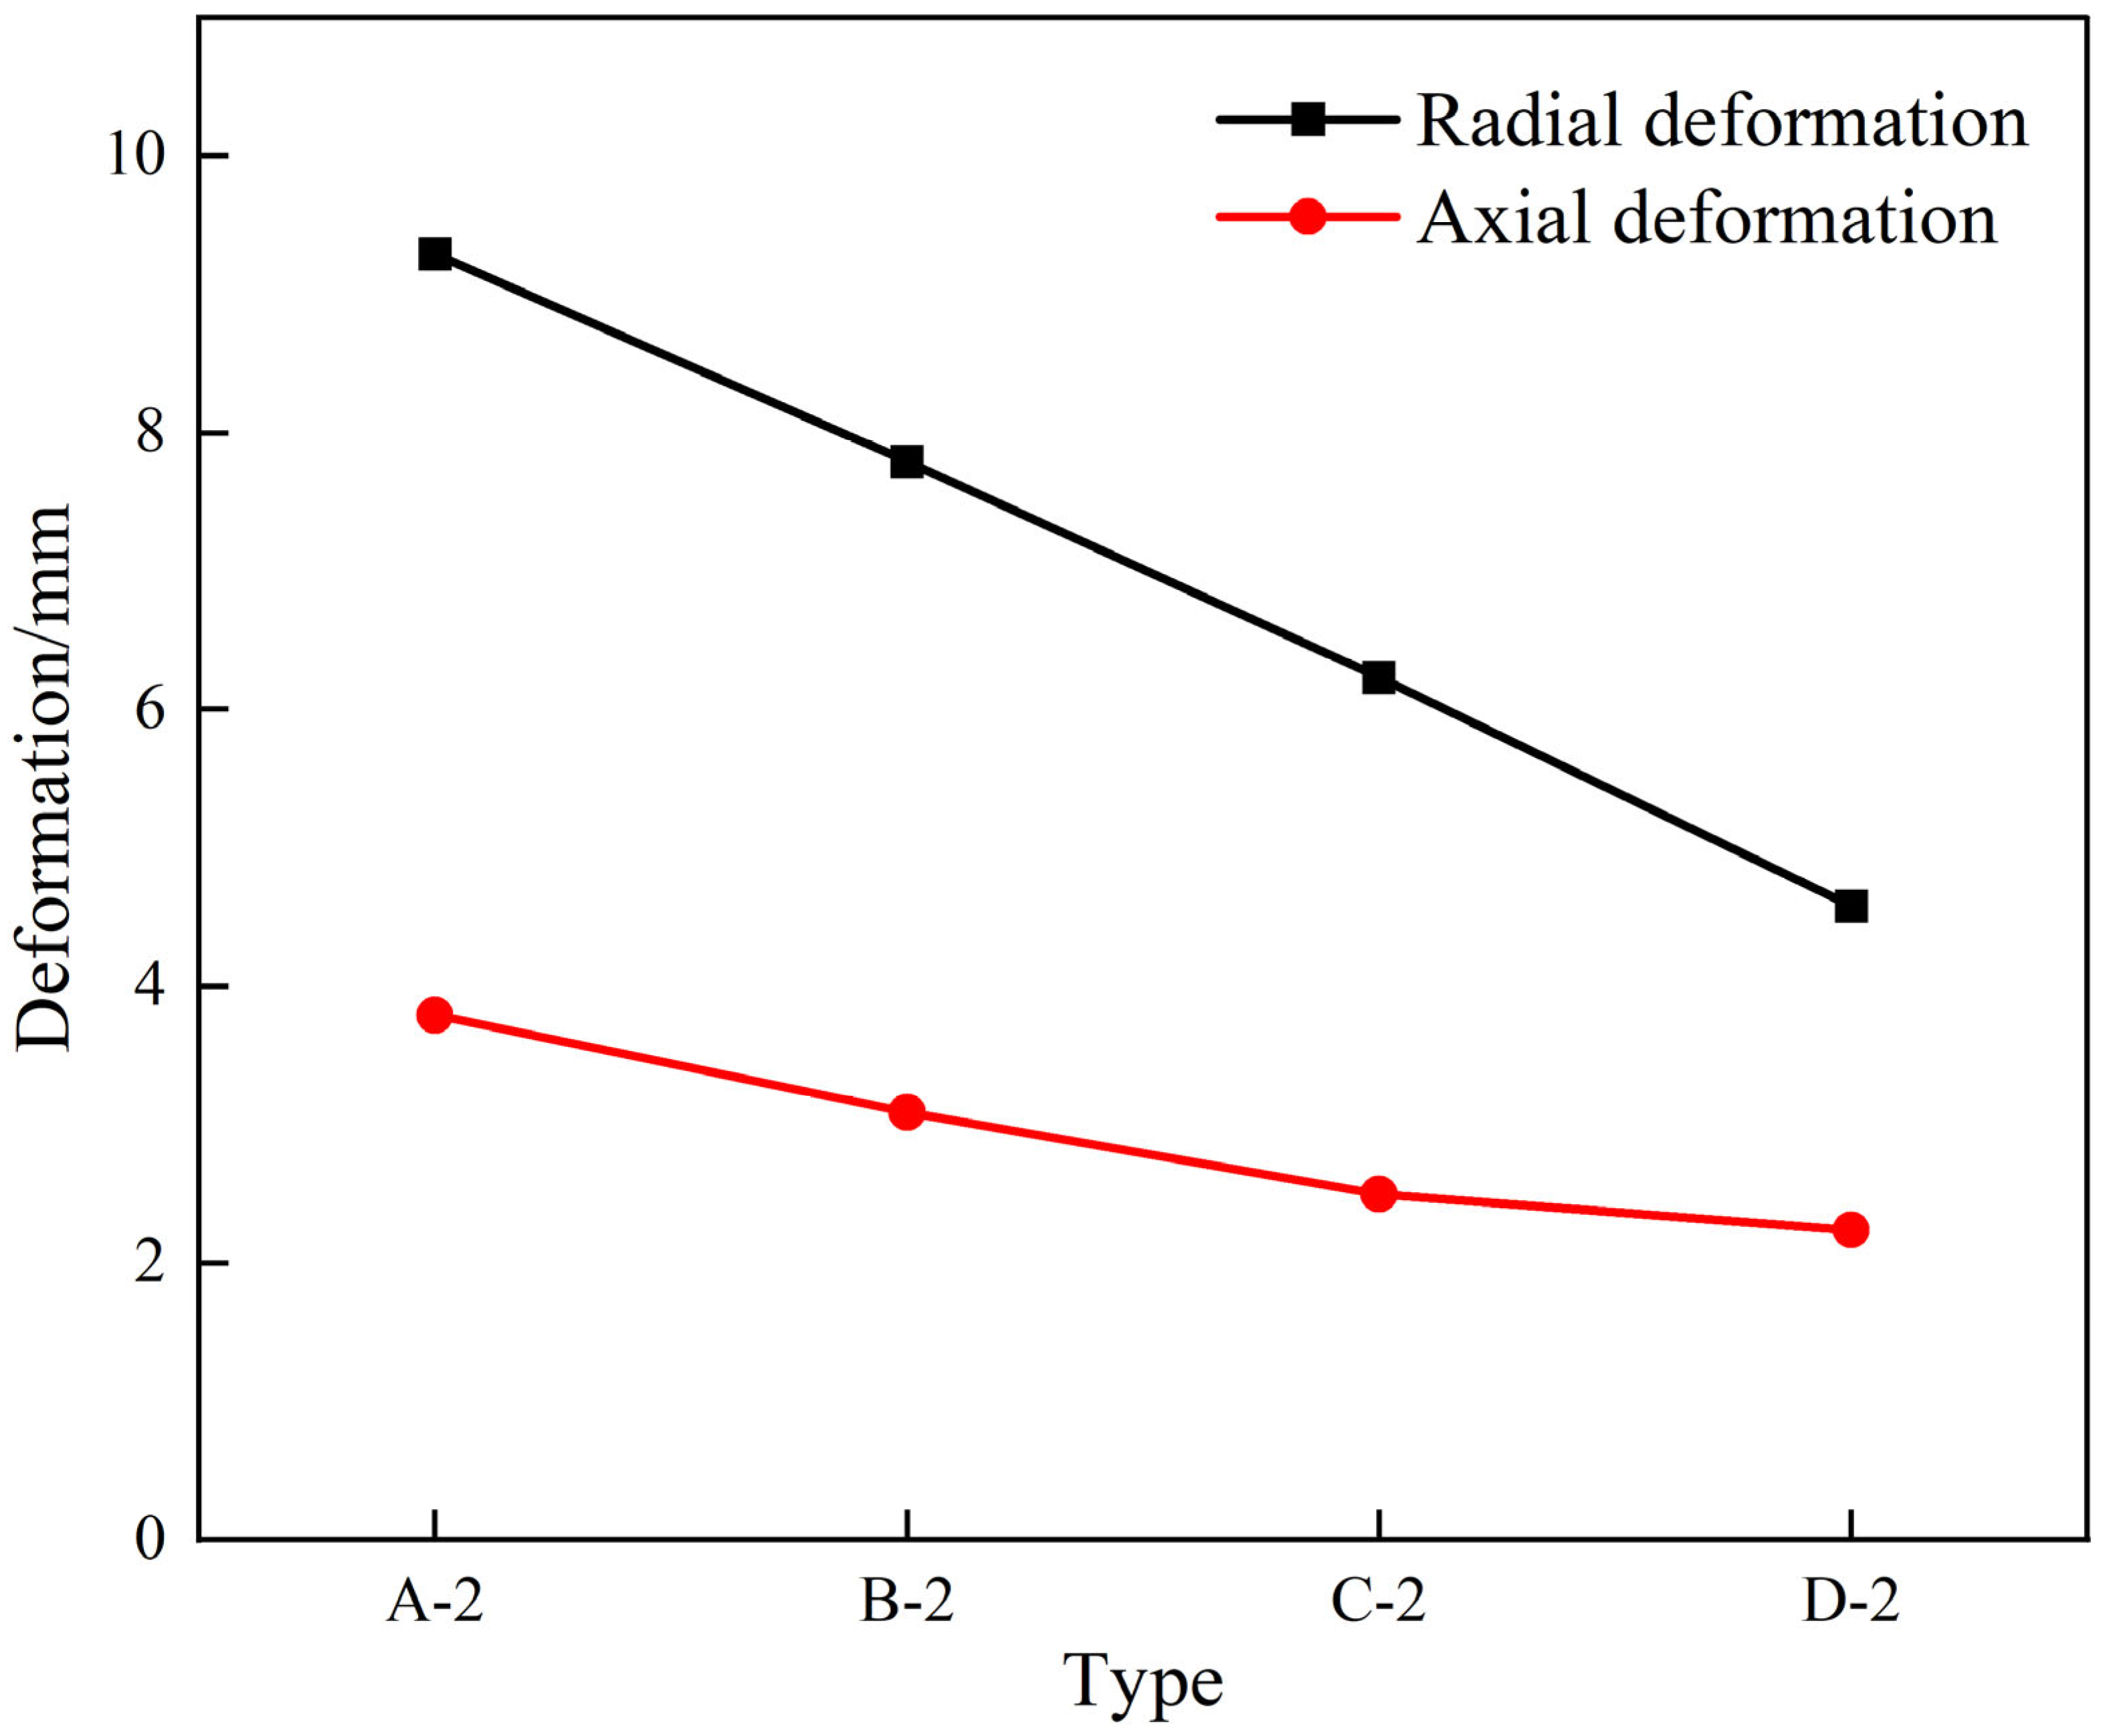
In
Figure 12, the axial and radial deformation curves of the structure are shown with varying numbers of hemispheres. As the number of hemispheres increases, both axial and radial deformations decrease under the same impact load. For Type A-2, the axial deformation is 3.79 mm and the radial deformation is 9.29 mm, with a single hemisphere contact area of 67.78 mm
2. For Type D-2, the axial deformation is 2.24 mm and the radial deformation is 4.58 mm, with a single hemisphere contact area of 16.47 mm
2. The radial deformation decreases linearly, while the axial deformation decreases linearly at first and then slowly, indicating that the number of spheres has a greater influence on radial deformation.
5.4. Analysis of the Cavity Radius of the Hemisphere
5.4.1. Stress Analysis of Cavity Radius of the Hemisphere
When analyzing changes in the number and diameter of hemispheres, it was observed that deformation under the same impact load is inversely proportional to the number and diameter of hemispheres. Better impact resistance is achieved with larger diameters and numbers of hemispheres. The influence of changing the cavity radius of hemispheres on structural deformation was studied using hemispheres with a diameter of Φ 6 mm and a quantity of 6. The corresponding structural parameters are shown in
Table 9. In 6 × Φ 6-R0, the number of the hemispheres is represented by 6; Φ 6 represents the diameter of the hemisphere; and R0 represents the radius of the hemispherical cavity.
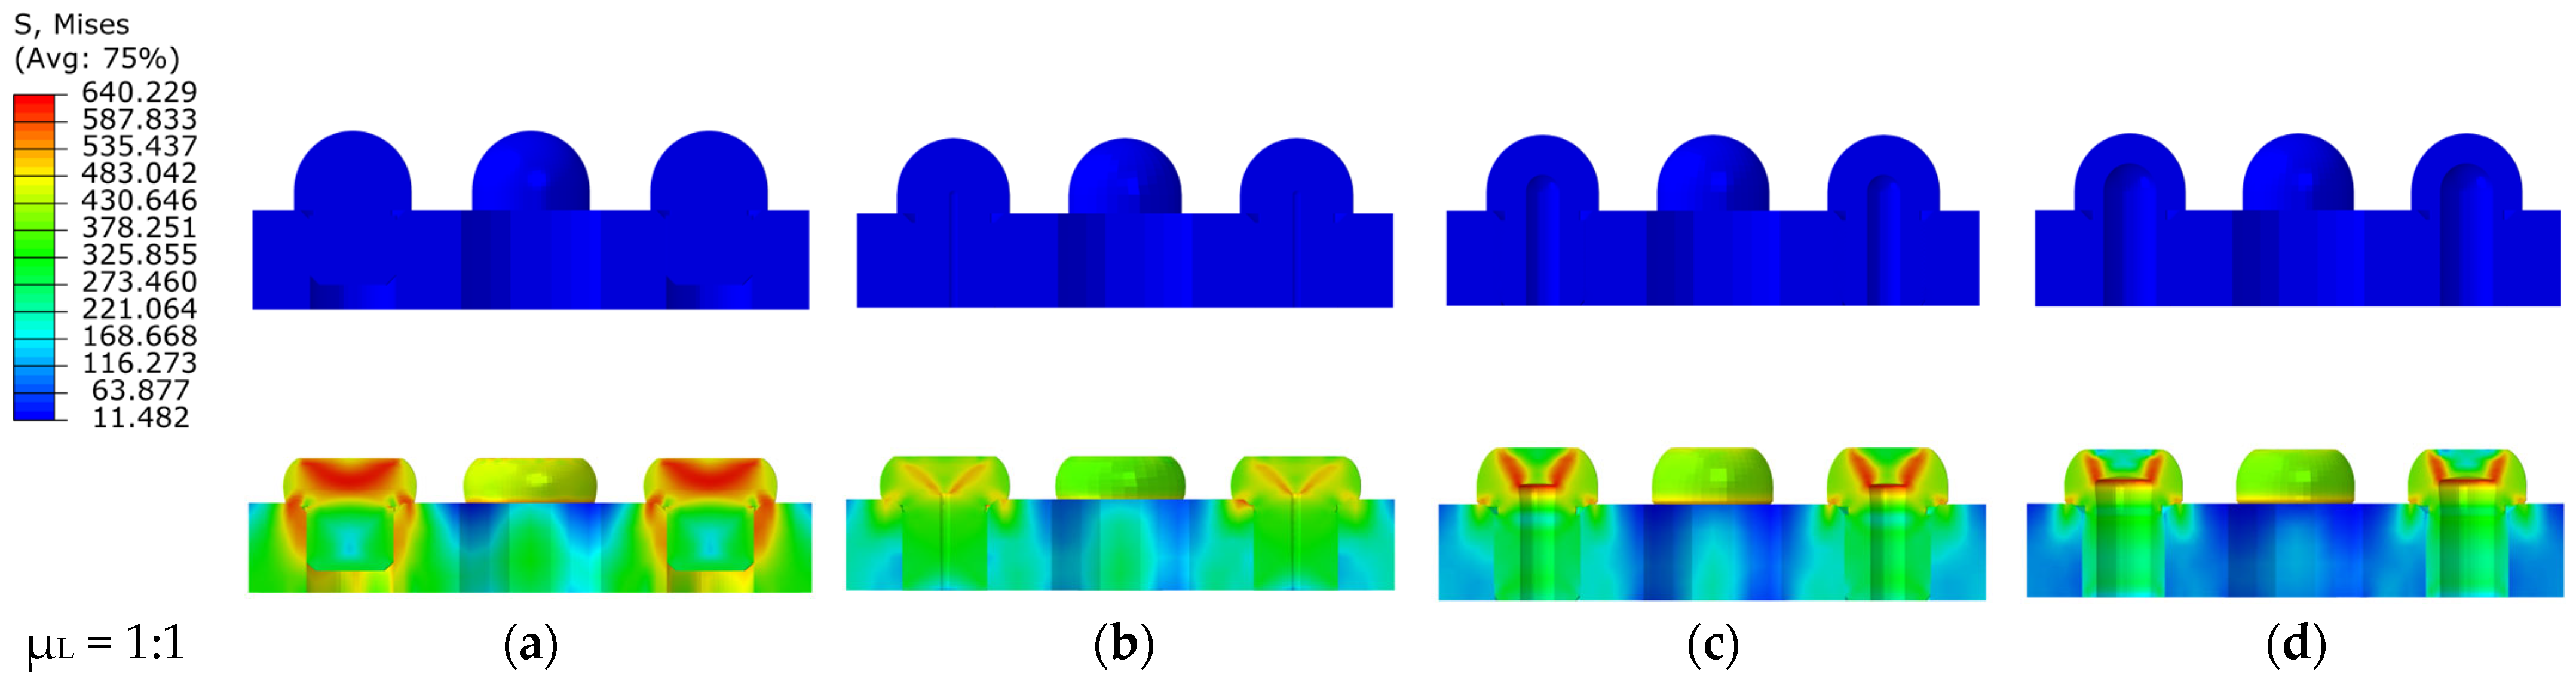
The stress cloud diagrams before and after impact, obtained by varying the cavity radius of the hemisphere, are shown in
Figure 13. A semi-sectional view of the structure was used for the analysis to observe internal changes. For a solid hemisphere (cavity radius of 0), stress is concentrated at the end in an arc-shaped distribution. With a cavity radius of 0.5, the maximum stress shifts from the end to the cavity root in a “V” shape. As the cavity radius increases, stress becomes more concentrated in the cavity area. At R1, the stress distribution in the cavity area is more pronounced. With a cavity radius of 1.5, stress is distributed in a “U” shape in the cavity area. The simulation results indicate that the cavity radius significantly affects the stress distribution in the hemispherical structure. Increasing the radius transfers the maximum stress from the end to the cavity area, reducing axial and radial deformations at the hemisphere.
5.4.2. Plastic Strain Analysis of Cavity Radius of the Hemisphere
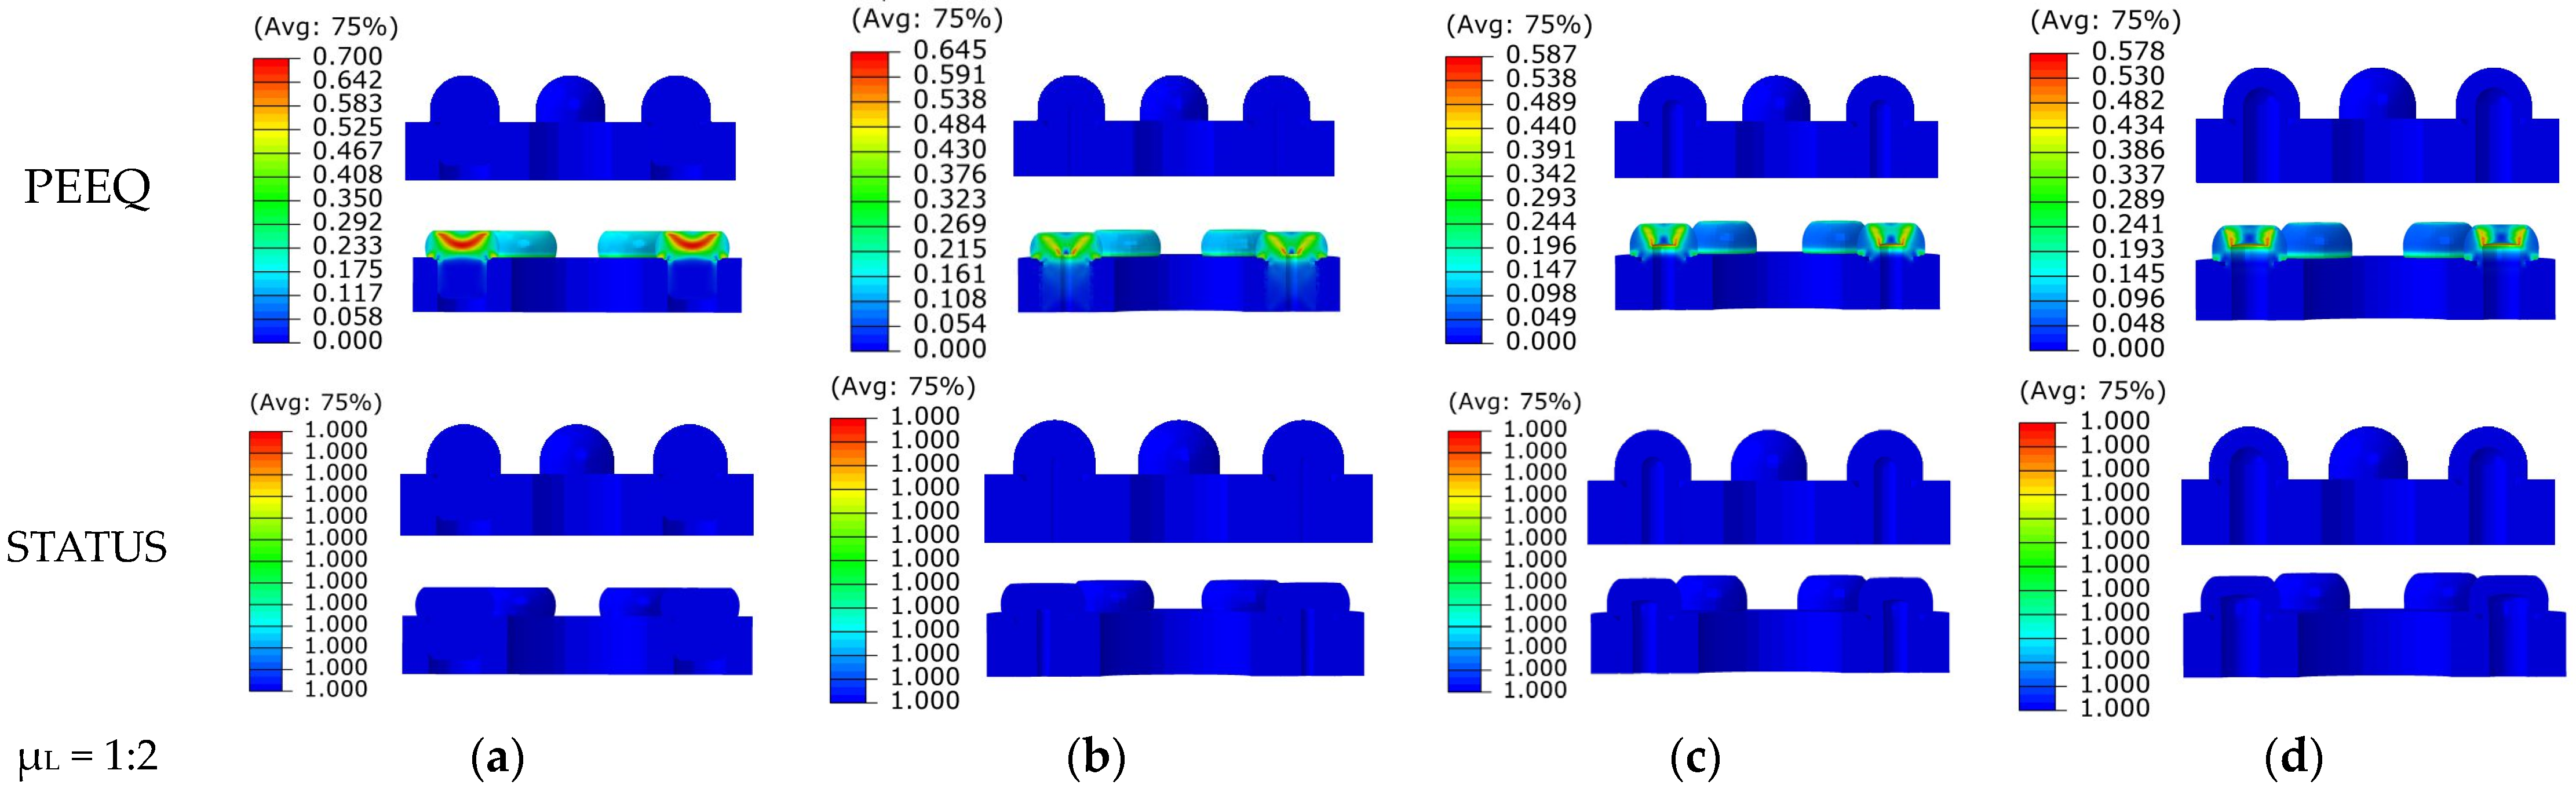
The plastic strain cloud plot and status cloud plot in
Figure 14 demonstrate that with an increase in cavity radius, plastic strain decreases. The maximum plastic strain for Type A-3 is 0.7, while for Type D-3 it is 0.578, showing a decrease of 17.4%. This implies that incorporating internal cavities can help reduce plastic deformation when the number and diameter of hemispheres are constant. Furthermore, the status cloud plot reveals that all status values are 1 post-impact, indicating that the structure has not failed despite experiencing permanent plastic deformation due to the impact load.
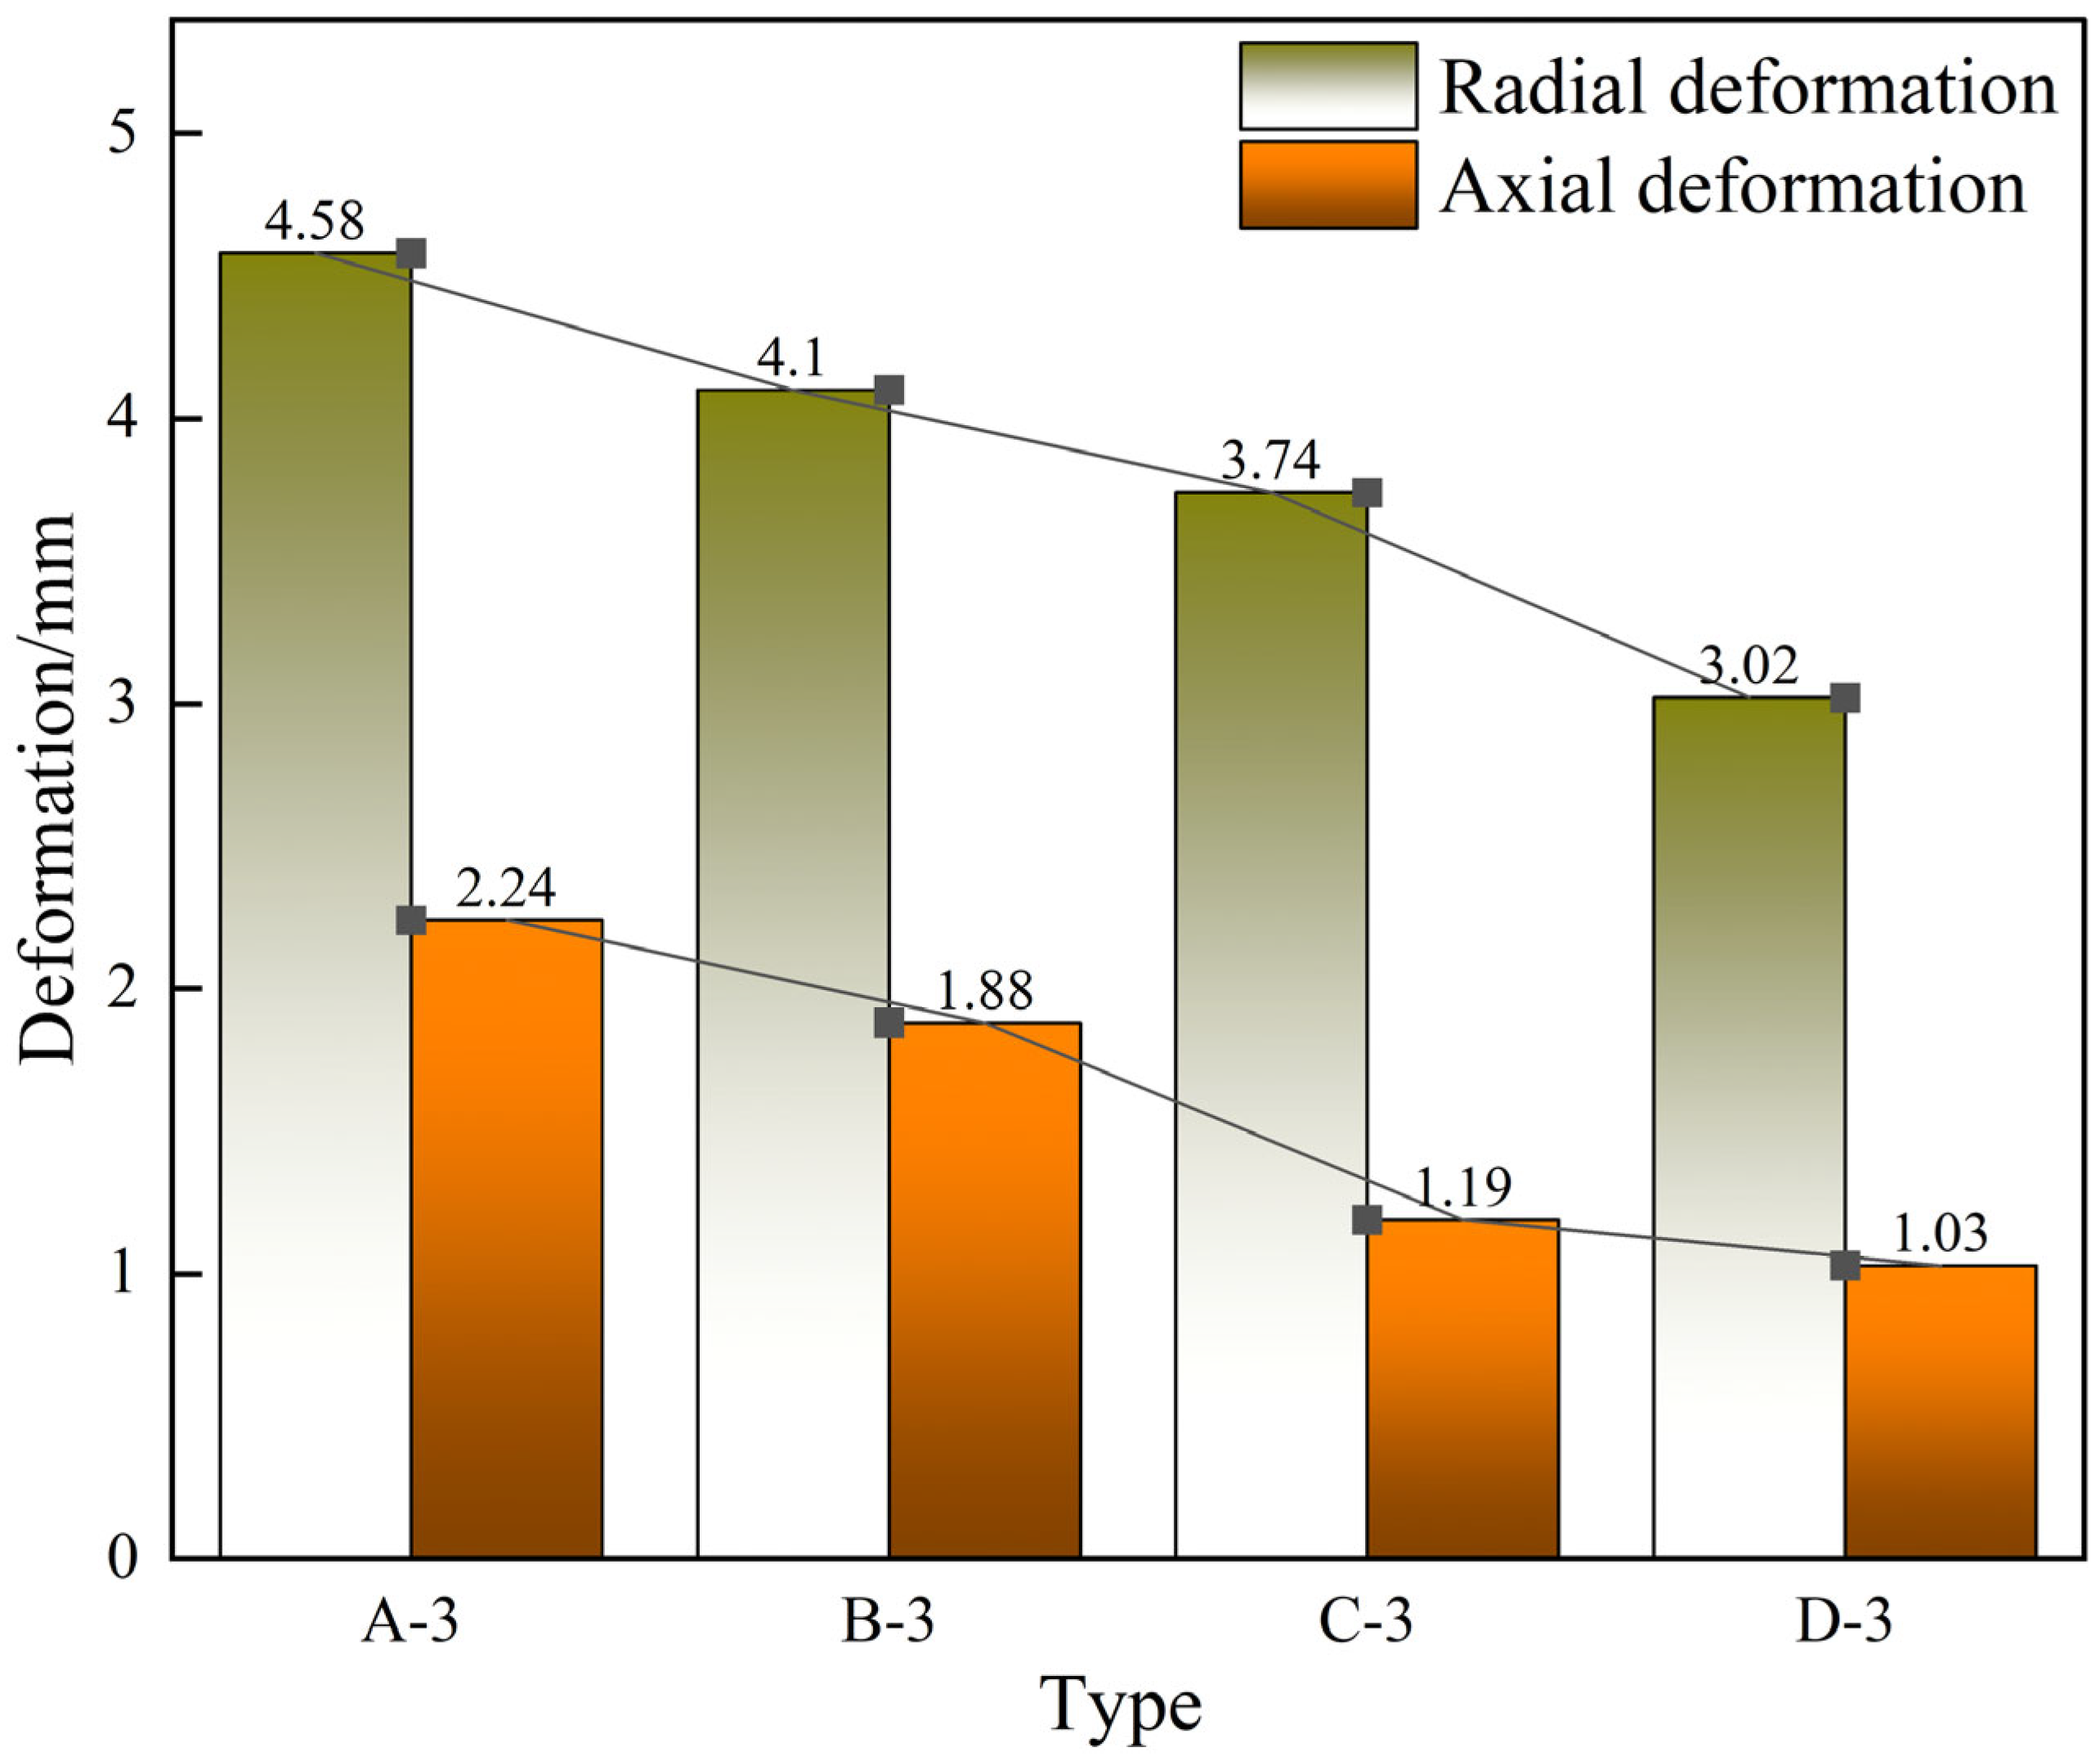
Figure 15 shows the axial and radial deformations obtained from the variation in the radius of the hemispherical cavity. As the cavity radius of the hemisphere increases, the axial and radial deformations at the end of the hemisphere gradually decrease. At Type D-3 (with a cavity radius of 1.5), the axial and radial deformations and the contact area of a single hemisphere are 1.03 mm, 3.03 mm, and 7.21 mm
2, respectively. Compared to Type A-3 (a solid hemisphere), the axial and radial deformation and contact area decreased by 54.0%, 34.1%, and 56.25%, respectively. The simulation results indicate that for the annularly distributed multi-sphere point contact structure, adding hemispherical cavities can improve impact resistance or reduce deformation under the same impact load when the number and diameter of hemispheres are fixed.
6. Conclusions
This paper utilizes the Hertz contact theory to design an annularly distributed multi-sphere point contact structure made from a WE43 magnesium alloy substrate. The finite element model, validated by hydraulic impact testing, was used to analyze the impact-resistant performance of the structure based on hemisphere diameter, number of hemispheres, and hemisphere cavity radius. The conclusion is as follows:
(1) Increasing the diameter of the hemispheres in the WE43 magnesium alloy multi-spherical point contact structure leads to a decrease in radial and axial deformations under the same impact load. Stress is concentrated at the point contact parts and distributed in a ring pattern. The 6 × Φ 3 structure is completely crushed, with axial and radial deformations of 2.24 mm and 4.58 mm in the 6 × Φ 6 structure.
(2) When the diameter of the WE43 magnesium alloy hemispheres is kept constant, deformation decreases as the number of hemispheres increases. The change in the number of hemispheres has a more significant impact on the radial deformation of the structure. Structures with fewer hemispheres are completely crushed under the same impact load, with stress concentrated at the contact part between the hemispheres and the connecting plate. Increasing the number of hemispheres significantly enhances the impact resistance of the structure, causing the stress concentration area to shift from the contact part to the end of the hemisphere.
(3) The impact resistance of the structure with a constant number and diameter of WE43 magnesium alloy hemispheres is significantly influenced by the cavity radius. The stress distribution in solid hemispheres is arc-shaped, while hollow structures with cavity radii of 0.5 and 1.5 have “V”- and “U” -shaped stress distributions, respectively. Increasing the cavity radius shifts the stress from the sphere ends to the cavity area, reducing the load impact on the sphere ends. Compared to a solid structure, the R1.5 cavity structure decreases axial and radial deformations and the contact area of a single sphere by 54%, 34.1%, and 56.25%, respectively.
The WE43 magnesium alloy structure with multi-spherical point contact, as described in this paper, offers both impact resistance and a small contact area. Through the manipulation of hemisphere parameters and the integration of internal cavities, the structure’s deformation and impact resistance can be customized or enhanced in real-world engineering scenarios. This investigation introduces a novel perspective on the selection of buffer structures in high-impact fields.
Author Contributions
Conceptualization, X.S. and Y.W.; methodology, X.S.; software, X.S.; validation, G.Y. and Q.M.; formal analysis, G.Y.; investigation, Y.W.; resources, W.W.; data curation, X.S.; writing—original draft preparation, X.S.; writing—review and editing, Q.M.; visualization, X.S.; supervision, Y.W.; project administration, X.S. All authors have read and agreed to the published version of the manuscript.
Funding
This research received no external funding.
Data Availability Statement
The raw data supporting the conclusion of this article will be made available by the authors on request.
Acknowledgments
This work is supported by the Rocket Launcher Engineering Teaching and Research Department of the Shijiazhuang Campus of Army Engineering University.
Conflicts of Interest
The authors state that the study was conducted without any evidence of business or financial relationships that could be interpreted as potential conflicts of interest.
References
- Li, J.; Li, J.; Qin, L.; Liu, W.; Wei, X.; Gao, N.; Liu, Y. Optimal Design and Analysis on High Overload Buffer Structure of Passive Semi-Strapdown Inertial Navigation System. Sensors 2020, 20, 1131. [Google Scholar] [CrossRef] [PubMed]
- Figovsky, O.L.; Sklyarsky, L.S.; Sklyarsky, O.N. Polyurethane Adhesives for Electronic Devices. J. Adhes. Sci. Technol. 2000, 14, 915–924. [Google Scholar] [CrossRef]
- Hollis, M.S.L.; Brandon, F.J. Range Correction Module for a Spin Stabilized Projectile. US5816531A, 1985. [Google Scholar]
- Xia, H.; Sun, Q.; Wang, S. FE Model to Define Impacting Resistance Behavior of RC Beams Protected by AlSi10Mg Buffer Interlayer. Structures 2023, 58, 105329. [Google Scholar] [CrossRef]
- Yu, Z.; Xin, R.; Xu, Z.; Sha, L.; Chen, L.; Zhu, Y.; Liang, P.; Zhang, Z.; Liu, Z.; Cao, Q. Shock-Resistant and Energy-Absorbing Properties of Bionic NiTi Lattice Structure Manufactured by SLM. J. Bionic Eng. 2022, 19, 1684–1698. [Google Scholar] [CrossRef]
- Ji, M.; Guo, Y.; Han, X.; Fu, Y.; Kang, J.; Wei, Q. Dynamic Cushioning Energy Absorption of Paper Composite Sandwich Structures with Corrugation and Honeycomb Cores under Drop Impact. J. Sandwich Struct. Mater. 2022, 24, 1270–1286. [Google Scholar] [CrossRef]
- Chang, Y.; Ma, P.; Jiang, G. Energy Absorption Property of Warp-Knitted Spacer Fabrics with Negative Possion’s Ratio under Low Velocity Impact. Compos. Struct. 2017, 182, 471–477. [Google Scholar] [CrossRef]
- Zhang, Y.; Cai, D.; Peng, J.; Qian, Y.; Wang, X.; Miao, L. On Low-Velocity Impact Behavior of Sandwich Composites with Negative Poisson’s Ratio Lattice Cores. Compos. Struct. 2022, 299, 116078. [Google Scholar] [CrossRef]
- Wang, J.; Luo, X.; Wang, K.; Yao, S.; Peng, Y. On Impact Behaviors of 3D Concave Structures with Negative Poisson’s Ratio. Compos. Struct. 2022, 298, 115999. [Google Scholar] [CrossRef]
- Wen, K.; Chen, X.-W.; Chi, R.-Q.; Lu, Y.-G. Analysis on the Fragmentation Pattern of Sphere Hypervelocity Impacting on Thin Plate. Int. J. Impact Eng. 2020, 146, 103721. [Google Scholar] [CrossRef]
- Wen, K.; Chen, X.-W. Failure Evolution in Hypervelocity Impact of al Spheres onto Thin al Plates. Int. J. Impact Eng. 2021, 147, 103727. [Google Scholar] [CrossRef]
- Piekutowski, A.J. Fragmentation of a Sphere Initiated by Hypervelocity Impact with a Thin Sheet. Int. J. Impact Eng. 1995, 17, 627–638. [Google Scholar] [CrossRef]
- Piekutowski, A.J. Fragmentation-Initiation Threshold for Spheres Impacting at Hypervelocity. Int. J. Impact Eng. 2003, 29, 563–574. [Google Scholar] [CrossRef]
- Watson, E.; Steinhauser, M.O. Discrete Particle Method for Simulating Hypervelocity Impact Phenomena. Materials 2017, 10, 379. [Google Scholar] [CrossRef] [PubMed]
- Gong, L.; Zhang, Q.; Long, R.; Wang, J.; Liu, W. Theoretical Analysis of Ionization of Spherical Aluminum Alloy Projectile Impacting Aluminum Alloy Target in Hypervelocity Impact. Int. J. Impact Eng. 2021, 158, 104022. [Google Scholar] [CrossRef]
- Johnson, K.L. Contact Mechanics; Cambridge University Press: Cambridge, UK, 1985. [Google Scholar]
- Cao, Y.; Zhen, Y.; Song, M.; Yi, H.; Li, F.; Li, X. Determination of Johnson–Cook Parameters and Evaluation of Charpy Impact Test Performance for X80 Pipeline Steel. Int. J. Mech. Sci. 2020, 179, 105627. [Google Scholar] [CrossRef]
- Ye, T.; Qiu, S.; Xia, E.; Guo, P.; Wu, Y.; Li, L. High speed impact mechanical response and constitutive model of extruded WE43 magnesium alloy under different loading Paths. Mater. Rev. 2024, 38, 247–255. [Google Scholar]
- Feng, F.; Huang, S.; Meng, Z.; Hu, J.; Lei, Y.; Zhou, M.; Yang, Z. A Constitutive and Fracture Model for AZ31B Magnesium Alloy in the Tensile State. Mater. Sci. Eng. A 2014, 594, 334–343. [Google Scholar] [CrossRef]
- Qin, Y.; Zhu, X.; Yin, J.; Yu, Z.; Zhaoyang, F.; Chao, X. Strength and Damage Analysis of Composite Tube with Metal Lining. Mech. Adv. Mater. Struct. 2024, 31, 9639–9653. [Google Scholar] [CrossRef]
- Geng, B. Study on dynamic mechanical properties of 35CrMnSiA. In Proceedings of the 13th National Combat Warhead and Damage Technology Academic Exchange Conference, Huangshan, China, 21–24 September 2013; pp. 1350–1353. [Google Scholar]
Figure 1.
Schematic diagram of point contact.
Figure 1.
Schematic diagram of point contact.
Figure 2.
The multi-sphere point contact structure.
Figure 2.
The multi-sphere point contact structure.
Figure 4.
Impact test: (a) impacting the scene; (b) enlarged view of the specimen; (c) sectional view of the specimen.
Figure 4.
Impact test: (a) impacting the scene; (b) enlarged view of the specimen; (c) sectional view of the specimen.
Figure 5.
Test results: (a) the impact signal spectrum; (b) the base plate; (c) the multi-sphere.
Figure 5.
Test results: (a) the impact signal spectrum; (b) the base plate; (c) the multi-sphere.
Figure 6.
Impact finite element model.
Figure 6.
Impact finite element model.
Figure 7.
Stress cloud plots before and after the impact: (a) Type A-1; (b) Type B-1; (c) Type C-1; (d) Type D-1.
Figure 7.
Stress cloud plots before and after the impact: (a) Type A-1; (b) Type B-1; (c) Type C-1; (d) Type D-1.
Figure 8.
Plastic strain and status cloud plots before and after the impact: (a) Type A-1; (b) Type B-1; (c) Type C-1; (d) Type D-1.
Figure 8.
Plastic strain and status cloud plots before and after the impact: (a) Type A-1; (b) Type B-1; (c) Type C-1; (d) Type D-1.
Figure 9.
Deformation of different hemisphere diameters.
Figure 9.
Deformation of different hemisphere diameters.
Figure 10.
Stress cloud plots before and after impact: (a) Type A-2; (b) Type B-2; (c) Type C-2; (d) Type D-2.
Figure 10.
Stress cloud plots before and after impact: (a) Type A-2; (b) Type B-2; (c) Type C-2; (d) Type D-2.
Figure 11.
Plastic strain and status cloud plot before and after impact: (a) Type A-2; (b) Type B-2; (c) Type C-2; (d) Type D-2.
Figure 11.
Plastic strain and status cloud plot before and after impact: (a) Type A-2; (b) Type B-2; (c) Type C-2; (d) Type D-2.
Figure 12.
Deformation with different numbers of hemispheres.
Figure 12.
Deformation with different numbers of hemispheres.
Figure 13.
Stress cloud plots before and after impact: (a) Type A-3; (b) Type B-3; (c) Type C-3; (d) Type D-3.
Figure 13.
Stress cloud plots before and after impact: (a) Type A-3; (b) Type B-3; (c) Type C-3; (d) Type D-3.
Figure 14.
Plastic strain and status cloud plot before and after impact: (a) Type A-3; (b) Type B-3; (c) Type C-3; (d) Type D-3.
Figure 14.
Plastic strain and status cloud plot before and after impact: (a) Type A-3; (b) Type B-3; (c) Type C-3; (d) Type D-3.
Figure 15.
Deformation of the hemisphere with different cavity radii.
Figure 15.
Deformation of the hemisphere with different cavity radii.
Table 1.
The performance parameters [
18,
19,
20,
21].
Table 1.
The performance parameters [
18,
19,
20,
21].
| Materials | E [MPa] | ν | ρ [kg/m3] | σs [MPa] |
|---|
| WE43 | 45,000 | 0.33 | 1830 | 200 |
| 35CrMnSiA | 206,000 | 0.29 | 8000 | 1275 |
| No. 45 steel | 210,000 | 0.269 | 7850 | 355 |
Table 2.
The Johnson–Cook parameters of the WE43 magnesium alloy [
18,
19].
Table 2.
The Johnson–Cook parameters of the WE43 magnesium alloy [
18,
19].
| Constitutive Parameter | Damage Parameter [mm] |
|---|
| Yield strength, A [MPa] | 243 | D1 | −0.35 |
| Strain hardening parameters, B [MPa] | 323.2 | D2 | 0.6025 |
| Strain hardening index, n | 0.4188 | D3 | −0.4537 |
| Strain rate sensitivity coefficient, C | 0.03 | D4 | 0.206 |
| Temperature coefficient, m | 1 | D5 | 7.2 |
Table 3.
The Johnson–Cook parameters of Steel No. 45 [
20].
Table 3.
The Johnson–Cook parameters of Steel No. 45 [
20].
| Constitutive Parameter | Damage Parameter [mm] |
|---|
| Yield strength, A [MPa] | 507 | D1 | 0.1 |
| Strain hardening parameters, B [MPa] | 320 | D2 | 0.76 |
| Strain hardening index, n | 0.28 | D3 | 1.57 |
| Strain rate sensitivity coefficient, C | 0.064 | D4 | 0.005 |
| Temperature coefficient, m | 1.06 | D5 | −0.84 |
Table 4.
The Johnson–Cook parameters of 35CrMnSiA [
21].
Table 4.
The Johnson–Cook parameters of 35CrMnSiA [
21].
| Constitutive Parameter | Damage Parameter [mm] |
|---|
| Yield strength, A [MPa] | 1280 | D1 | 0.05 |
| Strain hardening parameters, B [MPa] | 346 | D2 | 0.7 |
| Strain hardening index, n | 0.372 | D3 | 1.5 |
| Strain rate sensitivity coefficient, C | 0.015 | D4 | 0.008 |
| Temperature coefficient, m | 1.027 | D5 | −0.9 |
Table 5.
Comparison of hemisphere simulation and test results.
Table 6.
Comparison of sleeve simulation and test results.
Table 7.
The structural parameters of hemisphere diameter.
Table 7.
The structural parameters of hemisphere diameter.
| Type | A-1 | B-1 | C-1 | D-1 |
|---|
| Parameters/mm | 6 × Φ 3 | 6 × Φ 4 | 6 × Φ 5 | 6 × Φ 6 |
Table 8.
The structural parameters of hemisphere quantity.
Table 8.
The structural parameters of hemisphere quantity.
| Type | A-2 | B-2 | C-2 | D-2 |
|---|
| Parameters/mm | 3 × Φ 6 | 4 × Φ 6 | 5 × Φ 6 | 6 × Φ 6 |
Table 9.
The structural parameters of cavity radius of the hemisphere.
| Disclaimer/Publisher’s Note: The statements, opinions and data contained in all publications are solely those of the individual author(s) and contributor(s) and not of MDPI and/or the editor(s). MDPI and/or the editor(s) disclaim responsibility for any injury to people or property resulting from any ideas, methods, instructions or products referred to in the content. |
© 2025 by the authors. Licensee MDPI, Basel, Switzerland. This article is an open access article distributed under the terms and conditions of the Creative Commons Attribution (CC BY) license (https://creativecommons.org/licenses/by/4.0/).


