Abstract
In this paper, a discrete element method (DEM) coupled with a finite element method (FEM) was used to elucidate the impact of packing structures and size ratios on the cold die compaction behavior of pure copper powders. HCP structure, SC structure, and three random packing structures with different particle size ratios (1:2, 1:3, and 1:4) were generated by the DEM, and then simulated by the FEM to analyze the average relative density, von Mises stress, and force chain structures of the compact. The results show that for HCP and SC structures with a regular stacking structure, the average relative densities of the compact were higher than those of random packing structures, which were 0.9823, 0.9693, 0.9456, 0.9502, and 0.9507, respectively. Compared with their initial packing density, it could be improved by up to 21.13%. For the bigger particle in HCP and SC structures, the stress concentration was located between the adjacent layers, while in the small particles, it was located between contacted particles. During the initial compaction phase, smaller particles tend to occupy the voids between larger particles. As the pressure increases, larger particles deform plastically in a notable way to create a stabilizing force chain. This action reduces the axial stress gradient and improves radial symmetry. The transition from a contact-dominated to a body-stress-dominated state is further demonstrated by stress distribution maps and contact force vector analysis, highlighting the interaction between particle rearrangement and plasticity.
1. Introduction
Metal powder pressing is commonly used in the field of powder metallurgy and additive manufacturing, especially for the fabrication of high-performance components in electronic digital, aerospace, and energy systems [1,2,3,4,5,6,7,8]. Among them, pure copper materials are widely used for their excellent electrical and thermal conductivity, making them the material of choice for critical manufacturing applications such as smart robotic components and conductive interconnects. The application of numerical simulation to the study of metals allows for more accurate analysis based on material properties [9,10,11,12,13,14,15]. However, achieving uniform densification and mechanical integrity in copper powder briquettes remains a formidable challenge, primarily attributed to the complex interplay of particle size distribution, stacking heterogeneity, and deformation mechanics during compaction, as highlighted in experimental studies by Ward et al. [16] on the ultrasonic powder compaction of copper and Li et al. [17] on densification mechanisms, mainly due to the complex interplay of particle size distribution, stacking heterogeneity, and deformation mechanics during compaction. Current studies have mainly focused on traditional monodisperse powders or simplified continuum models, and the role of fixed particle size ratio, although a key factor in industrial processes, remains under-explored, especially at the mesoscopic scale where discrete particle interactions determine macroscopic results [18,19,20,21,22]. In recent years, scholars at home and abroad have combined the DEM and FEM methods to simulate the dynamics of granular materials at the million-atom scale, revealing the energy transfer and distribution laws in the process of particle fragmentation, and verifying the applicability of the coupling method in the analysis of particle fragmentation [23,24]. Zhong et al. [25] further advanced computational efficiency for fracture simulations using accelerated peridynamics on GPU. Through the development of an advanced simulation model with high accuracy, we examine material–structure interactions and simulate the pressing procedure [26]. The potential of particle-based methods has been demonstrated in studies such as that by Yanov and Zelepugin [27], who used DEM simulations to analyze the dynamic pressing of copper samples. This approach helps us understand how material pressing relates to structural load-bearing capacity, confirms the impact of particle load transfer on structural load-bearing capacity, and offers guidance for enhancing component quality and performance in practical production [28,29]. Additionally, Wang et al. [30] applied a coupled DEM-FEM approach to study double compaction of Cu-Al powders with multiple size fractions, though not systematically fixed ratios, revealing insights into load transfer. In this type of research, numerical simulation plays a crucial role, avoiding the high costs associated with traditional experiments and enabling the establishment of a more accurate and efficient model framework for optimizing process parameters [31,32,33,34].
This paper focuses on the microscopic simulation analysis of cold molding of pure copper metal powders with a fixed particle size ratio, aiming to reveal the effects of different particle size ratios on the densification behavior, stress distribution, and particle deformation of the powder briquettes. The framework is constructed by the DEM-FEM method, the forming mechanism at multiple scales is systematically analyzed, and the optimization strategy is proposed. Therefore, this study directly addresses the identified gap by employing a sophisticated hybrid DEM-FEM approach to systematically investigate, for the first time, the mesoscopic densification behavior, stress evolution, and particle deformation mechanisms in cold die compaction of pure copper powders with fixed particle size ratios of 1:2, 1:3, and 1:4. We aim to provide unprecedented insights into the synergistic effects governing optimal densification at these specific ratios and establish a predictive link between particle-scale interactions and macroscopic properties. The model in the paper integrates the improved Coulomb friction law and the von Mises yield criterion commonly used for density, and is fitted and validated in conjunction with the classical compaction theory (Huang Peiyun and Heckel equations) to make a mechanistic explanation of the synergistic effect of small particle filling and large particle plasticity, and to demonstrate the quantitative correlation between particle-scale deformation and the dynamics of body densification. The inter-particle stress transfer paths are resolved by equivalent Mises stress cloud plots with contact force vector plots. The contact force dominates in the early stage of pressing and turns to body stress dominance in the later stage, revealing the synergistic effect of particle rearrangement and plastic deformation. It is proposed that by increasing the particle size ratio and optimizing the radius of curvature of the molds, the stress concentration is reduced and the uniformity of the press blanks is improved.
This paper proposes to unify multi-scale simulations with theoretical validation, which not only advances the fundamental understanding of the mechanics of powder compacting, but also establishes a predictive framework for designing next-generation materials with engineered microstructures and has direct industrial relevance for optimizing numerical simulations of powder systems in additive manufacturing and mold compacting. The methodology presented in this study is broadly applicable to other ductile metal powder frameworks used for high-density components, bridging the gap between theoretical knowledge in basic science and technological innovations in engineering applications, and providing a new entry point into the field of powder compaction.
2. Simulation Method and Conditions
2.1. Geometric Modeling
The rapid development of science and technology has driven traditional continuum mechanics to provide a solid foundation for the powder compacting process, and with the birth and development of the DEM and FEM methods, it has promoted the wide application of this method in industrial production. The MPFEM is a numerical simulation method that combines the DEM and FEM to analyze the micromechanical behavior of powders during the pressing process from the particle scale. The core idea is to dynamically generate the initial particle stacking structure (e.g., ordered tetragonal, hexagonal dense stacking, or random stacking) by the DEM. The MPFEM simulates the contact, deformation, and interaction between particles by explicit and implicit integration algorithms, which overcomes the limitation of the traditional FEM that cannot describe the characteristics of the discrete particles, and, at the same time, solves the problem of large deformation and high-density pressing in the DEM. It also solves the problem of the lack of accuracy in large deformation and high-density pressing. The method is particularly suitable for analyzing the densification dynamics of metal powders, and is able to keenly and accurately capture the key mechanisms of particle rearrangement, plastic deformation, pore filling, and force chain evolution. In the numerical simulation of metal powders using the MPFEM, the material’s intrinsic behavior is usually described based on an elastic-plastic model as well as an elastic model, respectively, where the yield stress can be represented by a power-law hardening model:
For the construction of the initial stacking structure, there are two types of ordered structures (e.g., tetragonal and hexagonal dense stacking generated by geometrical rules) and random structures (generated by simulating gravitational settling using the DEM). In the numerical simulation of pressing, the software MSC Marc 2015 (MSC Software Corporation, Newport Beach, CA, USA) is used for mesh delineation, which supports local mesh encryption and dynamic redistribution, and can effectively cope with the intense plastic deformation of particles in the process of powder pressing. MARC2015, with its unique technical architecture and algorithmic advantages, plays an irreplaceable role in the simulation of cold die pressing of pure copper powder in this paper. Through the global mesh redistribution strategy, it solves the problem of mesh failure of the traditional FEM under large deformation, ensures the accuracy of stress distribution maps (e.g., von Mises stresses), and seamlessly connects with the discrete element method (DEM) to realize the cross-scaling simulation of particle Scale Rearrangement–Continuum Stresses for cross-scale simulations [35], while the Updated Lagrange formula (2), a finite element method to deal with geometric nonlinear problems (such as large deformation, large strain), is used to deal with the geometrical nonlinearity. The core idea is to update the reference configuration to the current deformed configuration in each iteration, so as to describe the deformation behavior of the material more accurately. The convergence criterion uses the Newton–Raphson method’s displacement residuals to ensure computational stability. This classical iterative technique is widely employed for solving nonlinear equation systems, and its core idea is to gradually approximate the roots of equations through local linearization. In geometrically nonlinear finite element analysis, the Updated Lagrange formulation is often used in conjunction with the Newton–Raphson iterative method. The Updated Lagrange framework provides geometrically nonlinear stress–strain update rules, while the Newton–Raphson method is used to solve nonlinear equilibrium equations through the iterative modification of the displacement field. For example, in a material nonlinear problem, the Cauchy stress and deformation gradient need to be updated at each iteration, and the tangent stiffness matrix needs to be recalculated to reflect the current change in configuration. By combining the two, strong nonlinear problems in complex engineering of metal forming can be solved efficiently.
where is the type II Piola–Kirchhoff stress tensor, is the Green –Lagrange strain tensor, is the imaginary strain, and and are the bulk and surface forces, respectively.
In FEA, this method is used to solve the nonlinear equilibrium equation, so the optimization is corrected to:
where is the tangent stiffness matrix, is the displacement increment, and is the residual force vector; the superscript denotes the ith iteration.
The macroscopic response is analyzed by a relative density–pressure curve to analyze the densification behavior and is commonly used to fit Heckel’s Equation (5), invented by R.W. Heckel, with Huang Peiyun’s Equation (6). The microscopic mechanism reveals the densification dynamics by equivalent von Mises stress distribution and force chain structure.
where is the densification factor, reflecting the plastic deformation capacity of the particles
where is the dense metal density, is the powder bulk density, is the billet density, is the pressing pressure per unit, is the pressing modulus, and is the hardening index.
Numerical simulations typically divide the compaction of metal powders focusing on densification mechanisms into three key stages: particle rearrangement, plastic deformation, and stress distribution homogenization as the material approaches full density.
This research concentrates on finite element simulations of copper powder particles’ bi-directional molding process across varying particle size ratios. Observations from these simulations reveal that when using 200 particles instead of 400, the influence of 200 particles on the simulation results is relatively small, i.e., the 200 particles can to a certain extent reflect the process of particle molding densification. Therefore, 200 particles are selected for simulation in the paper. The initial particle structure is created using the discrete element method. Particle positions are then exported and brought into finite element software to form a random geometric model. After that, meshing is performed on each particle. The material model employs the von Mises yield function, with its expression presented in Equation (7).
where , , and are the Cauchy principal stresses along the three principal axis directions, respectively.
Within the simulation framework, powder particles are designated as deformable entities, while the mold and upper/lower punches are treated as rigid bodies. Throughout the bi-directional molding process, the mold remains stationary as simultaneous loading is applied to both punches. The material properties of copper particles are given in Table 1. The simulation employs the Coulomb model for friction, with friction coefficients between particles and between particles and the mold’s inner wall fixed at 0.2. Figure 1 illustrates the schematic diagrams of both regular and random arrangement models for copper powder particles of varying sizes, while Figure 1a,b show the HCP arrangement and the SC stacking model of copper particles, respectively, and Figure 1c–e are the ratio of the particle sizes of the copper particles in the large and small particles, respectively. is taken as 1:2, 1:3, and 1:4, where the radius of large particles is constant at 0.5 mm. The initial stacking structure parameters of copper particles, including the particle size ratio, number of particles, and initial stacking density, are presented in Table 2. The corresponding schematic diagrams of these packing structures (HCP, SC, and random arrangements with size ratios of 1:2, 1:3, and 1:4) are visually summarized in Figure 1.

Table 1.
Table of material parameters.
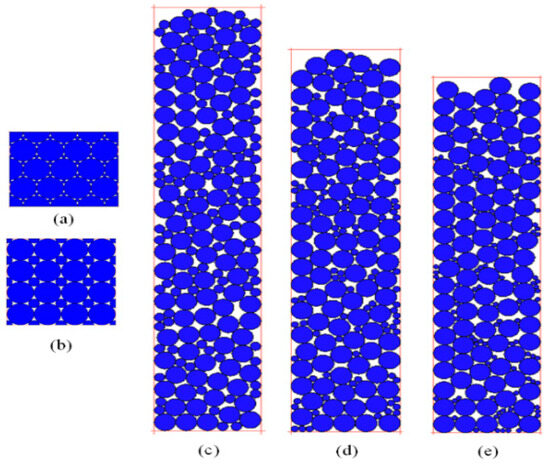
Figure 1.
Schematic diagram of different packing structures. (a,b) show the HCP arrangement and the SC stacking model of copper particles, respectively, and (c–e) are the ratio of the particle sizes of the copper particles in the large and small particles, respectively. is taken as 1:2, 1:3, and 1:4.
Table 2.
Parameters of initial packing structure for Cu particles.
The four pressing stages (40 MPa, 100 MPa, 300 MPa, and 600 MPa) were strategically selected to capture distinct densification mechanisms identified in prior studies of ductile metal powders [36,37,38].
2.2. Validation of Model Validity and Mesh Independence Analysis
To demonstrate the reliability of the simulation outcomes, the validity of the selected von Mises model for powder particles with varying size ratios was initially verified. The simulation findings for regularly arranged particles (Figure 1a,b) show that the HCP structure has a much higher relative density than the SC structure. In contrast, for copper particles in a random stacking structure (Figure 1c–e), the early pressing stage is marked by noticeable particle slippage and rotation, and the relative density variation curves obtained are shown in Figure 2. Figure 2a,b demonstrate characteristic regime transitions. The 100–300 MPa interval exhibits peak densification rates, while, beyond 300 MPa, strain hardening dominates with <5% density increase per 100 MPa, justifying 300 MPa and 600 MPa as critical sampling points. The simulation findings for regularly arranged particles show that the HCP structure has a much higher relative density than the SC structure. Both structures are highly stable, so in the early stages of pressing, the particles do not level or rearrange but deform directly, causing the briquette’s relative density to increase slowly. During the middle pressing phase, the briquette’s relative density gradually rises as copper particles plastically deform to fill the pores within the briquette. In the late pressing stage, the relative density growth flattens since the copper particles can hardly increase in size or deform further.
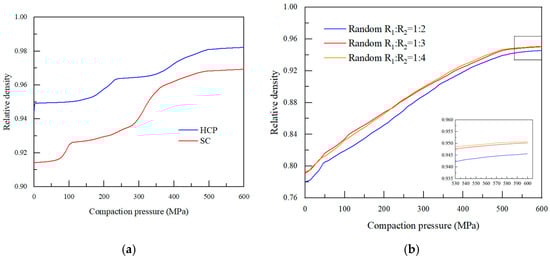
Figure 2.
Variation of relative density for regular and random packing structure. (a,b) demonstrate characteristic regime transitions.
In contrast, for copper particles in a random stacking structure, the early pressing stage is marked by noticeable particle slippage and rotation. Small particles can move to fill some of the larger pores inside the billet, leading to a rapid and linear increase in relative density. As the pressing force continues to rise, the particles undergo elastic-plastic deformation and continue to fill adjacent pores. The briquette’s relative density then increases significantly with the pressing force. When the billet’s relative density exceeds 0.94, the curve’s growth rate slows, indicating the onset of the third pressing stage. Despite some residual small pores within the billet that are hard to fill through particle deformation, the figure shows that the briquette’s relative density gradually increases with the particle size difference. The briquette’s relative density is highest when the particle size ratio is 1:4. Compared with pressing copper powder particles of equal size, those with different particle size ratios have better densification properties. This is because smaller particles can more effectively fill the pores between particles, directly reducing the large pore area within the briquettes and improving the overall average density.
The empirical formula for powder compaction is a classical theory derived by researchers from a large quantity of experimental data and is often used as a validation for numerical simulations. The data for both regular and random stacking structures in Figure 2 were fitted using the empirical formulas from Peiyun Huang and the Heckel pressing theory, with the results presented in Figure 3. The five particle stacking cases fitted via Huang’s formula showed a high degree of fit. Similarly, the fits using Heckel’s formula were also quite high. Although the fit is relatively low for the ideal state of regularly arranged structures, the fit is high for random structures, thus also verifying the validity of the model selected in the simulation. Compared with the research results of Ward et al., it can be seen that the simulation results are better and have strong practicality [16].
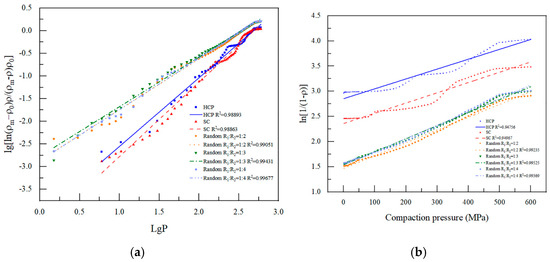
Figure 3.
Results of Huang Peiyun and Heckel equations fitting. (a) is the result of fitting with the Huang Peiyun formula, and (b) is the result of fitting with Heckel.
Selecting the right mesh in simulations is crucial as it ensures result accuracy while cutting computation time and boosting efficiency. In this section, we look at two mesh sparsity levels for randomly arranged particles and the particle size ratio of for the 1:2 of the copper powder particles of the bi-directional molding calculations. Figure 4 displays how relative density varies with compressive force; the two mesh sparsity levels yield almost identical curves, with a maximum result difference of under 1%. This confirms that mesh sparsity has minimal impact on the results, so the coarser mesh shown in this figure is chosen for subsequent meshing to enhance simulation efficiency.
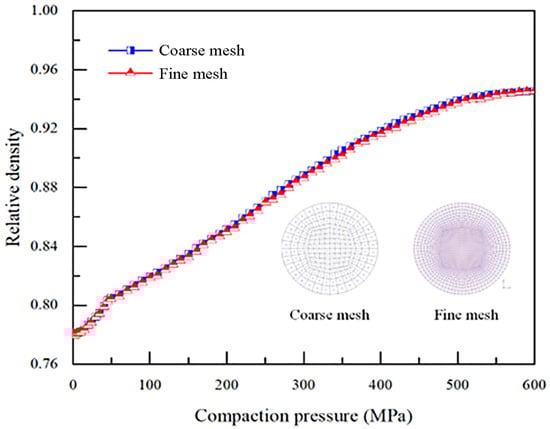
Figure 4.
The effect of mesh dimensions on simulation outcomes.
3. Results and Discussion
The stress distribution inside the press billet, as an important monitoring index in powder molding, is difficult to measure by experimental methods, and the finite element method can solve this problem well. Figure 5 reveals mechanistic evolution across deliberately selected pressures and presents equivalent Mises stress distribution across four pressing stages (40 MPa, 100 MPa, 300 MPa, and 600 MPa) in HCP powder particle stacks. It shows that stress between large particles is mainly concentrated at contact points with adjacent-layer particles, while stress between same-layer particles is minimal. Stress in small particles is focused at contact points with surrounding large particles. As pressing force increases, particle contact evolves from point- to arc-shaped, expanding the contact area and stress. Figure 6’s contact normal force vectors reveal that initial pressing has minimal contact force and stress between same-layer particles. As force increases, contact force rises, with forces on the same contact surface pointing towards the particle center, forming a stable force chain that makes large deformation of copper particles difficult.
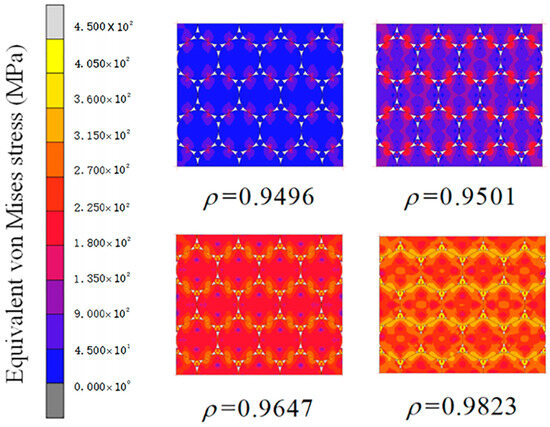
Figure 5.
Equivalent von Mises stress distributions at various compaction phases for HCP initial packing structure.
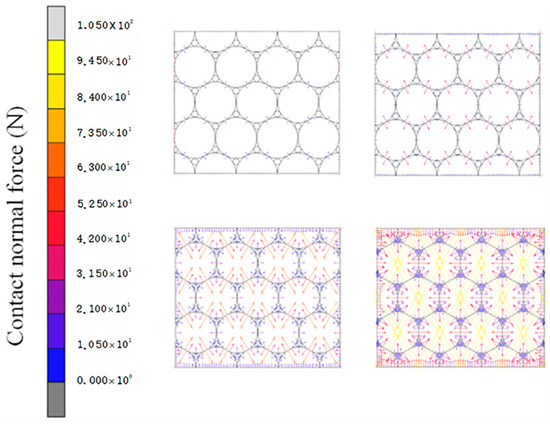
Figure 6.
Normal contact force vector plot for HCP structure.
Figure 7 illustrates the morphological Weand stress distribution of large and small particles in the HCP stacked structure. For clarity, the particles are not depicted exactly to the simulation scale. Initially spherical, the large particles transition to a polygonal shape as pressing progresses, while the small particles become nearly triangular. Stress values rise gradually, peaking at contact points between particles. Figure 8a,b show the stress variation trends along the axial and radial directions of the large particles from Figure 7. Axial stress increases with pressing force. At low forces, the axial stress gradient is slight and uniform, but it increases as pressing continues, with maximum stress at the particle ends and minimum stress near 0.3 mm and 0.7 mm heights. Radial stress follows a similar pattern, peaking at the ends in the radial direction.
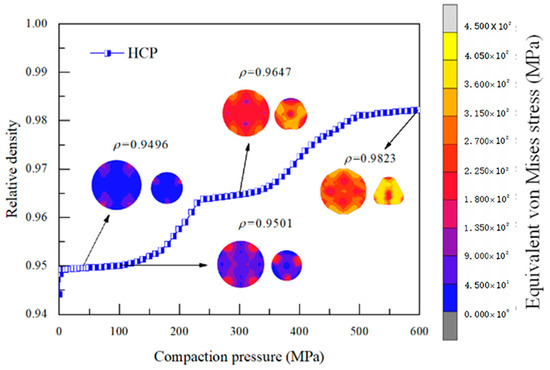
Figure 7.
Differences in particle configuration and equivalent von Mises stress distribution within HCP structures.
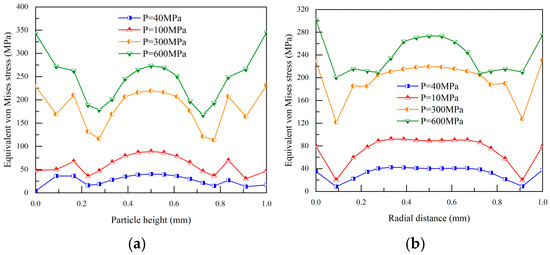
Figure 8.
Changes in axial and radial stress under varying compaction pressures for large particles. (a,b) show the stress variation trends along the axial and radial directions of the large particles.
The stress change of the small particles in the HCP structure is not the same as the stress distribution of the large particles, as shown in Figure 9. When small particles are compressed by three larger ones, they nearly form a triangle. Their axial stress distribution is asymmetrical and irregular. As the compaction force rises, so does the overall stress on the particles. The radial stress distribution of small particles shows some symmetry and regularity. The minimum stress is around 0.08 mm in the central area, while the maximum stress is near 0.03 mm and 0.13 mm. The radial stress also increases with the compaction force.
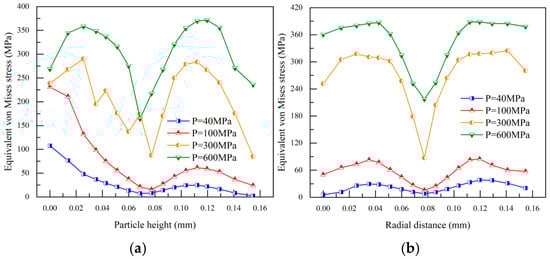
Figure 9.
Changes in axial and radial stress under varying cCompaction pressures for small particles. (a,b) show: Changes in axial and radial stress under varying compaction pressures for small particles.
Figure 10 presents the equivalent Mises stress distribution for the SC initial packing structure across four pressing stages. As pressing proceeds, the largest stress in big particles is at the contact area with upper and lower particles, with a smaller stress between same-layer particles. The highest stress in small particles is at the contact points with surrounding large particles. Particle contact evolves from point to line contact, increasing the contact area and the peak stress region. Figure 11 shows that initially, contact force between big particles is mainly between neighboring layers, while same-layer contact force is negligible. As pressing continues, same-layer contact force increases. Due to the growing contact area, the contact surface force becomes parallel and points to the particle center.
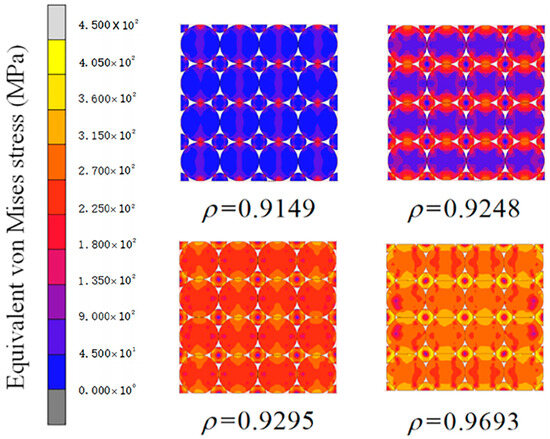
Figure 10.
Equivalent von Mises stress distributions across various compaction phases for SC initial packing structure.
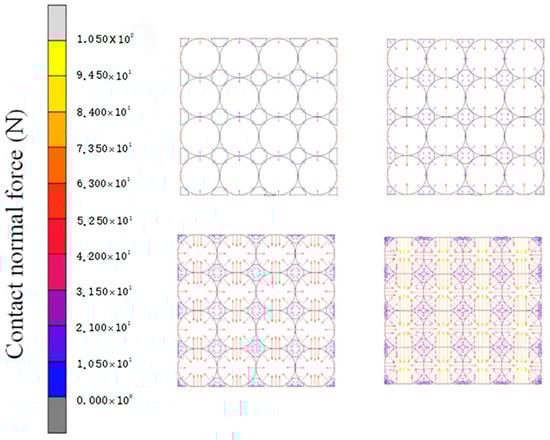
Figure 11.
Plot of normal contact force vectors for SC structure.
Figure 12 presents a cloud diagram illustrating the morphological and internal stress changes of large and small copper particles during the pressing process of the SC stacked structure. The large copper particles evolve from a round to a polygonal shape. Initially, the stress within these particles is primarily concentrated in the two end regions along the axial direction. As the pressing progresses, the stress inside the particles gradually increases, yet the highest stress remains at the upper and lower ends. In contrast, the small particles transition from a round to a shape that is nearly rhombic as the pressing force increases. The region of maximum stress in these small particles shifts from the initial four point contact areas to four contact surface areas.
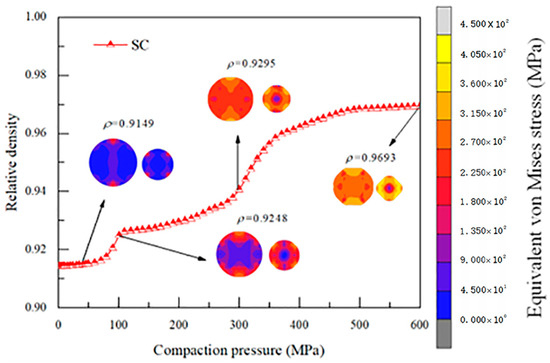
Figure 12.
Changes in particle configuration and equivalent von Mises stress distribution within SC structures.
Figure 13a,b display the curves depicting the changes in axial and radial stress of the large particles shown in Figure 12. At the early stage of pressing, there is a significant stress gradient along the axial direction of the particles. This is attributed to the maximum stress value being present only at the upper and lower ends of the particles, specifically in the region where they are in contact with particles from the adjacent layer. During this time, the stress value in the central region of the particles is relatively small. As the pressing force is increased from 40 MPa to 600 MPa, the maximum axial stress of the particles increases by approximately 119 MPa, while the minimum stress value increases by about 247 MPa. Consequently, the stress gradient within the particles decreases.
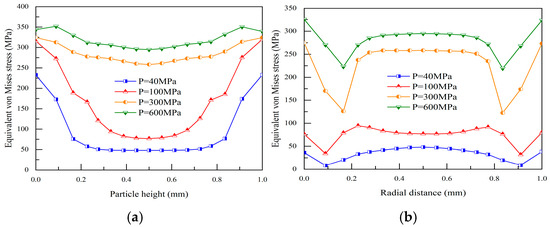
Figure 13.
Changes in axial and radial stress for large particles under different compaction pressures. (a,b) display the curves depicting the changes in axial and radial stress of the large particles.
However, in the radial direction, the stress within the particles is initially low at the beginning of the pressing process. The radial stress increases significantly as the pressing force is augmented. The minimum stress is located in the region near 0.2 mm and 0.8 mm, and the stress distribution becomes more uniform in the central region.
Figure 14a,b present axial and radial stress distribution for small particles in the SC stacked structure. Axial stresses are roughly symmetrically distributed, with maxima near 0.1 mm and 0.3 mm heights and a minimum near the middle height at 0.2 mm. The stress distribution of small particles along the radial direction is similar to the axial stress distribution, which is also basically symmetrically distributed, with the lowest stress at the center of the particles and the highest stress values at the positions of 0.1 mm and 0.3 mm.
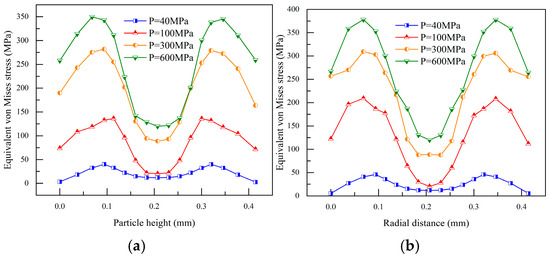
Figure 14.
Changes in axial and radial stress of small particles under varying compaction pressures. (a,b) present axial and radial stress distribution for small particles in the SC stacked structure.
In Figure 2b, the relative density of copper powders with varying particle size ratios in a random stacking configuration and the change curve of the pressing force are analyzed macroscopically, and the following is mainly from the fine-scale analysis of the stress distribution, particle deformation, and pore changes inside the billet. Figure 15a–f present equivalent Mises stress distribution clouds within the compact for a particle size ratio of 1:2 under pressures of 40 MPa, 100 MPa, 200 MPa, 300 MPa, 400 MPa, and 500 MPa. In the pressing initial stage, particles primarily rearrange. Unlike equal-sized particles, small particles in variable-size systems fill neighboring pores via displacement. At this point, internal stress in the compact is low, and the applied force is transmitted through only a few particles. As pressure increases, both particle sizes deform and continue to fill pores, reducing the pore area, enhancing compact densification, and increasing particle stress. To analyze the effect of particle size ratios on press forming, the marked structure A in the compact with random packing in Figure 1c–e is examined.
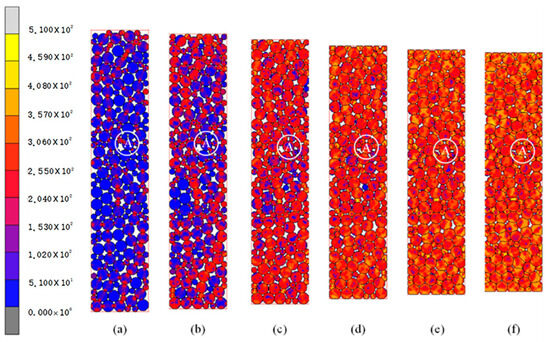
Figure 15.
Equivalent von Mises stress distribution in powder compacts with a size ratio of 1:2 under varying compaction pressures. (a–f) present equivalent Mises stress distribution clouds within the compact for a particle size ratio of 1:2 under pressures of 40 MPa, 100 MPa, 200 MPa, 300 MPa, 400 MPa, and 500 MPa.
Figure 16a presents the equivalent Mises stress variation cloud diagram for structure A from Figure 15. Structure A comprises a large particle with a radius of 0.5 mm surrounded by five smaller particles with a radius of 0.25 mm. During the pressing process, the particles undergo rearrangement and deformation, transitioning from point contact to line contact. Due to the irregular pore structure, the deformed particles take on an irregular shape, eventually becoming polygonal. As the pressing force increases, the stress within both large and small particles gradually rises. The maximum stress is primarily located at the contact regions between particles, and the area of high stress increases with the expansion of the contact surface. However, the stress between large particles remains higher than that between large and small particles, creating a distinct high-stress region at the bottom of the large particles in structure A. Figure 16b illustrates the contact normal force vectors in structure A. The contact normal force acts parallel to the contact surface and points toward the center of the particles. Compared with the pressing process of copper particles with equal particle size, the contact surface between particles with different size ratios is smaller, even though the probability of contact increases. Therefore, the contact normal force observed in Figure 16b is smaller than that between particles of equal size.
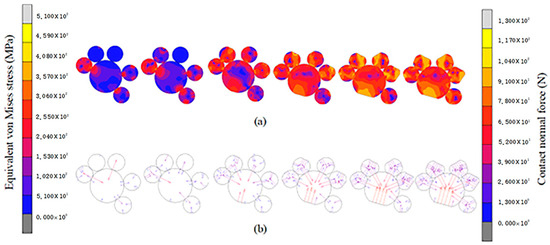
Figure 16.
Changes in morphology, stress, and contact normal force in structure A. (a) presents the equivalent Mises stress variation cloud diagram for structure A from Figure 15. (b) illustrates the contact normal force vectors in structure A.
In structure A, the large particles are subjected to stress analysis. Figure 17a,b reveal that, as the pressing force escalates, the internal stress within these large particles exhibits a consistent trend: higher stress levels towards the sides and lower stress near the center. This pattern is evident in both axial and radial stress distributions.
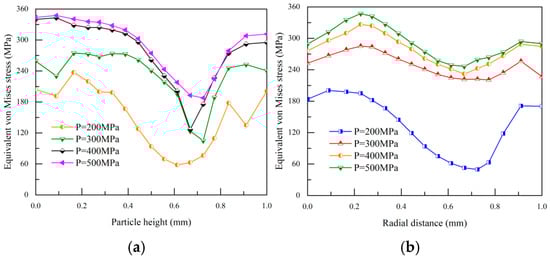
Figure 17.
Changes in axial and radial stress of large particles under different compaction pressures. (a,b) reveal that, as the pressing force escalates, the internal stress within these large particles exhibits a consistent trend: higher stress levels towards the sides and lower stress near the center.
Figure 18a–c present the equivalent Mises stress distribution within the briquette at 500 MPa pressing force for copper particle size ratios of 1:2, 1:3, and 1:4. At a constant compression force, the 1:4 ratio shows superior billet densification with a smaller internal pore area. This is due to the small particle size of copper particles which were part of the pore filling; with the increase of the pressing force, both particle sizes of copper particles undergo plastic deformation which can make the pore area within the blank continue to decrease. In addition, the internal stress values remain high due to the high elastic modulus of copper particles, despite the different particle sizes within the briquettes, which leads to stress concentration within the particles after deformation.
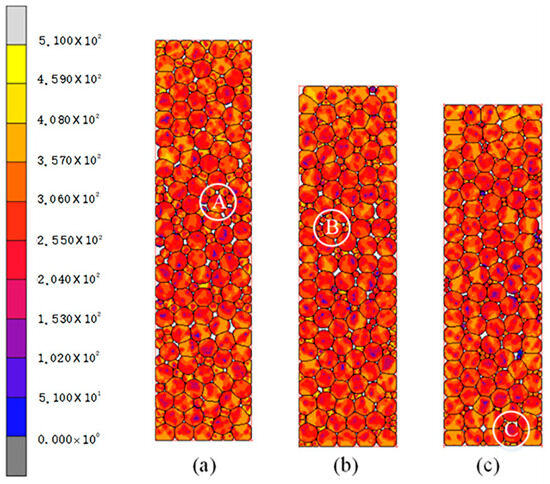
Figure 18.
Von Mises stress distribution in compacts with varying particle size ratios. (a–c) present the equivalent Mises stress distribution within the briquette at 500 MPa pressing force for copper particle size ratios of 1:2, 1:3, and 1:4.
Taking the three A, B, and C structures in the figure for comparative analysis, as shown in Figure 19, the contact surface of the two particle sizes did not produce large deformation, so that the shape of the large particles is maintained well; as the particle size disparity grows, the shape of the large particles becomes more regular. This results in a more concentrated normal force on the contact surface, oriented towards the particle center. In contrast to equal-sized particle pressing, the contact normal force is smaller in varying-sized particle pressing due to the reduced contact area between particles. While this study primarily focuses on particle-scale deformation during cold compaction, grain morphology evolution (e.g., epitaxial growth) was not explicitly characterized due to the absence of post-compaction sintering simulations
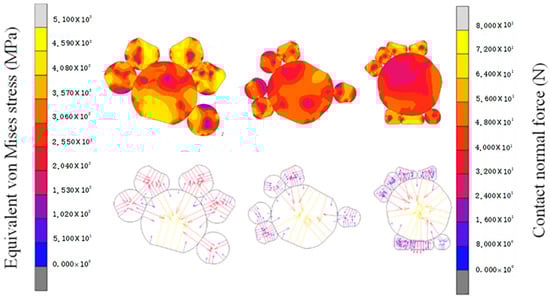
Figure 19.
Morphology, stress, and contact normal force variations in structures A, B, and C.
4. Conclusions
The densification process of pure copper powder was analyzed by DEM-FEM, and the effect of initial packing structures such as HCP, SC, and random packing structures on the cold compaction were studied. Comparisons were made between the average relative density changes of the compact in ordered and random packing structures. The densification mechanism of press forming was investigated in particle morphology, contact normal force transfer rules, and equivalent Mises stress changes within particles.
1. Due to the regular pore distribution in the compact, ordered initial packing structures can obtain higher average relative density than random packing structures. The maximum difference can be as high as 3.89%. Meanwhile, in random packing structures, a fixed size ratio of 1:4 achieves the highest average relative density at the same compaction pressure. Small particles can effectively fill the larger pores within the compacted body. As the pressing continues, both large and small particles continue to fill the remaining pores through plastic deformation.
2. The maximum internal stress of pure copper particles and the maximum normal contact force are located in the region where they contact adjacent-layer particles. The maximum internal stress of small particles is located in the areas where they contact surrounding large particles. In randomly stacked structures, the pore area within the compacted body with a large difference in particle size is smaller, especially near structures with a high number of small particles surrounding large particles, where it is difficult to generate large pores.
This study intentionally excludes post-compaction grain morphology analysis due to its dependency on sintering kinetics. However, the observed particle-scale deformation modes (axial flattening in coarse particles vs. multi-axial distortion in fines) provide foundational insights for predicting texture evolution. Future research combining compaction simulations with crystal plasticity models is warranted to fully resolve epitaxial/uniaxial grain formation. Future research should explore the following:
(1) Sintering-driven grain evolution: Integrating crystal plasticity models with the current DEM-FEM framework to predict texture formation during post-compaction thermal processing, particularly assessing epitaxial growth risks in axially flattened regions (Figure 7c).
(2) Multi-ratio optimization: Employing machine learning (ML) algorithms to identify non-fixed size ratios (e.g., trimodal distributions) that may surpass the 1:4 density limit identified here.
(3) Process upscaling: Validating the model against industrial-scale compaction (>10,000 particles) using GPU-accelerated peridynamics, focusing on die-wall friction effects at high aspect ratios (>5:1).
Additionally, in order to present the data of the key studies in this paper at a glance, we have plotted Table 3, which can be used as a reference for the study of optimizing the predictive model of the process parameters.
Table 3.
Summary table of key data.
Author Contributions
Y.Z.: conceptualization (equal); data curation (equal); formal analysis (equal); funding acquisition (equal); investigation (equal); project administration (equal); writing—original draft (equal); writing—review and editing (equal). M.W.: data curation (equal); formal analysis (equal); writing—original draft (equal); writing—review and editing (equal). W.W. (Wenchao Wang): conceptualization (equal); data curation (equal); formal analysis (equal); writing—original draft (equal); writing—review and editing (equal). W.W. (Wenzhe Wang): writing—review and editing (equal). H.Q.: writing—review and editing (equal). C.L.: writing—review and editing (equal). All authors have read and agreed to the published version of the manuscript.
Funding
This research was funded by the Northeast Petroleum University Talent Introduction Research Initiation Fee Grant Program (Grant No. 13051202015) and the Northeast Petroleum University Guided Innovation Fund (Grant No. 15071202135).
Data Availability Statement
The data that support the findings of this study are available within the article. The data that support the findings of this study are available from the corresponding author upon reasonable request.
Conflicts of Interest
Author Chongming Li was employed by the company CHN Energy Jilin Jiangnan Co-Genration Power Co., Ltd. The remaining authors declare that the research was conducted in the absence of any commercial or financial relationships that could be construed as a potential conflict of interest.
References
- Wang, W.; Weng, M.; Dong, K.; Qi, H.; Zhao, Y.; Chang, H.; Wang, W.; Liu, P. A study on the simulation of metal powder molding based on the discrete element method with equal particle size. AIP Adv. 2025, 15, 065206. [Google Scholar] [CrossRef]
- Kaščák, Ľ.; Varga, J.; Bidulská, J.; Bidulský, R.; Kvačkaj, T. A Review of Simulation Tools Utilization for the Process of Laser Powder Bed Fusion. Materials 2025, 18, 895. [Google Scholar] [CrossRef]
- Chen, C.; Huang, B.; Liu, Z.; Li, Y.; Zou, D.; Liu, T.; Chang, Y.; Chen, L. Additive manufacturing of WC-Co cemented carbides: Process, microstructure, and mechanical properties. Addit. Manuf. 2023, 63, 103410. [Google Scholar] [CrossRef]
- Wang, W.C.; Liu, P.A.; Qi, H.; Liu, J.J.; Liu, T.Y.; Zheng, L. Finite element analysis of densification of Fe-40at%Al composite powders. AIP Adv. 2019, 9, 015311. [Google Scholar] [CrossRef]
- Liu, Z.; Zhang, L.M.; Ma, A.L.; Ren, D.C.; Ji, H.B.; Zheng, Y.G. Optimizing the comprehensive properties of PBF-LB/M Ti6Al4V alloy in nitric acid by heat treatment. npj Mater. Degrad. 2025, 9, 41. [Google Scholar] [CrossRef]
- Sun, R.; Mi, G.; Huang, X.; Sui, N. Molecular dynamic simulations of Ti–6Al and Fe–12Cr alloys for their heat transfer and oxygen transport behaviors. Mod. Phys. Lett. B 2024, 38, 2350263. [Google Scholar] [CrossRef]
- Pan, X.; Su, H.; Liu, X.; Hong, Y. Multi-scale fatigue failure features of titanium alloys with equiaxed or bimodal microstructures from low-cycle to very-high-cycle loading numbers. Mater. Sci. Eng. A 2024, 890, 145906. [Google Scholar] [CrossRef]
- Chen, H.; Liu, Y.; Li, Y.; Cao, Z.; Chai, Z. A Study of Mechanical Properties of the Iron-base Sintered Steel Adding Fine Cr-Fe Powder. Rare Met. Mater. Eng. 2011, 40, 5–8. [Google Scholar]
- Fu, H.; Zhou, X.; Xue, H.; Li, X.; Lu, K. Breaking the purity-stability dilemma in pure Cu with grain boundary relaxation. Mater. Today 2022, 55, 66–73. [Google Scholar] [CrossRef]
- Liu, Y.; Zhang, J.; Niu, R.; Bayat, M.; Zhou, Y.; Yin, Y.; Tan, Q.; Liu, S.; Hattel, J.H.; Li, M.; et al. Manufacturing of high strength and high conductivity copper with laser powder bed fusion. Nat. Commun. 2024, 15, 1283. [Google Scholar] [CrossRef]
- Qu, S.; Ding, J.; Fu, J.; Fu, M.; Zhang, B.; Song, X. High-precision laser powder bed fusion processing of pure copper. Addit. Manuf. 2021, 48 Part A, 102417. [Google Scholar] [CrossRef]
- Chen, J.; Li, L.; Zhu, Z.; Luo, Z.; Tang, W.; Wang, L.; Li, H. Bioinspired design of highly sensitive flexible tactile sensors for wearable healthcare monitoring. Mater. Today Chem. 2022, 23, 100718. [Google Scholar] [CrossRef]
- Muktadir, M.; Yi, S.; Elliott, A.M. Design of robot grippers for binder jet products handling. Sci. Rep. 2024, 14, 5750. [Google Scholar] [CrossRef]
- Kaščák, Ľ.; Varga, J.; Bidulská, J.; Bidulský, R. Simulation of 316L Stainless Steel Produced the Laser Powder Bed Fusion Process. Materials 2023, 16, 7653. [Google Scholar] [CrossRef]
- Zhao, H.; Zhao, C.; Xie, W.; Wu, D.; Du, B.; Zhang, X.; Wen, M.; Ma, R.; Li, R.; Jiao, J.; et al. Research Progress of Laser Cladding on the Surface of Titanium and Its Alloys. Materials 2023, 16, 3250. [Google Scholar] [CrossRef] [PubMed]
- Ward, A.A.; Palmerio, N.E.; Hareland, C.A.; Cordero, Z.C. Macroscopic yielding and particle-scale densification mechanisms in ultrasonic powder compaction. J. Mech. Phys. Solids 2022, 167, 105011. [Google Scholar] [CrossRef]
- Li, Y.; Belyavsky, O.G.; Gheybi, S.H.; Yaghmazadeh, M.; Hu, T.; Mokarram, N.H.; Chen, M. Densification and Metallurgical Bonding in Copper Powder Compact during Ultrasonic Powder Consolidation; Northeastern University: Boston, MA, USA, 2015. [Google Scholar]
- Sun, R.; Mi, G. Influence of alloying elements content on high temperature properties of Ti–V–Cr and Ti–Al–V series titanium alloys: A JMatPro Program Calculation Study. J. Phys. Conf. Ser. 2023, 2639, 012019. [Google Scholar] [CrossRef]
- Dhami, H.S.; Panda, P.R.; Viswanathan, K. Production of powders for metal additive manufacturing applications using surface grinding. Manuf. Lett. 2022, 32, 54–58. [Google Scholar] [CrossRef]
- Pan, X.; Hong, Y. High-cycle and very-high-cycle fatigue of an additively manufactured aluminium alloy under axial cycling at ultrasonic and conventional frequencies. Int. J. Fatigue 2024, 185, 108363. [Google Scholar] [CrossRef]
- Chandra, S.; Wang, C.; Tor, S.B.; Ramamurty, U.; Tan, X. Powder-size driven facile microstructure control in powder-fusion metal additive manufacturing processes. Nat. Commun. 2024, 15, 3094. [Google Scholar] [CrossRef]
- Zhou, K.; Cui, D.; Chai, Z.; Zhang, Y.; Yang, Z.; Zhu, C.; Wang, Z.; Li, J.; Wang, J. In-situ tailoring microstructures to promote strength-ductility synergy in laser powder bed fusion of NiCoCr medium-entropy alloy. Addit. Manuf. 2023, 66, 103443. [Google Scholar] [CrossRef]
- Xu, X.; Wang, X.; Zhang, M.; Zhang, J.; Tan, J. A parallelized hybrid N-S/DSMC-IP approach deve adaptive structured/unstructured overlapping grids for hypersonic transitional flows. J. Comput. Phys. 2018, 371, 409–433. [Google Scholar] [CrossRef]
- Li, B.; Li, Q. Coupled FEM-DEM modeling of permeability evolution in rough fractured shale during shearing under varying confining pressures. J. Rock Mech. Geotech. Eng. 2025, in press. [CrossRef]
- Zhong, J.; Han, F.; Zhang, L. Accelerated Peridynamic Computation on GPU for Quasi-static Fracture Simulations. J. Peridyn. Nonlocal. Model 2024, 6, 206–229. [Google Scholar] [CrossRef]
- Yang, D.; Jiang, H.; Liu, Y.; Lai, Z.; Liao, M.; Qu, N.; Han, Y.; Zhu, J. Parameters prediction of hot-pressing sintering of high entropy alloys using numerical modeling and simulation. Procedia Manuf. 2019, 37, 529–536. [Google Scholar] [CrossRef]
- Yanov, D.V.; Zelepugin, S.A. Simulation of dynamic channel angular pressing of copper samples using experimental data of loading. J. Phys. Conf. Ser. 2019, 1214, 012023. [Google Scholar] [CrossRef]
- Wang, W.C.; Qi, H.; Liu, P.A.; Zhao, Y.B.; Chang, H. Numerical simulation of densification of Cu-Al mixed metal powder during axial compaction. Metals 2018, 8, 537–561. [Google Scholar] [CrossRef]
- Sun, R.; Mi, G. Investigations on The surface temperature field of Ti–6Al and Ti–48Al alloy under continuous laser ablation. Rare Met. Mater. Eng. 2024, 53, 2405–2412. [Google Scholar]
- Wang, W.; Zhao, Y.; Weng, M.; Dong, K.; Qi, H.; Wang, W.; Li, C. DEM-FEM Simulation of Double Compaction of Cu and Al Composite Metal Powders with Multiple Particle Sizes. Crystals 2025, 15, 526. [Google Scholar] [CrossRef]
- Ganesan, V.V.; Amerinatanzi, A.; Jain, A. Discrete Element Modeling (DEM) simulations of powder bed densification using horizontal compactors in metal additive manufacturing. Powder Technol. 2022, 405, 117557. [Google Scholar] [CrossRef]
- Uranchimeg, K.; Jargalsaikhan, B.; Eui, L.S.; Choi, H. DEM simulation and characterization of copper and iron powders fabricated by ball milling. Particuology 2024, 94, 96–108. [Google Scholar] [CrossRef]
- Gou, D.; An, X.; Yang, R. DEM investigation of the effect of particle breakage on compact properties. EPJ Web Conf. 2021, 249, 07004. [Google Scholar] [CrossRef]
- Ghorbani-Menghari, H. Optimizing powder compaction for enhanced relative density: Insights from multi-particle finite element simulations and genetic algorithm. Mater. Res. Proc. 2024, 41, 2554–2561. [Google Scholar] [CrossRef]
- Güner, F.; Cora, Ö.N.; Sofuoğlu, H. Numerical modeling of cold powder compaction using multi particle and continuum media approaches. Powder Technol. 2015, 271, 238–247. [Google Scholar] [CrossRef]
- Akisanya, A.R.; Cocks, A.C.F.; Fleck, N.A. The yield behaviour of metal powders. Int. J. Mech. Sci. 1997, 39, 1315–1324. [Google Scholar] [CrossRef]
- Faruk Güner, Hasan Sofuoglu, Ömer Necati Cora, An investigation of contact interactions in powder compaction process through variable friction models. Tribol. Int. 2016, 96, 1–10. [CrossRef]
- Martin, C.L.; Bouvard, D.; Shima, S. Study of particle rearrangement during powder compaction by the Discrete Element Method. J. Mech. Phys. Solids 2003, 51, 667–693. [Google Scholar] [CrossRef]
Disclaimer/Publisher’s Note: The statements, opinions and data contained in all publications are solely those of the individual author(s) and contributor(s) and not of MDPI and/or the editor(s). MDPI and/or the editor(s) disclaim responsibility for any injury to people or property resulting from any ideas, methods, instructions or products referred to in the content. |
© 2025 by the authors. Licensee MDPI, Basel, Switzerland. This article is an open access article distributed under the terms and conditions of the Creative Commons Attribution (CC BY) license (https://creativecommons.org/licenses/by/4.0/).