Abstract
The defects in zinc oxide crystals are of crucial importance for their usability in many applications and are not yet fully understood. Here, we demonstrate that dioxygen species are present as defects in the grown ZnO, resulting in a bending of the atom layers that lie perpendicular to the c-axis. In the Raman spectra, these defects cause the appearance of bands different from the known bands of perfect ZnO crystals allowed by symmetry. These additional Raman bands, which have been frequently reported for ZnO in the past, can thus be fully explained by the presence of dioxygen species, and the widespread assumption of second-order modes for the assignments of these bands is not necessary. Furthermore, the Raman spectrum belonging to perfect zinc oxide in the ideal wurtzite structure is presented, obtained from small domains in ZnO(0001) crystals exposed to pressures up to 2 GPa. The dependence of the O-O stretching modes on the applied pressure proves the presence of dioxygen species in ZnO, which is also confirmed by phonon calculations of structure models with embedded dioxygen species. The surface quality of the ZnO crystals studied is also reflected in the Raman spectra and is included in the analysis.
1. Introduction
Crystals are solids in which atoms are regularly arranged in a spatial lattice with specific geometric symmetry elements. However, there is no ideal atomic lattice in nature, and certain imperfections in chemical composition and structural atomic arrangement are often essential for the usefulness of crystals as materials in technological applications. Usually, single crystals contain point defects (vacancies, interstitials, and antisites) in addition to extended defects, such as dislocations and dislocation networks. Vacancies, for example, allow atoms to move through the lattice during solid-state reactions or ionic conduction. Dislocations tend to arrange themselves into boundaries which split crystals into parts with small misorientations [1,2]. The characterization of these inhomogeneities is fundamental for the understanding of the properties of solid materials.
In particular, the analysis of these intrinsic defects in crystals is of crucial importance for oxides with a wide range of applications, such as ZnO. Zinc oxide is a semiconducting material with a large exciton binding energy and a pale yellow to green color, which crystallizes only in the wurtzite structure at ambient conditions [3]. Besides the color, the intrinsic defects in ZnO are responsible for various properties of ZnO such as its n-type conductivity, which is not yet fully understood [4,5]. Furthermore, ZnO is a functional material that is used, for example, as a substrate for UV and blue light-emitting devices that require large, high-quality crystals [6,7]. Such ZnO crystals can be grown using various methods, via, e.g., hydrothermal, sol–gel, or vapor growth processes [8,9]. Hydrothermal synthesis is the most attractive method for preparing large crystals since it requires only low growth temperatures, and ZnO is easily soluble in various hydroxide solutions [10,11]. Thus, in this study, we investigated ZnO single crystals grown using the hydrothermal technique, with a particular focus on the defects in the crystal, since these impact its usability and should be examined as carefully as possible.
One of the most powerful techniques for obtaining information about a material is light scattering. This applies in particular to Raman scattering, a local probe that is well suited for the analysis of local inhomogeneities. This constitutes a qualitative difference to, for example, standard X-ray diffraction, where an average value of the sample properties is determined on length scales beyond 100 nm.
Furthermore, recent results show that the compression of ZnO powder leads to the emergence of new bands in the Raman spectrum, especially at 1550 cm−1, accompanied by a remarkable increase in the intensity at around 100 cm−1 and 570 cm−1 [12,13]. In order to investigate whether a similar effect can also appear in single crystals, we performed high-pressure experiments on ZnO crystals in the same pressure range as for the powder samples (about 1 GPa). The objective of this experiment was to determine the impact of pressure on defects in crystalline structures. Analogous pressure effects on vacancy defects have been described in the literature for halides: the compression of halide double perovskites at 1.7 GPa increases conductivity by one order of magnitude [14]. Thus, the current investigation provides an opportunity to gain deeper insights into the ZnO structure and its defects. The pressure range employed was well below the one required for pressure-induced structural phase transitions of ZnO, which begin at around 9 GPa and first result in the rock salt structure type [15].
This work presents detailed Raman analyses of single-crystal ZnO before and after applying a pressure of up to 2 GPa. The measurements were performed using the sample imaging technique on the (0001) surface with different surface qualities. The observed results were then analyzed with respect to the structural features of zinc oxide. The defects and dislocations in ZnO influence the vibration modes and are therefore visible in the Raman spectra. The differences in the observed spectra were analyzed in detail together with the calculations of the corresponding phonon spectra and Raman intensities, using density functional theory (DFT) methods. In addition, optical and electron microscopic investigations were performed to characterize the local atomic arrangements.
2. Materials and Methods
2.1. Samples
Pale-yellow, single-crystal ZnO samples with two orientations (<0.5°), (0001) and (10-10), were purchased from CrysTec GmbH (Berlin, Germany, 10 × 10 × 1 mm3, hexagonal wurtzite structure, hydrothermal growth). One surface side (10 × 10 mm2) was epi-polished, and the others were finely ground. The average roughness Ra was determined with an atomic force microscope (Cypher, Asylum Research, Goleta, CA, USA) to <0.5 nm and <150 nm for the epi-polished and fine-ground surfaces, respectively. The refraction indices of the ZnO crystals are given by no = 2.026 (ordinary) and nc = 2.041 (extraordinary). For the high-pressure experiments, a ZnO(0001) crystal was cut into small, flat pieces measuring 2 × 2 × 1 mm3 (see Figure S1 in the Supporting Information SI) using a diamond saw. For compression, these flat samples of ZnO crystals were wrapped in aluminum foil, embedded in boron nitride powder, and sealed inside an aluminum foil ampoule. The ampoule was placed in a walker-type multi-anvil press and subjected to pressures of 0.5, 1, or 2 GPa for 1 h. The pressure was slowly released over 10 h; see Figure S1. The crystals were then removed intact from the crucible and transferred to the Raman spectrometer. The Raman measurements were performed immediately afterwards in the following days and repeated for certain samples, sometimes months later, over a period of about six months, without observing relaxation phenomena.
Moreover, ZnO powder (99.999%, lightly yellow) purchased from Acros Organics (Geel, Belgium) was compressed with 1 GPa at ambient conditions using a hydraulic press (PerkinElmer GmbH, Rodgau, Germany), forming a round disc.
2.2. Raman Spectroscopy
The Raman measurements on the ZnO crystals were performed with a laser-microscope Rahman spectrometer (BXFM microscope and iHR 550 spectrometer, Horiba, Germany) operating with a 532 nm laser and a Peltier-cooled CCD camera (Synapse), Horiba Scientific, Bensheim, Germany. The resolution of the spectrometer (three-grating 1800 L/mm) was about 1 wavenumber, and the measurements started at 60 cm−1. The laser beam (20 mW) was focused with an objective lens (100× magnification, 0.9 NA) on the samples using a confocal aperture in quasi-backscattering geometry (acquisition time 10 s). The size of the laser spot of the device with this configuration was approximately 1 μm. Subsequently, the Raman signal was coupled using a fiber-optic cable to the spectrometer. The Raman spectra of the ZnO powder and crystals were measured with the same apparatus. For the Raman mapping, a LabRAM HR Evolution Raman spectrometer was used (Horiba Scientific, Bensheim, Germany). The spectrometer setup included a double super razor edge filter and a Peltier-cooled CCD camera (Synapse, grating 1800 L/mm). The measurements were performed with linearly polarized laser light with a wavelength of 532 nm in the wavenumber range of 20 cm−1 to 2000 cm−1 (acquisition time 1.5 s/3 s). The power of the laser was 40 mW, and the light beam was typically focused by a 10× (overview spectra) and 50× (LWD) objective to a <5 μm spot diameter on the top surface of the sample using a microscope (defined from the device parameters). For the Raman mapping, a 9 × 9 grid of measurement points on the 2 × 2 mm2 crystal surface with a distance of 200 μm between the individual measurement points was used, which was set by a computer-controlled XY stage with autofocus. Measurements with lower laser power showed no difference in the spectra, and no heating-related effects on the samples were observed. This observation was in agreement with Raman investigations using a similar laser power (38.5 mW at 532 nm) on ZnO crystals, where no laser-induced damage to the ZnO crystals was observed [16].
2.3. Microscopy
The optical images of the ZnO crystals were recorded using an optical microscope (Nikon Eclipse LV100ND, Nikon Instruments Inc., Amstelveen, Netherlands) equipped with a digital camera and operated at different magnifications (200× to 1000×) in bright field and differential interference contrast modes. Scanning electron microscopy (SEM) images were taken with a field emission microscope (Merlin, Carl Zeiss GmbH, Oberkochen, Germany) using an accelerating voltage of 2–5 kV and an Everhart–Thornley (SE) detector. Transmission electron microscopy (STEM) was performed in a probe-corrected JEOL ARM200CF (JEOL Co. Ltd., Tokyo, Japan) operated at 200 kV. Images were recorded using an annular bright-field (ABF) and a high-angle annular dark-field (HAADF) detector with collection semi-angles of 10–20 mrad and 70–300 mrad, respectively. The convergence semi-angle of the electron probe was 20.4 mrad for STEM imaging, and 6 mrad for large-scale electric field measurements.
2.4. Theoretical Calculations
The ab initio calculations were performed using the CRYSTAL software (versions 17 and 23), based on the linear combination of atomic orbitals (LCAO) [17]. Crystallographic and structural analysis were performed using the KPLOT code [18]. The full structural optimizations were carried out using analytical gradients, and the subsequent phonon calculations were based on analytical first and numerical second derivatives [19]. The LO-TO splitting at the Γ-point was calculated within the framework of the coupled perturbed Kohn–Sham method [20]. A fully analytical method for calculating Raman intensities of periodic systems was applied [21,22]. The density functional theory (DFT) calculations were performed using the B3LYP functional (Becke’s three-parameter functional in combination with the correlation functional of Lee, Yang, and Parr) [23] and the generalized gradient approximation (GGA) with the PBE (Perdew, Burke, and Ernzerhof) functional [24]. Employing several ab initio methods can help provide a better understanding of the quantitative reliability of the theoretical findings [25]. Each local optimization employed an all-electron basis set (AEBS): a [6s5p2d] basis set in the case of zinc, and a [4s3p] basis set in the case of oxygen [12,26].
The calculation of the vibrational frequencies using the CRYSTAL code was performed at the Γ point. The dynamical matrix was computed through the numerical evaluation of the first derivative of the analytical atomic gradients. The point group symmetry of the system was fully exploited to reduce the number of points. At every numerical step, the residual symmetry was preserved during the SCF process and the calculation of the gradient. Although the Raman intensities were calculated for a single crystal, the CRYSTAL program also automatically performed the simulation of powder samples by computing integrals over all possible orientations of ideal bulk crystals [17,21,22]. For the evaluation of the vibrational frequencies and Raman spectra, it was essential to use a high-precision code with low tolerance values.
In this study, the threshold for convergence regarding the total energy during geometry optimization was set to 10−7, the threshold for convergence regarding the total energy during frequency calculation was set to 10−10, while tolerances for Coulomb and exchange sums (five parameters controlling the accuracy of the calculation of the bi-electronic Coulomb and exchange series) were set to 10−6, 10−6, 10−6, 10−6, and 10−12. The computed Raman modes are sensitive to changes in the variation of lattice parameters. For all the calculations, we employed relaxed supercells. Moreover, the supercell model used within this study was compared with ideal bulk, supercell, and non-relaxed models, resulting in small energy differences in agreement with data from the literature (see Table S7 in Supplementary Materials).
3. Results
3.1. Raman Scattering on ZnO Single Crystals
The Raman measurements were performed on pale-yellow ZnO(0001) crystals, which had been purchased with two different surface qualities. One side was epi-polished (average roughness Ra < 0.5 nm) and the second side was fine-ground (Ra < 150 nm); the corresponding SEM images are shown in Figure S2 (Supporting Information SI). In addition, a ZnO(10-10) crystal was cleaved along (0001), and this cleaved surface was also characterized by Raman measurements. The Raman spectra of these three different ZnO(0001) surfaces aligned perpendicular to the laser beam are shown in Figure 1 together with the spectrum of the ZnO powder compressed at 1 GPa (pressed powder). All these spectra were recorded with a small spot size of about 1 μm (objective lens 100× magnification) and repeated many times at randomly selected positions on the ZnO surfaces.
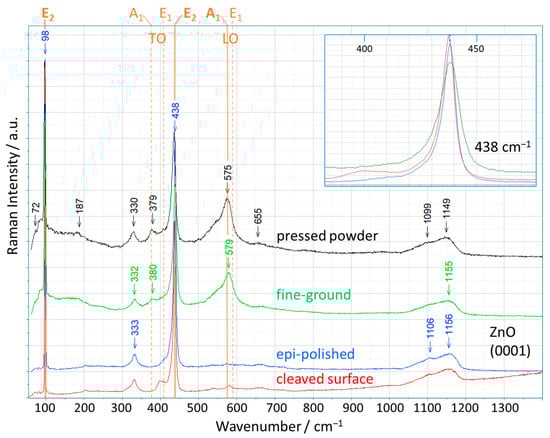
Figure 1.
Raman spectra of original (not exposed to high pressure) ZnO single crystals with three different surface qualities—fine-ground, epi-polished, and cleaved surface—(scattering geometry: (0001) ꓕ to the laser beam), and of a pressed ZnO powder (assigned wavenumber values of specific bands are marked by arrows); all measurements were captured with an 100× objective lens. The six active Raman modes of the ideal ZnO structure are represented by orange lines with labels at the top (solid lines: symmetry-allowed modes for the applied scattering geometry). Insert: the magnified, normalized range from 380 cm−1 to 480 cm−1 (around the E2-high mode) of the three single-crystal spectra.
The ideal form of zinc oxide, which crystallizes in the wurtzite structure, exhibits six active Raman modes in first-order Raman scattering [27]. Their occurrence depends on the scattering geometry, and thus, only three modes appear for the geometry applied here, with the c-plane perpendicular to the laser beam in the backscattering mode (Porto notation [28]: Z(XX)Ẑ). First of all, it is noticeable that all spectra of the ZnO(0001) crystals used in this study show more Raman bands than the three symmetry-allowed modes, E2-low at 99 cm−1, E2-high at 438 cm−1, and A1-LO at 574 cm−1 [29], see Figure 1. These three modes are marked by the orange solid lines in Figure 1, and the remaining three modes that are not present in our measurement geometry (E1-TO, A1-TO, and E1-LO) are shown as dashed orange lines, respectively. In the Raman spectrum of the epi-polished ZnO(0001), additional bands at 333 cm−1, 1106 cm−1, and 1156 cm−1 are clearly visible; in addition, we observe a shoulder at 405 cm−1, and very weak bands at around 200 cm−1, 540 cm−1, 660 cm−1, and 719 cm−1. Of these, only the shoulder at 405 cm−1 matches one of the allowed first-order Raman modes of ZnO (E1-TO). This spectrum corresponds to the generally recognized spectrum of ZnO(0001) and is frequently reported and analyzed in the literature for zinc oxide [29]. The same additional bands are visible for the cleaved ZnO(0001) surface, except that the shoulder at 405 cm−1 slightly shifted to become a more distinct separate band at 400 cm−1. In the literature [29], the observed additional bands are explained by second-order scattering caused by overtones and the combination of optical and acoustic phonons (for details, see Table S1). Up to now, this interpretation of the spectra by assigning these peaks to the second-order bands seems to provide an acceptable solution [16,30,31].
Regarding the different surfaces studied, we note that our measurements demonstrate that the Raman spectrum of ZnO obtained from an epi-polished surface is nearly identical to the spectrum obtained inside a crystal at the same orientation (created by cleavage). Remarkable, however, are the many tiny but narrow maxima between 60 and 150 cm−1, which occur at almost the same wavenumbers in the spectra of both epi-polished and cleaved ZnO. In the spectrum of the ZnO sample with the fine-ground surface, these bands become more intense and overlap, thus appearing at first sight to represent an enhanced background. This enhanced Raman intensity decreases with a wavenumber up to 270 cm−1, and is accompanied by additional broad bands at 380 cm−1 and 579 cm−1 (fine-ground ZnO). It should be noted that the spectrum depicted for fine-ground ZnO represents the average of our measured spectra over all surface points at which measurements were performed; however, for individual surface spots, spectra with almost identical characteristics to those of epi-polished ZnO can be found, as well as spectra with additional bands that are twice as intense (cf. Figure S3, Supporting Information). Furthermore, the spectrum of the fine-ground ZnO is nearly identical to the spectrum of the pressed powder. Thus, the fine-ground ZnO seems to have similar imperfections, e.g., structural displacements, as the pressed powder. The fine-ground ZnO exhibits a rougher surface compared to the epi-polished one, which implies a higher local disorder, which is then reflected in the observed enhanced bands. This result is also confirmed by the measured line widths of the E2-high band at 438 cm−1 for the ZnO crystals (see the insert in Figure 1). All these lines show an asymmetric broadening towards lower wavenumbers, but the width is significantly larger for the fine-ground ZnO. The larger line width seems to be the result of a certain structural displacement (associated with a variation in the Zn-O distances) in the fine-ground ZnO. Two surprising conclusions can already be drawn from the evidence presented: the coincidence of the Raman spectra of the fine-ground ZnO and the pressed powder, and the strong influence of the surface quality on the Raman spectra. Both observations reflect the degree and type of disorder in the ZnO structure caused by the methods applied when creating the samples and preparing them for the Raman measurements.
3.2. Influence of Pressure on ZnO Crystals
To study the influence of pressure on the ZnO structure, high-pressure experiments with ZnO(0001) crystals were performed up to pressures of 2 GPa. For this purpose, small crystals (2 × 2 × 1 mm3) were pressed in a metal crucible filled with BN using a Voggenreiter press for 1 h. The crystals were then removed from the crucible while still intact and transferred to the Raman spectrometer. Furthermore, the observation that the Raman spectra at the various locations on a fine-ground ZnO crystal can be quite different suggests that the entire surface should be examined in as much detail as possible. Therefore, the high-pressure experiments were combined with a sample imaging technique (before and after compression). In these Raman measurements, the sample was scanned pit-by-pit using a predefined grid, and one spectrum after the other was recorded until the entire area of interest had been mapped (for both surface qualities). In this context, objective lenses with a lower magnification were also used in order to enlarge the captured area. The lateral resolution on the surface for the Raman spectra was given by the spot size of ≤ 5 μm (magnification 10×) with a distance of 200 μm between the measuring points.
Figure 2 shows selected spectra of the Raman mapping of ZnO(0001) crystals after the crystals had been compressed at 1 GPa. It should be mentioned that the spectra presented in Figure 2, obtained by the Raman mapping, were measured at certain points on the sample. The majority of the measured spectra are very similar to those shown in Figure 1. However, after the compression, the background of the spectra is smoother, and especially the broad Raman bands between 500 and 700 cm−1 are weakened for the sample with the fine-ground surface.
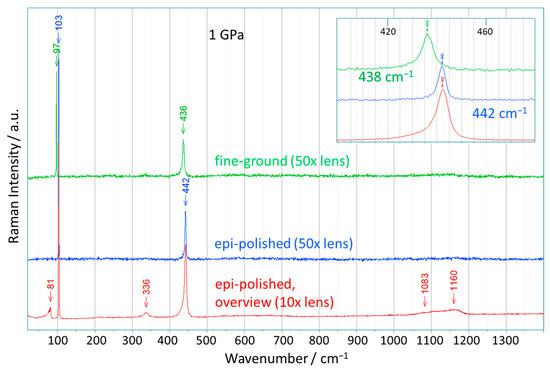
Figure 2.
Raman spectra selected from the Raman mapping of ZnO single crystals after being pressed at 1 GPa (scattering geometry: (0001) ꓕ to the laser beam). Two spectra (for the epi- and fine-ground surface, respectively) with 50× magnification and an overview spectrum with 10× magnification (epi-polished) are shown. Such overview spectra were recorded on many different locations on the surface of the ZnO (0001) crystals before and after the pressure experiments with pressures of up to 2 GPa. After compression, the crystals were removed from the crucible and transferred to the Raman spectrometer. Wavenumber values assigned to specific bands are marked by arrows. Insert: the magnified spectral range from 400 cm−1 to 480 cm−1 (around the E2-high mode) for the three samples.
The spectrum at the bottom of Figure 2 is a so-called overview spectrum, which was measured with a spot size of 5 μm (10× magnification) on the epi-polished surface. For this relatively low magnification, one obtains data from spots with an area of about ten times the size of the spots studied with the other two magnifications. Similar overview spectra were obtained (in a more or less identical shape) for many locations on the ZnO(0001) crystals with this larger spot size of 5 μm after, and also sometimes before, compression.
Two features are noteworthy in the overview spectrum. First, the tiny narrow bands discussed above appear to partially accumulate into a broad band at about 80 cm−1, which shows a large broadening with a peak exhibiting a tail towards lower wavenumbers. Due to the larger area covered by the overview spectrum, a more averaged spectrum of ZnO was recorded than for the spots with higher magnification, and a sideband to the E2-low mode at 80 cm−1 is often observed here. The E2-low mode is dominated by polar Zn displacements perpendicular to (0001), and additional bands in this region suggest the presence of different Zn environments in the ZnO crystal, which occur with certain preferred atomic distances averaged over a larger surface area. Secondly, the distinct bands between 500 cm−1 and 700 cm−1 widely disappear, leaving only a weak, very broad hump, which is mainly due to the effects of compression, especially for the fine-ground surface.
The two upper spectra in Figure 2 (obtained for the epi- and the fine-ground surface, respectively) were recorded with a smaller spot size of 2 μm (50× magnification) after compressing the sample at a pressure of 1 GPa, and they reveal surprising and unexpected characteristics. Both spectra exhibit only two narrow Raman bands, which can be assigned to the E2-low and E2-high modes. The bands for the epi-polished surface are at 103 cm−1 and 442 cm−1, and for the fine-ground surface are at 97 cm−1 and 436 cm−1. These amazing Raman spectra are precisely what one would theoretically expect when dealing with a truly perfect ZnO(0001) crystal (only ideal Zn-O distances, and no disorder). The only band missing in this scattering geometry is the A1-LO mode, which is generally very weak and in some cases was not observed at all (for a wavelength of >407 nm) [29].
However, zinc oxide is an optically anisotropic material that exhibits birefringence along the c-axis, i.e., the light is split into two paths, each propagating a different polarization state of the light wave, where the polarization of the light is rotated by different amounts along each path. Thus, the A1-LO mode can be suppressed if the difference in the rotation of the polarization amounts to 180°; in that case, only the two E2 modes remain as symmetry-allowed modes in our scattering geometry (laser beam along the c-axis), which corresponds to the Porto notation Z(XY)Ẑ. Under the conditions used, this extinction is achieved with a penetration depth in ZnO of approx. 7 μm (a refractive index of ZnO crystal: no = 2.026 (ordinary), nc = 2.041 (extraordinary); in this estimate, a pressure dependence of the refractive index was not considered [32]). As a consequence, in these spectra, no additional Raman bands besides the E2 modes are visible. In addition to the lack of the A1-LO mode, the bands at 333 cm−1 and at about 1100 cm−1 also disappear. Furthermore, the spectrum of the epi-polished ZnO sample shows a symmetric profile for the band at 442 cm−1 (E2-high) without any asymmetry. For fine-ground ZnO, there is a small asymmetry in the E2-high band, which can be caused by a small amount of variation in the Zn-O distances due to the rougher surface (see Figure 2, insert).
A most striking observation is that all other bands and anomalies that are usually obtained in the Raman spectra of zinc oxide are no longer present. In particular, this includes all the bands (203, 333, 539, 660, 719, 1106, and 1156 cm−1) that had commonly been assigned to second-order scattering effects; cf. [29] and Table S1. In second-order processes, two phonons are available for excitation. This allows for a high degree of variability among the phonons involved, which in turn can lead to numerous additional modes. On the other side, defects are present in ZnO crystals that reduce crystal symmetry. Quite generally, the weakening of the overall symmetry softens the Raman selection rules and results in spectra that are composed of bands that include both previously forbidden and modified first-order modes. Furthermore, we note that point defects (vacancies, interstitial atoms, etc.) as well as isolated line defects primarily introduce local distortions in the structure, leading to local modes (first-order Raman scattering, weakly coupled to the host lattice) that differ from the scattering of ideal ZnO. In addition, these modes can also be coupled to the host lattices, leading to collective lattice vibrations with corresponding shifting and broadening. In particular, this implies that second-order phenomena are not necessarily required to generate additional modes. Thus, we conclude that the observed additional bands represent Raman scattering that can be caused by structural disorder present in the ZnO lattice as prepared at standard pressure, where the disorder can be modified or removed, at least locally, through the application of external forces such as high pressures.
Another remarkable feature is the different values of the two E2 modes (97 cm−1 and 436 cm−1 vs. 103 cm−1 and 442 cm−1) obtained at different sampling positions and for different surfaces after the compression of the ZnO crystals (see Figure 2). Both E2 modes are shifted in the same direction (from 97 cm−1 to 103 cm−1 and from 436 cm−1 to 442 cm−1, respectively) between the two measurements, and deviations were observed for both surface qualities. The wavenumbers of the vibration modes of the ZnO lattice (wurtzite structure) are determined by the force constants (bond strength), which are commonly observed to vary inversely with the atomic distances (especially for the same atomic system) [33]. The Zn-O distances depend on the z-value of the oxygen site (the only free site parameter in the wurtzite structure) and the lattice parameters [34]; cf. Table S2.
In the literature, it was found that the lattice parameters of ZnO single crystals decrease with increasing pressure, while the z-value of the oxygen site remains unchanged [35]. This leads to a small reduction in the Zn-O distances of 0.5 pm at 1 GPa in the ZnO crystal. Furthermore, Raman measurements as a function of applied pressure show that the E2-high mode increases from 439 cm−1 to 445 cm−1 at 1 GPa, while the E2-low mode decreases from 99 cm−1 to 98 cm−1 at 1 GPa compared to ambient conditions [36]. These pressure experiments were performed in situ in a diamond anvil cell, and the pressure-dependent behavior is supported by theoretical considerations [36].
In contrast, our phonon calculations for various oxygen displacements in ZnO show a shift to higher wavenumbers for both E2 modes upon an increase in z from z = 0.38 to z = 0.42 at the oxygen site [12]. This displacement of the oxygen site leads to a decrease in the Zn-O distances perpendicular to the c-axis, the vibration direction of the E2 modes. These results suggest that the shift of the wavenumbers (from 97 cm−1 and 436 cm−1 to 103 cm−1 and 442 cm−1, respectively) shown in Figure 2, measured at two different sample positions, corresponds to different z-values of the oxygen site and is not due to a reduction in the lattice parameters. Thus, the different Zn-O distances within the wurtzite structure—as deduced from our Raman measurements—are stabilized in the ZnO crystals by shifts in the oxygen positions along the c-axis (z-values) after the compression of the sample. We note that through our Raman mapping, many local areas (domains) in the micrometer range were characterized, which enabled us to observe such variations that are only present at a local level. In addition, the lack of asymmetry of the narrow band at 442 cm−1 (epi-polished) indicates that all Zn-O distances in this sample position are almost identical (resulting in a small symmetric distance distribution). The slight asymmetry of the band at 436 cm−1 (toward lower wavenumbers) indicates a small contribution due to additional, slightly longer Zn-O distances for this Raman sample position on the surface of the fine-ground ZnO, which can be generated by a slight shift of the oxygen position (z-value). In the literature, the asymmetric line shape broadening is attributed to anharmonic interactions with transverse and longitudinal acoustic phonon combinations [29]. However, since no second-order scattering bands are visible in the Raman spectra here, we do not consider this explanation to be convincing.
The effect of pressure on the fine-ground ZnO(0001) crystals reveals a stronger influence of compression than for the epi-polished crystals, and the corresponding results are presented in Figure 3. Figure 3 shows selected Raman spectra measured by Raman mapping the surface of pressed fine-ground ZnO crystals at different lens magnifications (10×, 50×, and 100×) and applied pressures (0.5, 1, and 2 GPa). The prominent feature of all these spectra is the appearance of narrow Raman bands at about 1000 cm−1. In the spectra recorded at high magnifications (50×, 100×), this band was recorded at about 990 cm−1, and the observed intensities increase with increasing pressure. Similarly, the intensity of the broad bands between 1050 and 1200 cm−1 decreases, and the individual bands become more separated at the same time. This clearly illustrates the transition from the broad bands (1050–1200 cm−1) to the narrow bands at about 990 cm−1 due to the pressure. We note that in this region (750 to 1200 cm−1), the stretching modes of dioxygen species such as peroxide and superoxide ions are located, which indicates that these species might be present in the pressed ZnO crystals studied. For example, the O-O stretching mode is observed for zinc peroxide (ZnO2) [37] at 840 cm−1 and for sodium superoxide (NaO2) [38] at about 1160 cm−1, respectively, cf. Table S3 in the Supporting Information. The modes observed here (at about 990 cm−1) lie at in-between wavenumbers, and the narrow line widths indicate the presence of a specific dioxygen species with a well-defined O-O distance in the pressed ZnO crystals.
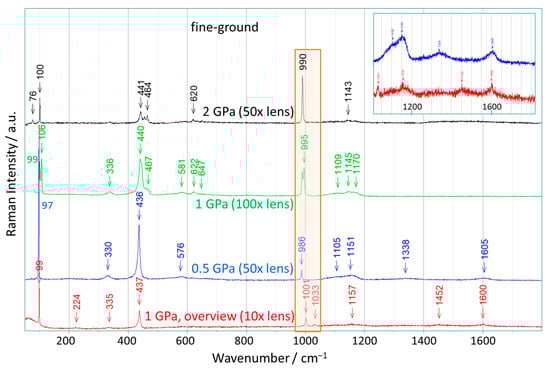
Figure 3.
Raman spectra selected from the Raman-mapping of ZnO single crystals that were pressed up to 2 GPa (scattering geometry: (0001) ꓕ to the laser beam). The spectra were recorded for samples with a fine-ground surface after the crystals had been exposed to pressures of 0.5, 1, or 2 GPa (corresponding magnification is given). After compression, the crystals were removed from the crucible and transferred to the Raman spectrometer. Wavenumber values assigned to specific bands are marked by arrows. The spectral region between 950 cm−1 and 1050 cm−1 is highlighted. Insert: the magnified range between 1000 cm−1 and 1800 cm−1 of the two spectra with 0.5 GPa (magnification 50×) and 1 GPa (magnification 10×).
The spectrum obtained for the crystal pressed at 1 GPa shows two bands in this region at 990 and 995 cm−1, which are accompanied by two E2-low bands at 99 and 106 cm−1 and some E2-high bands between 440 and 470 cm−1. Analogous behavior is observed for the ZnO crystal pressed at 2 GPa. Here, too, several E2 modes are visible, but their intensities are lower, while the band at 990 cm−1 is very intense. These observations demonstrate that the dioxygen species (peroxide/superoxide ions) are clearly present in ZnO single crystals and that the bands in the region between 750 to 1200 cm−1 originate from the O-O stretching modes. A shift or excitation of these modes due to increased sample temperatures can be ruled out, as no laser-induced heating effect on the ZnO crystals was observed. Furthermore, we also exclude the possibility that these narrow bands at around 990 cm−1 could be caused by pressure-induced effects [39], since pressures of up to 2 GPa on ZnO crystals lead to continuous mode shifts < 15 cm−1 [36], and the one- and two-phonon densities (ZnO, wurtzite structure) calculated as a function of pressure only showed small shifts (<25 cm−1 for 2 GPa) for the corresponding modes [40].
Quite generally, the local distortions of the ZnO lattice due to the random presence of dioxygen species and/or oxygen or Zn vacancies in the ZnO crystal as prepared originally, have a crucial influence on the local Zn-O and Zn-Zn atom distances and thus on the local force constants: as a consequence, the wavenumbers of the few symmetry allowed first-order Raman bands, such as the E2-modes, can be shifted (up or down) from the values for the ideal ZnO structure, or the modes can even be suppressed. This agrees with the observation that the additional bands at about 200 cm−1, 380 cm−1, and 580 cm−1, which are present in the original standard pressure sample, almost completely disappear in the fine-ground ZnO once this sample is exposed to high pressure. Again, the number of the above local defects at random locations is reduced, and furthermore, the dioxygen species are embedded in a few well-defined environments of the ZnO lattice, leading to the appearance of the above-mentioned bands at around 1000 cm−1 after the high-pressure treatment. At the same time, as these narrow bands arise at around 1000 cm−1, the mode at 200 cm−1 is suppressed, and the weak bands between 600 and 750 cm−1 are reduced together with the bands between 440 and 470 cm−1. A similar behavior is observed for the band at around 333 cm−1, the intensity of which decreases with increasing pressure. In particular, the band at around 333 cm−1 disappears in perfect ZnO crystals, although this band is strongly correlated with the E2-high mode (438 cm−1). This observation clearly demonstrates that the band around 333 cm−1 is caused by defects and not by second-order Raman scattering. Here, we note that due to the rougher surface of the fine-ground ZnO, there is greater structural flexibility in its response to the application of pressure than for the epi-polished ZnO. This favors both the reduction in the number of random defects upon application of pressure and the formation of precisely arranged dioxygen species inside the ZnO lattice (cf. [16]). These results again reveal that the assumption of a second-order scattering process is not only unnecessary but also represents a misinterpretation of the additional Raman bands (besides the symmetry-allowed ones), both in the low-frequency and high-frequency regions.
Finally, Figure 3 also shows an overview spectrum obtained with tenfold magnification for the fine-ground ZnO crystal pressed at 1 GPa. This spectrum represents an averaging over a larger area, analogous to the overview spectrum of epi-polished ZnO. Again, the narrow bands that can be assigned to the dioxygen species at 1001 and 1033 cm−1 are visible next to a weak, broad band at 1157 cm−1. However, additional bands sometimes appear at 1452 and 1600 cm−1 after compression. We note that in the region from 1200 to 1600 cm−1, further O-O modes are active, in particular of the O2-molecule with 1555 cm−1 [41]. The results support the conclusion that the compression process leads to the formation of further dioxygen species with different (shorter) O-O distances, which are responsible for all observed Raman bands between 900 and 1600 cm−1. Weak bands in this range were also observed for the ZnO crystal after exposure to a pressure of 0.5 GPa (see Figure 3, insert). In addition, the overview spectrum shows a hump around the E2-low mode at 99 cm−1, which represents a variety of different zinc-dominated modes and can also be caused by the presence of dioxygen species in the crystal. We would like to emphasize once again that the ZnO spectra shown in Figure 3 are selected spectra that do not necessarily represent the entire sample.
4. Discussion
4.1. Dioxygen Species in ZnO
Zinc oxide crystallizes in the wurtzite structure type, which is characterized by a hexagonal close packing of zinc atoms, with oxygen atoms located in half of the tetrahedral voids [34]. The structure, therefore, consists of OZn4 tetrahedra with Zn-O distances of 198 pm and Zn-Zn distances of 321 pm. The wurtzite structure generates two adjacent, face-connected tetrahedral voids per zinc atom in the hexagonal close-packed zinc, where one tetrahedron of this pair is filled. Figure 4a shows this arrangement with the oxygen atoms in the blue tetrahedra. The in-between tetrahedra drawn in white are empty, and their tips are inverted along the c-axis compared to the blue ones. In principle, however, the empty neighbor tetrahedron can also be filled with oxygen atoms, which then leads to the formation of a dioxygen species with an O-O distance of 123 pm (cf. ZnO structure data [34]). Figure 4b represents a calculated, optimized ZnO structure (DFT calculations, using a Zn16O16 supercell, cf. Table S4), where one oxygen atom has been moved from a regular occupied tetrahedron (blue) to an inverse tetrahedron (white), forming a dioxygen species (oxygen atoms drawn in red) and an oxygen vacancy (enclosed by the green tetrahedra). The consequence of this irregular occupation is the displacement of the surrounding atoms, which affects both the oxygen and zinc atoms in the close neighborhood of the dioxygen species and the vacancy. Besides the new O-O distance of the dioxygen species with 153 pm, there are additional Zn-O distances of 191 pm and 246 pm (yellow bonds in Figure 4b), and Zn-Zn distances of 292 pm and 306 pm, and from 328 pm to 339 pm [12]. In particular, a bending of the hexagonal Zn sheets perpendicular to the c-axis can be seen in the calculated structure model compared to the planar layers of the ideal ZnO (cf. Figure 4). The Mulliken charge distribution of the optimized structure indicates that the dioxygen species corresponds to a peroxide ion O22−.
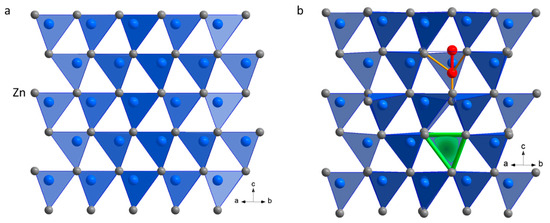
Figure 4.
(a) An ideal ZnO wurtzite structure, with the view towards the plane (11–20); (b) a calculated ZnO structure (2 × 2 × 2 supercell) after relaxation, where one oxygen atom has been moved from a regular occupied tetrahedral position to an inverse one, forming a dioxygen species (oxygen atoms are drawn in red, yellow lines depict selected new Zn-O bonds); the oxygen vacancy formed is enclosed by the green lines/tetrahedron.
In chemistry, several dioxygen species are known: the peroxide ion (O22−), the superoxide ion (O2−), the O2-molecule, and the dioxygenyl ion (O2+) with O-O distances of 149 pm, 134 pm, 121 pm, and 112 pm [41,42], respectively. In particular, there are many peroxide and superoxide compounds of the alkali and alkaline earth metals and transition metals, including zinc peroxide. Furthermore, first-principle DFT calculations of the stability and the structural arrangement of the excess oxygen atoms in ZnO have been performed, where interstitial oxygen atoms are placed at (initially empty) tetrahedral and octahedral sites, thus replacing an O2− ion with the peroxide ion O22− [4,43,44]. The studies reveal that the oxygen interstitial on the octahedral site is present as (O2−)i with a very high formation energy. By contrast, the oxygen interstitial on the tetrahedral site relaxes spontaneously to form a peroxide defect (O22−) with an O-O distance of 146 pm (called the split interstitial) [45]. Another split interstitial configuration with an O-O distance of 151 pm has also been found [4]. The calculated formation energy of the peroxide defect indicates a significant likelihood for this defect to occur under oxygen-rich conditions [43].
Nevertheless, the nature of defects in ZnO is complex and not fully understood to date. It is indisputable that oxygen vacancies certainly play a role in its intrinsic properties, but they cannot explain the n-type conductivity of ZnO. Moreover, zinc vacancies possess a very low formation energy, and it is assumed that local irregularities/inhomogeneities constitute a significant part of the defect structure [46]. One way to understand the formation and properties of defects in ZnO is to consider dioxygen species. To gain more insight, the O-O stretching mode of the split interstitial O22− (O-O: 146 pm) on the oxygen site in ZnO was calculated to be 1051 cm−1, and its coupling to the ZnO lattice was found to be very weak [45]. Furthermore, the properties of other diatomic substitution species at an oxygen site in ZnO (split interstitials), such as NO, N2, and CO, were also calculated (LDA with ultrasoft pseudopotentials) [45]. The stretching modes of these defects in ZnO as a function of the interatomic distances are shown in Figure 5, together with the values for the peroxide, superoxide, and dioxygenyl ions obtained from the corresponding compounds (ZnO2, NaO2, and O2AsF6) and for the O2-molecule (black dots in Figure 5); here called constituent ions. The assigned charges of the diatomic species in Figure 5 include the two electrons from the zinc neighbors. Thus, N22−, (CO)2−, and (NO)2− ions embedded in a crystal correspond to uncharged defects with two or three electrons filled in the π* valence orbitals. The diagram shows that as the number of electrons decreases, the interatomic distances decrease and the wavenumbers of the stretching mode increase. In addition, the wavenumbers of the stretching modes increase from the constituent O-O ions (including O2) to the substituted diatomic species in ZnO (cf. Figure 5). The wavenumber of a peroxide ion embedded in ZnO (1051 cm−1) is therefore about 200 cm−1 higher than one of the same O22− ion in zinc peroxide (840 cm−1), in spite of a similar O-O distance. A comparable value for the stretching mode was found for the peroxide ion in stoichiometric ZnO (the oxygen atom moved from a regular to an inverse tetrahedral site, forming an oxygen vacancy) at 975 cm−1 (cf. Figure 5). These results can be used to estimate the wavenumbers of dioxygen species with lower charges and corresponding shorter O-O distances. The extrapolation, including the calculated values for the other diatomic species with different charges, suggests wavenumbers of about 1350 cm−1 for an embedded, single-charged O2− (peroxide ion) and more than 1600 cm−1 for a neutral O2 in ZnO (marked by the light red areas in Figure 5). Therefore, Raman bands measured between 950 and 1150 cm−1 can be assigned to the peroxide ion at around 1400 cm−1 to the superoxide ion, and at around 1600 cm−1 to the O2-molecule. Since the charge of an ion (by the total electron number) in ionic solids generally does not correspond to an integer value, this is a rather formal assignment, and many kinds of intermediate states are quite possible, which is then also reflected in the measured wavenumbers. We note that the linear relationship between the force constants, bond enthalpy, and wavenumbers, together with the inverse proportionality to the atom distances, is demonstrated for the dioxygen species in [42]. Furthermore, the charge balance also depends on the stoichiometry of ZnO. In the stoichiometric case, as we used in the present DFT calculation, dioxygen species and oxygen vacancy were formed simultaneously, and a negative charge excess was created by the formation of a peroxide ion (O2− + O2− = O22− + 2 e−). In contrast, replacing an O2− with an O22− resulted in an oxygen-rich, uncharged zinc oxide. Thus, the formation of oxygen vacancies described here by the movement of an oxygen atom to form a peroxide ion may require less energy and may, therefore, be responsible for the intrinsic n-type conductivity of ZnO.
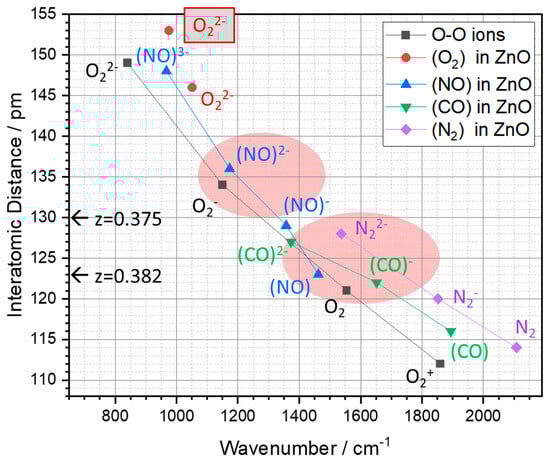
Figure 5.
The wavenumbers of the stretching modes of diatomic species as a function of their interatomic distances. Black squares: values of dioxygen species (O22−, O2−, O2, and O2+) obtained from the corresponding compounds (ZnO2, NaO2, and O2AsF6) and the O2-molecule, respectively. Other values correspond to diatomic species—O2 (red circles), NO (blue up-triangles), CO (green down-triangles), N2 (purple diamonds)—with corresponding charges after replacing a regular lattice oxygen atom in ZnO, calculated by the DFT method; here, the values of the peroxide ion O22− (shaded in gray) were determined for stoichiometric ZnO, which means that a vacancy is formed next to a dioxygen ion. In addition, the calculated O-O distances of dioxygen species in ZnO (wurtzite structure with occupied adjacent tetrahedra) for two different oxygen z-values (z = 0.382 determined by XRD data and z = 0.375 of the ideal wurtzite structure) are indicated by arrows; for further details, see the text. Furthermore, the areas shaded in light red indicate extrapolated ranges of wavenumbers for embedded superoxide ions and O2-molecules in ZnO based on values of the peroxide ion.
The structural impact of the dioxygen species on the ZnO lattice is most visible in the O-O distance of the oxygen species. The common z-value for the oxygen site of ZnO is z = 0.382, which results in dioxygen species with an O-O distance of 123 pm [34]. A small shift of the z-value of ZnO, e.g., to the ideal wurtzite structure, z = 0.375 [35], leads to O-O distances of 130 pm, which approximately correspond to those of the superoxide ion O2− (134 pm). However, both distances are still closer to those of the O2-molecule than to those of the constituent dioxygen ions, which emphasizes the necessity of a structural displacement of the surrounding atoms for the incorporation of peroxide and superoxide ions in ZnO; cf. Figure 5.
4.2. Defects in ZnO and Experimental Spatial Resolution
The lateral resolution of the Raman mapping of the ZnO surfaces is defined by the size of the laser spots, which is ≤5 μm with a distance of 200 μm between the individual measuring points. Considering that a 9 × 9 grid of measurement points on the 2 × 2 mm2 crystal was used to characterize the ZnO(0001) surfaces, less than 0.1% of the total crystal surface was analyzed by the Raman measurements. Therefore, the spectra selected for the respective measurements do not necessarily represent the entire sample and most of the spectra obtained from the samples essentially correspond to overview spectra (cf. Figure 2). The reason for this lies in the density and type of defects that occur in the specific area of the crystals that are detected, which can be estimated by various methods. Extended defects such as dislocations are visible in optical images of etched crystal surfaces, and for the (0001) surface of a ZnO crystal (Crystec, as-received), their number is about 2 × 10⁵ per cm2 measured via a common wet-chemical etching process (yielding the so-called etch pit density) [47]. This leads to one dislocation defect in an area of 25 × 25 μm2, on average. In many cases, it is found that the dislocation density for a ZnO crystal is much lower, and 1–5 per cm2 is achieved for crystals of the highest quality [48]. These types of defects are so rare in single-crystal ZnO that they are present in our measurements only to a very small extent and can thus be ignored. In contrast, the concentration of intrinsic point defects in oxide crystals is much larger than that of these extended defects. Using positron annihilation spectroscopy [49], the point defect concentration in ZnO single crystals (hydrothermal growth) was determined to be about 105 per μm3. The concentration of electrically active defects measured by deep-level transition spectroscopy gives similar values in the range of 103–105 point defects per μm3 for hydrothermally grown crystals [50,51]. The defect structure in ZnO is complex and, according to our investigations, some of these defects consist of dioxygen species. The number of different dioxygen species-based defects must be large enough for the corresponding modes to be visible in all the obtained Raman spectra with spot sizes in the micrometer range; examples would be the bands at 333 cm−1, 1106 cm−1, and 1156 cm−1 (cf. Figure 1). Assuming that 1% of the point defects belong to some kind of dioxygen species, this means that the sample volume detected by the Raman measurement contains more than a thousand dioxygen species. However, a couple of Raman spectra that deviate from the common spectra (the ones before pressure application) were found after the ZnO crystals had been pressed up to 2 GPa (cf. Figure 2 and Figure 3). This can be explained by assuming that the original deformation of the layers due to various defects ( c-axis, cf. Figure 4b) had been smoothed out by the application of high pressures. Here, this smoothing process was accompanied by displacements of oxygen atoms or dioxygen species, such that afterwards, only a few types of very specific O-O distances were present in noticeable amounts; in the extreme case, perfect ZnO lattice areas without any defects were generated. Since the laser focus of our Raman measurements is about 1–5 μm, the individually modified areas are quite large and must extend over at least a micrometer.
This deduction is supported by optical images taken on the pressed, epi-polished ZnO crystal. Figure 6 presents images of the ZnO crystals in the transmission and DIC (differential interference contrast) modes, which were exposed to pressures of 1 and 2 GPa, respectively. These images show areas deformed by pressure, which form curved stripes in the (0001) surface, which are fragmented by cracks. The number and width of the stripes increase with the pressure applied, and such stripes were not observed in the original crystals. At 1 GPa, the width of the stripes is about 10 µm, and at 2 GPa, the width is about 20 µm, and the length is hundreds of micrometers. The cracks run perpendicular to the stripe lengths within the crystals at different distances from each other and consist of broken lines. Thus, the pressed ZnO crystals partially consist of fragments (micrometer size domains), in which different structural arrangements can occur, and whose difference from the ideal ZnO crystal is characterized by the presence of specific sets of O-O distances, various degrees of layer bending, or slightly modified lattice parameters. The position of the stripes does not seem to be influenced by mesoscopic imperfections caused by processes involved in the growth and surface finishing, or the cutting of the samples (including surface scratches). This pressure-induced formation of crack fragments was also observed by the unidirectional sliding friction test under a contact pressure of 0.72 GPa, which showed cleavage cracks along the (0002) layers of single-crystal ZnO [52]. Furthermore, contact-induced damage from nanoindentation measurements (around 1 GPa) revealed the nucleation and propagation of slip on the (0001) and (10–11) layers [53]. Both studies confirm the formation of cracks in the c-plane and in an orientation of about 60° to the c-plane for ZnO under pressure, which is consistent with the observations on our samples. This means that ZnO crystals break locally into fragments across and/or along the (0001) direction under pressure. The influence of pressure is greater on the rough surface of the fine-ground ZnO, which can be explained by the greater variability in the formation of different types of individual fragments under pressure. The fine-ground ZnO crystals contain areas with precisely arranged dioxygen species that belong to the peroxide ion, together with species where the O-O distances are similar to those of the O2-molecule. Similarly, the perfect ZnO lattice areas are also a result of the compression process and were mainly caused by the flattening of the bent layers present in the original crystal before exposure to high pressure.
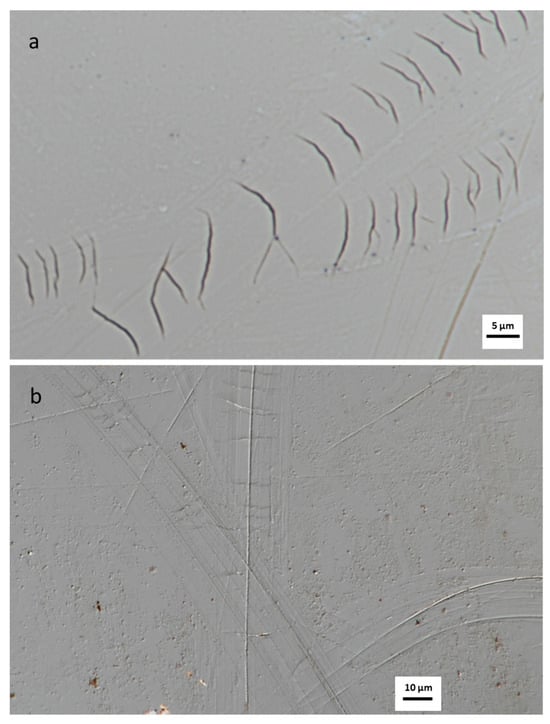
Figure 6.
Optical images of an epi-polished ZnO(0001) crystal (a) in transmission and (b) in differential interference contrast modes, after having applied pressures of 1 and 2 GPa, respectively. The curved stripes, which are fragmented by cracks (ꓕ to the stripes), are clearly visible.
Turning to other probes besides spectroscopy, we note that, in general, the changes in the Raman spectra (compared to those for the original samples) reflect the permanent local (micrometer-scale) structure changes of the ZnO crystals caused by the application of high pressure, as discussed above. Aiming for even higher resolution, the transmission electron microscopy (TEM) technique seems to be the ideal tool for the investigation of such defects at the atomic scale. However, this method needs very thin, precisely oriented samples, whose preparation is a non-trivial task. Thus, in this study, we employed several different techniques to prepare such samples from our ZnO crystals.
Figure 7 shows a high-angle annular dark-field image (HAADF) that represents the (11–20) layers of a ZnO sample prepared by ultramicrotomy, and an annular bright-field (ABF) STEM image prepared with a focused ion beam setup, followed by the nanoMill technique with the same orientation. The HAADF-STEM image of this ZnO sample (20 nm thick) shows several bends in the Zn layers perpendicular to the c-axis, which extend over a range of 2 to 5 nm. Areas over which such a coordinated displacement of the zinc atoms (white dots) occurs are indicated by red ellipses in Figure 7a. Furthermore, the occupation of some pairs of adjacent tetrahedra by two oxygen atoms is suggested by the ABF image: a number of areas are visible where two oxygen atoms (small dark dots) occupy neighboring tetrahedral sites (see the insert, Figure 7b). The regions where many dioxygen species are found to be located right next to each other in a row perpendicular to the c-axis exhibit sizes of about 2 nm. This incorporation of several dioxygen species in a row is accompanied by a bending of the Zn layers that lie perpendicular to the c-axis; this implies a systematic variation of both the Zn-Zn distances between the hexagonal Zn-sheets and the O-O distances in the dioxygen species present.
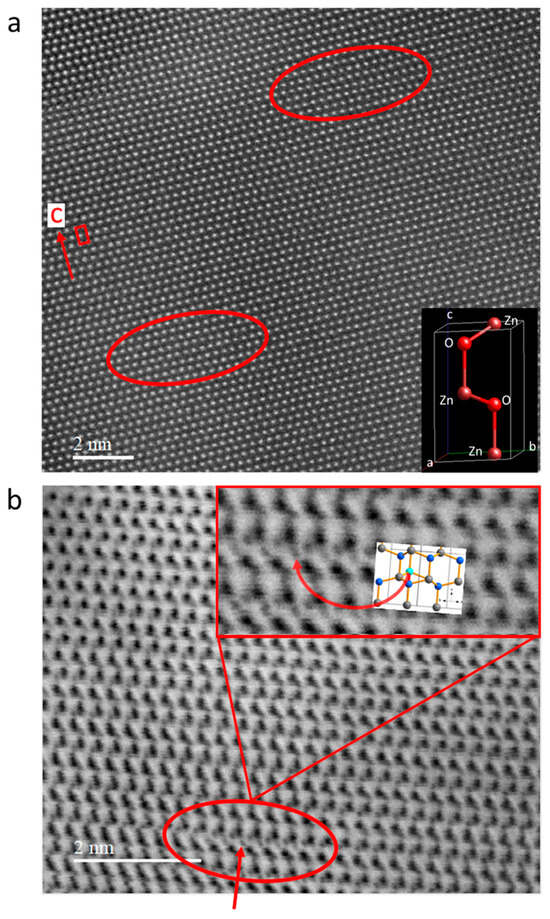
Figure 7.
HAADF-STEM (a) and ABF-STEM (b) images of the original, as-received ZnO crystal representing the (11–20) layer. (a) Zinc atoms are visible as white dots; the unit cell and c-axis are marked in red, and the regions where bending of the zinc atom rows c-axis occurs are marked by an ellipse; and atoms in the ideal ZnO unit cell are shown in the inset at the bottom right. (b) Oxygen atoms are visible as small dark-grey dots, and the arrow/ellipse indicates a position where both adjacent, face-connected tetrahedral voids are occupied by oxygen atoms, enlarged at the top right. The zinc atoms correspond to the large black spots; in the enlargement, both oxygen and zinc atoms are distinctly visible. The inset inside the enlargement shows an excerpt of the wurtzite structure, with zinc atoms in grey, regular oxygen atoms in blue, and the additional oxygen atom in the adjacent tetrahedra in cyan.
However, one must note that although these TEM observations clearly indicate the presence of coordinated rows of dioxygen species in ZnO, they are only of limited validity as far as the origin of these lines of defects in the TEM samples is concerned. It is quite possible that these observed defects might have been introduced into the ZnO samples by the TEM sample preparation techniques used; such a possibility cannot be excluded since the low hardness of ZnO and the thinning processes involved can both favor the generation of new defects. Nevertheless, the observed TEM images represent the intrinsic structural imperfections of ZnO (dioxygen formation accompanied by bending) of precisely the kind suggested by our Raman measurements on ZnO crystals; only the specific origin of these highly coordinated defect arrangements remains unclear.
We note that the bending makes it difficult to obtain enough suitable TEM images for a quantitative analysis with high accuracy. Nevertheless, the rather large number of individual defects associated with such bending regions visible in the TEM images, with sizes of several nanometers, supports the point defect concentration of about 105 point defects per μm3 mentioned in the literature [49].
4.3. Raman Analysis
To evaluate the influence of the structural imperfections in zinc oxide on the Raman spectra in more detail, we calculated the Raman bands of the ZnO structure where the inserted dioxygen species is formed by moving an oxygen atom from a regular to an inverse tetrahedral site of the ZnO supercell containing sixteen formula units of ZnO (cf. Table S4 and Figure 4b). In this structure model, both oxygen atoms are located inside the trigonal bipyramid of Zn atoms formed by the two face-connected tetrahedra, and the structure is relaxed with respect to the atom positions and cell parameters of the supercell, resulting in an O-O distance of 153 pm for the dioxygen species. The Raman active phonon modes obtained for this realization of a dioxygen species (cf. Table S5) are presented in Figure 8, together with the spectra of the epi-polished and the fine-ground ZnO crystals before any pressure treatments had been applied (c.f., Figure 1); the orange bars were computed for the same Z(XX)Ẑ scattering geometry that had been employed for the measured spectra (laser beam c-plane). The calculation reveals many bands of the ZnO lattice with significant intensity, and most of the calculated bands appear between 80 cm−1 and 260 cm−1 and between 380 cm−1 and 580 cm−1, with the strongest bands at 158 cm−1, 208 cm−1, and 548/558 cm−1. These bands are located next to the two generally dominant, symmetry-allowed phonon modes of ZnO (E2-low: 103 cm−1, E2-high 463 cm−1 for the structure model used above). An analogous calculation for a supercell of the ideal ZnO wurtzite structure of the same size (16 formula units of ZnO) reveals only the modes allowed by symmetry, with E2 at 110 cm−1 and 435 cm−1, and A1 at 377 cm−1.
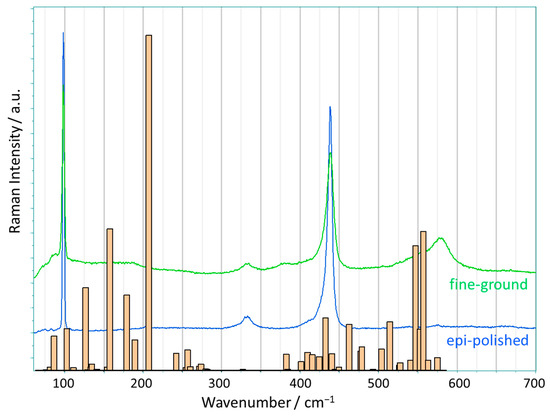
Figure 8.
Raman spectra of original (no exposure to high pressure) ZnO single crystals (scattering geometry: (0001) ꓕ to laser beam, i.e., Z(XX)Ẑ) with two different surface qualities, including calculated Raman modes of the ZnO structure model, where one oxygen atom is moved from a regular occupied tetrahedral void to an inverse one with structural relaxations. The intensities of the modes calculated for the scattering geometry Z(XX)Ẑ are shown as orange bars.
The extra Raman bands caused by the embedded dioxygen species agree well with the additional bands observed in the Raman spectra of epi-polished and fine-grounded ZnO crystals, before high-pressure treatment, between 60 cm−1 and 200 cm−1, and at around 400/540 cm−1. The band at 333 cm−1 in the Raman spectra is also reflected by a calculated band at 328 cm−1. Their intensity is low for the scattering geometry used, as shown in Figure 8, but increases strongly for other scattering geometries. For comparison, the calculated mode intensities for polycrystalline samples are presented in Table S5. In the literature, the band at 333 cm−1 is mainly attributed to the second-order combination of E2-high—E2-low due to its temperature dependence. The difference mode should decrease in intensity with decreasing temperature, which is the case for the band at 333 cm−1 [54]. However, this decrease in the intensity of the difference mode with decreasing temperature may also be caused by the strong increase in the intensity of the E2-high mode relative to the E2-low mode, which is accompanied by a strong reduction in linewidths. In addition, E1-TO becomes an independent band at 409 cm−1 [54]. This observation suggests that the distortion of the ZnO lattice changes with temperature (including coupling to the host lattice) and can therefore also influence the Raman modes. From our point of view, another remarkable aspect is that this band is not visible in the Raman spectra of beryllium oxide [55], which also crystallizes in the wurtzite structure like ZnO. The spectrum of BeO shows the E2-low, E2-high, and A1-LO modes for the scattering geometry used here, but does not show the difference mode between the two E2 modes. Dioxygen species are not reported in BeO and are highly unlikely due to the short interatomic distances (a Be-O distance of 165 pm) [56,57]. These results suggest that the band at 333 cm−1 is more likely to be due to the presence of dioxygen species than to a difference between two modes. This is further supported by the observation that in perfect ZnO, both E2 modes are visible, but not the difference mode.
All the intense additional bands discussed above, including the band at 328 cm−1, which we obtained for ZnO with embedded dioxygen species, show the A1 symmetry. These modes, therefore, correspond to a Zn-O displacement along the c-axis in which a dioxygen species is involved. The bonding of a zinc atom to the dioxygen species (Zn-O-O) results in a significant decrease in the mobility of the oxygen atom, which leads to a reduction in the wavenumber of the A1 modes. Thus, the two A1 modes (TO: 378 cm−1, LO: 574 cm−1 in ideal ZnO) can be shifted by the embedded dioxygen species to the bands observed in the two ranges between 60 cm−1 and 330 cm−1 and between 380 cm−1 and 550 cm−1, respectively (such modes whose shift is linked to the presence of a dioxygen species are indicated by “::”, e.g., for A1 we write A1 :: O-O). The individual bands then reflect different structural arrangements and/or different dioxygen species. This is supported, in particular, by the observation that for the two bands that are observed in the Raman spectra of ZnO crystals at 200 cm−1 and 540 cm−1 but are not expected to be active due to symmetry, the intensity increases in parallel with the intensity of the O-O stretching mode of the dioxygen species observed at about 1100 cm−1.
These results of the calculations agree very well with the observed Raman bands corresponding to the Zn-O based modes of the ZnO crystals. Furthermore, the measured bands at wavenumbers above 750 cm−1, which correspond to the O-O stretching modes, are associated in the calculations with a band at a wavenumber of 975 cm−1 for the optimized structure with an O-O distance of 153 pm. However, the measured spectra (cf. Figure 1) show two broad bands for the O-O modes between 1000 cm−1 and 1200 cm−1. This deviation is certainly due to the fixed alignment of the dioxygen species, together with the specific O-O distances obtained in the model calculations. This means that in the ZnO crystals used in the experiment, many dioxygen species exist that are characterized by a variety of O-O distances, and not just one single species with a particular (long or short) O-O distance, as assumed in the structural models used for the calculations both here and in the literature. By comparing with the wavenumber vs. O-O distance plot in Figure 5, we can conclude that the observed Raman bands suggest the presence of O-O distances that are most likely associated with the presence of peroxide ions in the ZnO crystal.
In summary, the presence of dioxygen species in ZnO, together with the associated structural displacement of the neighboring Zn and O atoms, can explain the additional Raman bands of epi-polished and cleaved ZnO crystals; furthermore, second-order modes for the assignments of these bands are no longer necessary. However, the spectrum of fine-ground ZnO shows additional deviations (cf. Figure 8), which are most likely a consequence of the low hardness of ZnO. Zinc oxide is a soft oxide material with a hardness of 5 GPa (nanoindentation) [58], which corresponds to a Vickers microhardness of 184 kg/mm2 (4 Mohs) [59]. Comparable oxides such as MgO, NiO, and TiO2 (rutile) have a Vickers hardness of around 600 kg/mm2, Al2O3 (corundum) of 2000 kg/mm2 [59,60], and the semiconductor GaN has a hardness of 15 GPa [53].
The softness of ZnO can indirectly be responsible for the appearance of structural changes during the grinding process of ZnO crystals, thus providing an explanation for the differences in the Raman spectra between the epi-polished and fine-ground ZnO(0001) crystals. The abrasion caused by grinding leaves structural damage on the surface, which is still clearly detectable on the rough surface. This is especially true for the broad Raman bands at around 185 cm−1 and 550 cm−1 (shoulder). However, for the fine-ground sample, there are additional bands at 380 cm−1 and 575 cm−1, which can be assigned to the symmetry-allowed bands A1-TO and A1-LO, respectively. While this seems to contradict the fact that our measurement geometry should suppress these bands—as it does for the epi-polished sample (c.f. Figure 1)—we note that the rough surface of the fine-ground sample can easily contain additional crystal orientations, which are then responsible for the Raman bands observed (380 cm−1, 575 cm−1). In this respect, the surface of the fine-ground sample resembles a powder consisting of grains of different sizes with a random distribution of crystal orientations and explains the almost identical Raman spectra of the compressed ZnO powder and the fine-ground ZnO crystal, cf. Figure 1 (see also [12]). Furthermore, the increase in intensity in the range between 60 cm−1 and 250 cm−1 and the shoulder at about 550 cm−1 reflect structural displacements, as described above, for an embedded dioxygen species in ZnO. This means that for the sample with the rough surface, more oxygen atoms occupy irregular sites and form additional Zn-O and Zn-Zn distances that deviate from those in the ideal ZnO structure. Thus, the grinding process is responsible for the presence of both various crystal orientations and further irregularities due to the oxygen distribution observed in fine-ground ZnO(0001) crystals.
With these results, the individual bands of the investigated ZnO(0001) crystals can be assigned to the specific structural features (keeping in mind the scattering geometry employed). Table 1 shows the observed Raman bands of epi-polished ZnO(0001) crystals with the corresponding assignments. The two E2 modes are the observable Raman bands of perfect ZnO (an ideal wurtzite structure) for the Z(XX)Ẑ geometry employed, and the also permitted A1-LO mode is mostly suppressed by birefringence. The dioxygen species created the bands above 800 cm−1 (O-O stretching modes), which are directly coupled to the bands at 200 cm−1, 333 cm−1 and 539 cm−1 (A1 :: O-O), where the relevant Zn-O displacements are affected by the presence of the dioxygen species (cf. Figure 2). The resulting disorder in the Zn lattice is reflected in the bands around 100 cm−1 together with an asymmetry of the E2-high band, which merges into the shoulder at 405 cm−1. The other bands between 650 cm−1 and 750 cm−1 reflect larger Zn-O distance deviations induced by the embedded dioxygen species. For fine-ground ZnO crystals, further bands are observed, which represent disorder caused by the presence of different crystal orientations (bands at 380 cm−1 and 575 cm−1) and by oxygen irregularities due to the grinding on the crystal surface (bands at 185 cm−1 and 550 cm−1).

Table 1.
Observed Raman modes (wavenumber, cm−1) of epi-polished ZnO(0001) crystals including corresponding new mode assignments based on the presence of dioxygen species (laser beam c-plane). On the left are the Raman modes of the ideal ZnO, and on the right, the additional modes caused by the embedded oxygen species.
4.4. Pressure Influence
Another aspect that needs to be discussed is the pressure-related changes in the Raman spectra of ZnO single crystals. The hydrothermal growth of ZnO crystals proceeds below 0.2 GPa and 400 °C using alkali hydroxide solutions [8,48,61]. The pressures we applied, 0.5 to 2 GPa, are therefore considerably higher than the pressure that exists during crystal growth and can significantly affect an already existing single crystal. Due to the known low hardness of ZnO, the great influence of the pressure on the ZnO crystals is visible in the flattening of the bent Zn layers caused by the incorporated dioxygen species (cf. Figure 4b). Through the compression process, combined with and supported by crack formation, domains can be created that exhibit the perfect ZnO wurtzite structure. This type of domain, consisting of essentially ideal ZnO, is reflected in the Raman spectra in Figure 2. In addition, the incorporated dioxygen species can be adjusted with respect to their O-O distances by the applied pressures. On the one hand, for a given dioxygen species, a small O-O distance distribution around some characteristic average value can be formed, which is then reflected in the narrowness of the Raman bands, e.g., the one around 1000 cm−1. On the other hand, various different types of dioxygen species with different characteristic O-O distances can be present, which is then reflected in multiple Raman bands, e.g., between 1200 and 1600 cm−1 in our study. The different dioxygen species formed by compression are reflected by the Raman spectra shown in Figure 3.
The effects of the compression process can be understood by considering the following scenario. The two broad Raman bands observed between 1000 and 1200 cm−1 (cf. Figure 1, typical ZnO spectra) reflect several different dioxygen species, each with a large variety of O-O distances, as they arise during the growth process. This can occur by incorporating non-aligned dioxygen species along the c-axis, which are not at the tetrahedral sites in ZnO, but are in the vicinity. This arrangement allows a wide range of different Zn-O distances to be realized. A second possibility is that several adjacent dioxygen species occur in a layer and form a high-defect region, a dioxygen cluster, that is inserted into the stacked (001) layers. The surrounding atoms try to maintain their ideal structure (as in the ideal ZnO crystal) and thus compress the O-O distances along the edges of the dioxygen cluster, which then appear in the crystal as a bend in the (ideally flat) Zn layers. The shorter O-O distances along the cluster edges are reflected in higher wavenumbers at 1150 cm−1 and somewhat longer O-O distances present in the inner region of the clusters in the smaller wavenumbers at 1100 cm−1, respectively; the latter show a lower intensity in all measured spectra. Under increasing pressure, these two broad bands initially split into separate bands and then disappear, along with the appearance of narrow bands at around 1000 cm−1 (see Figure 3). These narrow bands indicate a narrow distribution of the O-O distances of the dioxygen species (presumably symmetrically arranged parallel to the c-axis) with longer O-O distances (compared to the initial dioxygen species in the original ZnO crystals); this is also reflected in the calculated 975 cm−1 wavenumber for the O-O mode of our assumed structural model. All these structural modifications can be separately realized, since the crack formation processes inside the ZnO crystal result in distinct individual domains, such that each exhibits a limited range of the structural features described above. The observed fragmentation, as shown in Figure 6, together with the bending of the layers and the formation of dioxygen, as seen in the TEM images (Figure 7), supports this scenario.
4.5. Structural Consequences for ZnO
The origin of the bending of the Zn layers observed in the TEM is the presence of two face-connected tetrahedral voids in the Zn lattice of wurtzite ZnO that can both incorporate an oxygen atom, where, in principle, each of the two tetrahedra has initially the same likelihood to be occupied during the crystal growth process. This flexibility then leads to the local formation of dioxygen species, followed by the layer bending that can be observed, for example, in the TEM images shown. The result is an expansion of the entire crystal lattice, leading to a soft structure with a longer Zn-O distance (198–199 pm [34]) than the slightly shorter Zn-O distance of 196–197 pm that one would expect for the ideal ZnO wurtzite structure. This estimate for such a distance is obtained from the average of the Zn-O distances observed in ZnO4 tetrahedra that are found in ternary zinc oxide compounds (ICDD database); for details, see the Supporting Information (Figure S4). The bending-like deformation is also reflected in the high displacement parameter of the zinc atoms compared to those of the cations in simple oxides; these parameters were determined by the refinement of the crystal structure of ZnO on the basis of various single-crystal data published for ZnO, see Table S6. In most instances of the ZnO solids in the ICSD database, the displacement parameter of the zinc atoms is unusually high: it is just as high as that of the oxygen atoms, although the value should be considerably lower, since in simple ionic compounds, the atom displacements tend to decrease with an increasing atomic number. For example, in Ga2O3, the displacement parameter of the gallium atoms (0.47) is significantly lower than that of the oxygen atoms (0.75). Moreover, the displacement parameters of the zinc and oxygen atoms are halved after compression of the powder with a pressure of approx. 1 GPa (see Table 1 in [62]), which confirms that the atomic displacements are reduced after the exposure of the sample to high pressures. This decrease in the atomic displacements is accompanied by a slight decrease in the lattice parameters, which also suggests a flattening of the bent layers after the application of high pressures. The Raman spectra confirm this pressure dependence, since the spectra of ZnO crystals show broader line widths before compression than afterwards, and the background becomes smooth after exposure to high pressures.
We note that since these structural deviations can also be observed in the spectrum of cleaved ZnO, the formation of the dioxygen species and the bending is not caused by the grinding/polishing process but occurs during the original crystal growth. However, the grinding process generates additional defects that lead to further Raman bands. In addition, measurements on mineral ZnO crystals also show the O-O stretching modes in the Raman spectra, which further confirms the presence of dioxygen species as an intrinsic property of ZnO.
We conclude that, by applying pressures of up to 2 GPa, the originally bent Zn layers present in the original ZnO crystal can be permanently flattened; furthermore, the O-O distances of the dioxygen species are also modified, such that Raman bands are observed in the entire range from 900 cm−1 to 1600 cm−1 for these samples. In addition, the Raman bands at around 200 cm−1, 405 cm−1, and 575 cm−1 largely disappear after these pressures are applied.
5. Conclusions
Zinc oxide is a soft material, where bending of the layers perpendicular to the c-axis occurs during crystal growth, because both of the two face-connected tetrahedral voids present in the Zn-lattice of the ideal ZnO wurtzite structure can be equally occupied by oxygen atoms, thus forming dioxygen species during growth. The presence of dioxygen species allows for the explanation of the complete Raman spectrum of single-crystal ZnO, i.e., all bands in addition to those allowed by symmetry can be accounted for, and the assumption of second-order scattering is not necessary. These results furthermore confirm our earlier studies, where dioxygen species were also formed during the formation of ZnO films using the femtosecond pulsed-laser deposition method, analogous to the crystal growth of ZnO [12,62,63], and where we investigated different types of dioxygen species theoretically [12,63].
In zinc oxide, dioxygen species with different O-O distances occur, and the dependence of the O-O stretching modes on the applied pressure treatment prove the presence of dioxygen species in ZnO, which is also supported by phonon calculations of structure models with embedded dioxygen species. The Raman spectrum of truly perfect zinc oxide (an ideal wurtzite structure), obtained as domains in pressed ZnO(0001) crystals, is presented here for the first time and shows only two modes (E2-low and E2-high) in the scattering geometry used; the A1-LO mode that is allowed both by symmetry and for the scattering geometry employed is suppressed by birefringence.
The precise characterization of defects is crucial for understanding the properties and the resulting possible applications of ZnO. The presence of dioxygen species next to oxygen vacancies can help in understanding the n-type conductivity of ZnO, which is still a work in progress today. In particular, the modification of oxygen defects by applying pressure, as described here, opens up new possibilities. For example, the single-photon emission of isolated defects in ZnO (NV centers) [64] can be controlled by applying pressures following a well-designed protocol. In addition, the great influence of surface quality on Raman spectra was clearly demonstrated, again highlighting the advantages of Raman spectroscopy as a local probe.
Besides these more fundamental aspects of the embedding of dioxygen species in zinc oxide, their presence is also of great relevance in applications, since ZnO is a material that is suitable for various applications in electronics, optoelectronics, and sensor technology. Here, the most important issue is the stability of its electrical properties in the presence of oxygen: its conductivity varies, and its electrical properties change over time due to its reaction with oxygen in the environment. This variation in electrical properties makes ZnO-based components unstable [65]. Moreover, ZnO is one of the leading representatives of metal oxide semiconductors, which are known for their good gas sensitivity. The decisive parameter here is the presence of free electrons on the surface, accompanied by the formation of oxygen vacancies. The electrons promote the adsorption of gas molecules, which leads to improved material sensitivity [66]. A precise understanding of oxygen defects down to the smallest detail is thus essential for the usability of ZnO in all these applications, and the elucidation of the existence and behavior of dioxygen species in ZnO plays a key role in this.
Furthermore, dioxygen species are not restricted to ZnO but are also relevant for hard, electrically insulating materials. For example, two types of interstitial oxygen defects occur in corundum single crystals irradiated with fast neutrons: neutral atoms and O− ions [67]. The analysis of these defects reveals the formation of oxygen dumbbells and contributes to understanding the radiation tolerance of the material. Clearly, the study of dioxygen species in general oxides besides ZnO will be an increasingly important research direction in solid-state chemistry and materials science.
Supplementary Materials
The following supporting information can be downloaded at: https://www.mdpi.com/article/10.3390/cryst15060574/s1, Figure S1: Sample preparation, Figure S2: SEM images, Figure S3: Raman spectra, Figure S4: Zn-O distances, Table S1: Raman modes, Table S2: Zn-O distances, Table S3: Raman phonon modes, Table S4: ZnO supercell data, Table S5: Calculated Raman modes, Table S6: Displacement parameters, Table S7: Calculated energies. Reference [68] is cited in the supplementary materials.
Author Contributions
Conceptualization: D.F.; methodology: D.F.; validation: D.F., D.B., A.K., D.Z. and J.C.S.; visualization: D.F. and A.K.; Investigation: sample preparation (high pressure): G.M.M. and A.K., Raman: D.B. and D.F., DFT-calculations: D.Z.; data curation: D.F., D.B. and D.Z.; writing—review and editing, D.F., D.B., G.M.M., A.K., D.Z. and J.C.S. All authors have read and agreed to the published version of the manuscript.
Funding
This research received no external funding.
Data Availability Statement
Data will be made available on request.
Acknowledgments
We gratefully acknowledge the helpful technical support of B. Fenk and U. Waizmann (SEM investigation), W. Sigle (TEM investigation), M. Kelsch and U. Salzberger (TEM sample preparation), and O. Erlhoff (cutting crystals) at the Max Planck Institute for Solid State Research. D. Zagorac acknowledges the support by the Ministry of Science, Technological Development and Innovation of the Republic of Serbia through Contract No. 451-03-66/2024-03/200017.
Conflicts of Interest
The authors declare that they have no known competing financial interests.
References
- Arend, H.; Hulliger, J. Crystal Growth in Science and Technology; NATO; Springer: New York, NY, USA, 1989; 438p. [Google Scholar] [CrossRef]
- Hulliger, J. Chemistry and Crystal Growth. Angew. Chem. Int. Ed. 1994, 33, 143–162. [Google Scholar] [CrossRef]
- Özgür, Ü.; Alivov, Y.I.; Liu, C.; Teke, A.; Reshchikov, M.A.; Dogan, S.; Avrutin, V.; Cho, S.-J.; Morkoç, H. A comprehensive review of ZnO materials and devices. J. Appl. Phys. 2005, 98, 041301. [Google Scholar] [CrossRef]
- Janotti, A.; Van de Walle, C.G. Native point defects in ZnO. Phys. Rev. B 2007, 76, 165202. [Google Scholar] [CrossRef]
- McCluskey, M.D.; Jokela, S.J. Defects in ZnO. J. Appl. Phys. 2009, 106, 071101. [Google Scholar] [CrossRef]
- Ellmer, K.; Klein, A. ZnO and Its Applications. In Transparent Conductive Zinc Oxide; Ellmer, K., Klein, A., Rech, B., Eds.; Springer Series in Materials Science, 104; Springer: Berlin/Heidelberg, Germany, 2008. [Google Scholar] [CrossRef]
- Fajzulin, I.; Zhu, X.; Möller, M. Nanoparticulate inorganic UV absorbers: A review. J. Coat. Technol. Res. 2015, 12, 617–632. [Google Scholar] [CrossRef]
- Triboulet, R. Growth of ZnO bulk crystals: A review. Prog. Cryst. Growth Charact. Mater. 2014, 60, 1–14. [Google Scholar] [CrossRef]
- Waag, A. Growth, Springer Series in Materials Science 120 Zinc Oxide; Springer: Berlin/Heidelberg, Germany, 2010; Chapter 3; pp. 39–76. [Google Scholar]
- Ohshima, E.; Ogino, H.; Niikura, I.; Maeda, K.; Sato, M.; Ito, M.; Fukuda, T. Growth of the 2-in-size bulk ZnO single crystals by the hydrothermal method. J. Cryst. Growth 2004, 260, 166–170. [Google Scholar] [CrossRef]
- Ara’ujo Junior, E.A.; Nobre, F.X.; da Silva Sousa, G.; Cavalcante, L.S.; de Morais Chaves Santos, M.R.; Souza, F.L.; de Mato, J.M.E. Synthesis, growth mechanism, optical properties and catalytic activity of ZnO microcrystals obtained via hydrothermal processing. RSC Adv. 2017, 7, 24263–24281. [Google Scholar] [CrossRef]
- Fischer, D.; Zagorac, D.; Schön, J.C. The Presence of Superoxide Ions and Related Dioxygen Species in Zinc Oxide—A Structural Characterization by In-Situ Raman Spectroscopy. J. Raman Spectrosc. 2022, 53, 2137–2146. [Google Scholar] [CrossRef]
- Schön, J.C.; Fischer, D. Thin Films and Monolayers—Prediction, Modeling, and Experiments. J. Innov. Mater. Extr. Cond. 2023, 4, 52–76. [Google Scholar]
- Wolf, N.R.; Jaffe, A.; Slavney, A.H.; Mao, W.L.; Leppert, L.; Karunadasa, H.I. Tuning Defects in a Halide Double Perovskite with Pressure. J. Am. Chem. Soc. 2022, 144, 20763–20772. [Google Scholar] [CrossRef] [PubMed]
- Yan, X.; Dong, H.; Li, Y.; Lin, C.; Park, C.; He, D.; Yang, W. Phase transition induced strain in ZnO under high pressure. Sci. Rep. 2016, 6, 24958. [Google Scholar] [CrossRef]
- Thyr, J.; Österland, L.; Edvinsson, T. Polarized and non-polarized Raman spectroscopy of ZnO crystals: Method for determination of crystal growth and crystal plane orientation for nanomaterials. J. Raman Spectrosc. 2021, 52, 1395–1405. [Google Scholar] [CrossRef]
- Dovesi, R.; Erba, A.; Orlando, R.; Zicovich-Wilson, C.M.; Civalleri, B.; Maschio, L.; Rérat, M.; Casassa, S.; Baima, J.; Salustro, S.; et al. Quantum-mechanical condensed matter simulations with CRYSTAL. WIREs Comput. Mol. Sci. 2018, 8, e1360. [Google Scholar] [CrossRef]
- Hundt, R. KPLOT: A Program for Plotting and Analysing Crystal Structures; Technicum Scientific Publishing: Stuttgart, Germany, 2016. [Google Scholar]
- Pascale, F.; Zicovich-Wilson, C.M.; Gejo, F.L.; Civalleri, B.; Orlando, R.; Dovesi, R. The calculation of the vibrational frequencies of crystalline compounds and its implementation in the CRYSTAL code. J. Comput. Chem. 2004, 25, 888–897. [Google Scholar] [CrossRef] [PubMed]
- Ferrero, M.; Rerat, M.; Orlando, R.; Dovesi, R.; Bush, I.J. Coupled perturbed Kohn-Sham calculation of static polarizabilities of periodic compounds. J. Phys. Conf. Series 2008, 117, 012016. [Google Scholar] [CrossRef]
- Maschio, L.; Kirtman, B.; Rérat, M.; Orlando, R.; Dovesi, R. Ab initio analytical Raman intensities for periodic systems through a coupled perturbed Hartree-Fock/Kohn-Sham method in an atomic orbital basis. I. Theory. J. Chem. Phys. 2013, 139, 164101. [Google Scholar] [CrossRef]
- Maschio, L.; Kirtman, B.; Rérat, M.; Orlando, R.; Dovesi, R. Ab initio analytical Raman intensities for periodic systems through a coupled perturbed Hartree-Fock/Kohn-Sham method in an atomic orbital basis. II. Validation and comparison with experiments. J. Chem. Phys. 2013, 139, 164102. [Google Scholar] [CrossRef]
- Becke, A.D. Density-functional thermochemistry. III. The role of exact exchange. J. Chem. Phys. 1993, 98, 5648–5652. [Google Scholar] [CrossRef]
- Perdew, J.P.; Burke, K.; Ernzerhof, M. Generalized Gradient Approximation Made Simple. Phys. Rev. Lett. 1996, 77, 3865–3868. [Google Scholar] [CrossRef]
- Fischer, D.; Zagorac, D.; Küster, K.; Schön, J.C. Synthesis of Two Structurally Different MgO Films Containing Dioxygen Species: Dioxygen Embedded at Grain Boundaries, and as Components of a Superfilled Rock Salt Structure. Coatings 2024, 14, 1563. [Google Scholar] [CrossRef]
- Zagorac, D.; Schön, J.C.; Zagorac, J.; Jansen, M. Prediction of structure candidates for zinc oxide as a function of pressure and investigation of their electronic properties. Phys. Rev. B 2014, 89, 075201. [Google Scholar] [CrossRef]
- Arguello, C.A.; Rousseau, D.L.; Porto, S.P.S. First-Order Raman Effect in Wurtzite-Type Crystals. Phys. Rev. 1969, 181, 1351–1363. [Google Scholar] [CrossRef]
- Daman, T.C.; Porto, S.P.S.; Tell, B. Raman Effect in Zinc Oxide. Phys. Rev. 1966, 142, 570–574. [Google Scholar] [CrossRef]
- Cuscó, R.; Alarcón-Lladó, E.; Ibáñez, J.; Artús, L.; Jiménez, J.; Wang, B.; Callahan, M.J. Temperature dependence of Raman scattering in ZnO. Phys. Rev. B 2007, 75, 165202. [Google Scholar] [CrossRef]
- Kumar, S.P.; Kumar, T.S.; Kaur, H.; Kumar, A.; Kumar, A. Optimizing photocatalysis: Tuning europium concentration in zinc oxide nanoparticles for superior performance. Phys. B 2025, 697, 416699. [Google Scholar]
- Knust, S.; Ruhm, L.; Kuhlmann, A.; Meinderink, D.; Bürger, J.; Lindner, J.K.N.; de los Arcos de Pedro, M.T.; Grundmeier, G. In situ backside Raman spectroscopy of zinc oxide nanorods in an atmospheric-pressure dielectric barrier discharge plasma. J. Raman Spectrosc. 2021, 52, 1237–1245. [Google Scholar] [CrossRef]
- Vedam, K.; Davis, T.A. Pressure Dependence of the Refractive Indices of the Hexagonal Crystals Beryl, α-CdS, α-ZnS, and ZnO. Phys. Rev. 1969, 181, 1196–1200. [Google Scholar] [CrossRef]
- Granville, S.; Meyer, C.; Preston, A.R.H.; Ludbrook, B.M.; Ruck, B.J.; Trodahl, H.J.; Paudel, T.R.; Lambrecht, W.R.L. Vibrational properties of rare-earth nitrides: Raman spectra and theory. Phys. Rev. B 2009, 79, 054301. [Google Scholar] [CrossRef]
- Kihara, K.; Donnay, G. Anharmonic Thermal Vibrations in ZnO. Can. Mineral. 1985, 23, 647–654. [Google Scholar]
- Sowaa, H.; Ahsbahsa, H. High-pressure X-ray investigation of zincite ZnO single crystals using diamond anvils with an improved shape. J. Appl. Cryst. 2006, 39, 169–175. [Google Scholar] [CrossRef]
- Decremps, F.; Pellicer-Porres, J.; Saitta, A.M.; Chervin, J.-C.; Polian, A. High-pressure Raman spectroscopy study of wurtzite ZnO. Phys. Rev. B 2002, 65, 092101. [Google Scholar] [CrossRef]
- Giannakoudakis, D.A.; Florent, M.; Wallace, R.; Secor, J.; Karwacki, C.; Bandosz, T.J. Zinc peroxide nanoparticles: Surface, chemical and optical properties and the effect of thermal treatment on the detoxification of mustard gas. Appl. Catal. B 2018, 226, 429–440. [Google Scholar] [CrossRef]
- Bösch, M.; Känzig, W. Optische Eigenschaften und Elektronische Struktur von Alkali-Hyperoxide-Kristallen. Helv. Phys. Acta 1975, 48, 743–785. [Google Scholar]
- Lucazeau, G. Effect of pressure and temperature on Raman spectra of solids: Anharmonicity. J. Raman Spectrosc. 2003, 34, 478–496. [Google Scholar] [CrossRef]
- Serrano, J.; Romero, A.H.; Manjon, F.J.; Lauck, R.; Cardona, M.; Rubio, A. Pressure dependence of the lattice dynamics of ZnO: An ab initio approach. Phys. Rev. B 2004, 69, 094306. [Google Scholar] [CrossRef]
- Blunt, F.J.; Hendra, P.J.; Mackenzie, J.R. The Laser Raman Spectra of Salts containing the Anions O2− and O22−. J. Chem. Soc. D 1969, 242, 278–279. [Google Scholar] [CrossRef]
- Radjenovic, P.M.; Hardwick, L.J. Evaluating chemical bonding in dioxides for the development of metal–oxygen batteries: Vibrational spectroscopic trends of dioxygenyls, dioxygen, superoxides and peroxides. Phys. Chem. Chem. Phys. 2019, 21, 1552–1563. [Google Scholar] [CrossRef] [PubMed]
- Erhart, P.; Albe, K.; Klein, A. First-principles study of intrinsic point defects in ZnO: Role of band structure, volume relaxation, and finite-size effects. Phys. Rev. B 2006, 73, 205203. [Google Scholar] [CrossRef]
- Lee, E.-C.; Kim, Y.-S.; Jin, Y.-G.; Chang, K.J. Compensation mechanism for N acceptors in ZnO. Phys. Rev. B 2001, 64, 085120. [Google Scholar] [CrossRef]
- Limpijumnong, S.; Li, X.; Wei, S.-H.; Zhang, S.B. Substitutional diatomic molecules NO, NC, CO, N2, and O2: Their vibrational frequencies and effects on doping of ZnO. Appl. Phys. Lett. 2005, 86, 211910. [Google Scholar] [CrossRef]
- Ayoub, I.; Kumar, V.; Abolhassani, R.; Sehgal, R.; Sharma, V.; Sehgal, R.; Swart, H.C.; Mishra, Y.K. Advances in ZnO: Manipulation of defects for enhancing their technological potentials. Nanotechnol. Rev. 2022, 11, 575–619. [Google Scholar] [CrossRef]
- Petukhov, V.; Bakin, A.; El-Shaer, A.-H.; Mofor, A.-C.; Waag, A. Etch-Pit Density Investigation on Both Polar Faces of ZnO Substrates, Electrochem. Solid-State Lett. 2007, 10, H357. [Google Scholar] [CrossRef]
- Demyanets, L.N.; Lyutin, V. Status of hydrothermal growth of bulk ZnO: Latest issues and advantages. J. Cryst. Growth 2008, 310, 993–999. [Google Scholar] [CrossRef]
- Peng, C.-X.; Wang, K.-F.; Zhang, Y.; Guo, F.-L.; Weng, H.-M.; Ye, B.-J. Evolution of native point defects in ZnO bulk probed by positron annihilation spectroscopy. Chin. Phys. B 2009, 18, 2072. [Google Scholar]
- Park, J.; Rim, Y.S.; Senanayake, P.; Wu, J.; Streit, D. Electrical Defect State Distribution in Single Crystal ZnO Schottky Barrier Diodes. Coatings 2020, 10, 206. [Google Scholar] [CrossRef]
- Scheffler, L.; Kolkovsky, V.L.; Lavrov, E.V.; Weber, J. Deep level transient spectroscopy studies of n-type ZnO single crystals grown by different techniques. J. Phys. Condens. Matter. 2011, 23, 334208. [Google Scholar] [CrossRef]
- Mohseni, H.; Mensah, B.A.; Gupta, N.; Srinivasan, S.G.; Scharf, T.W. Exceptional Friction Mitigation via Subsurface Plastic Shear in Defective Nanocrystalline Ceramics. Mater. Res. Lett. 2015, 3, 23–29. [Google Scholar] [CrossRef]
- Bradby, J.E.; Kucheyev, S.O.; Williams, J.S.; Jagadish, C.; Swain, M.V.; Munroe, P.; Phillips, M.R. Contact-induced defect propagation in ZnO. Appl. Phys. Lett. 2002, 80, 4537–4539. [Google Scholar] [CrossRef]
- Millot, M.; Tena-Zaera, R.; Munoz-Sanjose, V.; Broto, J.-M.; Gonzalez, J. Anharmonic effects in ZnO optical phonons probed by Raman spectroscopy. Appl. Phys. Lett. 2010, 96, 152103. [Google Scholar] [CrossRef]
- Morell, G.; Perez, W.; Ching-Prado, E.; Katiyar, R.S. Anharmonic interactions in beryllium oxide. Phys. Rev. B 1996, 53, 5388–5395. [Google Scholar] [CrossRef]
- Chen, Y.; Turiansky, M.E.; Van de Walle, C.G. First-principles study of quantum defect candidates in beryllium oxide. Phys. Rev. B 2022, 106, 174113. [Google Scholar] [CrossRef]
- Downs, J.W.; Ross, F.K.; Gibbs, G.V. The effects of extinction on the refined structural parameters of crystalline BeO: A neutron and γ-ray diffraction study. Acta Cryst. B 1985, 41, 425–431. [Google Scholar] [CrossRef]
- Kucheyev, S.O.; Bradby, J.E.; Williams, J.S.; Jagadish, C.; Swain, M.V. Mechanical deformation of single-crystal ZnO. Appl. Phys. Lett. 2002, 80, 956–958. [Google Scholar] [CrossRef]
- Wood, G.C.; Hodgkiess, T. The Hardness of Oxides at ambient Temperatures. Werkst. Korrosion 1972, 23, 766–773. [Google Scholar] [CrossRef]
- Khan, M.Y.; Brown, L.M.; Chaudhri, M.M. The effect of crystal orientation on the indentation cracking and hardness of MgO single crystals. J. Phys. D Appl. Phys. 1992, 25, A257–A265. [Google Scholar] [CrossRef]
- Maeda, K.; Sato, M.; Niikura, I.; Fukuda, T. Growth of 2 inch ZnO bulk single crystal by the hydrothermal method. Semicond. Sci. Technol. 2005, 20, S49. [Google Scholar] [CrossRef]
- Fischer, D.; Zagorac, D.; Schön, J.C. Fundamental insight into the formation of the zinc oxide crystal structure. Thin Solid Films 2023, 782, 140017. [Google Scholar] [CrossRef]
- Fischer, D.; Zagorac, D. UV-VIS Transmittance and Band Gap of Zinc Oxide Films Prepared by Femtosecond Pulse-Laser-Deposition. J. Innov. Mater. Extr. Cond. 2024, 5, 136–143. [Google Scholar]
- Jungwirth, N.R.; Pai, Y.Y.; Chang, H.S.; MacQuarrie, E.R.; Nguyen, K.X.; Fuchs, G.D. A single-molecule approach to ZnO defect studies: Single photons and single defects. Appl. Phys. 2014, 116, 043509. [Google Scholar] [CrossRef]
- Vyas, S. A Short Review on Properties and Applications of Zinc Oxide Based Thin Films and Devices. Johns. Matthey Technol. Rev. 2020, 64, 202–218. [Google Scholar] [CrossRef]
- Constantinoiu, I.; Viespe, C. ZnO Metal Oxide Semiconductor in Surface Acoustic Wave Sensors: A Review. Sensors 2020, 20, 5118. [Google Scholar] [CrossRef] [PubMed]
- Lushchik, A.; Kuzovkov, V.N.; Kotomin, E.A.; Prieditis, G.; Seeman, V.; Shablonin, E.; Vasil’chenko, E.; Popov, A.I. Evidence for the formation of two types of oxygen interstitials in neutron-irradiated α-Al2O3 single crystals. Sci. Rep. 2021, 11, 20909. [Google Scholar] [CrossRef] [PubMed]
- Bocharov, D.; Chesnokov, A.; Chikvaidze, G.; Gabrusenoks, J.; Ignatans, R.; Kalendarev, R.; Krack, M.; Kundzins, K.; Kuzmin, A.; Mironova-Ulmane, N.; et al. A comprehensive study of structure and properties of nanocrystalline zinc peroxide. J. Phys. Chem. Solids 2022, 160, 110318. [Google Scholar] [CrossRef]
Disclaimer/Publisher’s Note: The statements, opinions and data contained in all publications are solely those of the individual author(s) and contributor(s) and not of MDPI and/or the editor(s). MDPI and/or the editor(s) disclaim responsibility for any injury to people or property resulting from any ideas, methods, instructions or products referred to in the content. |
© 2025 by the authors. Licensee MDPI, Basel, Switzerland. This article is an open access article distributed under the terms and conditions of the Creative Commons Attribution (CC BY) license (https://creativecommons.org/licenses/by/4.0/).