Article

Further Studies into the Growth of Small Naturally Occurring Three-Dimensional Cracks in Additively Manufactured and Conventionally Built Materials

1
ARC Industrial Transformation Training Centre on Surface Engineering for Advanced Materials, Faculty of Science, Engineering and Technology, Swinburne University of Technology, John Street, Hawthorn, VIC 3122, Australia
2
Centre of Expertise for Structural Mechanics, Department of Mechanical and Aerospace Engineering, Monash University, Clayton, VIC 3800, Australia
3
US Army Research Laboratory, U.S. Army Combat Capabilities Development Command Weapons and Materials Research Directorate, Aberdeen Proving Ground, Aberdeen, MD 21005, USA
4
Solvus Global, 104 Prescott Street, Worcester, MA 01605, USA
5
Rosebank Engineering Australia, 836 Mountain Highway, Bayswater, VIC 315, Australia
*
Author to whom correspondence should be addressed.
Crystals 2025, 15(6), 544; https://doi.org/10.3390/cryst15060544
Submission received: 25 April 2025 / Revised: 2 June 2025 / Accepted: 3 June 2025 / Published: 6 June 2025
(This article belongs to the Section Inorganic Crystalline Materials)

Abstract

MIL-STD-1530D and the United States Air Force (USAF) Structures Bulletin EZ-SB-19-01 require an ability to predict the growth of naturally occurring three-dimensional cracks with crack depths equal to what they term an equivalent initial damage size (EIDS) of 0.254 mm. This requirement holds for both additively manufactured and conventionally built parts. The authors have previously presented examples of how to perform such predictions for additively manufactured (AM) Ti-6Al-4V; wire arc additively manufactured (WAAM) 18Ni 250 Maraging steel; and Boeing Space, Intelligence and Weapon Systems laser bed powder fusion (LPBF) Scalmalloy®, which is an additively manufactured Aluminium-Scandium-Mg alloy, using the Hartman-Schijve crack growth equation. In these studies, the constants used were as determined from ASTM E647 standard tests on long cracks, and the fatigue threshold term in the Hartman-Schijve equation was set to a small value (namely, 0.1 MPa √m). This paper illustrates how this approach can also be used to predict the growth of naturally occurring three-dimensional cracks in WAAM CP-Ti (commercially pure titanium) specimens built by Solvus Global as well as in WAAM-built Inconel 718. As in the prior studies mentioned above, the constants used in this analysis were taken from prior studies into the growth of long cracks in conventionally manufactured CP-Ti and in AM Inconel 718, and the fatigue threshold term in these analyses was set to 0.1 MPa √m. These studies are complemented via a prediction of the growth of naturally occurring three-dimensional cracks in conventionally built M300 steel.

1. Introduction

Since the driving force behind this paper was to illustrate how to perform the linear elastic fracture mechanics crack growth predictions that are needed to certify limited life additively manufactured parts for military fixed and rotatory wing aircraft and drones, let us begin by introducing the relevant certification requirements. First of all, it should be noted that USAF Structures Bulletin EZ-19-10 [1] and MILSTD-1530Dc [2] explain that the airworthiness certification of both AM and conventionally manufactured aerospace parts requires the ability to predict the growth of naturally occurring three-dimensional cracks, with crack depths equal to what these references [1,2] term the minimum size equivalent initial damage size (EIDS) of 0.254 mm, in a fashion that is consistent with the “building block” approach delineated in both MIL-STD-1530Dc and the United States (US) Joint Services Specification Guidelines JSSG-2006 [3]. (Section X3.4 of ASTM Standard E647-23 defines a crack as being small if all of its dimensions (i.e., its length/width and depth) are small in comparison to either “a relevant microstructural scale, a continuum mechanics scale, or a physical size scale”.) The NASA Fracture Control Handbook NASA-HDBK-15-10 [4], which addresses traditionally built metals, and NASA-HDBK-5026 [5], which addresses AM parts, mandate the use of the worst-case da/dN versus ΔK curve for the material. Here, a is the crack length/depth; N is the number of cycles; K is the crack tip stress intensity factor; and ΔK = KmaxKmin, where Kmax and Kmin are the maximum and minimum values of K in a cycle.
In the present paper, we focus on the how to use the Hartman-Schijve crack growth equation, as expressed in [6], to obtain reasonable predictions for the crack growth histories associated with naturally occurring three dimensional (3D) cracks. There are several reasons for focusing on the Hartman-Schijve crack growth equation. The first is that references [7,8,9,10,11,12,13,14,15,16] have illustrated how this particular crack growth equation can be used to predict the durability of a wide range of AM materials where failure was due to naturally occurring surface-breaking cracks. Consequently, the precise form of the Hartman-Schijve equation used in this paper is as per [6] and as used in [7,8,9,10,11,12,16,17,18,19,20,21], viz.:
da/dN = D (∆κ)p
where
κ = (∆K − ∆Kthr)/√(1 − Kmax/A)
Here, D and p are material constants, and ΔKthr is the “true” fatigue threshold, by which we mean the value of ΔK that, when substituted into Equation (2), results in the computed value of da/dN being precisely equal to zero. The parameter A is the apparent cyclic fracture toughness. Noting that the value of ΔK associated with a crack growth rate of 10−10 m/cycle is denoted as ∆Kth, it thus follows that ΔKthr is related to ∆Kth via Equation (3):
(∆Kth − ∆Kthr)/√(1 − Kmax/A) = (10−10/D)1/p
An important feature of the studies presented in [6,7,8,10,11,12,17,18,19,20,21] is that with the constants D and p in Equation (1) taken from tests on long cracks in conventionally built specimens and setting the fatigue threshold term ΔKthr to be small, typically in the range 0.1 MPa √m ≤ ΔKthr ≤ 0.3 MPa, √m enabled conservative estimates for the crack growth histories associated with naturally occurring three-dimensional cracks.
Additional reasons for choosing to use Equations (1) and (2) are:
(i)
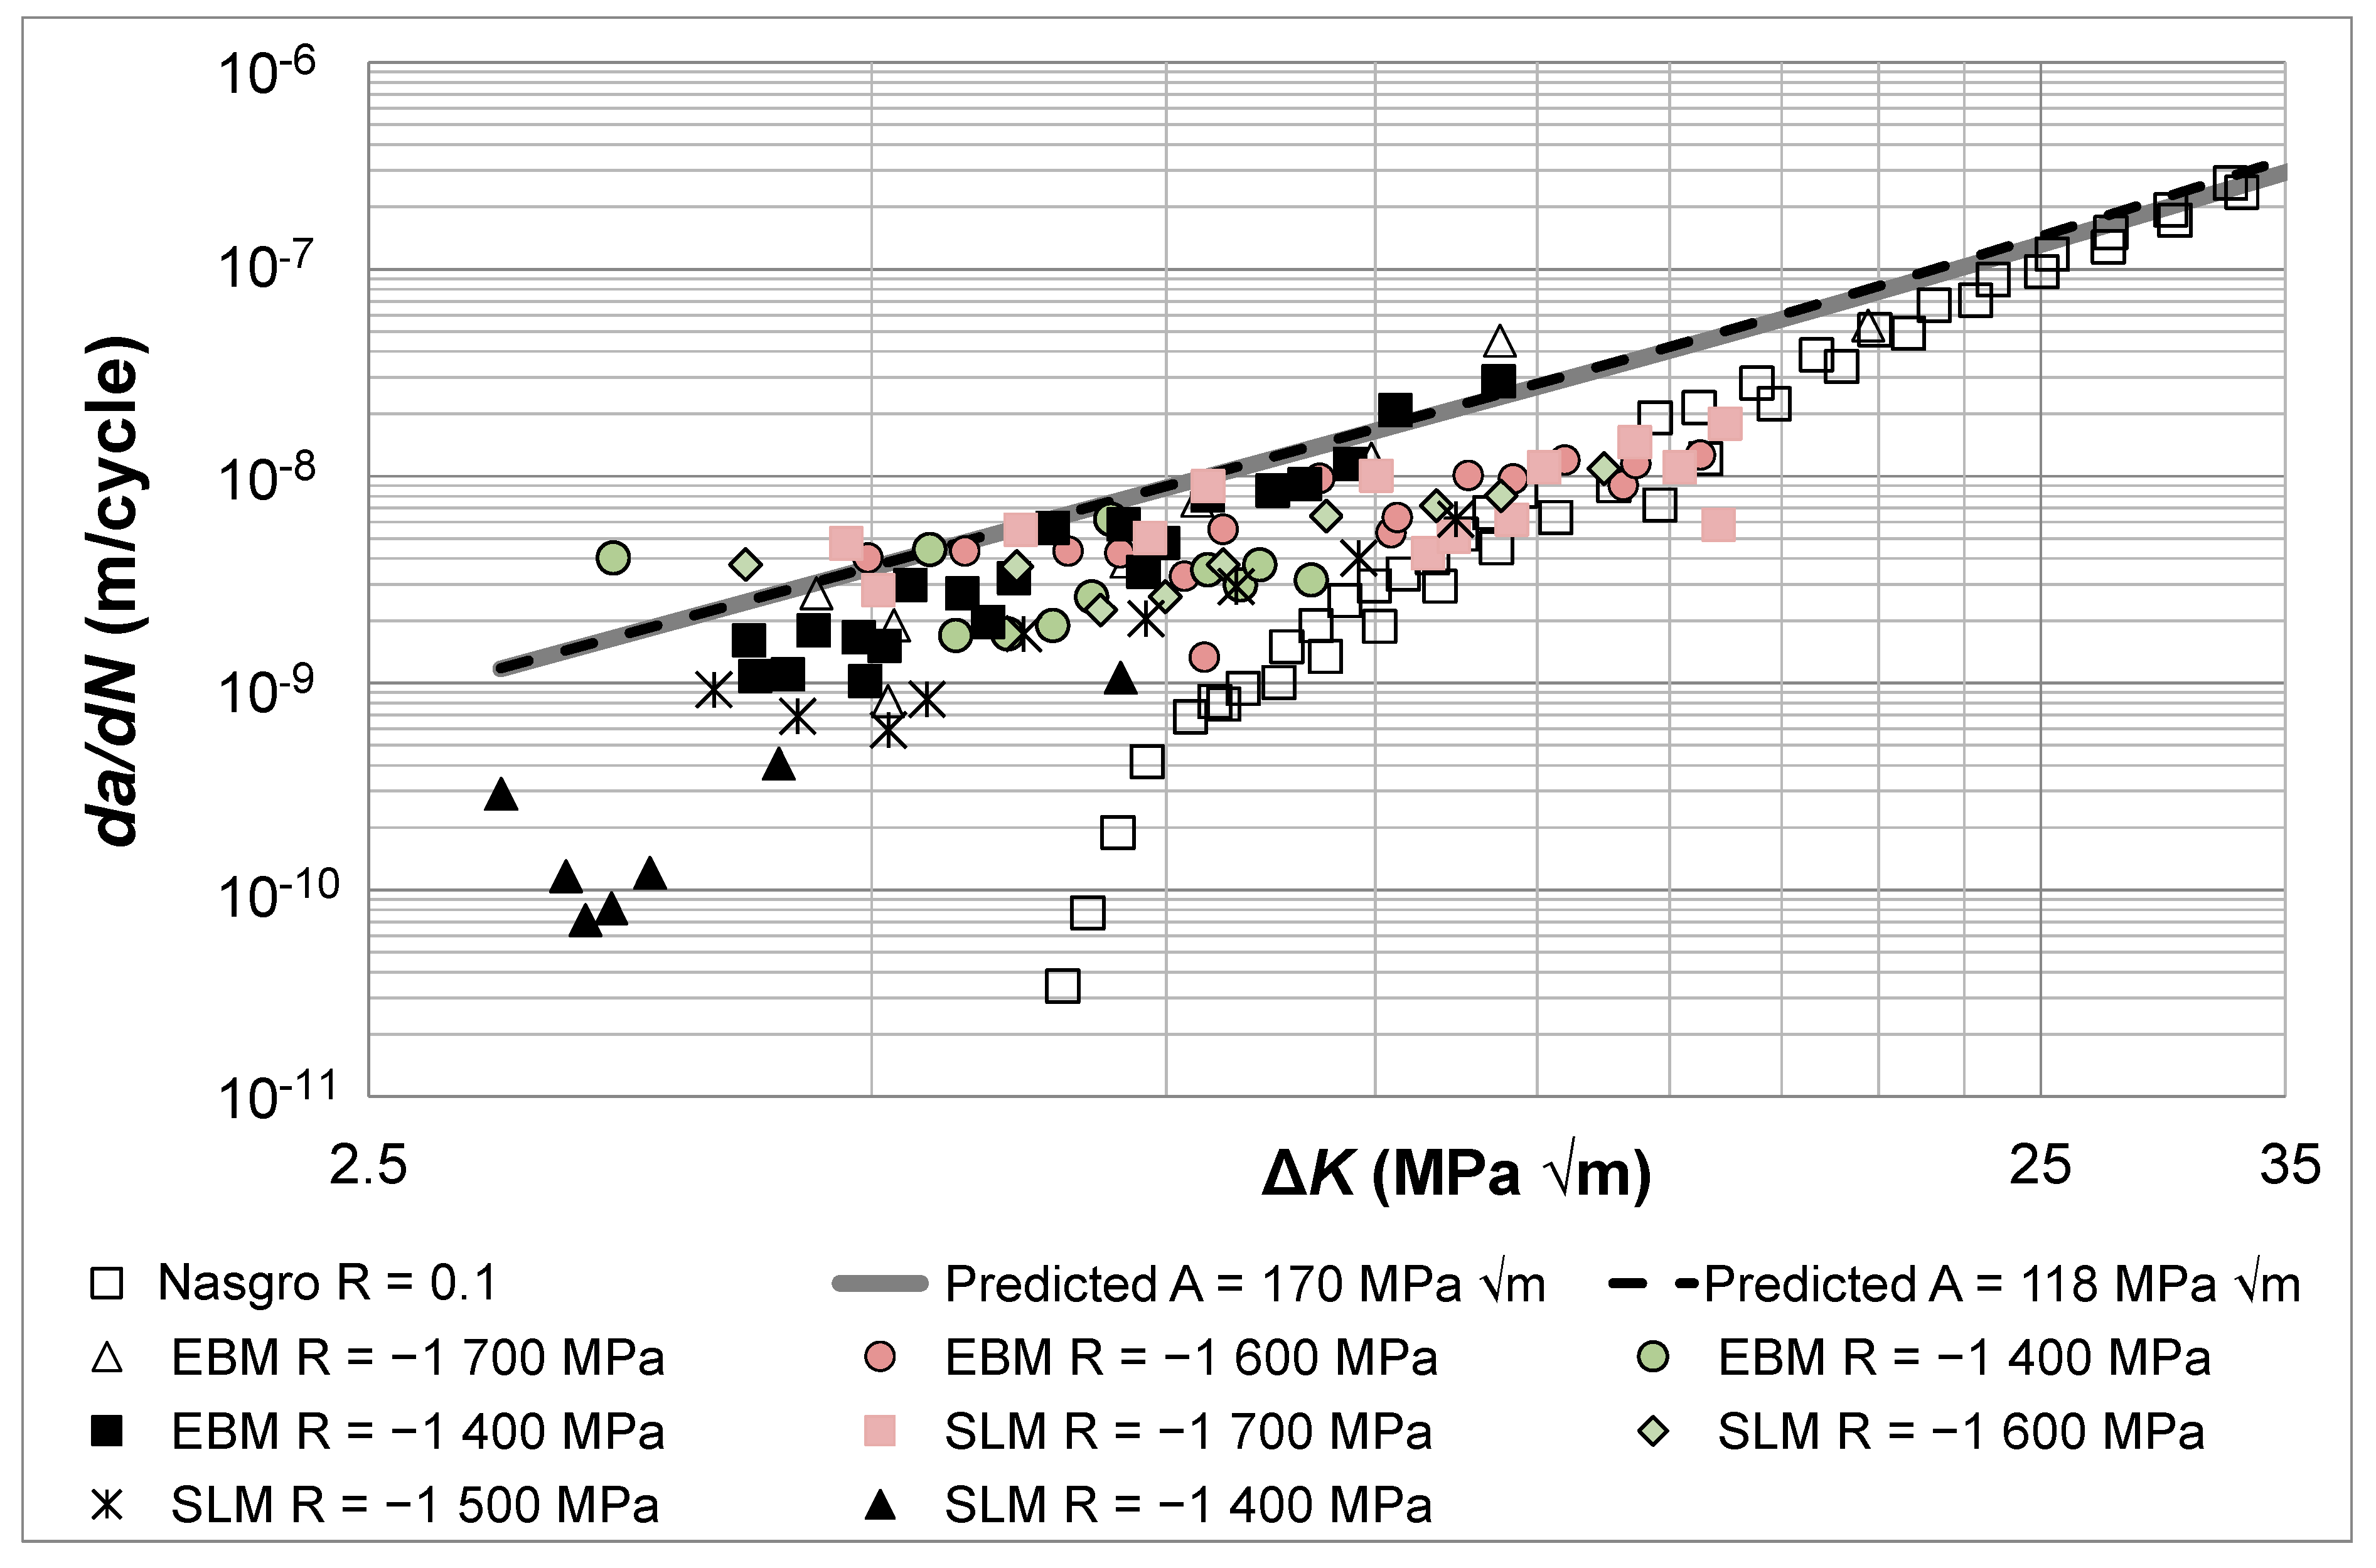
The Hartman-Schijve crack growth equation, i.e., Equations (1) and (2), is unique in that for long cracks in AM materials, it has been shown [22,23,24,25,26,27,28] that the variability in the long crack growth curves due to different build protocols, material anisotropy, material variability and R ratio is often uniquely captured by allowing for the variability in just two fracture mechanics parameters, namely, the fracture toughness (A) and the fatigue threshold term (ΔKthr).
(ii)
References [29,30,31] have shown how the crack growth equation can be used to compute the stress–life curves associated with a range of AM materials.
(iii)
References [27,32] revealed that Equations (1) and (2) could be used to represent the growth of long cracks in a range of AM materials, including the variability in the da/dN versus ∆K curves due to the build process as well to represent the growth of long cracks in cold spray additively manufactured (CSAM) materials and plasma sprayed refractory metals and alloys [33].
(iv)
References [34,35] revealed that Equations (1) and (2) could be used to represent the growth of long cracks in conventionally manufactured non-aerospace steels.
Whilst [8] highlighted the reasons why the author’s previous studies chose to (successfully) use Equations (1) and (2) to predict the growth of naturally occurring 3D cracks rather than using crack closure formulations as used in [36,37], a further clarification of the rationale for this approach is contained in Appendix A. Appendix A is particularly important since it disproves the hypothesis, that was first presented in [37], that the closure corrected da/dN versus ΔKeff curve can be used to give reasonable upper-bound (worst-case) estimates for the small crack da/dN versus ΔK curve. As stated by the Nobel Laureate Enrico Fermi [38], “a result that confirms the hypothesis is merely a measurement. However, a result that is contrary to the hypothesis is a discovery”.
Let us now attempt to summarise both the Introduction to date and the rationale for this paper. First of all, as we have discussed above, the certification of AM parts for military aircraft requires a durability analysis, which in turn requires a linear elastic fracture mechanics analysis using a valid small crack equation. Consequently, to this end, we first reveal that the hypothesis that crack-closure-based approaches can be used to give reasonable upper-bound (worst-case) estimates for the small crack da/dN versus ΔK curve is contradicted by the experimental data contained in the seminal study into the growth of small naturally occurring cracks in the aluminium alloy 2024-T3 [39].
As a result of this discovery, and the need to be able to predict the crack growth history required for a durability analysis, the purpose of this paper is to illustrate how to use the Hartman-Schijve crack growth equation to predict the small crack da/dN versus ΔK curve associated with AM Inconel 718, as well as the growth of naturally occurring 3D cracks in WAAM CP-Ti, and to complement these studies by predicting the growth of naturally occurring 3D cracks in the conventionally built high-strength aerospace steel M300. In the latter two cases, the crack depth histories are comparable with the minimum size EIDS mandated in both MIL-STD-1530Dc and USAF Structures Bulletin EZ-SB-19-10. The Hartman-Schijve crack growth equation is used since, to the best of the authors’ knowledge, no other crack growth equation has yet been shown to be able to predict the crack growth histories associated with the growth of such naturally growing 3D cracks in AM materials.

2. Methods and Materials

This paper addresses the research gap associated with the linear elastic fracture mechanics (LEFM)-based assessment of the growth of naturally occurring 3D cracks in AM aerospace parts and further illustrates this approach by studying the growth of small cracks in the conventionally built high-strength aerospace steel M300.
The rationale for the research program presented in this paper was as follows. We first had to clarify why we used the Hartman-Schijve crack growth equation rather than a crack-closure-based small crack growth equation. We showed that
(a)
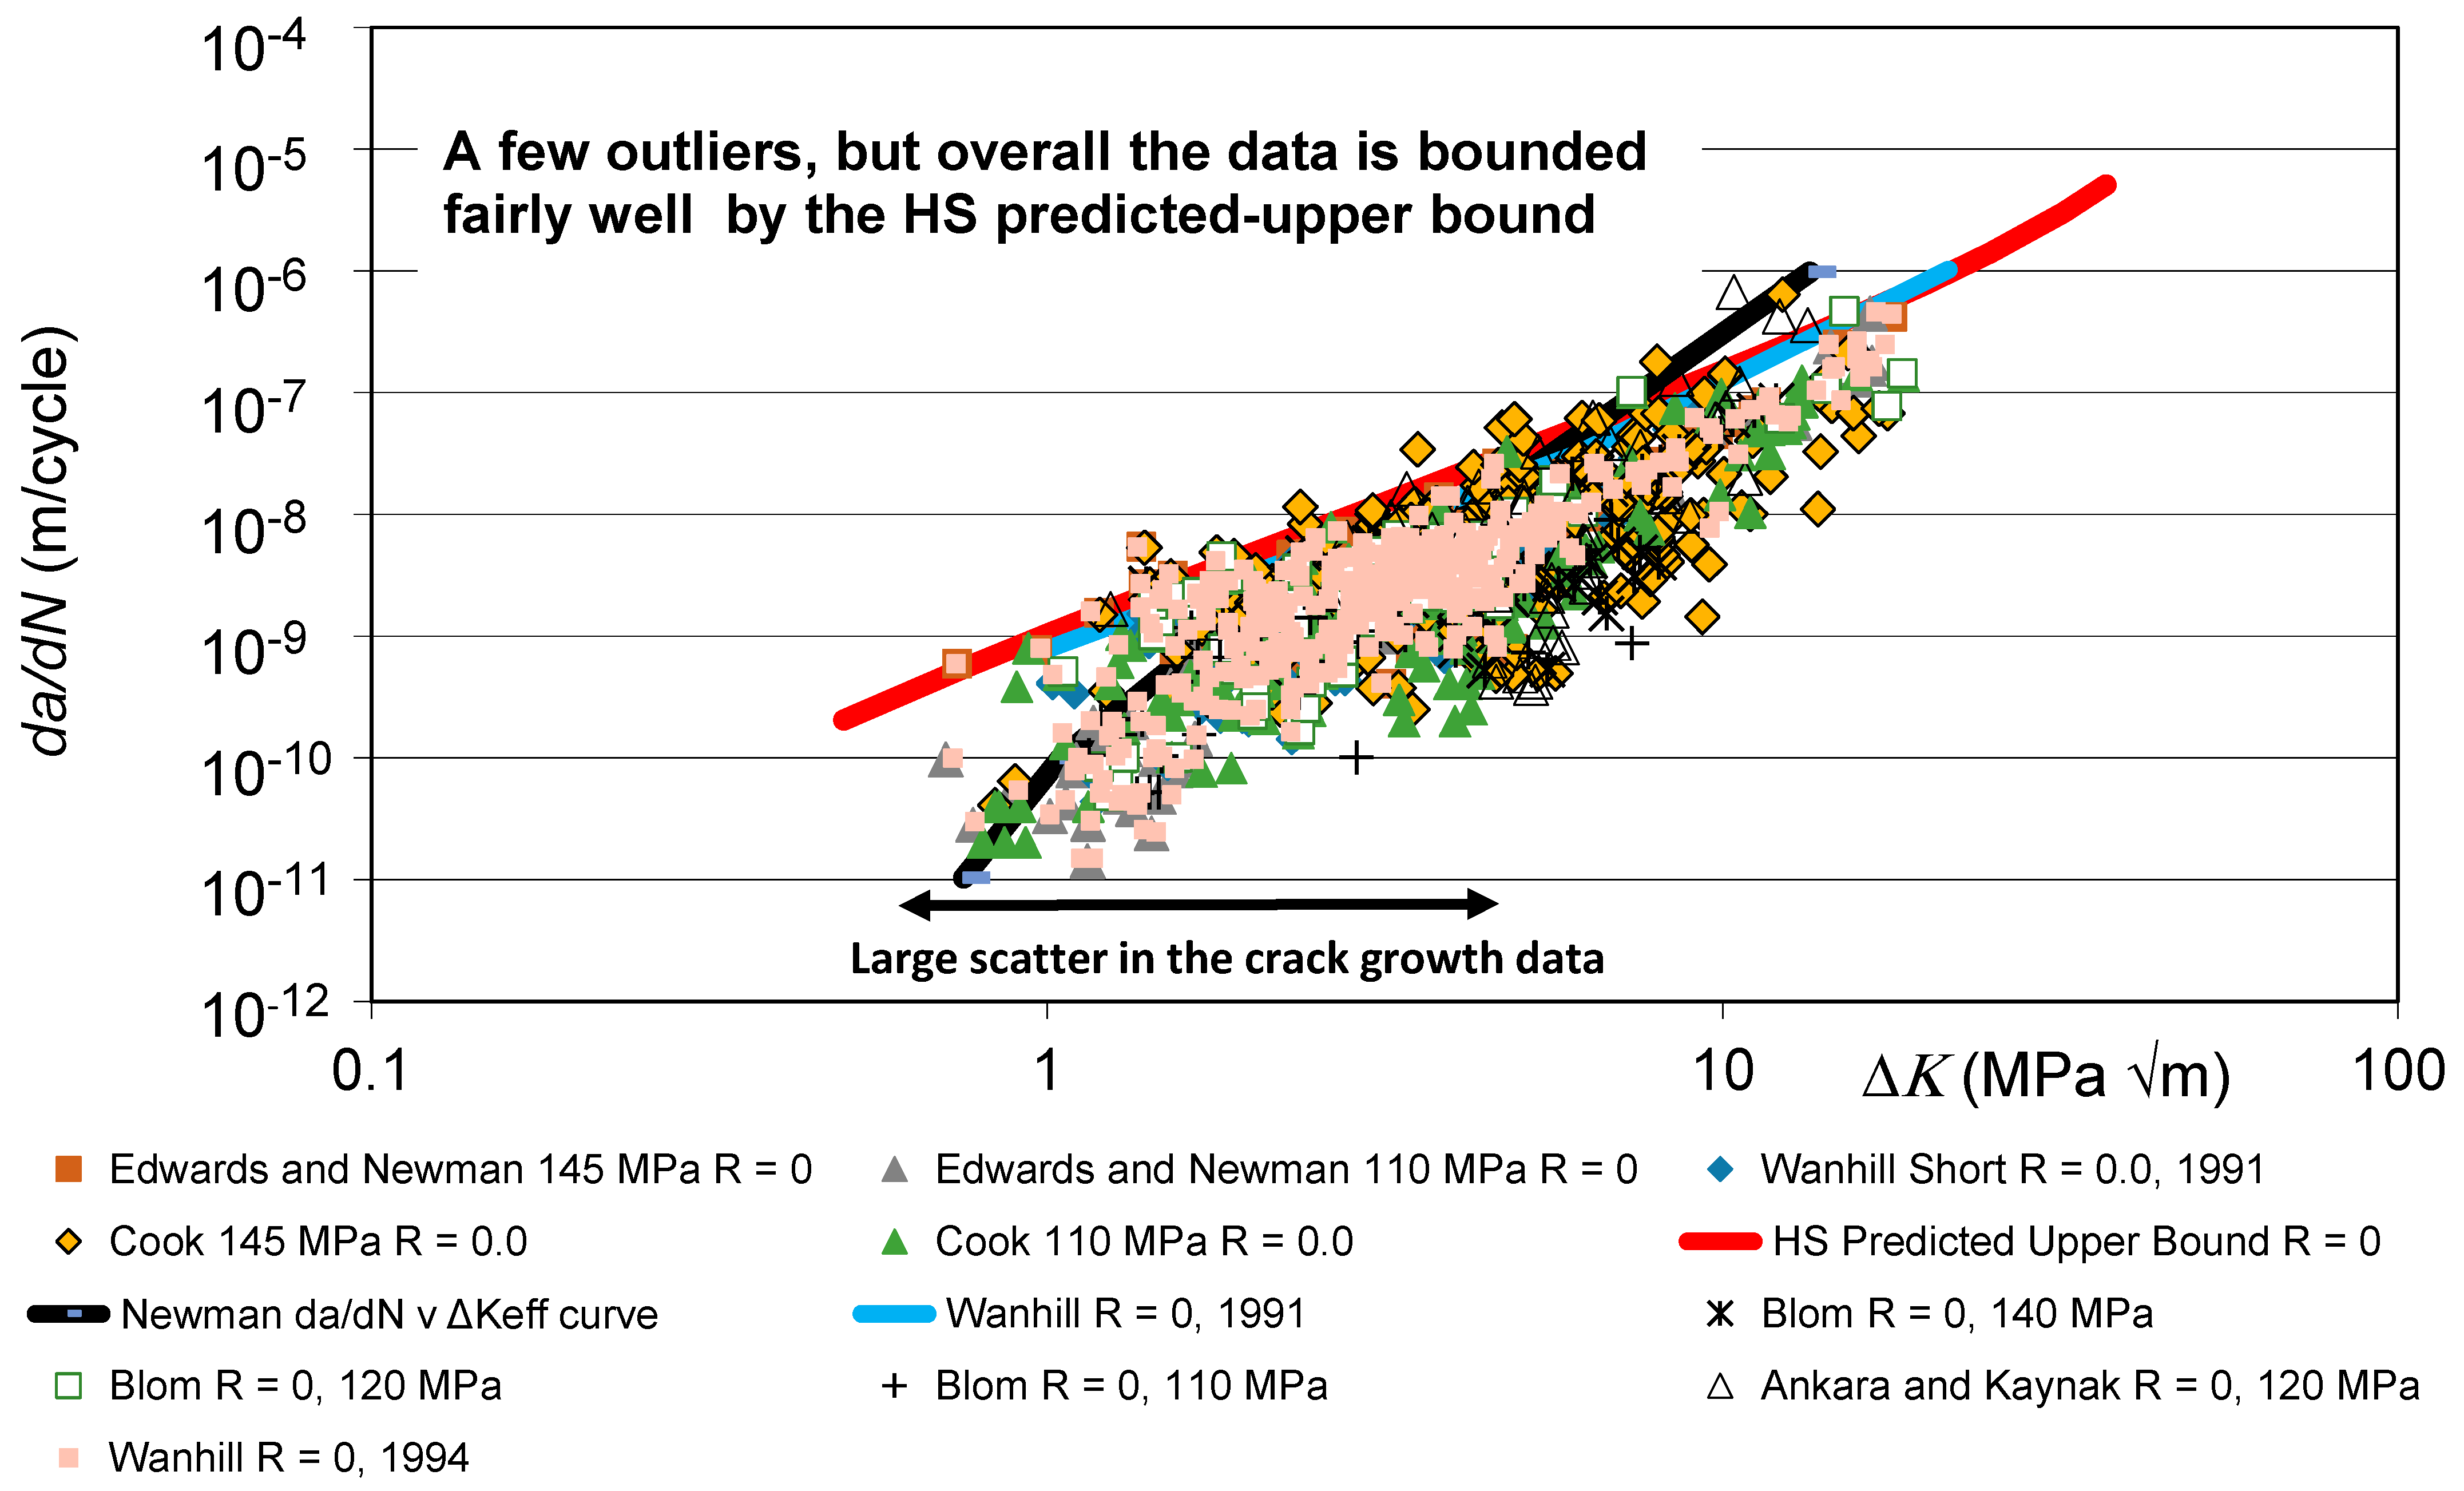
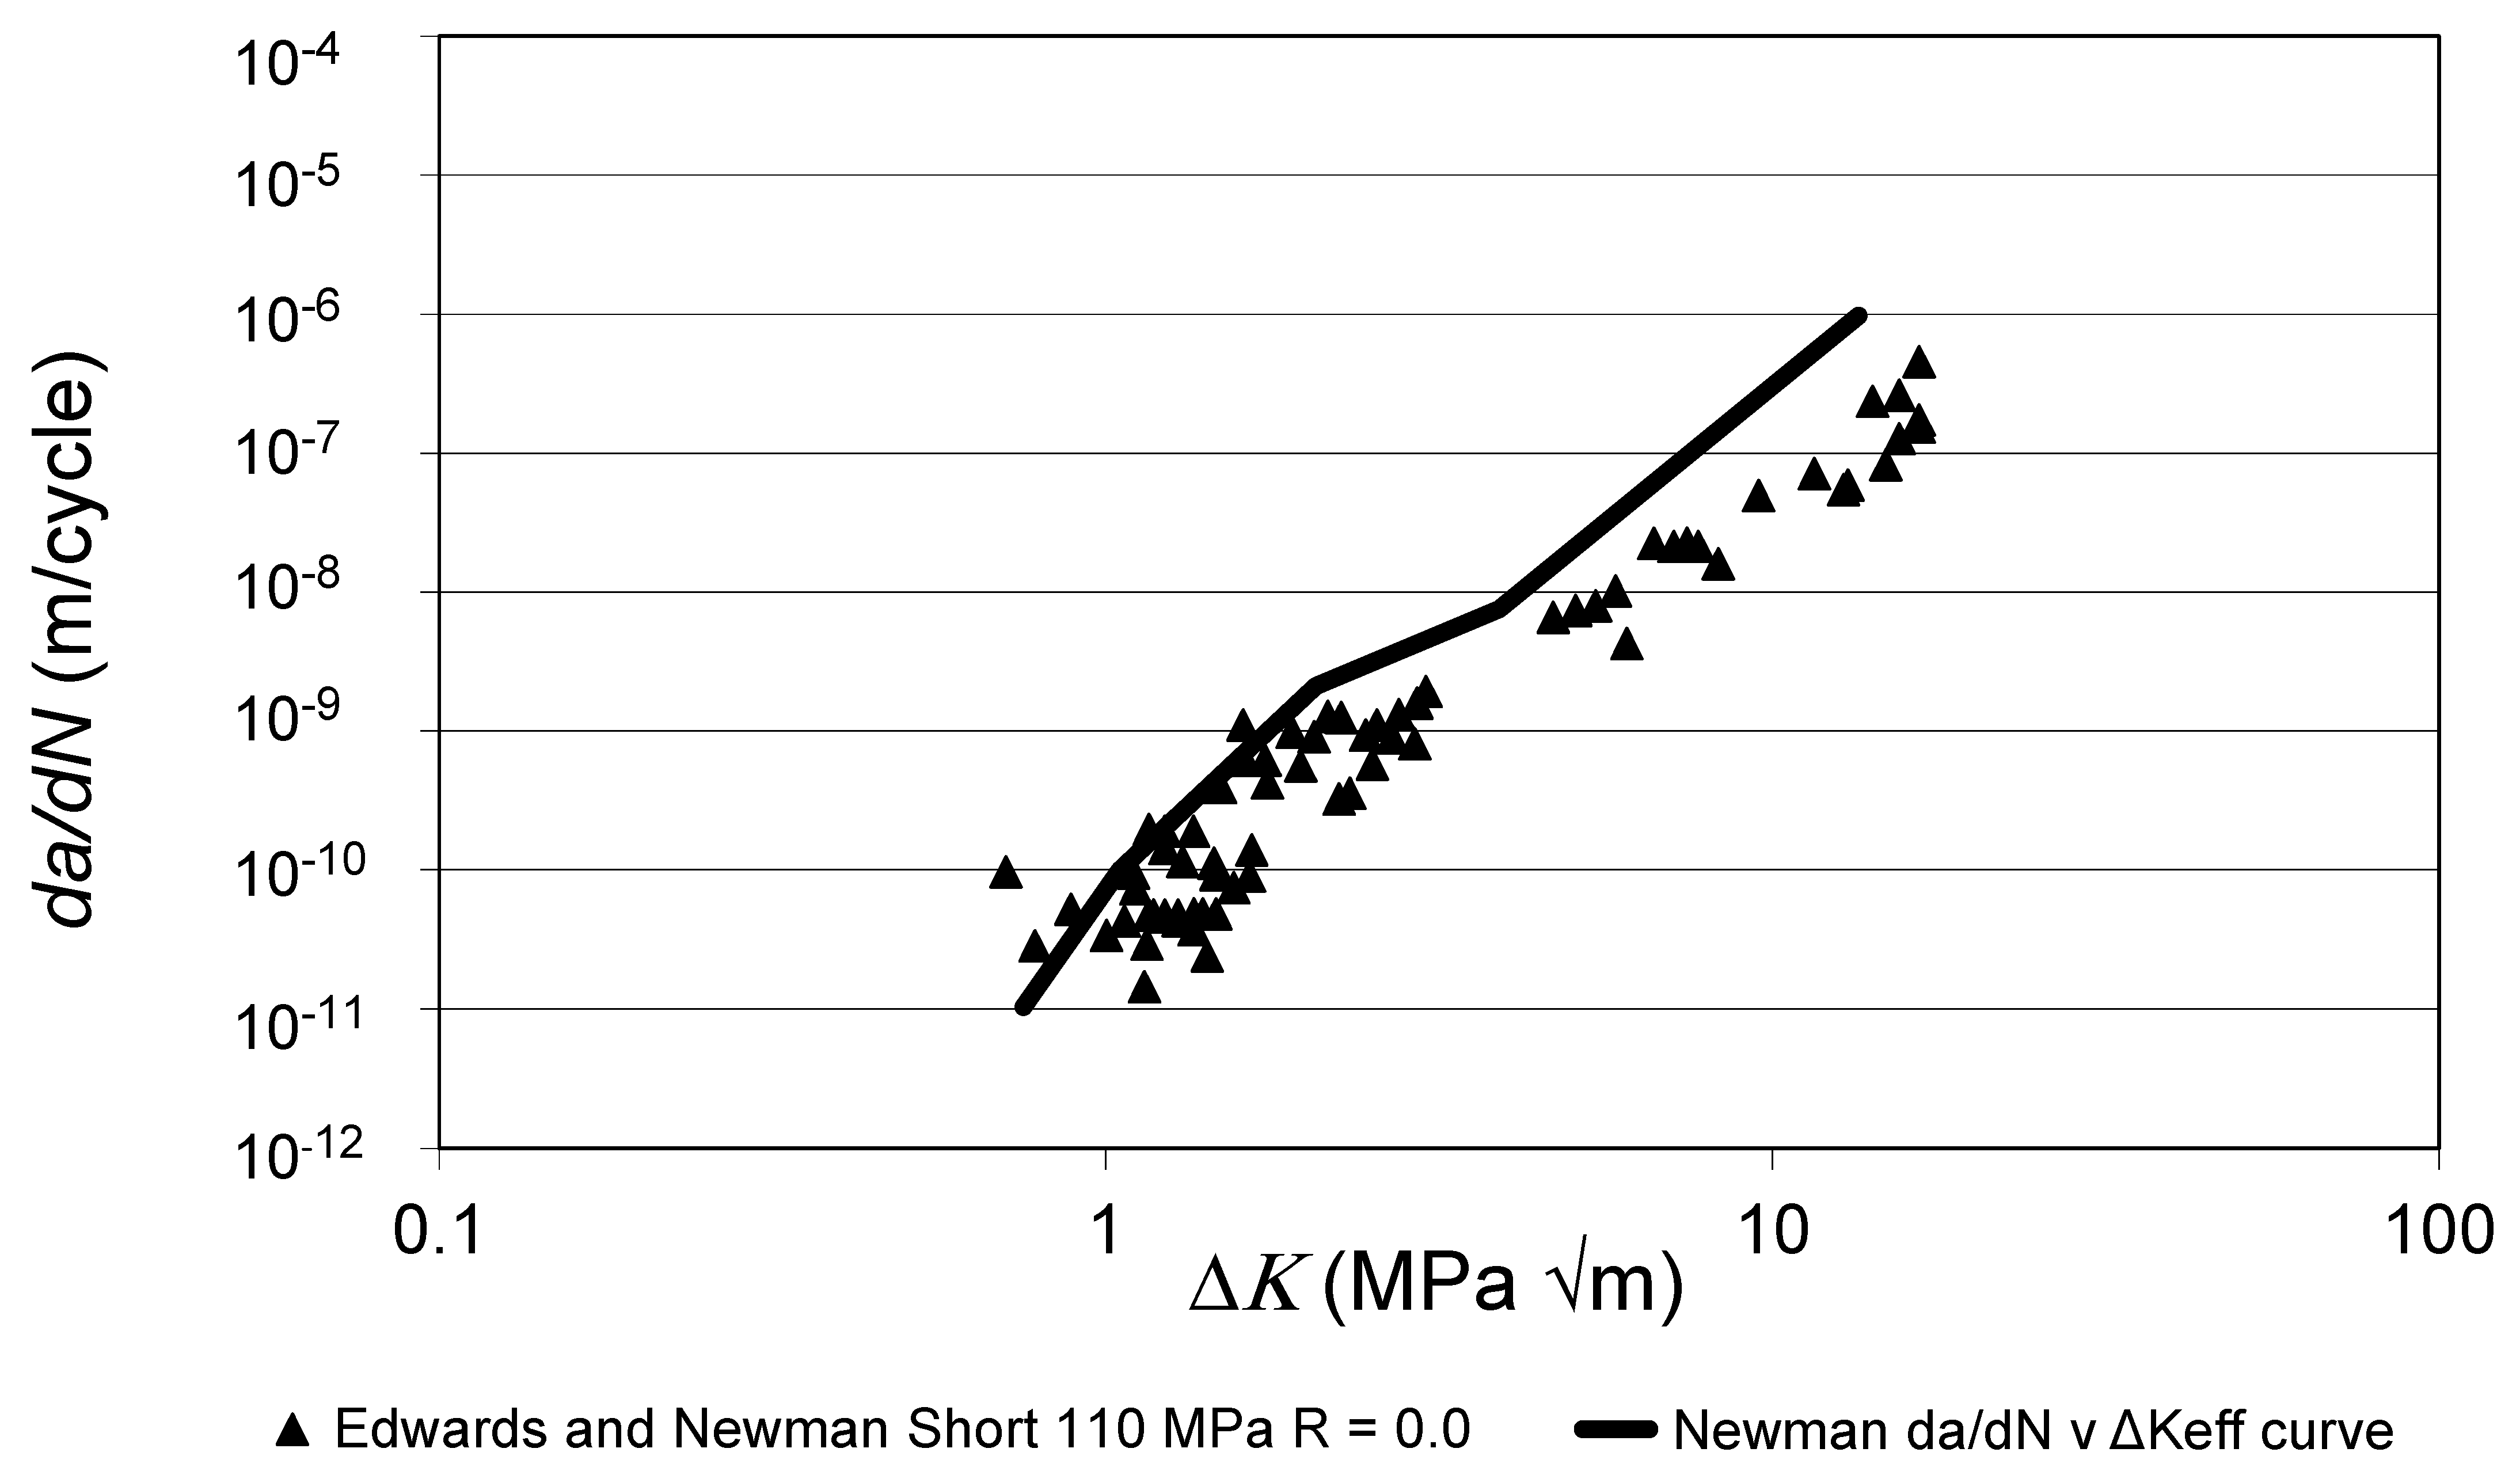
The hypothesis that crack-closure-based approaches can be used to give reasonable upper-bound (worst-case) estimates for the small crack da/dN versus ΔK curve is contradicted by the experimental data given in [39].
(b)
Prior studies into the ability of the Hartman-Schijve equation to predict the crack growth histories associated with the growth of naturally occurring 3D cracks in AM materials had studied laser powder built (LPBF) Scalmalloy, which is an additively manufactured aluminium alloy, with both as-built and machined surfaces, as well as Scalmalloy subjected to prolonged exposure to an ASTM B117-19 5% NaCl salt fog at 35 °C, wire arc additively manufactured (WAAM) 18Ni 250 Maraging steel, and WAAM built Ti-6Al-4V.
(c)
The variability in crack growth in AM materials due to different build protocols, material anisotropy, material variability and R ratio is uniquely captured by allowing for the variability in just two parameters, viz., A and ΔKthr.
Thus, this paper chose to use the Hartman-Schijve equation to examine crack growth in two quite different AM materials. The materials chosen for this study were WAAM-built CP-Ti and AM Inconel 718. AM Inconel 718 was chosen since small crack growth data was available for Inconel 718 that was built using two different AM processes, namely, electron beam melt (EBM) and selective laser beam melt (SLM).
To this end, a fatigue test was first performed on a WAAM-built CP-Ti specimen. The geometry of the test specimen used in this study, which was built by Solvus Global, is shown in Figure 1. The specimen was subjected to repeated load blocks, with each load block consisting of 8000 cycles at R = 0.8 and 300 cycles at R = 0.1. The maximum stress (σmax) in each load block was held constant at 354.6 MPa. (This load spectra enabled the crack growth history to be measured using quantitative fractography.)
Fortunately, Jones et al. [40] established that lthe values of D and p for conventionally built CP-Ti were D = 7 × 10⁻¹⁰ and p = 2, and that the value of A was approximately 90 MPa √m. As such, following the approach used in [7,8,10,11,12,18,40], the threshold term ΔKthr in Equation (2) was set to 0.1 MPa √m. As a result, the crack growth equation used to predict the growth of naturally occurring 3D cracks in this WAAM CP-Ti test was:
da/dN = 7 × 10⁻¹⁰ [(∆K − 0.1)/√(1 − Kmax/90)]2
The crack growth analysis started at a measured size of a0 = 0.640 mm and c0 = 0.631 mm. Here, a is the crack depth, as measured from the upper free surface, and c is half the total (tip-to-tip) surface length (width).
Turning next to the predictions made for the (conventionally manufactured) M300 steel tests, it should be noted that the yield stress and the ultimate strength of the M300 steel tested are given in [41] to be approximately 1600 MPa and 1955 MPa, respectively. Interestingly, the yield stress and ultimate strength of D6ac steel used in the F111 wing pivot fitting lay in the range of 1536 to 1676 MPa and 1816 to 1956 MPa, respectively [42]. Consequently, noting
  • The similarity in the mechanical properties;
  • That, as stated in the US Department of Transportation Federal Highway Administration’s report [43], the fatigue performance of many steels are sufficiently similar that it is unnecessary to generate data for every type of structural steel;
  • The fact that, as shown in [17], the da/dN versus ΔK curves associated with many steels, which have a wide range of chemical compositions, hardness, microstructure and yield stresses, are very similar;
The predictions presented in this paper used the crack growth equation given in [6] for the growth of naturally occurring 3D cracks in the F-111 D6ac wing pivot fitting, viz.:
da/dN = 2 × 10⁻¹⁰ [(∆K − 0.1)/√(1 − Kmax/220)]2
Armed with a first estimate for the Hartman-Schijve equation for this material, three M300 dogbone-shaped specimens were tested, and Equation (5), which as remarked above was taken from [6], was used to predict crack growth in each of these three tests. These tests used two different repeated block spectra. The geometry of these test specimens is as shown in Figure 2. To facilitate crack nucleation and subsequent crack growth, the central region of the upper surface of the specimen contained an array of thirty-eight (38) etch pits that were separated by a distance of approximately 6.5 mm. These etch pits were created using a Modified Fry’s reagent. Here, 225 mL of the reagent consisted of 1 gm of copper chloride dihydrate, 150 mL of distilled water, 50 mL of concentrated HCl (10 M, 37%), and 25 mL of HNO3 (69%, 16 M). The depths of the resultant etch pits ranged from (approximately) 35 µm to (approximately) 100 µm deep.
At this point in the paper, it should be noted that, at each stage in the crack growth analyses of the various WAAM CP-Ti and M-300 steel specimens, the stress intensity factors around the crack front were determined as in prior studies [7,8,11] into the growth of natural 3D cracks. This approach uses the three-dimensional finite element alternating approach, which is described in detail in [44,45,46,47,48] and which, as illustrated in [7,8,11], has been shown to accurately compute the crack growth histories of LPBF Scalmalloy and WAAM 18Ni 250 Maraging steel. (In all cases, the boundary conditions applied was a remote uniform stress at the loaded surfaces with all other surfaces free.) The values of the stress intensity factors computed for a given crack shape were then used in the associated crack growth equation to compute the change in the shape of the crack at any given cycle. This enabled the new crack shape to be determined. An advantage of this approach is that the cracks are not modelled explicitly and, regardless of the shape of the crack, only the uncracked finite element model is needed. More detailed discussions on the advantages of using the finite element alternating approach for modelling crack growth in complex three-dimensional structures, or for modelling the growth of natural 3D cracks that emanate from small manufacturing defects (porosity/lack of fusion) in AM parts, are given in [11,45,47]. In the present study, the stress analyses of the uncracked specimens were performed using NASTRAN. The finite element meshes were created using the pre- and post-processor FEMAP [49], which is a commonly used mesh generator that is linked to a number of commercial finite element programs; see [49] for more details. (For researchers that are unfamiliar with this approach, it should be noted that the Hartman-Schijve crack growth equation can also be used in conjunction with the finite element programs ABAQUS®, NASTRAN® and ANSYS® via the Zencrack® computer software add-in [50].)
The paper by Nishikawa et al. [51] presented the small crack R = −1 da/dN versus ∆K curves for the growth of small cracks in additively manufactured Inconel 718 specimens made using both electron beam melt (EBM) and selective laser melt (SLM) processes. These tests were performed at room temperature (RT). The tests were performed at a range of maximum stresses, viz., 400, 500, 600 and 700 MPa. Fortunately, the crack growth equation governing the growth of both conventionally built Inconel 718 specimens and a wide range of additively manufactured Inconel 718 specimens was given in [23].
In the case of the conventionally manufactured Inconel 718, the various da/dN versus ∆K curves studied in [23] included data sets given in the Nasgro data base (Nasgro [52] is an industry standard computer program that is widely used throughout the aerospace industry) as well as from the paper by Newman and Yamada [53]. In the case of the AM Inconel 718 tests studied in [23], the various da/dN versus ∆K curves were taken from the NASA Round Robin study [54] as well as from [55,56,57,58,59,60]; for more details, see [23]. Setting the term ∆Kthr in the governing crack growth equation given in [23] for both AM and conventionally manufactured Inconel 718 to 0.1 MPa √m yields the small crack growth equation:
da/dN = 1.20 × 10⁻¹⁰ ((∆K − 0.1)/√(1 − Kmax/A))2
Section 5 uses Equation (5) to predict an upper bound on the da/dN versus ∆K curves given in [51] for the growth of small cracks in AM Inconel 718.

3. Crack Growth in WAAM CP-Ti Specimens

Failure in this test occurred as a result of a single (large) surface-breaking manufacturing defect (see Figure 3 and Figure 4). Quantitative fractography was then used to determine the crack growth history. As stated in Section 2, the minimum size crack that could be accurately measured was a crack that was approximately 0.640 mm deep, as measured from the upper surface of the specimen, and had a half crack surface length (width) of approximately 0.631 mm. The time to failure from this measured crack size was approximately 250,494 cycles (30.18 load blocks).

Computing the Growth of Natural 3D Cracks in WAAM CP-Ti

In order to perform the crack growth analysis, a computer-aided design (CAD) model of the specimen with the defect was developed (see Figure 5). This model was meshed, and two different finite element models were produced. This was done to establish that the stress field associated with the finite element model had “converged”, see [7,8,11] for more details. As in prior studies, two different mesh densities were investigated. In the present analysis, one mesh had 13,952 ten-node iso-parametric solid elements and 23,584 nodes, whilst the other had 54,932 ten-node iso-parametric solid elements and 87,934 nodes (see Figure 6). Since the purpose of this analysis was merely to evaluate convergence, the remote load (in both models) was arbitrarily set at 50 kN. The stress field associated with the fine mesh is shown in Figure 7. These two different meshes gave stress fields that differed by less than 1.9%. For each crack shape, the alternating finite element method used the stress field associated with the fine mesh, albeit subjected to the maximum load that was used in the fatigue test, to compute the stress intensity factor solutions around the crack. Having determined the stress intensity factors, Equation (4) was then used to compute the increment in the crack and hence the new crack shape. As can be seen in Figure 8, the measured and the predicted crack growth histories are in good agreement.

4. Predicting the Growth of Small Cracks in Additively Manufactured Inconel 718

Examining Equation (6), it is clear that there is one remaining term that needs to be set, namely the cyclic fracture toughness term A. The value given in [23] for conventionally built Inconel 718 was 170 MPa √m. On the other hand, the smallest value of A given in [23] for additively manufactured Inconel 718 was 114 MPa. Consequently, predictions were made using Equation (6) with both A = 170 and 114 MPa √m. The resultant predicted “worst-case” small curves are shown in Figure 9 together with the curves given in [51] for the growth of small cracks in both electron beam melt (EBM)- and selective laser melt (SLM)-built Inconel 718.
Examining Figure 9, we see that for both EBM and SLM Inconel 718, both of the predicted curves do indeed represent reasonably good upper bounds to the measured small crack growth curves.

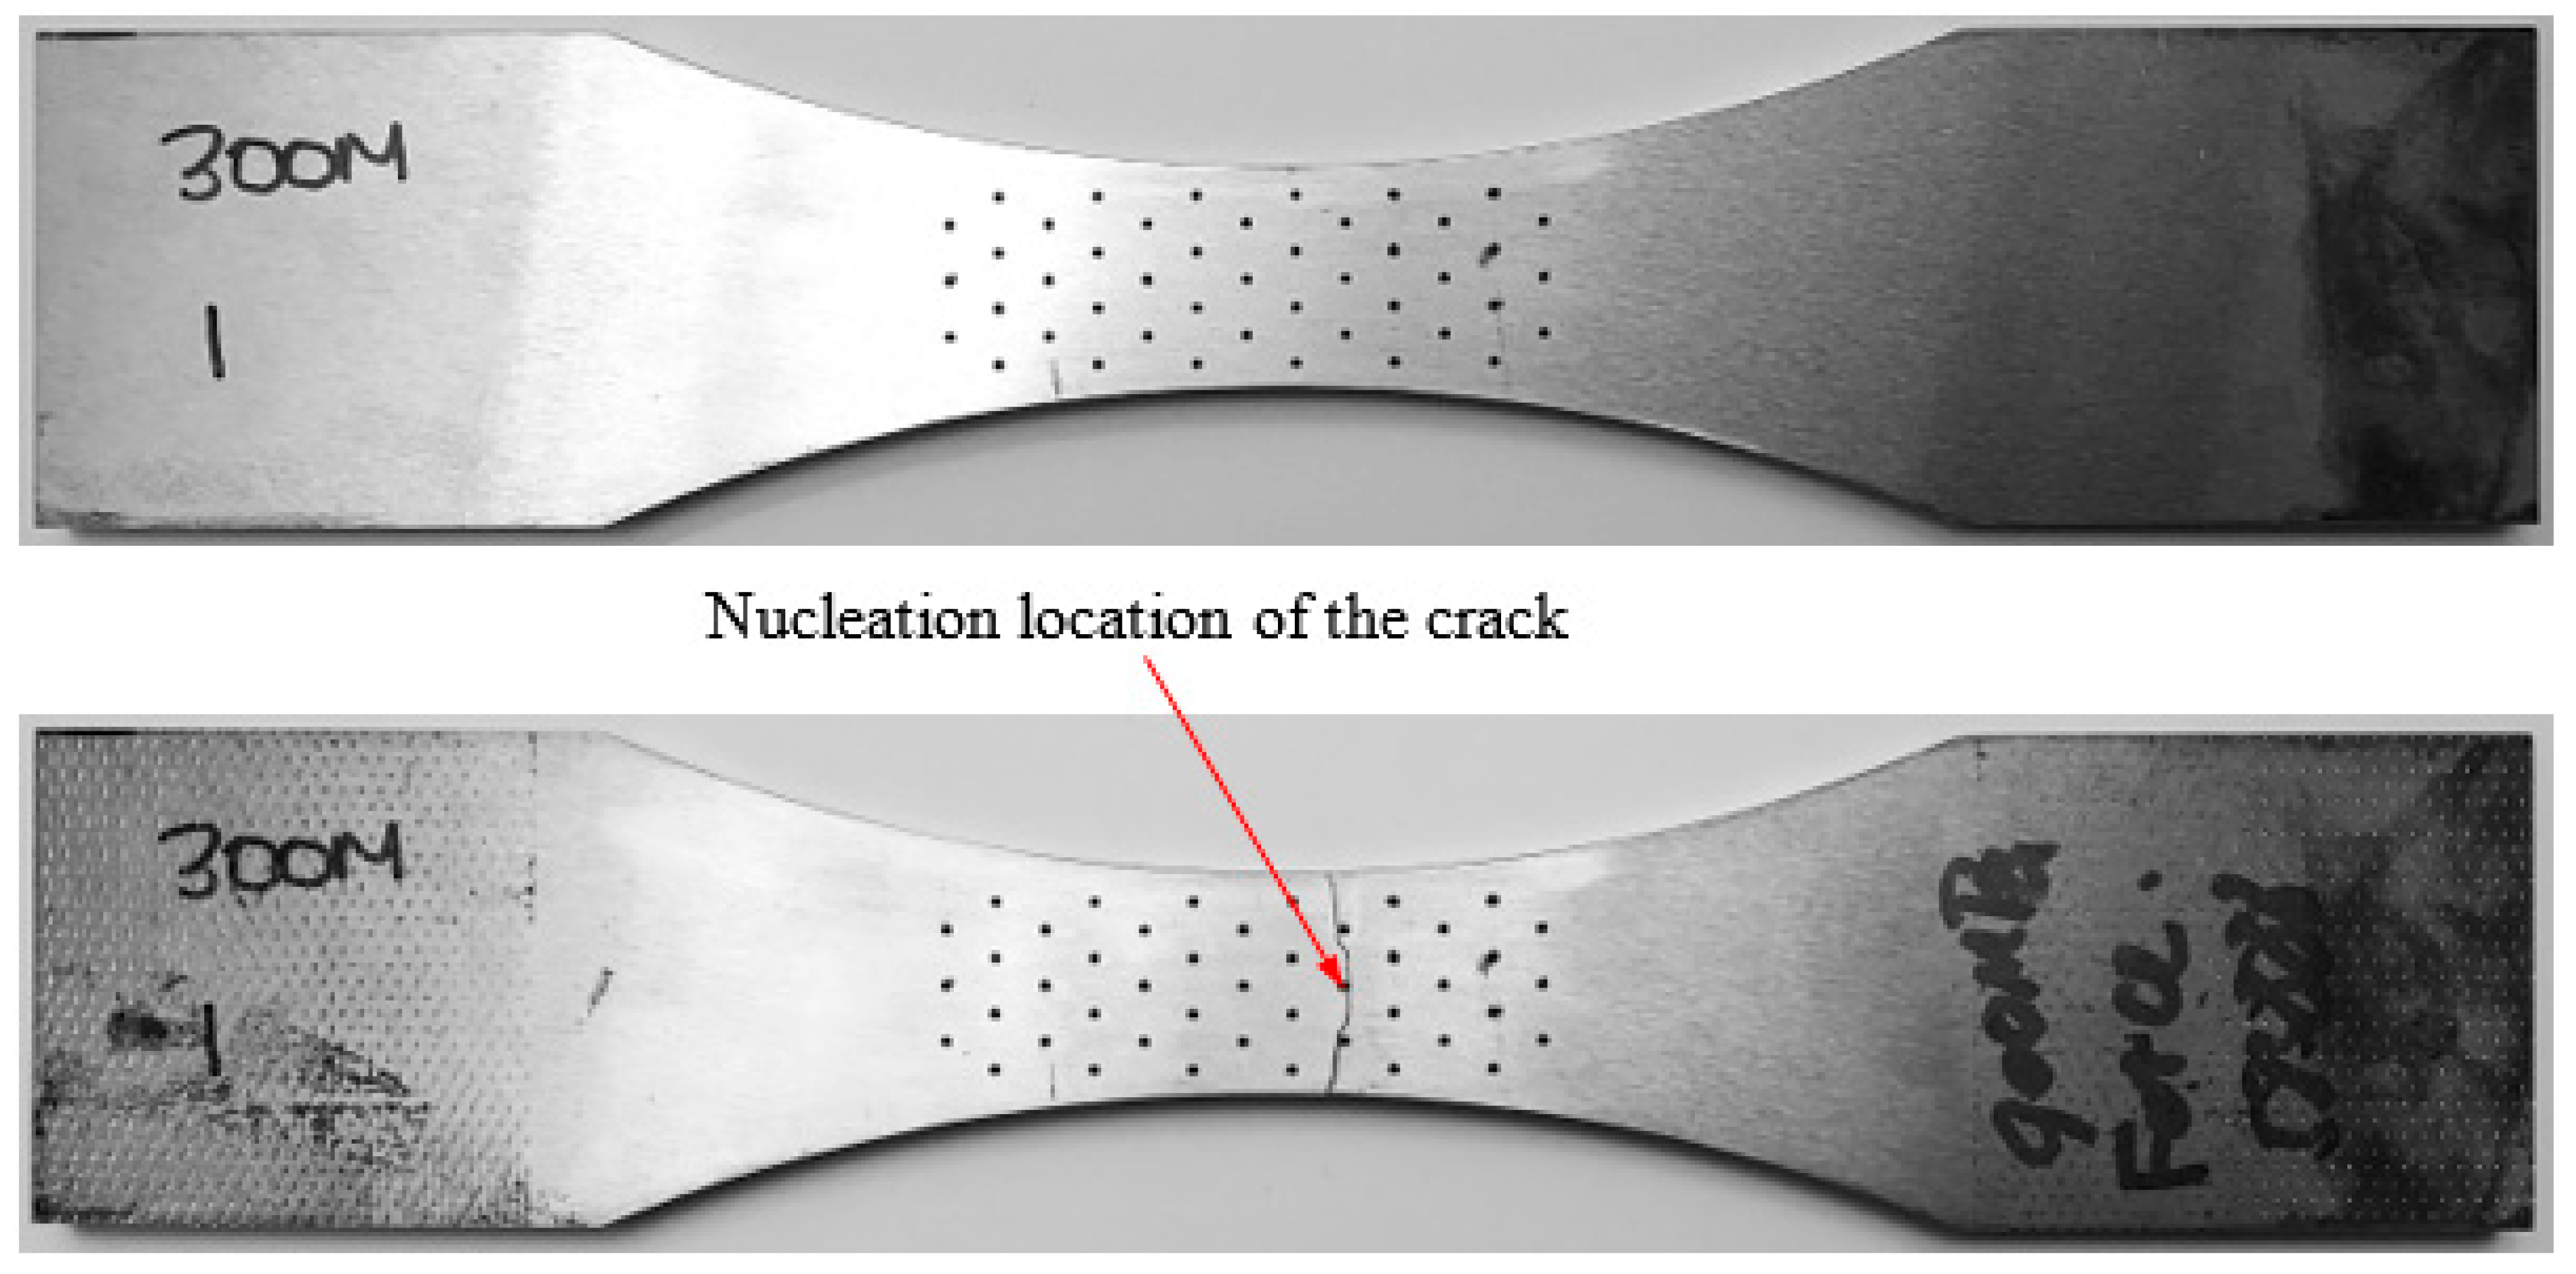
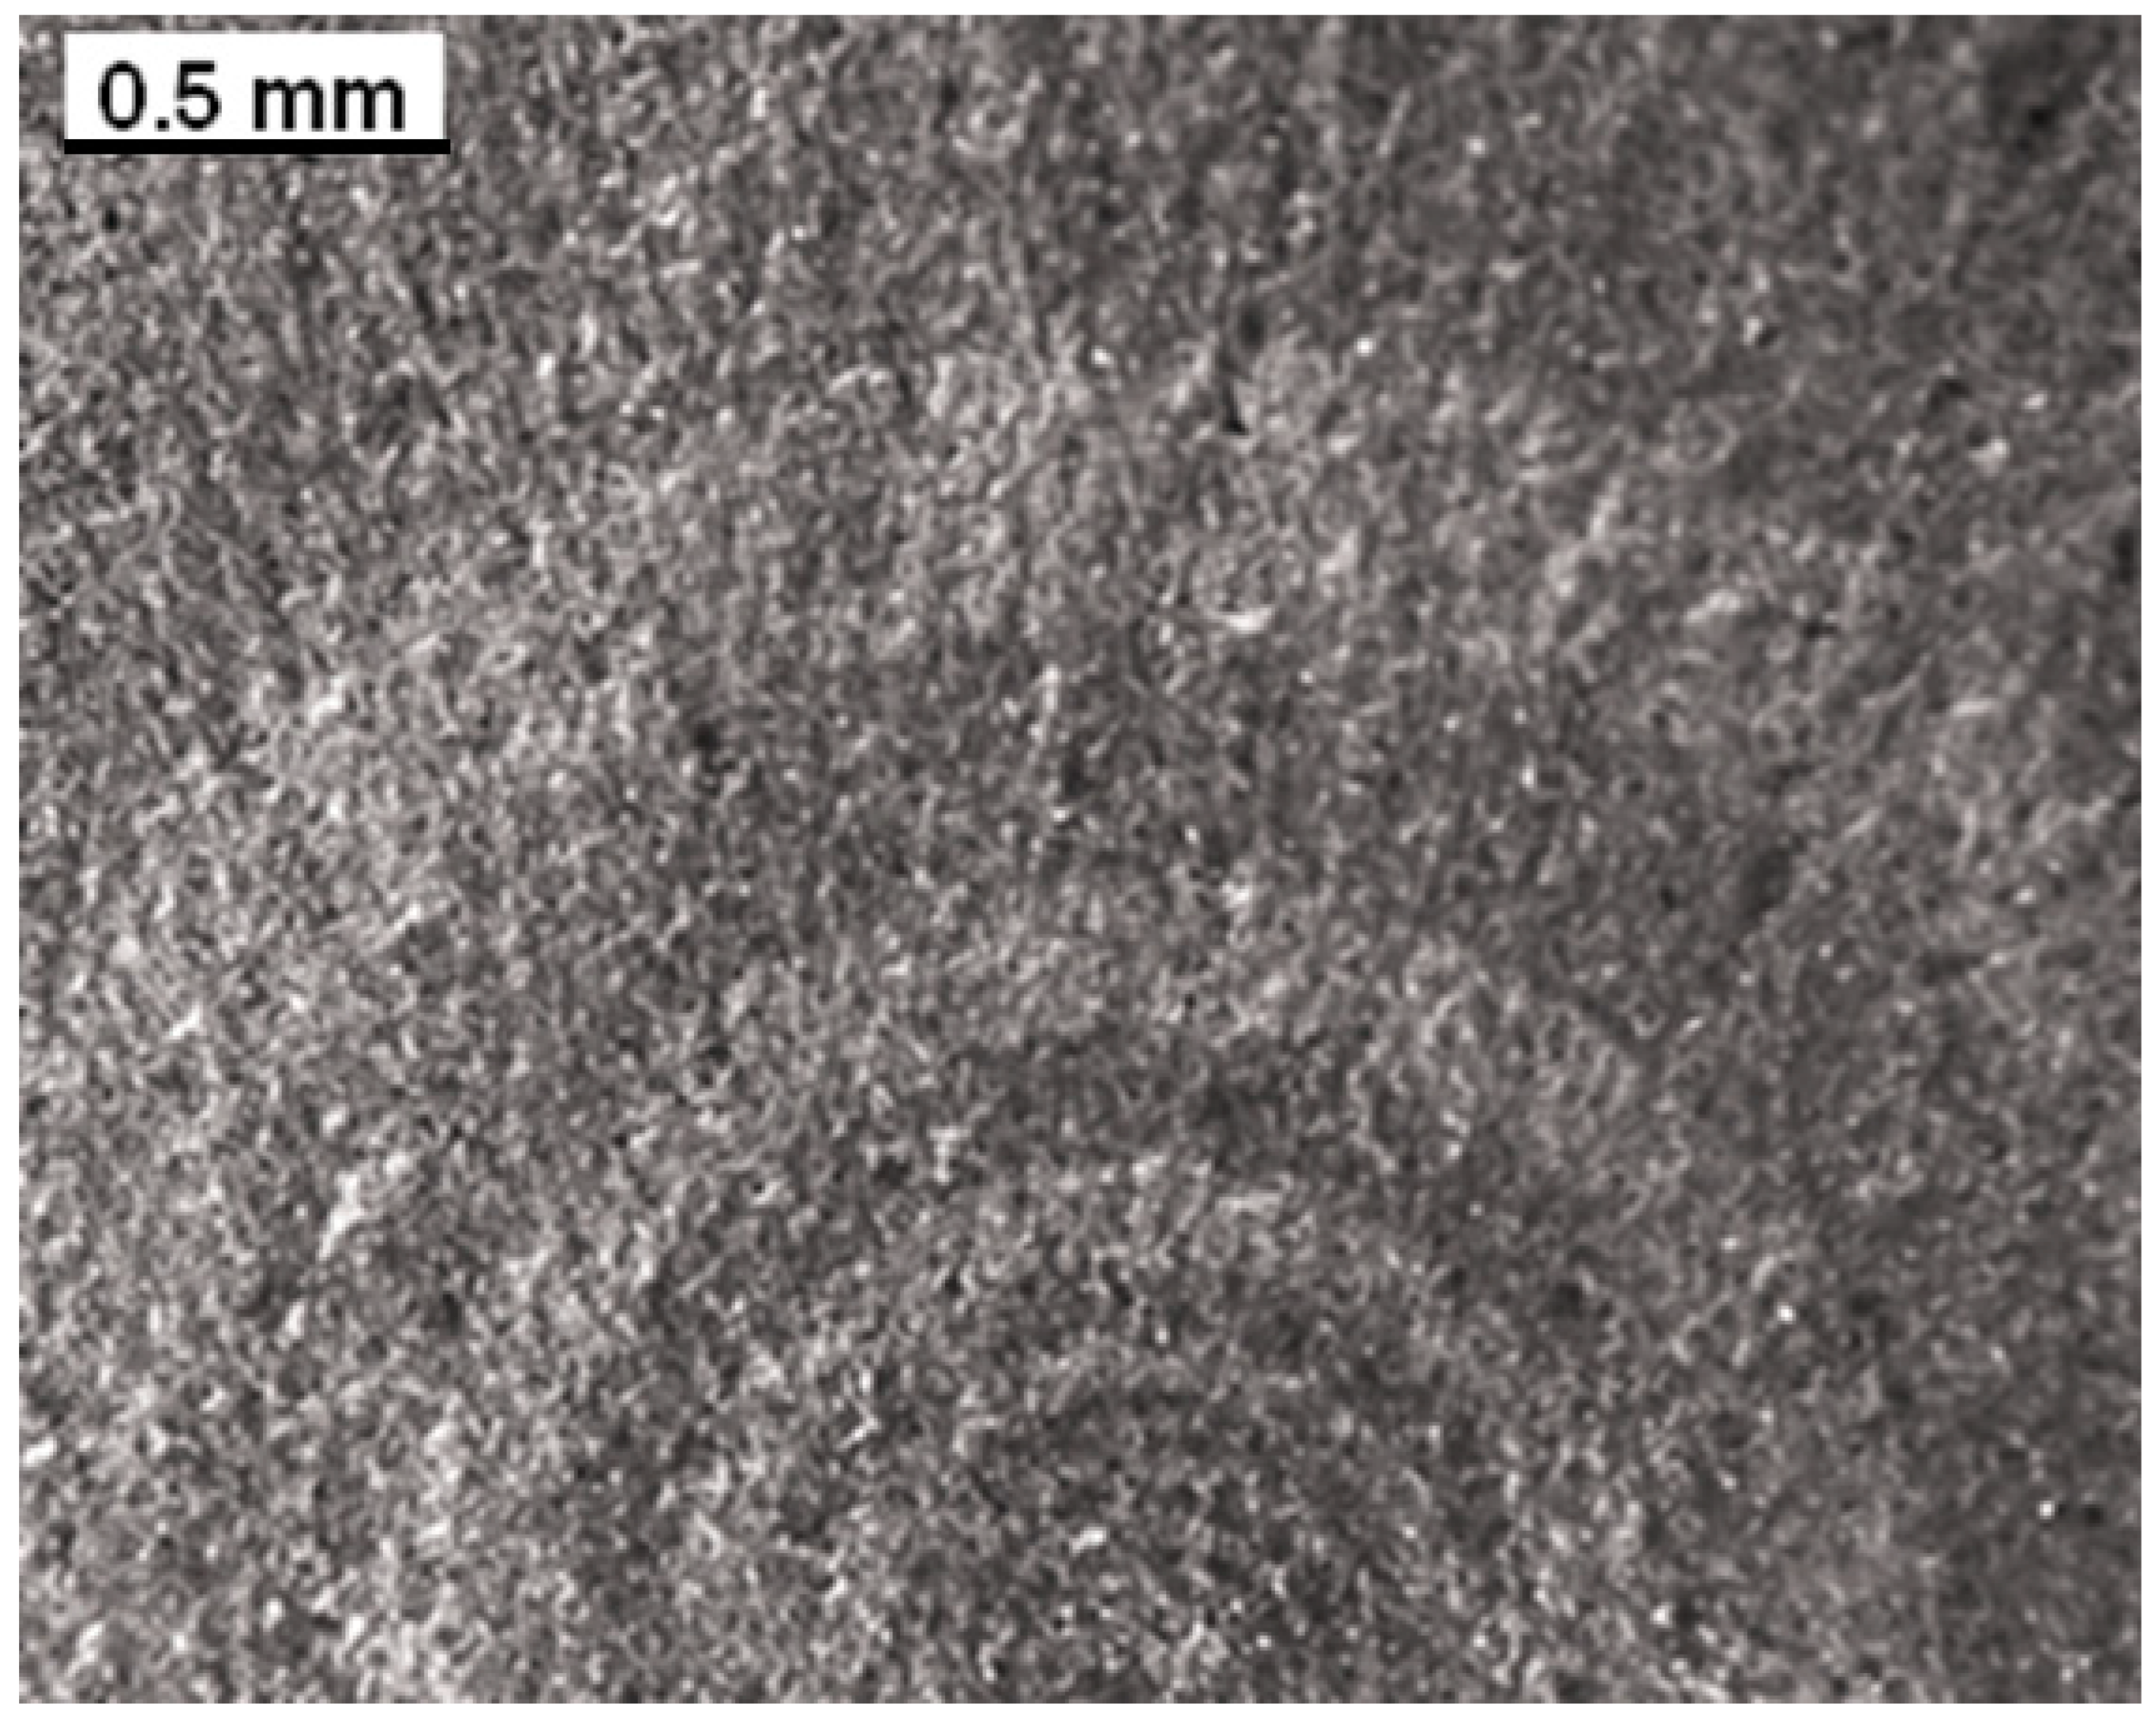
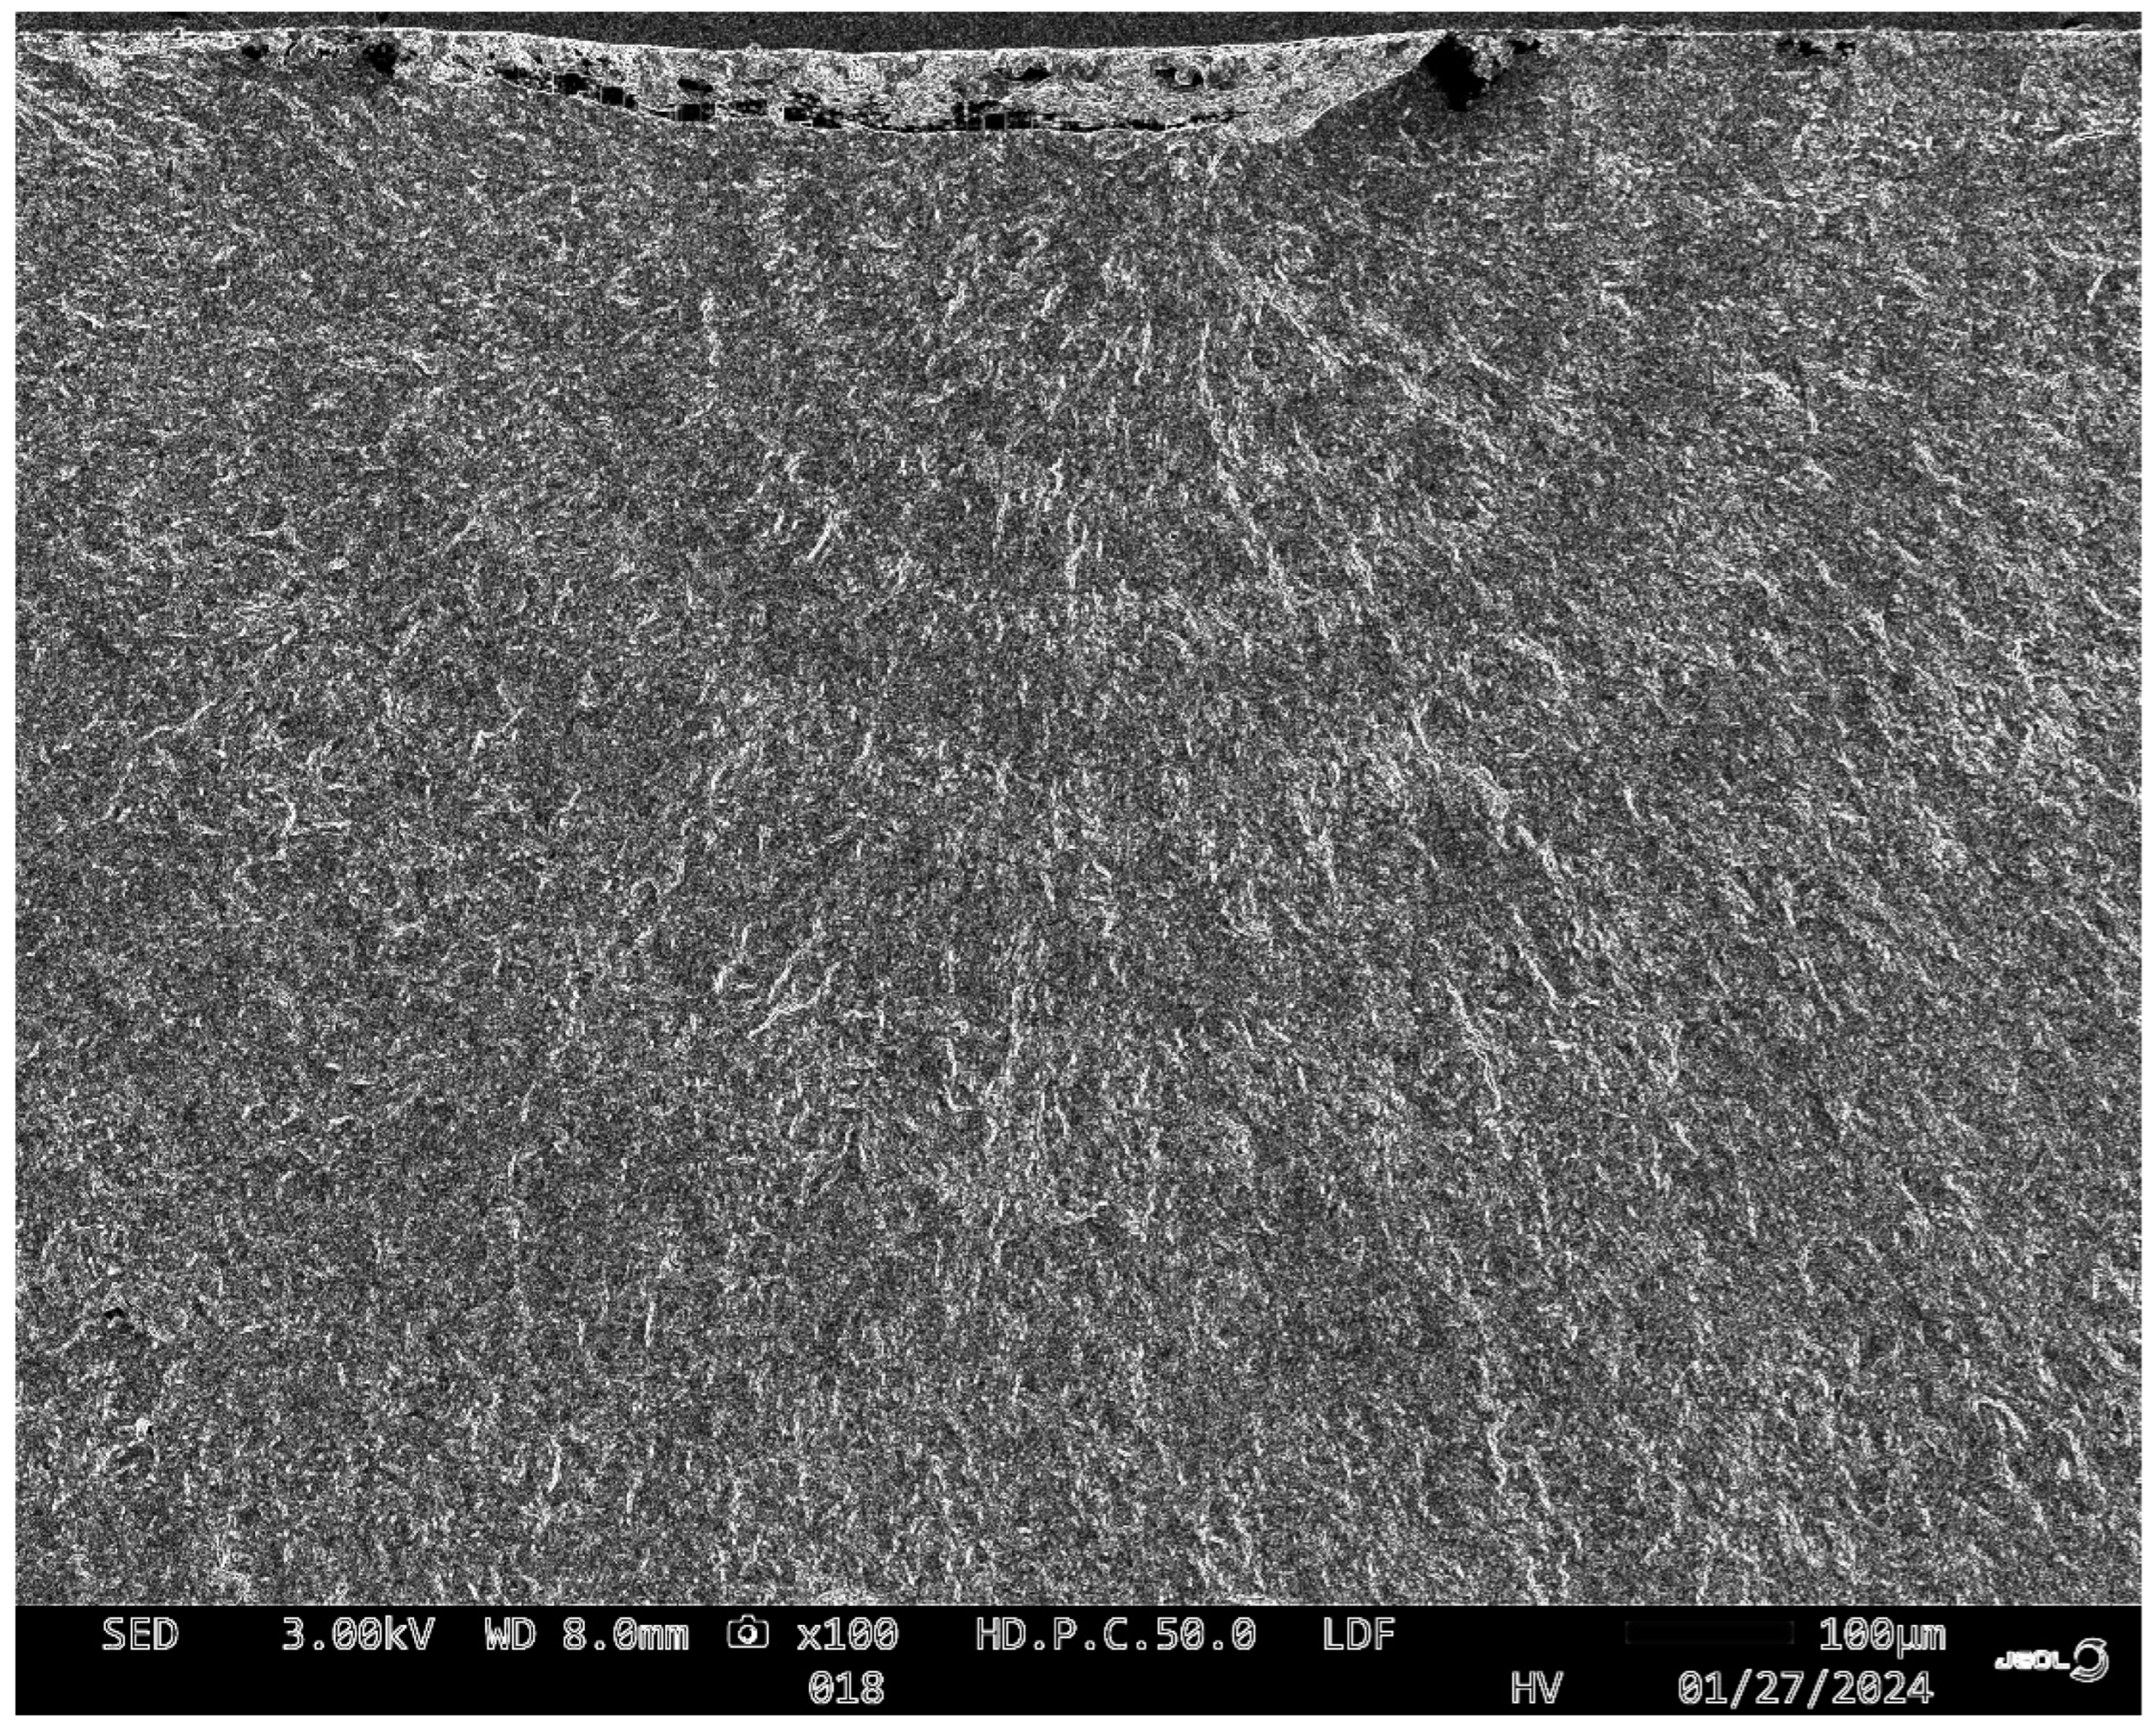
5. Predicting the Growth of Natural 3D Cracks in Conventionally Manufactured M300 Steel

To enable the crack growth history associated with natural 3D cracks in the high-strength M300 steel to be determined, the specimens were tested under two slightly different marker block load spectra.

5.1. Specimen M3001

The marker block load spectrum applied to Specimen 300M1 consisted of 10,000 cycles at R = 0.7 and 1000 cycles at R = 0.1. The maximum load (Pmax) in each load block was held constant at 112.83 kN. The test frequency was 10Hz. In the working section, the maximum stress was approximately 900 MPa.
Specimen 300M1 failed after 583,888 cycles, as shown in Figure 10, Figure 11, Figure 12 and Figure 13. It is interesting to note that failure occurred away from the section with the minimum width (see Figure 10). This is believed to be due to the distribution of the notch depths in the specimen. Figure 11 and Figure 12 present high-magnification optical pictures and SEM pictures of the failure surface. Inspecting Figure 11, it can be seen that the repeated marker block spectra resulted in moderately clear marks on the failure surface. Figure 12 reveals that these markings are also reasonably clear in the SEM images. The crack growth history was determined from measurements obtained using both the optical and the scanning electron microscope (SEM) images and is shown in Figure 13. Here, a is the crack depth, as measured from the (upper) free surface of the specimen, and c is half the crack width. The crack depth (a) includes the depth of etch pit associated with this crack, which was approximately 0.1 mm.

Predicting the Crack Growth History for Specimen 300M1
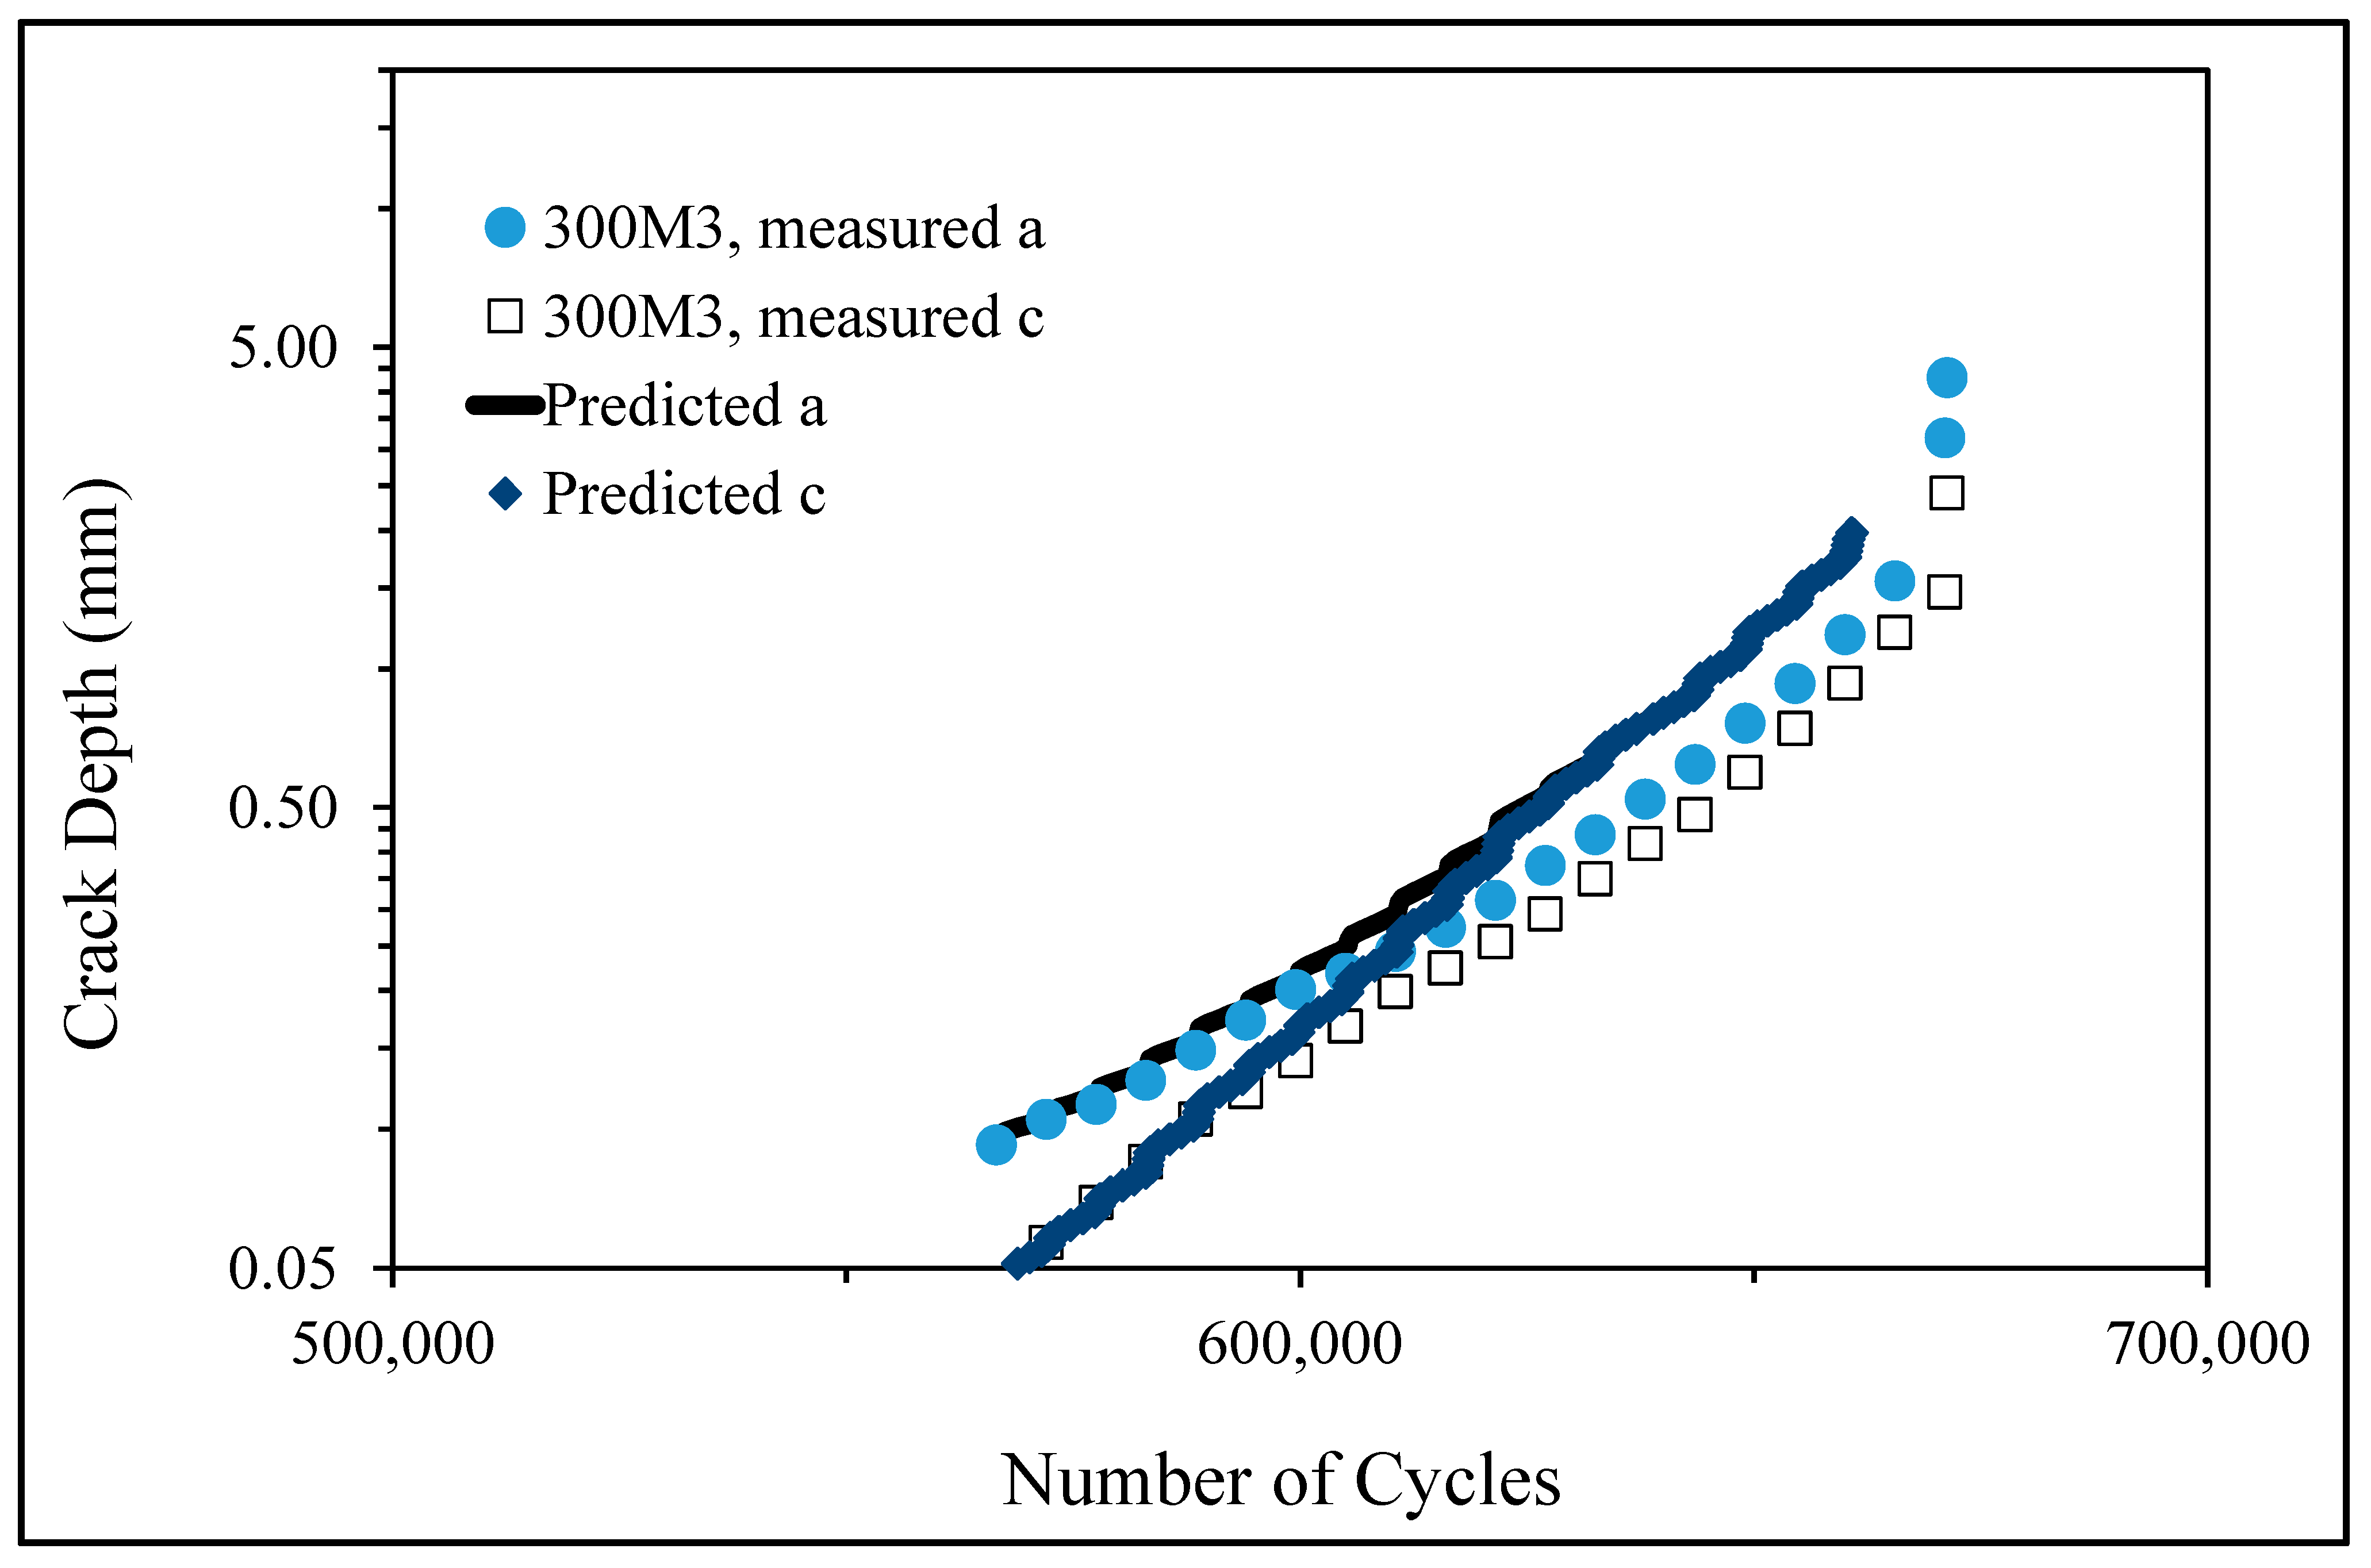
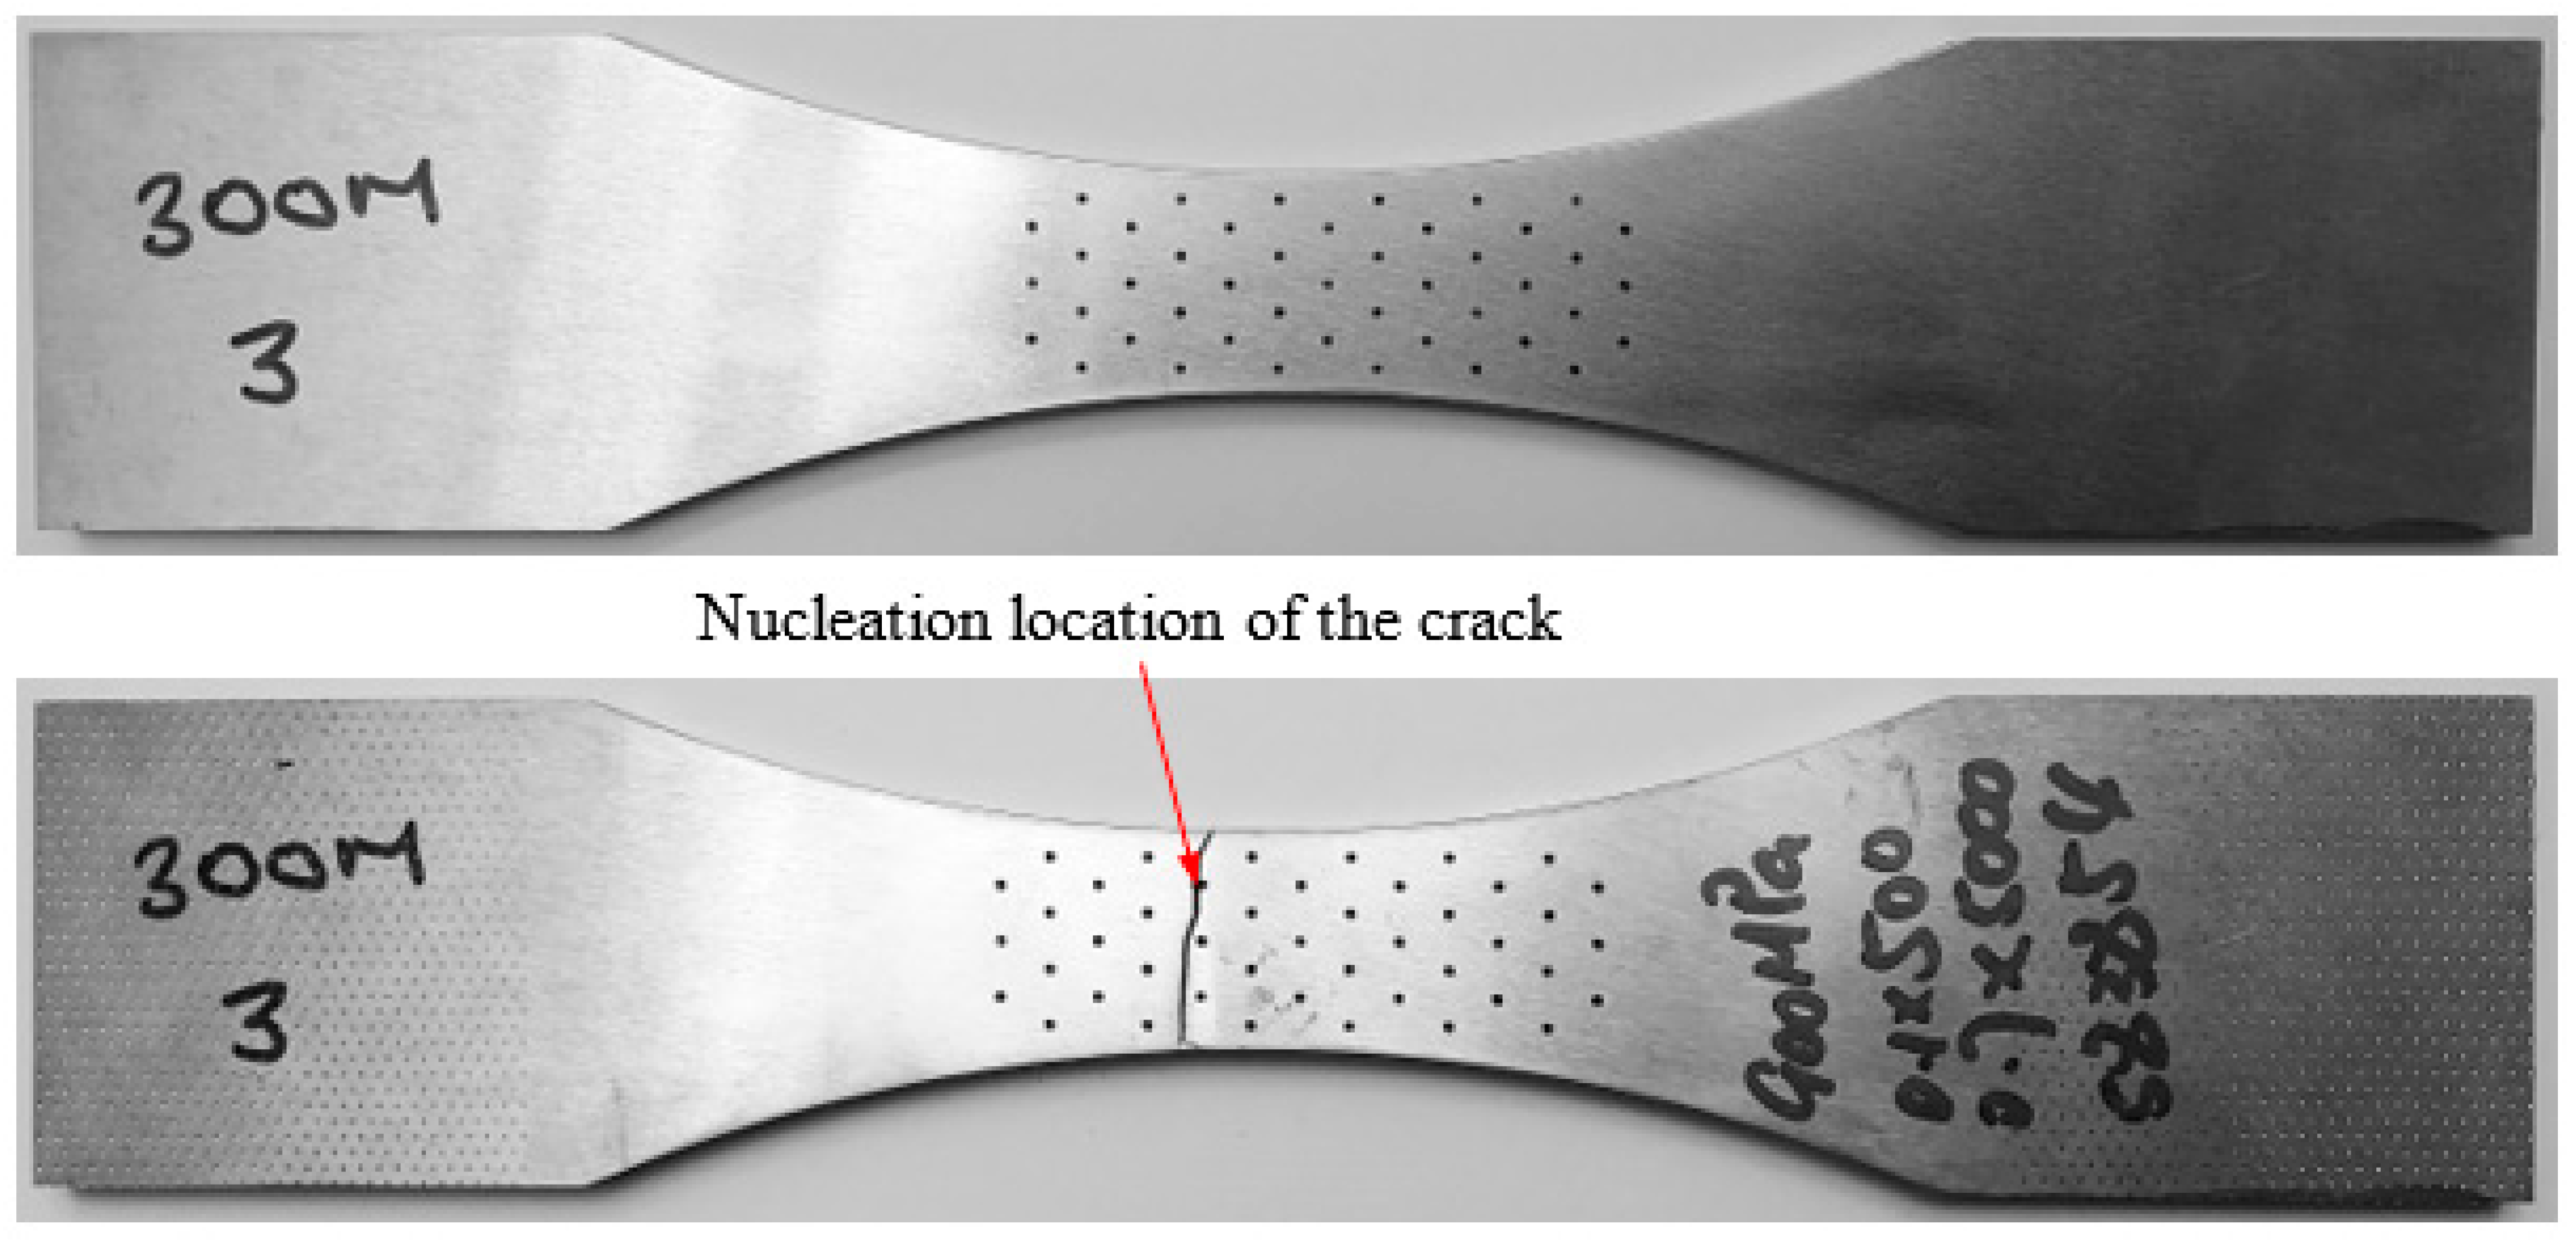
As previously mentioned, both the United States Joint Services Specification Guidelines JSSG-2006 [3] and MIL-STD-1530DC [2] require a “building-block” approach to the DADT analysis. Consequently, in this section, we illustrate how to predict the growth of natural 3D cracks in this tests when the initial crack size is equal to, or smaller than, the equivalent initial damage size (EIDS) mandated in [1,2], namely 0.254 mm (0.01 inch).
As detailed in Section 2 and as per the analysis of the growth of small cracks in WAAM CP-Ti, the stress intensity factor solutions were obtained using the three-dimensional finite element alternating solution. As a result, we first needed to create a 3D finite element model of the specimen, including the array of surface etch pits. To this end, two different three-dimensional (3D) meshes, that were termed Mesh 1 and Mesh 2, were created. Mesh 1 consisted of 44,510 ten-node iso-parametric tetrahedral elements and 72,287 nodes. Mesh 2 had 221,350 ten-node iso-parametric tetrahedral elements and 385,659 nodes. A picture of the fine mesh is shown in Figure 14.
The maximum principal stress field associated with the finer mesh is shown in Figure 15. The stress field at the location where the crack(s) nucleated in the analyses was found to differ by less than 1.9%. Nevertheless, and as previously, to ensure the accuracy of the analysis, the fine mesh was used to compute the crack growth history seen in the test. In this analysis, the geometry of the etch pit from which the crack nucleated was as shown in Figure 12.
The crack growth analysis used Equation (5) to predict the crack growth histories. The size of the initial (assumed) crack used in the analysis of this specimen was taken to correspond to a particular measured crack geometry, viz., a0 = 0.036 mm and c0 = 0.039 mm. (The quantity a0 is the depth of the crack as measured from the bottom of the etch pit, which is approximately 0.074 mm deep.) These values are significantly smaller than the minimum EIDS mandated in MIL-STD-1530Dc and JSSG-2006 of 0.254 mm.
The results of this prediction are also presented in Figure 13 along with the measured crack growth histories. Here we see that there is reasonably good agreement between the measured and the predicted crack growth histories. We also see that the predicted crack growth history is slightly conservative.

5.2. Specimen 300M3

Specimen 300M3 was also tested under a repeated marker block loads with a maximum stress in the working section of approximately 900 MPa. The marker block load spectrum for this test was slightly different in that it consisted of 500 cycles at R = 0.1 and 5000 at R = 0.7. The test frequency was 10 Hz. This specimen failed after 671,279 cycles. Planar and cross-section views of the failure surface are given in Figure 16, Figure 17 and Figure 18. The crack growth histories were (again) determined from fractographic measurements obtained using both the optical and the SEM pictures and are shown in Figure 19.
A comparison between the measured and predicted crack growth histories, which used the fine mesh shown above, are shown in Figure 19. The size of the initial crack used in the analysis was taken to correspond to a particular measured crack geometry, namely a0 = 0.0374 mm and c0 = 0.0443 mm. (As previously mentioned, the quantity a0 is the depth of the crack as measured from the bottom of the etch pit, which is approximately 0.055 mm deep.) These values are also significantly smaller than the minimum EIDS mandated in MIL-STD-1530Dc and JSSG-2006. As previously noted, a is the crack depth as measured from the upper surface and as such includes the depth of the etch pit, and c is the half the tip-to-tip crack length (width). As in the previous study, the analysis used the fine mesh with the geometry of the etch pit from which the crack nucleated, as shown in Figure 17.
Figure 19 again reveals that there is reasonably good agreement between the measured and the predicted crack growth histories. We also see that the predicted crack growth history is slightly conservative.

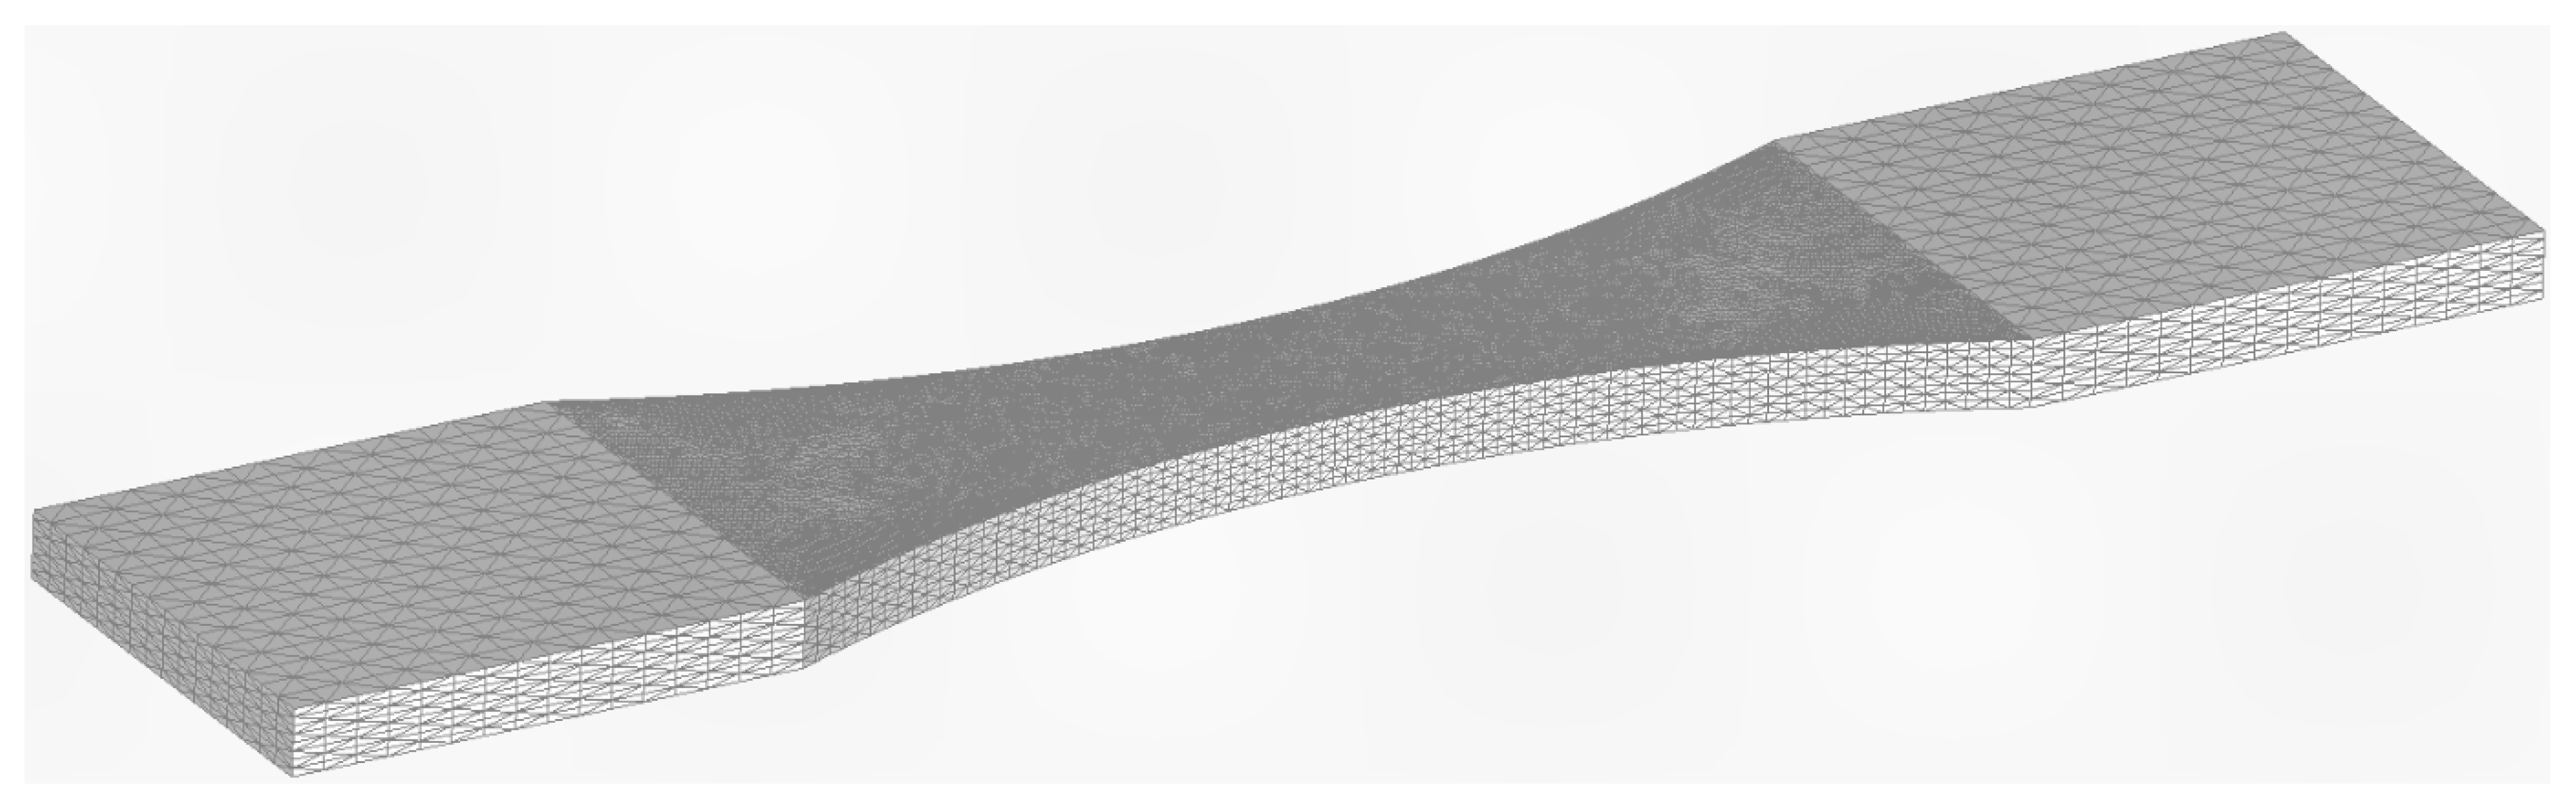
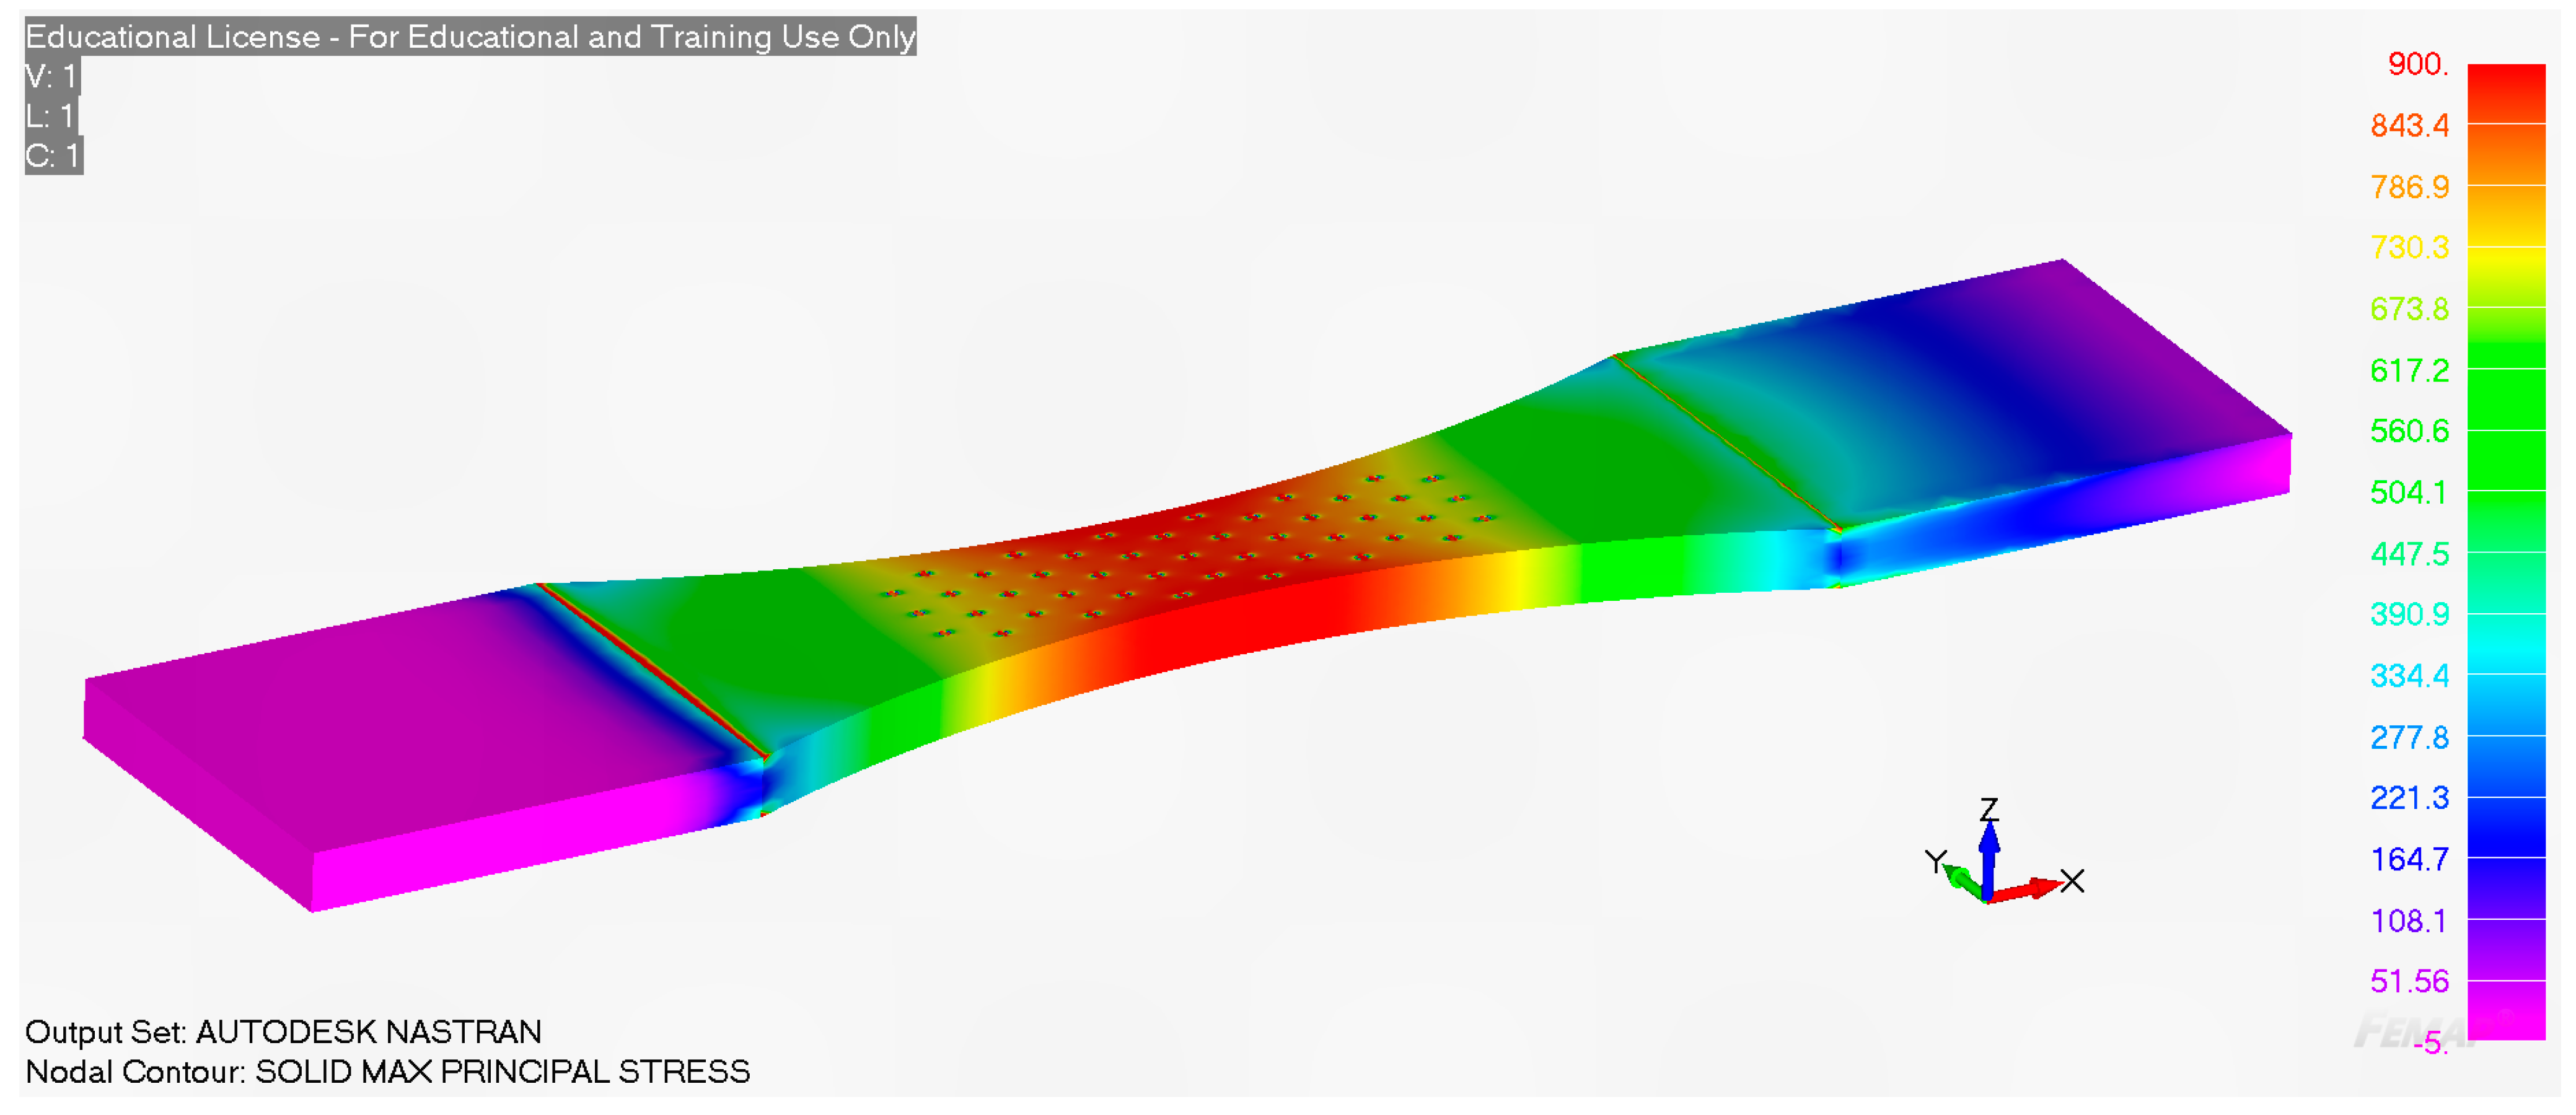
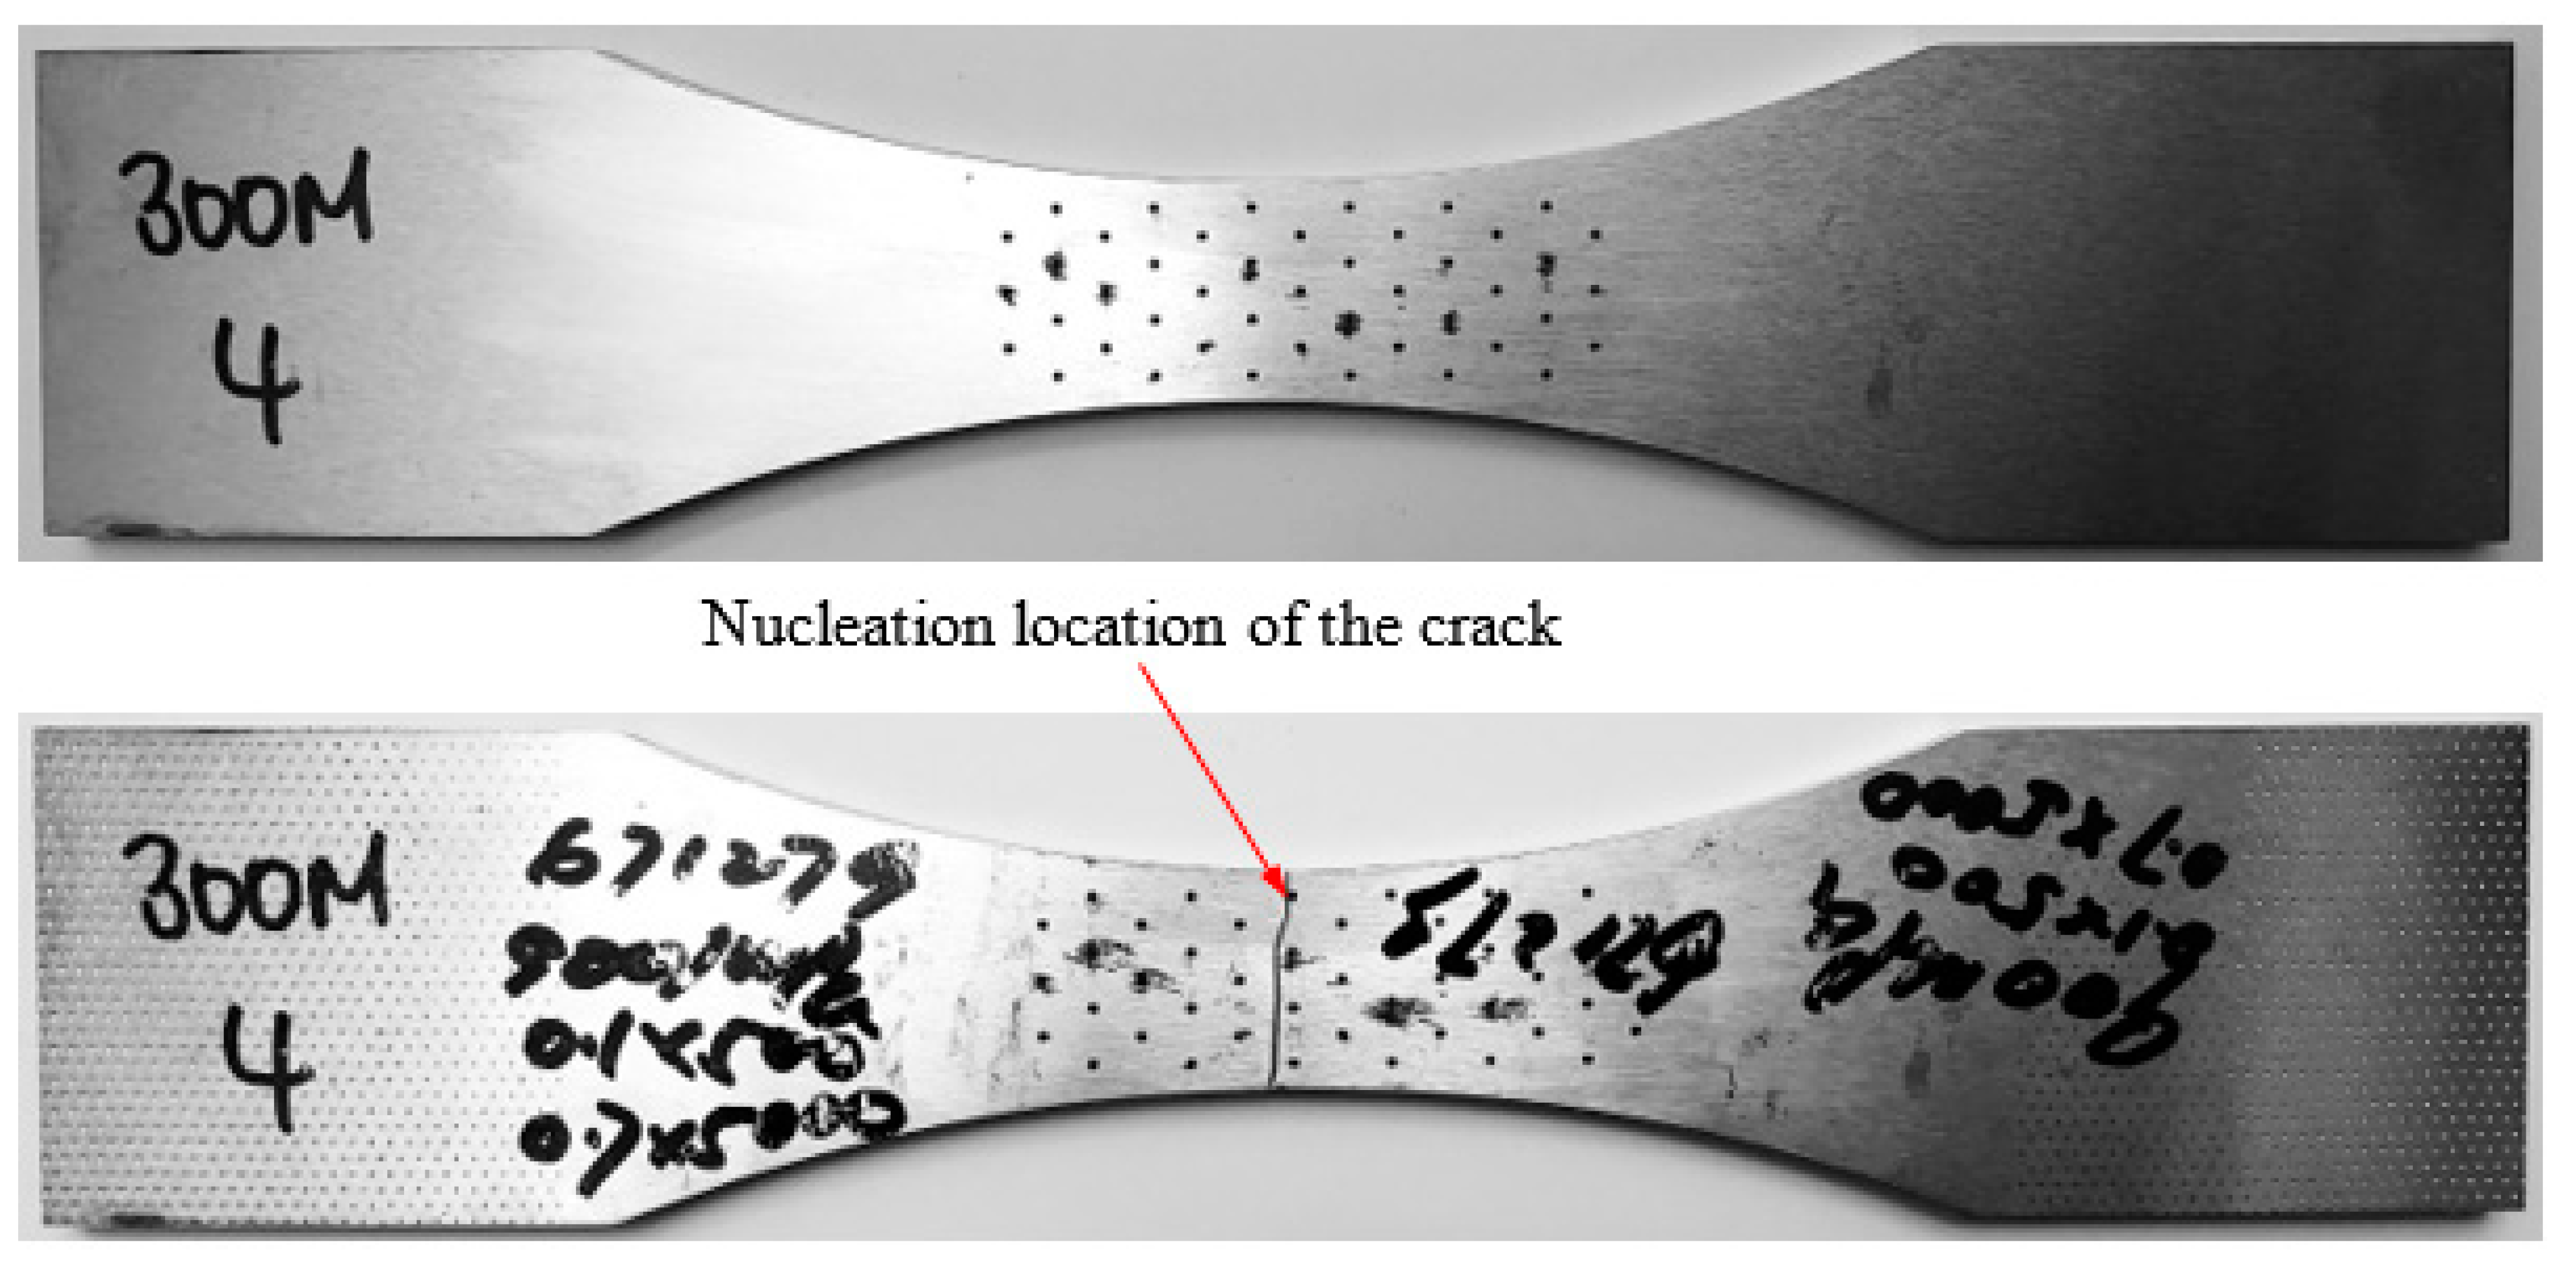
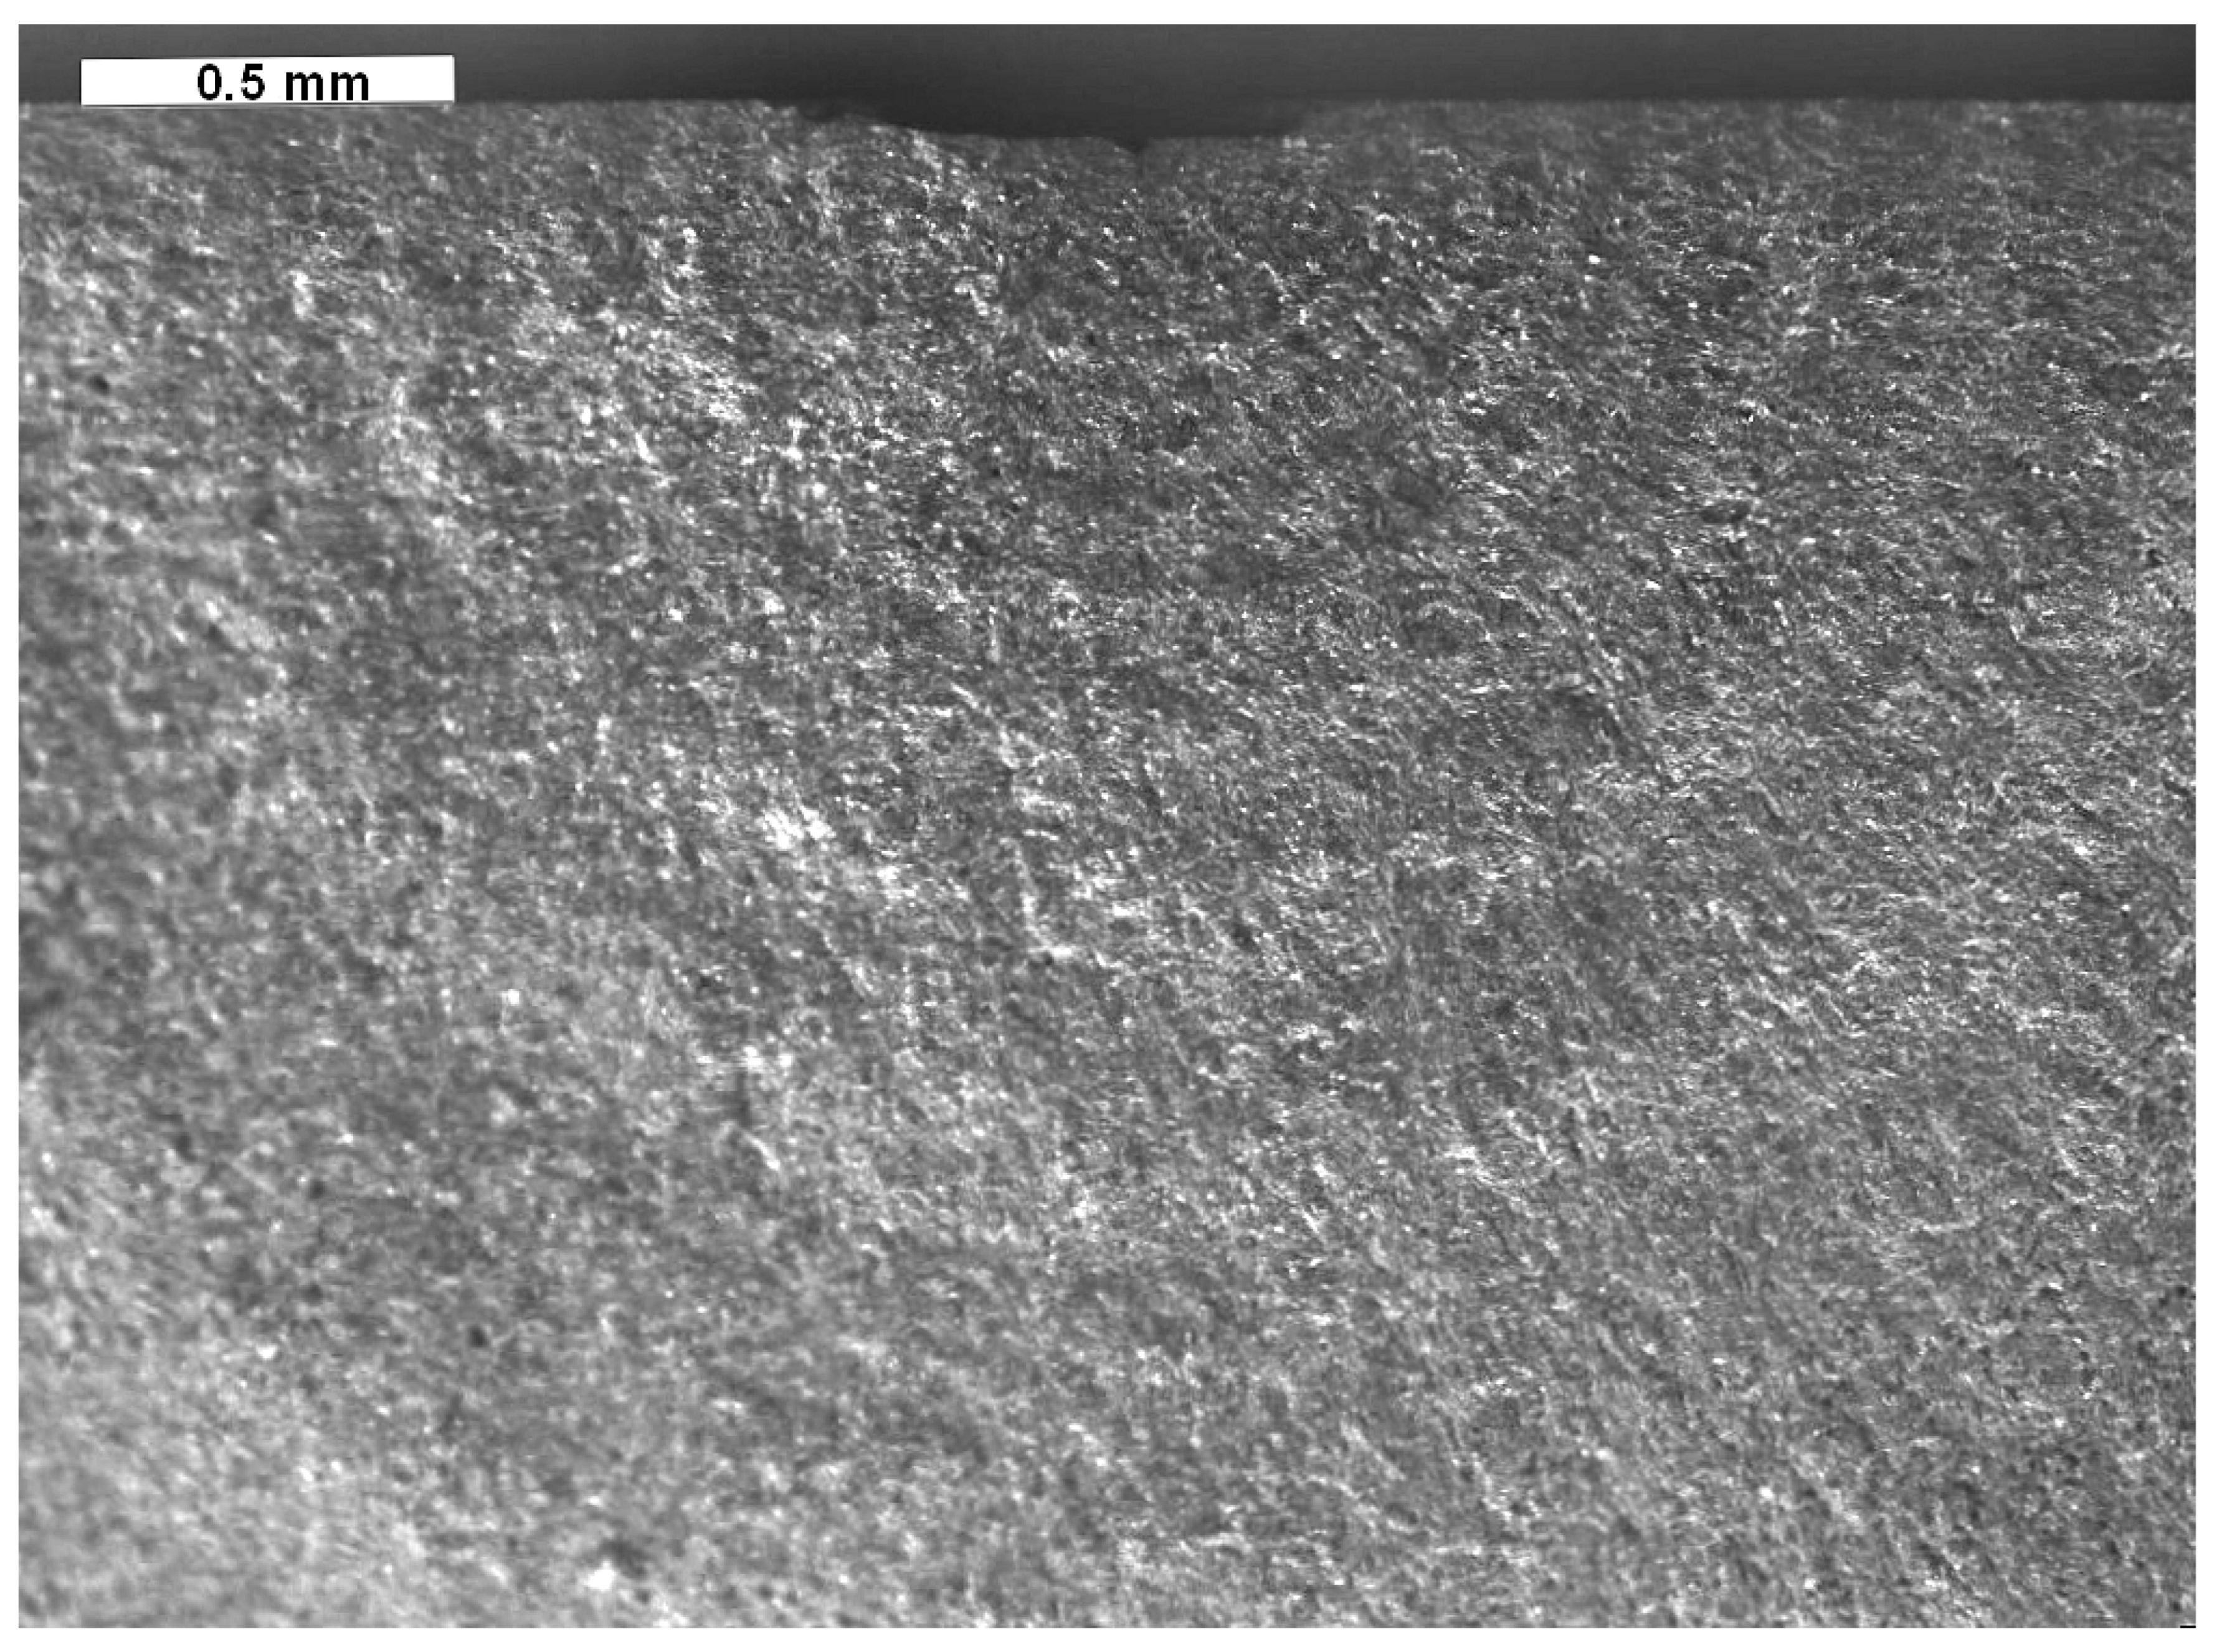
5.3. Specimen of 300M4

Specimen 300M4 was tested under the same load spectrum as was specimen 300M3. Plain and cross-sectional views of the failure surface are given in Figure 20, Figure 21 and Figure 22. As previously noted, the crack growth history was determined from measurements obtained using both the optical and the SEM pictures.
The size of the initial crack, by this we mean the size of the starting crack that was used in the analysis, was taken to correspond to a particular measured crack geometry, viz., a0 = 0.0674 mm and c0 = 0.0591 mm. In this instance, the depth of the etch pit was approximately 0.10 mm. As in the previous studies, these values are significantly smaller than the minimum EIDS mandated in MIL-STD-1530Dc and JSS-G2006.
As in the previous studies, two different finite element meshes were created. The coarse mesh had 21,552 ten-node iso-parametric solid elements and 31,358 nodes, whilst the other had 64,332 ten-node iso-parametric solid elements and 102,992 nodes. Whilst, in this case, the stress field at the location where the crack(s) nucleated in the analyses was found to differ by less than 1.8%, the analyses nevertheless used the fine mesh.
Figure 23 again reveals that there is reasonably good agreement between the measured and the predicted crack growth histories, and that the predicted crack growth history is slightly conservative. As in the previous studies, the analysis used the fine mesh with the geometry of the etch pit from which the crack nucleated, as shown in Figure 22.

6. Conclusions

This paper is unique in that it is the first to reveal that the hypothesis that “crack closure based approaches can be used to give reasonable upper-bound (worst-case) estimates for the small crack da/dN versus ΔK curve” is contradicted by the experimental data contained in the seminal AGARD 732 Round Robin study into the growth of small naturally occurring cracks in the aluminium alloy 2024-T3.
This discovery may help to explain why, unlike the Hartman-Schijve crack growth equation, crack-closure-based formulations have not been successfully used to predict the growth of naturally occurring 3D cracks in either additively manufactured materials or in cold spray repairs to conventionally built metals.
Several examples are presented to further highlight the ability of the Hartman-Schijve equation to predict the growth of natural 3D cracks in both AM materials as well as in a conventionally manufactured high-strength aerospace-quality steel. A feature of this formulation is that it reinforces prior studies that have shown that using the constants D and p taken from tests on long cracks with the fatigue threshold term ΔKthr set as 0.1 MPa √m can often yield reasonably accurate estimates for the measured crack growth histories associated with natural 3D cracks.

Author Contributions

Project overview in Australia—R.J.; Testing of the CP-Ti specimens—D.P.; Testing of the M300 steel specimens—J.W.; Fractography—S.C. and D.P.; Surface etching—S.C., Crack growth predictions—D.P.; Supervision of S.C., D.P. and A.S.M.A.; Funding—A.S.M.A.; Conceptualisation and program overview—M.B.N. and V.K.C.; First draft of the paper—R.J.; Overview of the final paper—M.B.N. and A.S.M.A., Specimen manufacture—A.B., S.L. and A.M. All authors have read and agreed to the published version of the manuscript.

Funding

This work was performed as part of a US Army Research Laboratory funded program administered by the Kostas Research Institute (KRI), Northeastern University, Boston, MA, USA.

Institutional Review Board Statement

Not applicable.

Informed Consent Statement

Not applicable.

Data Availability Statement

The data will be made available upon the completion of the project.

Conflicts of Interest

Authors A. Birt, S. Langan and A. Michelson were employed by Solvus Global in the US, J. Watts was employed by Roseban Engineering in Australia. The remaining authors declare that the research was conducted in the absence of any commercial or financial relationships that could be construed as a potential conflict of interest.

Appendix A

The concept of crack closure, as applied to the growth of long cracks in metals, is based on the papers by Elber [61,62]. However, as noted in [6,63] and as illustrated by the studies presented in [64,65], many studies have used the empirical equation given by Newman [66] for the closure-corrected range of the stress intensity factor ΔKeff.
AGARD-R-732 [39] was the first Round Robin collaborative study into the growth of small naturally occurring cracks. This study presented the small crack da/dN versus ΔK curves associated with tests on small cracks at a range of R ratios in the aluminium alloy 2024-T3. The results of the various participants are shown in Figure A1. The curves shown in Figure A1 include test data reported in Edwards and Newman [39] as well as by Edwards and Newman [67], Cook [68], Blom [69] and Kaynak and Ankara [70] that were also obtained as part of this study. Figure A1 also contains the estimated upper-bound small crack growth curve given in Wanhill [71] and the R = 0 small crack da/dN versus ΔK data given by Wanhill [72]. Here, it should be noted that whilst the studies reported in [71,72] were performed as part of the AGARD Round Robin study, they were not included in [37]. In Figure A1 these studies are referred to as “Wanhill R = 0, 1991” and “Wanhill R = 0, 1994”, respectively. Figure A1 also contains the closure-free curve reported by Newman et al. in [37] and the predicted upper-bound curve given in [11]. The upper-bound curve given in [11], was obtained using the Hartman-Schijve representation for long cracks given in [73], with ΔKthr set to 0.1 MPa √m. Inspecting Figure A1, we see that there is good agreement between the upper-bound curves given in [11,71] and that both are reasonable estimates of the worst-case upper-bound curve.
The belief that the closure-corrected da/dN versus ΔKeff curve can be used to give reasonable upper-bound (worst-case) estimates for the small crack da/dN versus ΔK curve can be traced back to the report by Newman et al. [37]. The data used in [37] to support this hypothesis is shown in Figure A2. Unfortunately, inspecting Figure A1 and Figure A2, we see that not only did [37] omit the majority of the data obtained as part of the AGARD Round Robin study, but the upper-bound da/dN versus ΔK curve given by Wanhill [71] was also omitted. Unfortunately, as can be seen in Figure A1, when the closure-corrected da/dN versus ΔKeff curve is plotted together with the data obtained by the various Round Robin participants, we see that for small cracks with crack growth rates (da/dN) less than approximately 10−8 m/cycle, the da/dN versus ΔKeff curve cannot be thought of as bounding the measured data and is less conservative than the upper-bound curves given in [11,71].
Figure A1. The R = 0.0 small crack growth data obtained in the AGARD Round Robin study and reported in AGARD-R-732 [39] and in [67,68,69,70,72], the upper-bound curve reported by Wanhill [71], the closure-free curve reported by Newman et al. in [37], and the predicted upper-bound curve given in [11]. In [11], this prediction was obtained using the Hartman-Schijve long crack equation with the threshold term ΔKthr set to 0.1 MPa √m.
Crystals 15 00544 g0a1
Figure A2. The reduced R = 0.0 da/dN versus ΔK curves and the closure-corrected da/dN versus ΔKeff curve given in Newman et al. [37] support the hypothesis that the closure-free curve was a reasonable approximation for the upper-bound (worst-case) curve for small cracks seen in the AGARD Round Robin test program. It is unclear why [37] omitted the majority of the Round Robin data from this plot.
Crystals 15 00544 g0a2
The relevance of this observation to the growth of naturally arising cracks in operational aircraft becomes clear when it is noted that Walker et al. [36] reported that when the closure-free da/dN versus ΔKeff curve obtained for crack growth in AA7050-T7451 under constant amplitude loads was used to predict the growth of small cracks in a 7050-T7451 F/A-18-Y488 bulkhead test, which was performed under an operational combat aircraft flight load spectrum, then the estimated crack growth versus flight hours curve was quite non-conservative. This contrasts with the predictions given in [74] for the same fatigue test, which were in excellent agreement with the measured crack growth history. As in the methodology used in the present study, these predictions used the Hartman-Schijve representation of the growth of long cracks in 7050-T7451 with the term ΔKthr set to 0.1 MPa √m. In this context, it should also be noted that, as reported in [6], this approach has also been used to predict the crack growth history seen in the 1969 F-111 wing fatigue test. This finding is particularly relevant given the central role that the cracking in the USAF F-111 wing had in the development of the current approach to the airworthiness certification of military aircraft (see [75]).

References

  1. United States Air Force. Durability and Damage Tolerance Certification for Additive Manufacturing of Aircraft Structural Metallic Parts; Structures Bulletin EZ-SB-19-01; Wright Patterson Air Force Base: Dayton, OH, USA, 2019; Available online: https://daytonaero.com/usaf-structures-bulletins-library/ (accessed on 15 February 2025).
  2. MIL-STD-1530D; Department of Defense Standard Practice Aircraft Structural Integrity Program (ASIP) (31 August 2016). USAF: Washington, DC, USA, 2016. Available online: http://everyspec.com/MIL-STD/MIL-STD-1500-1599/MIL-STD-1530D_55392/ (accessed on 1 June 2025).
  3. JSSG-2006; Department of Defense Joint Service Specification Guide; Aircraft Structures (30 October 1998). USAF: Washington, DC, USA, 2006. Available online: http://everyspec.com/USAF/USAF-General/JSSG-2006_10206/ (accessed on 15 March 2025).
  4. NASA-HDBK-5010; Fracture Control Handbook for Payloads, Experiments, and Similar Hardware. Revalidated 2012; NASA: Washington, DC, USA, 2005. Available online: https://standards.nasa.gov/standard/nasa/nasa-hdbk-5010 (accessed on 15 February 2025).
  5. NASA-HDBK-5026; Guidance on Strength, Fatigue, and Fracture Control Requirements for Additively Manufactured Spaceflight Hardware. NASA: Washington, DC, USA, 2024. Available online: https://standards.nasa.gov/standard/NASA/NASA-HDBK-5026 (accessed on 15 February 2025).
  6. Jones, R. Fatigue crack growth and damage tolerance. Fatigue Fract. Eng. Mater. Struct. 2014, 37, 463–483. [Google Scholar] [CrossRef]
  7. Peng, D.; Jones, R.; Ang, A.S.M.; Michelson, A.; Champagne, V.; Birt, A.; Pinches, S.; Kundu, S.; Alankar, A.; Singh Raman, R.K. Computing the durability of WAAM 18Ni 250 Maraging steel specimens. Fatigue Fract. Eng. Mater. Struct. 2022, 45, 3535–3545. [Google Scholar] [CrossRef]
  8. Peng, D.; Champagne, V.K.; Ang, A.S.M.; Birt, A.; Michelson, A.; Pinches, S.; Jones, R. Computing the Durability of WAAM 18Ni-250 Maraging Steel Specimens with Surface Breaking Porosity. Crystals 2023, 13, 443. [Google Scholar] [CrossRef]
  9. Shamir, M.; Zhang, X.; Syed, A.K. Characterising and representing small crack growth in an additive manufactured titanium alloy. Eng. Fract. Mech. 2021, 253, 107876. [Google Scholar] [CrossRef]
  10. Dastgerdi, J.N.; Jaberi, O.; Remes, H.; Lehto, P.; Toudeshky, H.H.; Kuva, J. Fatigue damage process of additively manufactured 316L steel using X-ray computed tomography imaging. Addit. Manuf. 2023, 70, 103559. [Google Scholar] [CrossRef]
  11. Jones, R.; Ang, A.; Aston, R.W.; Schoenborn, N.D.; Champagne, V.K.; Peng, D.; Phan, N. On the Growth of Small Cracks in 2024-T3 and Boeing Space, Intelligence and Weapon Systems AM LPBF Scalmalloy®. Fatigue Fract. Eng. Mater. Struct. 2024, 48, 31–43. [Google Scholar] [CrossRef]
  12. Jones, R.; Cizek, J.; Kovarik, O.; Ang, A.; Champagne, V.K. Observations on comparable aluminium alloy crack growth curves: Additively manufactured Scalmalloy® as an alternative to AA5754 and AA6061-T6 alloys? Addit. Manuf. Lett. 2022, 2, 100026. [Google Scholar] [CrossRef]
  13. Markham, M.J.; Fatemi, A.; Nam, P. Mixed-Mode Small Fatigue Crack Growth Rates and Modelling in Additively Manufactured Metals. Int. J. Fatigue 2024, 183, 108258. [Google Scholar] [CrossRef]
  14. Tang, D.; He, X.; Wu, B.; Dang, L.; Xin, H.; Li, Y. A fatigue life prediction approach for porosity defect-induced failures in directed energy deposited Ti-6Al-4V considering crack growth environment. Int. J. Fatigue 2014, 184, 108272. [Google Scholar] [CrossRef]
  15. Han, S.; Dung Dinh, T.; De Baere, I.; Boone, M.; Josipovic, I.; Van Paepegem, W. Study of the effect of defects on fatigue life prediction of additive manufactured Ti-6Al-4V by combined use of micro-computed tomography and fracture-mechanics-based simulation. Int. J. Fatigue 2023, 180, 108110. [Google Scholar] [CrossRef]
  16. Shamir, M.; Zhang, X.; Syed, A.K.; Sadler, W. Predicting the Effect of Surface Waviness on Fatigue Life of a Wire Arc Additive Manufactured Ti-6Al-4V Alloy. Materials 2023, 16, 5355. [Google Scholar] [CrossRef] [PubMed]
  17. Jones, R.; Singh Raman, R.K.; McMillan, A.J. Crack growth: Does microstructure play a role? Eng. Fract. Mech. 2018, 187, 190–210. [Google Scholar] [CrossRef]
  18. Main, B.; Evans, R.; Walker, K.; Yu, X.; Molent, L. Lessons from a fatigue prediction challenge for an aircraft wing shear tie post. Int. J. Fatigue 2019, 123, 53–65. [Google Scholar] [CrossRef]
  19. Wanhill, R.J.; Stanzl-Tschegg, S.E. Short/small fatigue crack growth, thresholds and environmental effects: A tale of two engineering paradigms. Corros. Rev. 2021, 39, 165–175. [Google Scholar] [CrossRef]
  20. Tan, J.; Chen, B. Coalescence and growth of two coplanar short cracks in AA7050-T7451 aluminium alloys. Eng. Fract. Mech. 2013, 102, 324–333. [Google Scholar] [CrossRef]
  21. Tan, J.; Chen, B. A new fracture area method for predicting the growth of a newly coalesced crack in AA7050-T7451 aluminium alloy. Theor. Appl. Fract. Mech. 2015, 75, 146–150. [Google Scholar] [CrossRef]
  22. Iliopoulos, A.P.; Jones, R.; Michopoulos, J.G.; Phan, N.; Rans, C. Further Studies into Crack Growth in Additively Manufactured Materials. Materials 2020, 13, 2223. [Google Scholar] [CrossRef]
  23. Jones, R.; Ang, A.; Peng, D.; Champagne, V.K.; Michelson, A.; Birt, A. Modelling Crack Growth in Additively Manufactured Inconel 718 and Inconel 625. Metals 2023, 13, 1300. [Google Scholar] [CrossRef]
  24. Ye, J.; Syed, A.K.; Zhang, X.; Eimer, E.; Williams, S. Fatigue crack growth behaviour in an aluminium alloy Al-Mg-0.3Sc produced by wire based directed energy deposition process. Fatigue Fract. Eng. Mater. Struct. 2023, 46, 3927–3938. Available online: https://onlinelibrary.wiley.com/doi/epdf/10.1111/ffe.14113 (accessed on 18 April 2025). [CrossRef]
  25. Jones, R.; Michopoulos, J.G.; Iliopoulos, A.P.; Singh Raman, R.K.; Phan, N.; Nguyen, T. Representing Crack Growth in Additively Manufactured TI-6AL-4V. Int. J. Fatigue 2018, 111, 610–622. [Google Scholar] [CrossRef]
  26. Iliopoulos, A.P.; Jones, R.; Michopoulos, J.G.; Phan, N.; Singh Raman, R.K. Crack growth in a range of additively manufactured aerospace structural materials, Special Issue, Civil and Military Airworthiness: Recent Developments and Challenges. Aerospace 2018, 5, 118–136. [Google Scholar] [CrossRef]
  27. Jones, R.; Kovarik, O.; Bagherifard, S.; Cizek, J.; Lang, J. Damage tolerance assessment of AM 304L and cold spray fabricated 316L steels and its implications for attritable aircraft. Eng. Fract. Mech. 2021, 254, 107916. [Google Scholar] [CrossRef]
  28. Kovarik, O.; Cech, J.; Kiziklioglu, E.; Cizek, J.; Stittgen, T. Anisotropy of Mechanical Properties of DMD Build Inconel 738. In Proceedings of the Thermal Spray 2023: Proceedings from the International Thermal Spray Conference, Québec City, QC, Canada, 22–25 May 2023; ASM International: Township, OH, USA, 2023. Paper No: itsc2023p0473. pp. 473–479. [Google Scholar] [CrossRef]
  29. Markham, M.J.; Fatemi, A. Multiaxial Fatigue Life Predictions of Additively Manufactured Metals Using a Hybrid of Linear Elastic Fracture Mechanics and a Critical Plane Approach. Int. J. Fatigue 2023, 178, 107979. [Google Scholar] [CrossRef]
  30. Sanaei, N.; Fatemi, A. Defect-based multiaxial fatigue life prediction of L-PBF additive manufactured metals. Fatigue Fract. Eng. Mater. Struct. 2021, 44, 1897–1915. [Google Scholar] [CrossRef]
  31. Sanaei, N.; Fatemi, A. Defects in additive manufactured metals and their effect on fatigue performance: A state-of-the-art review. Prog. Mater. Sci. 2020, 117, 100724. [Google Scholar] [CrossRef]
  32. Jones, R.; Kovarik, O.; Cizek, J.; Ang, A.; Lang, J. Crack growth in conventionally manufactured pure nickel, titanium and aluminium and the cold spray additively manufactured equivalents. Addit. Manuf. Lett. 2022, 3, 100043. [Google Scholar] [CrossRef]
  33. Kovarik, O.; Cizek, J.; Klecka, J. Fatigue Crack Growth Rate Description of RF-Plasma-Sprayed Refractory Metals and Alloys. Materials 2023, 16, 1713. [Google Scholar] [CrossRef]
  34. Godefroid, L.B.; Moreir, L.P.; Vilel, T.C.G.; Fari, G.L.; Candid, L.C.; Pinto, E.S. Effect of chemical composition and microstructure on the fatigue crack growth resistance of pearlitic steels for railroad application. Int. J. Fatigue 2019, 120, 241. [Google Scholar] [CrossRef]
  35. Zhang, Y.; Zheng, K.; Heng, J.; Zhu, J. Corrosion-Fatigue Evaluation of Uncoated Weathering Steel Bridges. Appl. Sci. 2019, 9, 3461. [Google Scholar] [CrossRef]
  36. Walker, K.F.; Wang, C.H.; Newman, J.C., Jr. Closure measurement and analysis for small cracks from natural discontinuities in an aluminium alloy. Int. J. Fatigue 2016, 82, 256–262. [Google Scholar] [CrossRef]
  37. Newman, J.C.; Phillips, E.P.; Everett, R.A. Fatigue Analyses Under Constant and Variable-Amplitude Loading Using Small-Crack Theory. NASA/TM-1999-209329, 1 May 1999. Available online: https://ntrs.nasa.gov/citations/19990046065 (accessed on 15 February 2025).
  38. Today in Science History. Available online: https://todayinsci.com/F/Fermi_Enrico/FermiEnrico-Quotations.htm (accessed on 18 May 2025).
  39. Newman, J.C., Jr.; Edwards, P.R. Short-Crack Growth Behaviour in an Aluminium Alloy—An AGARD Cooperative Test Programme. AGARD-R-732, 1 December 1988. Available online: https://ntrs.nasa.gov/citations/19890007916 (accessed on 18 May 2025).
  40. Jones, R.; Lang, J.; Papyan, V.; Peng, D.; Lua, J.; Ang, A. Characterising crack growth in commercially pure titanium. Eng. Fail. Anal. 2021, 122, 105287. [Google Scholar] [CrossRef]
  41. Steel 300M. Available online: https://www.techsteel.net/alloy/steel/300m (accessed on 27 March 2025).
  42. Mills, T.; Clark, G.; Loader, C.; Sharp, P.K.; Schmidt, R. Review of F-111 Structural Materials, Department of Defence; Technical Report DSTO-TR-1118; Defence Science Technology Organisation: Canberra, ACT, Australia, 2001. Available online: https://apps.dtic.mil/sti/tr/pdf/ADA393097.pdf (accessed on 27 March 2025).
  43. Dexter, R.J.; Ocel, J.M. Manual for Repair and Retrofit of Fatigue Cracks in Steel Bridges; Federal Highway Administration Report FHWA-IF-13-020; US Department of Transportation: Washington, DC, USA, 2013. Available online: https://www.fhwa.dot.gov/bridge/steel/pubs/hif13020/hif13020.pdf (accessed on 18 April 2025).
  44. Nishioka, T.; Atluri, S.N. Analytical solution for embedded elliptical cracks, and finite element alternating method for elliptical surface cracks, subjected to arbitrary loadings. Eng. Fract. Mech. 1983, 17, 247–268. [Google Scholar] [CrossRef]
  45. Pipkins, S.D.; Atluri, S.N. Applications of the three dimensional method finite element alternating method. Finite Elem. Anal. Des. 1996, 23, 133–153. [Google Scholar] [CrossRef]
  46. Simon, H.L.; O’Donoghue, P.E.; Atluri, S.N. A finite-element-alternating technique for evaluating mixed modes stress intensity factors for part-elliptical surface flaws. Int. J. Numer. Methods Eng. 1987, 24, 689–709. [Google Scholar] [CrossRef]
  47. Park, J.H. A Review on Finite Element Alternating Methods for Analyzing 2D and 3D Cracks. Digit. Eng. Digit. Twin 2024, 2, 79–101. [Google Scholar] [CrossRef]
  48. Wang, L.; Atluri, S.N. Recent advances in the alternating method for elastic and inelastic fracture analyses. Comput. Methods Appl. Mech. Eng. 1996, 137, 1–58. [Google Scholar] [CrossRef]
  49. Simcenter Femap Software. Available online: https://plm.sw.siemens.com/en-US/simcenter/mechanical-simulation/femap/ (accessed on 18 April 2025).
  50. Timbrell, C.; Chandwan, R. Whats New in Zencrack. Zenteck International Limited. 2024. Available online: https://zentech.co.uk/software/zencrack/whats-new/version921 (accessed on 25 May 2025).
  51. Nishikawa, H.; Furuya, Y.; Kitano, H.; Nakamura, T.; Kuwabara, K.; Kanegae, Y.; Kang, D.S.; Aotam, K. In-situ observation of microstructurally small fatigue crack initiation and growth behaviors of additively-manufactured alloy 718. Mater. Sci. Eng. A 2022, 835, 142682. [Google Scholar] [CrossRef]
  52. NASGRO® Fracture Mechanics & Fatigue Crack Growth Software. Available online: https://www.swri.org/markets/chemistry-materials/materials/mechanics-materials/nasgro-fracture-mechanics-fatigue-crack-growth-software (accessed on 18 April 2025).
  53. Newman, J.C., Jr.; Yamada, Y. Compression Precracking Methods to Generate Near-Threshold Fatigue-Crack-Growth-Rate Data. Int. J. Fatigue 2010, 32, 879–885. [Google Scholar] [CrossRef]
  54. Morgan, K.; Wells, D. Overview of Fatigue and Damage Tolerance Performance of SLM Alloy 718. In Proceedings of the 2016 National Space and Missile Materials Symposium, Westminster, CO, USA, 20–23 June 2016; Available online: https://ntrs.nasa.gov/archive/nasa/casi.ntrs.nasa.gov/20160007853.pdf (accessed on 18 April 2025).
  55. Konecná, R.; Kunz, L.; Nicoletto, G.; Baca, A. Fatigue crack growth behavior of Inconel 718 produced by selective laser melting. Frat. Ed. Integrità Strutt. 2016, 35, 31–40. [Google Scholar] [CrossRef]
  56. Yadollahi, A.; Mahtabi, M.J.; Khalili, A.; Doude, H.R.; Newman, J.C., Jr. Fatigue life prediction of additively manufactured material: Effects of surface roughness, defect size, and shape. Fatigue Fract. Eng. Mater. Struct. 2018, 41, 1602–1614. [Google Scholar] [CrossRef]
  57. Ostergaard, H.E.; Pribe, J.D.; Hasib, M.T.; Paradowska, A.M.; Siegmund, T.; Kruzic, J.J. Near-threshold fatigue crack growth in laser powder bed fusion produced alloy 718. Int. J. Fatigue 2022, 163, 107041. [Google Scholar] [CrossRef]
  58. Kim, S.; Choi, H.; Lee, J.; Kim, S. Room and elevated temperature fatigue crack propagation behavior of Inconel 718 alloy fabricated by laser powder bed fusion. Int. J. Fatigue 2020, 140, 105802. [Google Scholar] [CrossRef]
  59. Yu, X.; Lin, X.; Tan, H.; Hu, Y.; Zhang, S.; Liu, F.; Yang, H.; Huang, W. Microstructure and fatigue crack growth behavior of Inconel 718 superalloy fabricated via laser directed energy deposition additive manufacturing. Int. J. Fatigue 2021, 143, 106005. [Google Scholar] [CrossRef]
  60. Paluskiewicz, S.A.; Narasimhachary, S.B.; Shinde, S.R.; Kain, C.; Towner, Z.B.; Muhlstein, C.L. Crack closure of Ni-based superalloy 718 at high negative stress ratios. Int. J. Fatigue 2022, 160, 106822. [Google Scholar] [CrossRef]
  61. Elber, W. Fatigue crack cyclic closure tension under cyclic tension. Eng. Fract. Mech. 1970, 2, 37–45. [Google Scholar]
  62. Elber, W. The significance of crack closure. In Damage Tolerance in Aircraft Structures; ASTM International: West Conshohocken, PA, USA, 1971; pp. 230–242. [Google Scholar]
  63. Ribeiro, V.; Correia, J.; Lesiuk, G.; Gonçalves, A.; De Jesus, A.; Berto, F. Application and discussion of various crack closure models to predict fatigue crack growth in 6061-T651 aluminium alloy. Int. J. Fatigue 2021, 153, 106472. [Google Scholar] [CrossRef]
  64. Liu, J.Z.; Wu, X.R.; Ding, C.F.; Hu, B.R.; Wang, L.F.; Annigeri, B.; Vestergaard, L.H.; Romanowski, A.; Schneider, G.J.; Forth, S.C. Crack growth behavior and fatigue-life prediction based on worst-case near-threshold data of a large crack for 9310 steel. Fatigue Fract. Eng. Mater. Struct. 2002, 25, 467–480. [Google Scholar] [CrossRef]
  65. Newman, J.C., Jr. Fatigue and Crack Growth under Constant and Variable-Amplitude Loading in 9310 Steel Using “Rainflow-on-the-Fly” Methodology. Metals 2021, 11, 807. [Google Scholar] [CrossRef]
  66. Newman, J.C., Jr. A crack opening stress equation for fatigue crack growth. Int. J. Fatigue 1984, 24, R131–R135. [Google Scholar] [CrossRef]
  67. Edwards, P.R.; Newman, J.C., Jr. Short-Crack Growth Behaviour in Various Aircraft Materials; AGARD-R-767; AGARD: Neuilly sur Seine, France, 1990; Available online: https://www.sto.nato.int/publications/AGARD/AGARD-R-767/AGARD-R-767.pdf (accessed on 15 February 2025.).
  68. Cook, R. The Growth of Short Fatigue Cracks in an Aluminium Alloy; Technical Report 92063; Defence Research Agency: Farnborough, UK, 1992. Available online: https://apps.dtic.mil/sti/pdfs/ADA262064.pdf (accessed on 15 February 2024).
  69. Blom, A. Short crack growth under realistic flight loading: Model predictions and experimental results for al 2024 and Al-Li 2090. In Short-Crack Growth Behaviour in Various Aircraft Materials; AGARD Report No 767; AGARD: Neuilly sur Seine, France, 1990; pp. 6-1–6-15. Available online: https://www.sto.nato.int/publications/AGARD/AGARD-R-767/AGARD-R-767.pdf (accessed on 15 February 2025).
  70. Kaynak, C.; Ankara, A. Short fatigue crack growth AL 2024-T3 and AL 7075T6. Eng. Fract. Mech. 1992, 43, 769–778. [Google Scholar] [CrossRef]
  71. Wanhill, R.J.H. Durability Analysis Using Short and Long Fatigue Crack Growth Data. In Proceedings of the International Conference on Aircraft Damage Assessment and Repair, Melbourne, VIC, Australia, 26–28 August 1991; Jones, R., Miller, N.J., Eds.; The Institution of Engineers Australia: Barton, ACT, Australia, 1991; ISBN 85825 537. Available online: https://www.researchgate.net/publication/325102704_Durability_Analysis_Using_Short_and_Long_Fatigue_Crack_Growth_Data (accessed on 5 February 2025).
  72. Wanhill, R. Some Practical Considerations for Fatigue and Corrosion Assessment of Ageing Aircraft; NLR Technical Publication TP 96253 L; National Aerospace Laboratory NLR: Amsterdam, The Netherlands, 1996; Available online: https://www.researchgate.net/publication/333965628_NLR_Technical_Publication_TP_96253_L_Some_Practical_Considerations_For_Fatigue_And_Corrosion_Damage_Assessment_Of_Ageing_Aircraft (accessed on 18 April 2025).
  73. Jones, R.; Molent, L.; Walker, K. Fatigue crack growth in a diverse range of materials. Int. J. Fatigue 2012, 40, 43–50. [Google Scholar] [CrossRef]
  74. Jones, R.; Raman, R.K.S.; Iliopoulos, A.P.; Michopoulos, J.G.; Phan, N.; Peng, D. Additively manufactured Ti-6Al-4V replacement parts for military aircraft. Int. J. Fatigue 2019, 124, 227–235. [Google Scholar] [CrossRef]
  75. Tiffany, C.F.; Gallagher, J.P.; Babish, C.A., IV. Threats to Aircraft Structural Safety, Including a Compendium of Selected Structural Accidents/Incidents; ASC-TR-2010-5002; Aeronautical Systems Center, Engineering Directorate, Wright-Patterson Air Force Base: Dayton, OH, USA, 2010; Available online: https://apps.dtic.mil/sti/tr/pdf/ADA519867.pdf (accessed on 18 April 2025).
Figure 1. Specimen geometry used for the WAAM CP-Ti tests; all dimensions are in mm.
Crystals 15 00544 g001
Figure 2. Geometry of the test specimens highlighting the array of surface-breaking etch notches that were used when testing the wire arc additively manufactured (WAAM) CP-Ti specimens. All dimensions are in mm.
Crystals 15 00544 g002
Figure 3. A plain view of the failure associated with the WAAM CP-Ti specimen.
Crystals 15 00544 g003
Figure 4. View of the failure and the surface-breaking defect from which the crack initiated. The well-defined marker bands enabled the crack growth history to be determined using quantitative fractography.
Crystals 15 00544 g004
Figure 5. The computer-aided design (CAD) model of the CP-Ti test specimen.
Crystals 15 00544 g005
Figure 6. The fine mesh: 54,932 ten-node iso-parametric solid elements and 87,934 nodes.
Crystals 15 00544 g006
Figure 7. The maximum principal stress at a remote load of 50 kN; the stress units are in MPa. The stress field at the location where the crack(s) nucleated in the two analyses was found to differ by less than 1.86%.
Crystals 15 00544 g007
Figure 8. The measured and computed curves associated with the lead crack.
Crystals 15 00544 g008
Figure 9. Measured and predicted upper-bound da/dN versus ∆K curves associated with the growth of small cracks in AM Inconel 718 built using two different AD processes, viz., EBM and SLM [51].
Crystals 15 00544 g009
Figure 10. Specimen 300M1 before and after the test.
Crystals 15 00544 g010
Figure 11. High-magnification view of the failure surface associated with Specimen 300M1.
Crystals 15 00544 g011
Figure 12. SEM picture of the nucleation site for Specimen 300M1.
Crystals 15 00544 g012
Figure 13. The measured and predicted crack growth histories associated with the fastest growing crack in Specimen 300M1.
Crystals 15 00544 g013
Figure 14. Mesh 2: 221,350 ten-noded iso-parametric tetrahedral elements and 385,659 nodes.
Crystals 15 00544 g014
Figure 15. The maximum principal stress for Specimen 300M1 at a remote load of 112.83 kN. The stress units are in MPa. The stress field at the location where the crack(s) nucleated in the two analyses was found to differ by less than 1.92%.
Crystals 15 00544 g015
Figure 16. Specimen 300M3 before and after the test.
Crystals 15 00544 g016
Figure 17. High-magnification view of the failure surface associated with Specimen 300M3.
Crystals 15 00544 g017
Figure 18. SEM picture of the nucleation site associated with Specimen 300M3.
Crystals 15 00544 g018
Figure 19. The measured and predicted crack growth histories associated with the fastest growing crack in Specimen 300M3.
Crystals 15 00544 g019
Figure 20. Specimen 300M4 before and after the test.
Crystals 15 00544 g020
Figure 21. A high-resolution optical view of the dominant crack for Specimen 300M4.
Crystals 15 00544 g021
Figure 22. SEM picture of the nucleation site associated with Specimen 300M4.
Crystals 15 00544 g022
Figure 23. The measured and predicted crack growth histories associated with the fastest growing crack in Specimen 300M4.
Crystals 15 00544 g023
Disclaimer/Publisher’s Note: The statements, opinions and data contained in all publications are solely those of the individual author(s) and contributor(s) and not of MDPI and/or the editor(s). MDPI and/or the editor(s) disclaim responsibility for any injury to people or property resulting from any ideas, methods, instructions or products referred to in the content.

