1. Introduction
Aluminum alloy sheets are paramount in the automotive industry’s production of lightweight vehicles. These materials are preferred to reduce the weight of vehicles, thereby improving fuel efficiency and reducing carbon emissions. Moreover, the high strength-to-weight ratio, good formability, corrosion resistance, and recyclability potential of aluminum alloy sheets render them an optimal substitute for higher-density materials, such as steel [
1,
2,
3]. The utilization of aluminum alloy sheets within the automotive industry is experiencing a marked increase, particularly in the domain of vehicle body components, including hoods, trunk lids, and doors. In light of these utilization domains, automotive manufacturers seek to enhance fuel economy by decreasing the overall mass of vehicles and adhering to novel fuel economy regulations [
4,
5]. Sheet metal materials have a wide range of applications in various industries, including the automotive, aerospace, and construction sectors. The accurate prediction of material behavior and the optimization of process parameters are paramount during the forming and deformation of these materials. It is imperative to comprehend the deformation of materials under mechanical loading and the mechanisms of damage that occur at the culmination of the deformation process. This knowledge is paramount for ensuring the reliability and efficiency of manufacturing processes [
6]. In this context, plastic and damage models are instrumental in predicting the behavior and deformation of sheet metal materials during the forming process [
7,
8].
The Johnson–Cook (J-C) plasticity and damage model is a widely used method for metal forming and deformation processes, especially those operating under high strain rates and varying temperature conditions [
9]. The Johnson–Cook model has demonstrated high effectiveness in predicting material damage because it incorporates the effects of temperature and strain rate, as well as plastic deformation, into its prediction calculations [
10]. The model is composed of three fundamental components: material constants, strain rate, and temperature. The components in question reflect the mechanical behavior of the material under different operating conditions. As such, they enable the model to be used in a wide range of applications [
9].
As stated in the extant literature, the Johnson–Cook model utilizes a strain-, strain-rate-, and temperature-dependent phenomenological approach for the purpose of modeling the deformation and fracture behavior of metallic materials. This model boasts a wide range of applications, including experimental and numerical studies in a variety of material groups. A review of the extant literature reveals that similar studies have been conducted. Seo et al. conducted an analysis of the fracture strain in 304 austenitic stainless steel under varying strain rates and multiaxial stress conditions using the J-C model. The study’s findings indicated that the model demonstrated a prediction accuracy of less than 20% for fracture strains [
11]. Similarly, Khare et al. examined the deformation behavior of armor steels at elevated temperatures and strain rates. They employed the J-C model and demonstrated that it performed in accordance with the experimental outcomes [
12]. Wang et al. conducted an analysis of the effect of the stress triaxiality ratio on fracture strain in specimens with different notch geometries and reported that the J-C model successfully simulated deformation and fracture behavior [
13]. Nasri et al. employed the J-C model to analyze the fracture behavior of A1050 aluminum alloy across a broad temperature range and then validated the accuracy of the model through finite element analysis [
14]. Yapan et al. conducted a study to examine the fracture behavior of the Ti6Al4V alloy under the conditions of hydroforming and sheet-forming processes. The utilization of LS-OPT optimization software was instrumental in the calibration of J-C plasticity and damage parameters [
15]. In a similar vein, Wang et al. investigated the AA7075 aluminum alloy, demonstrating that the J-C model accurately predicted the theoretical forming limit curves, aligning with the experimental data [
16]. In the field of steel materials, Tamer et al. conducted a study that analyzed the fracture behavior of 316L stainless steel using the J-C model. Their findings indicated that the model exhibited a high degree of accuracy in predicting forming limit diagrams [
17]. Topilla and Toros utilized the J-C model to predict the fracture behavior of dual-phase (DP) steels. In the study, J-C model parameters were calibrated under varying strain-rate conditions, and the effects of the stress triaxiality ratio on fracture behavior were thoroughly evaluated. The experimental tensile test results were corroborated through the implementation of finite element method (FEM) analyses, which were executed with the assistance of LS-DYNA R11.0 software [
18]. In the study by Mohamed et al., the researchers highlighted the efficacy of the J-C model in predicting outcomes for the AA5754 alloy under uniaxial and plane-strain conditions. However, the model’s performance is suboptimal under balanced biaxial stress conditions [
19]. Zhao et al. investigated the relationship between fracture strain and the stress triaxiality ratio using the J-C model and DP780 dual-phase steels. Their findings demonstrated the efficacy of the model as a tool for analysis [
20]. Hong et al. reported that the J-C model successfully predicted the fracture behavior of the AA7075-T6 aluminum alloy at different temperatures and strain rates. However, the model demonstrated inadequacy in modeling complex fracture behaviors [
21].
A comprehensive review of the extant literature indicates that the Johnson–Cook (J-C) model has a wide range of applications in modeling the deformation and fracture behavior of metallic materials. The J-C model has been demonstrated to offer an efficacious approach for predicting the mechanical properties of materials under varying strain rates, temperatures, and stress states. The model displays high accuracy in uniaxial and plane-strain conditions, but its performance is limited under balanced biaxial stress conditions and high-stress triaxial ratios. In order to surmount the aforementioned limitations, it is imperative to calibrate the J-C model with experimental data and to employ the finite element method (FEM). The implementation of optimization tools such as LS-OPT allows a more precise determination of model parameters and improves the congruence between simulation results and experimental data.
The present study is an experimental investigation of the plastic deformation and fracture behaviors of 6181A-T4 aluminum alloy sheet material. The investigation was conducted at four different strain rates and triaxiality ratios, focusing on the Johnson–Cook plasticity and damage models, and the parameters of the J-C model were determined. This study addresses a significant gap in the literature by presenting an experimental and numerical investigation under varying strain rates and stress triaxiality conditions. The study thereby provides novel insights into the alloy’s deformation and fracture behavior, which is relevant to metal forming applications. In contrast to the extant literature, the damage parameters were optimized using LS-OPT software, and the agreement between these parameters and the experimental data was compared in detail by finite element analysis. Furthermore, the fracture surfaces were examined by scanning electron microscopy, and the effects of strain rate on fracture behavior were investigated at the microstructural level.
3. Johnson–Cook Plasticity and Damage Model
The present study investigates the mechanical response of the 6181A-T4 aluminum alloy. The Johnson–Cook (J-C) plasticity and damage model is implemented to facilitate this investigation. This elasto-viscoplastic material model, integrated into the LS-DYNA R11.0 finite element software, accounts for strain hardening, strain-rate sensitivity, and thermal effects. The equivalent von Mises stress, denoted by σ, is expressed by Equation (2).
In the Johnson–Cook constitutive model, the parameters A, B, n, C, and m characterize the material’s response to plastic deformation. Here, ε
pl denotes the equivalent plastic strain,
represents the equivalent plastic strain rate,
is the reference strain rate, and T is the homologous temperature. The equation under consideration has three multiplicative terms. The first term characterizes the strain hardening behavior, the second term represents the effect of strain rate, and the third term captures the effect of temperature. Within this framework, A denotes the initial yield strength, B is the strain hardening coefficient, n is the strain hardening exponent, C corresponds to the strain rate sensitivity coefficient, and m defines the thermal softening exponent. The dimensionless plastic strain rate
and the normalized (homologous) temperature
are defined by Equation (3) and Equation (4), respectively. In these expressions,
denotes the effective plastic strain rate, T is the temperature at which deformation occurs, and T
m is the melting temperature of the material. ε
ref and T
ref represent the reference strain rate and reference temperature used for normalization [
24,
25].
The Johnson–Cook (J-C) damage criterion estimates the fracture strain as a function of stress triaxiality, strain rate, and temperature, as expressed in Equation (5). The constants D1, D2, and D3 quantify the effect of stress triaxiality on the effective plastic strain at fracture, while D4 and D5 describe the material’s sensitivity to strain rate and temperature, respectively.
The study was conducted entirely at room temperature, thereby eliminating the effects of temperature variations. As a result, the homologous temperature () and temperature-related parameters, such as the thermal softening factor (m) and D5, do not have an impact in this study.
The Johnson–Cook plasticity model parameters—A, B, n, and C values—were determined analytically by the curve fitting method. The A value represents the yield strength and was obtained by applying 0.2% offset to the tensile curve obtained at the reference deformation rate. By focusing on the plastic region of the stress–strain curve, the work hardening parameters A, B, and n can be determined using a curve fitting approach [
25], as illustrated in
Figure 3 and
Figure 4. Under the reference strain-rate conditions and room temperature, Equation (6) simplifies to the following form:
For the determination of parameter C, after the determination of parameters A, B, and n,
versus
is generated in the graph. A linear regression analysis is then performed using a first-order model with the intercept constrained to 1, utilizing flow stress data acquired at four different strain rates. The slope of the fitted line is used to determine the strain rate sensitivity coefficient C [
26].
The LS-DYNA material model MAT015-JOHNSON_COOK, which incorporates both plasticity and damage behavior, was employed in the finite element (FE) analyses. A total of sixteen finite element simulations were conducted, corresponding to four different strain rates (0.0083 s−1, 0.0416 s−1, 0.166 s−1, and 0.333 s−1) and four specimen configurations, characterized by varying stress triaxiality levels (0.33, 0.36, 0.45, and 0.74). To isolate the influence of the damage-related parameters, the previously calibrated hardening parameters were kept constant throughout the optimization process.
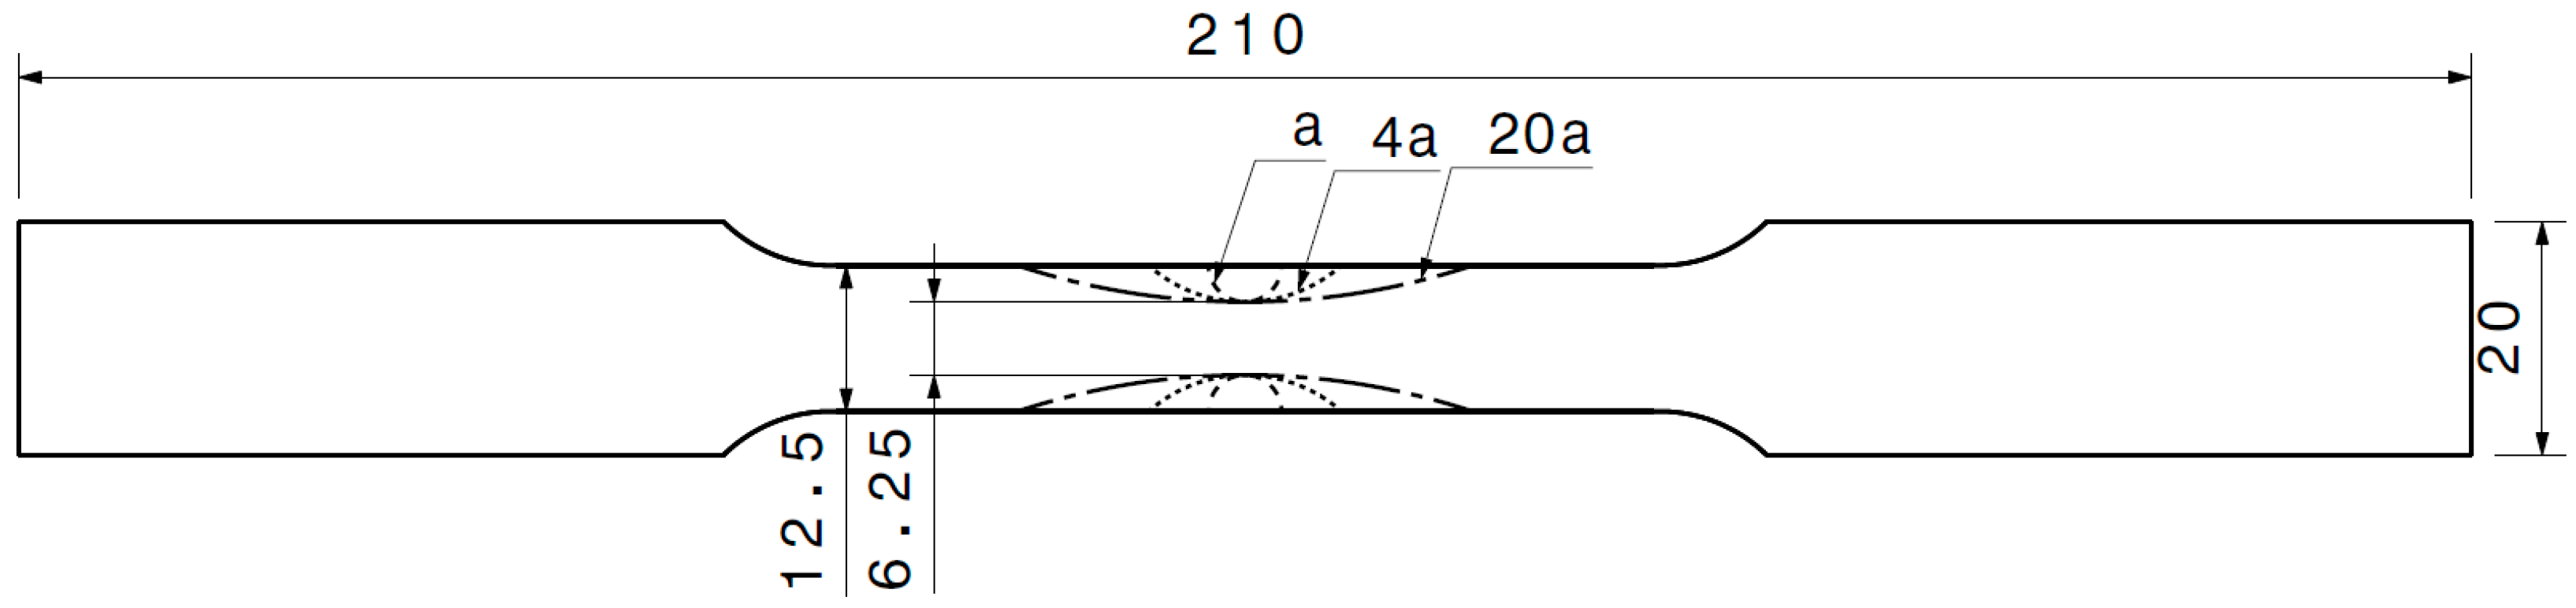
The finite element models were developed for four different tensile specimen types: smooth (unnotched), 20a-notched, 4a-notched, and a-notched. All models utilized four-node quadrilateral shell elements, which were defined through the utilization of the *ELEMENT_SHELL keyword. The smooth specimen model consisted of 1139 shell elements and 1246 nodes, while the 20a-notched, 4a-notched, and a-notched specimens comprised 2111 elements with 2252 nodes, 806 elements with 896 nodes, and 544 elements with 624 nodes, respectively. An adaptive meshing strategy was implemented, with the minimum mesh size refined to 0.5 mm in regions anticipated to undergo substantial plastic deformation. This localized refinement enables the accurate resolution of stress and strain gradients, thereby improving the reliability of numerical predictions in critical deformation zones.
The damage criterion parameters (D1, D2, D3, and D4) were designated as the variables to be optimized. The optimization procedure follows a structured approach in which LS-OPT utilizes experimentally obtained stress–strain curves from different specimen configurations that have different triaxialities to identify the appropriate parameters for the Johnson–Cook (J-C) model. The initial damage values used in the LS-OPT-based optimization process were obtained by analyzing tensile test results from specimens with varying stress triaxiality. The true stress–strain responses of specimens exhibiting varying stress triaxiality are given in
Figure 5.
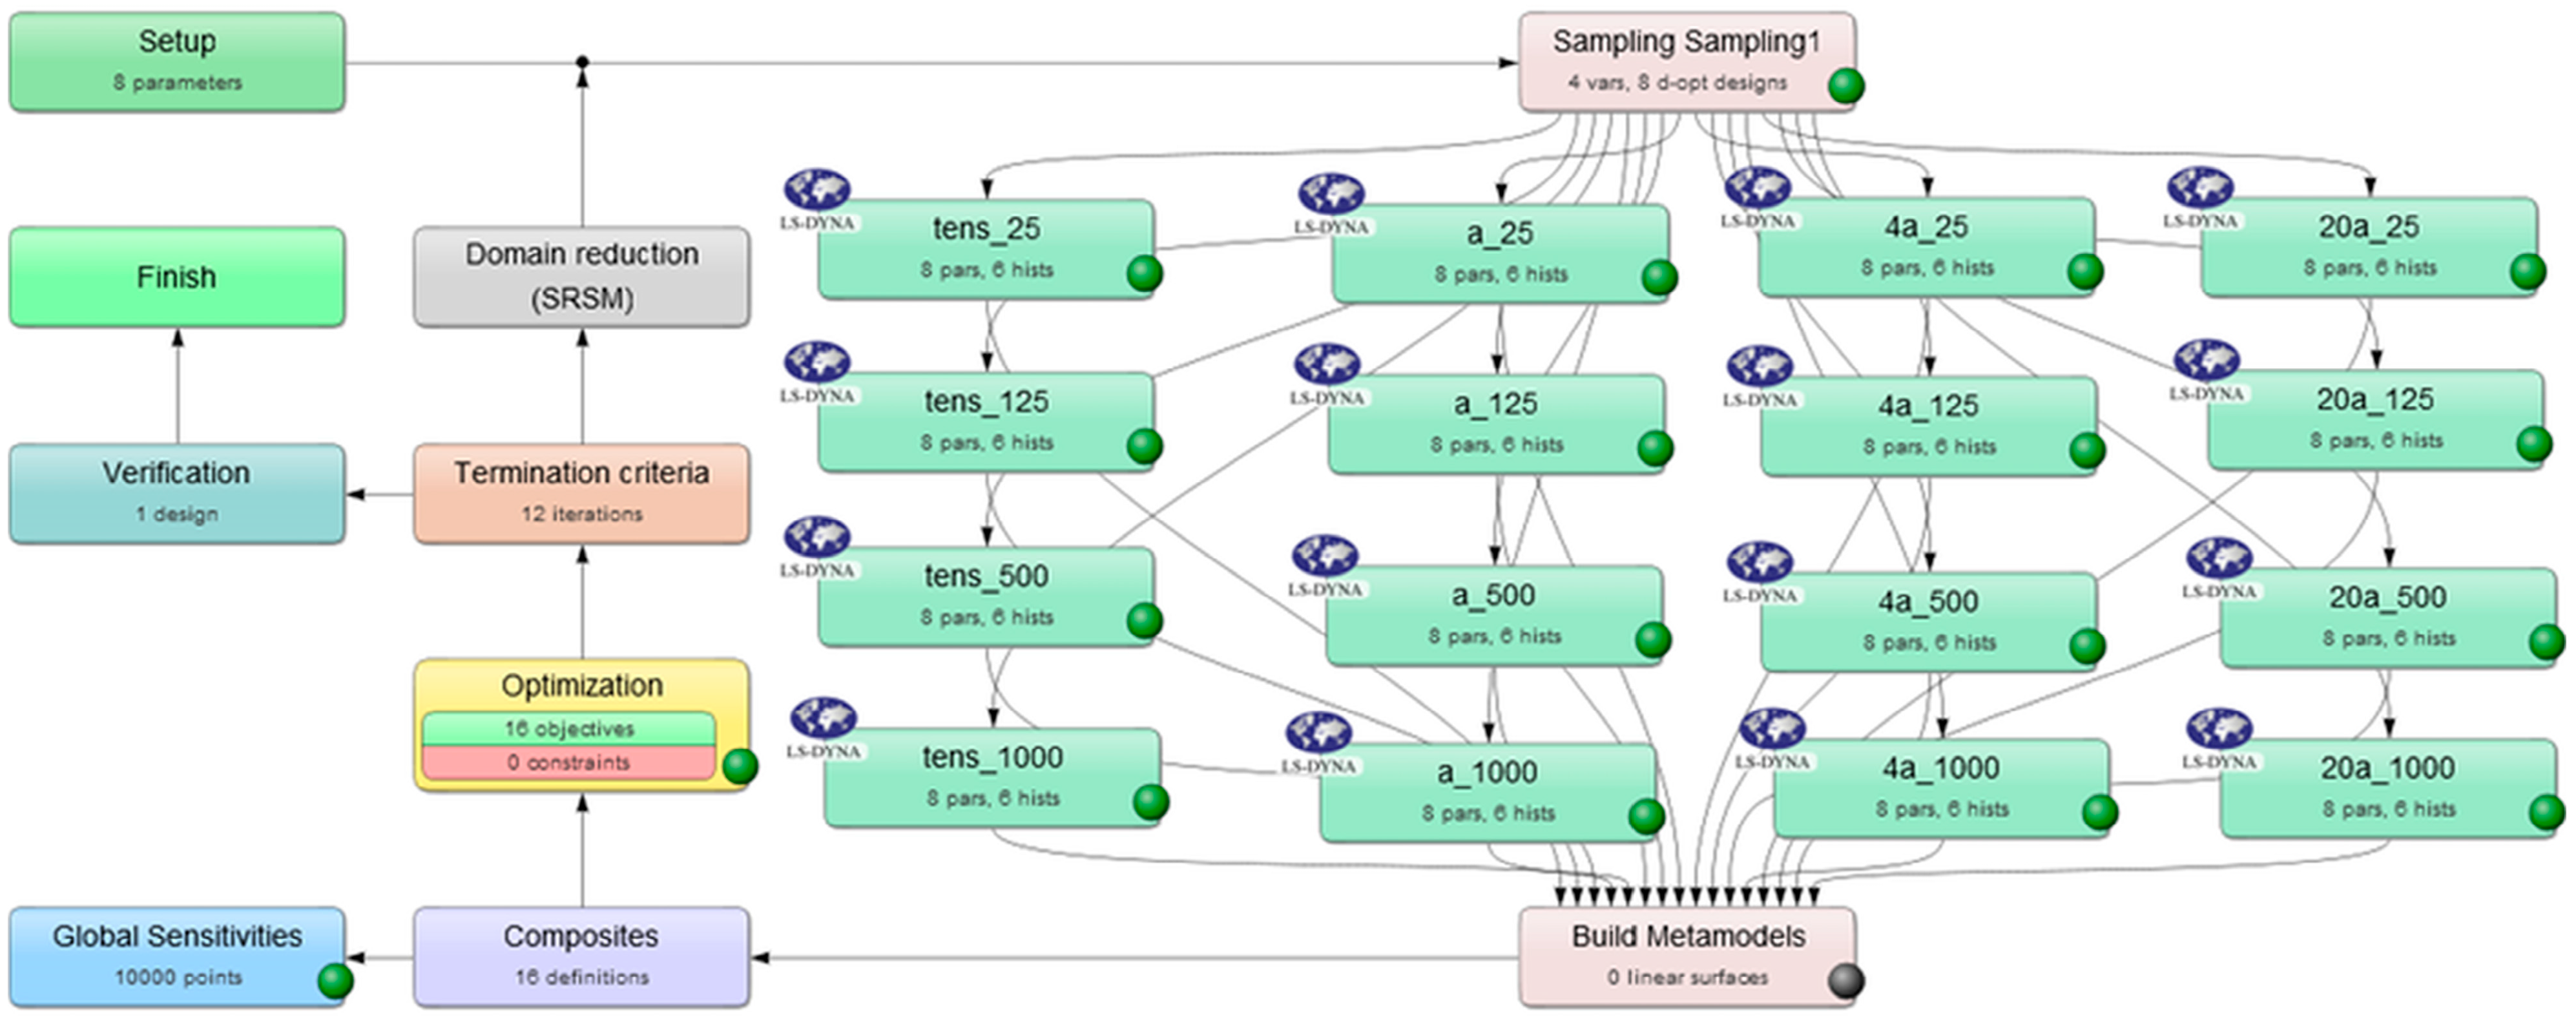
The calibration of the Johnson–Cook damage parameters was conducted using a combination of LS-OPT and LS-DYNA simulations, with the objective of minimizing the mean squared error between the experimental and simulated stress–strain curves. A design of experiments approach was implemented to systematically sample the parameter space, and a response surface methodology was employed to guide the optimization process. The convergence of the system was determined by minimal variation in the objective function and parameter values over successive iterations, ensuring both numerical accuracy and stability. The core objective of the optimization is to determine the optimal parameter set by minimizing the deviation between the numerical and experimental stress–strain responses, with the experimental data serving as the target function. Both the J-C hardening and damage parameters are treated as optimization variables, each confined within a predefined range. Finite element (FE) simulations are conducted for each parameter set, and the resulting engineering stress–strain curves computed via LS-DYNA constitute the responses used for optimization evaluation. The optimization structure for the determination damage parameter is given in
Figure 6. The determination of the damage parameters was carried out according to the methodology established in the study by Yapan et al. [
15]. As illustrated in
Table 3, the J-C plasticity damage parameters for the 6181A-T4 aluminum alloy were determined.
4. Results and Discussion
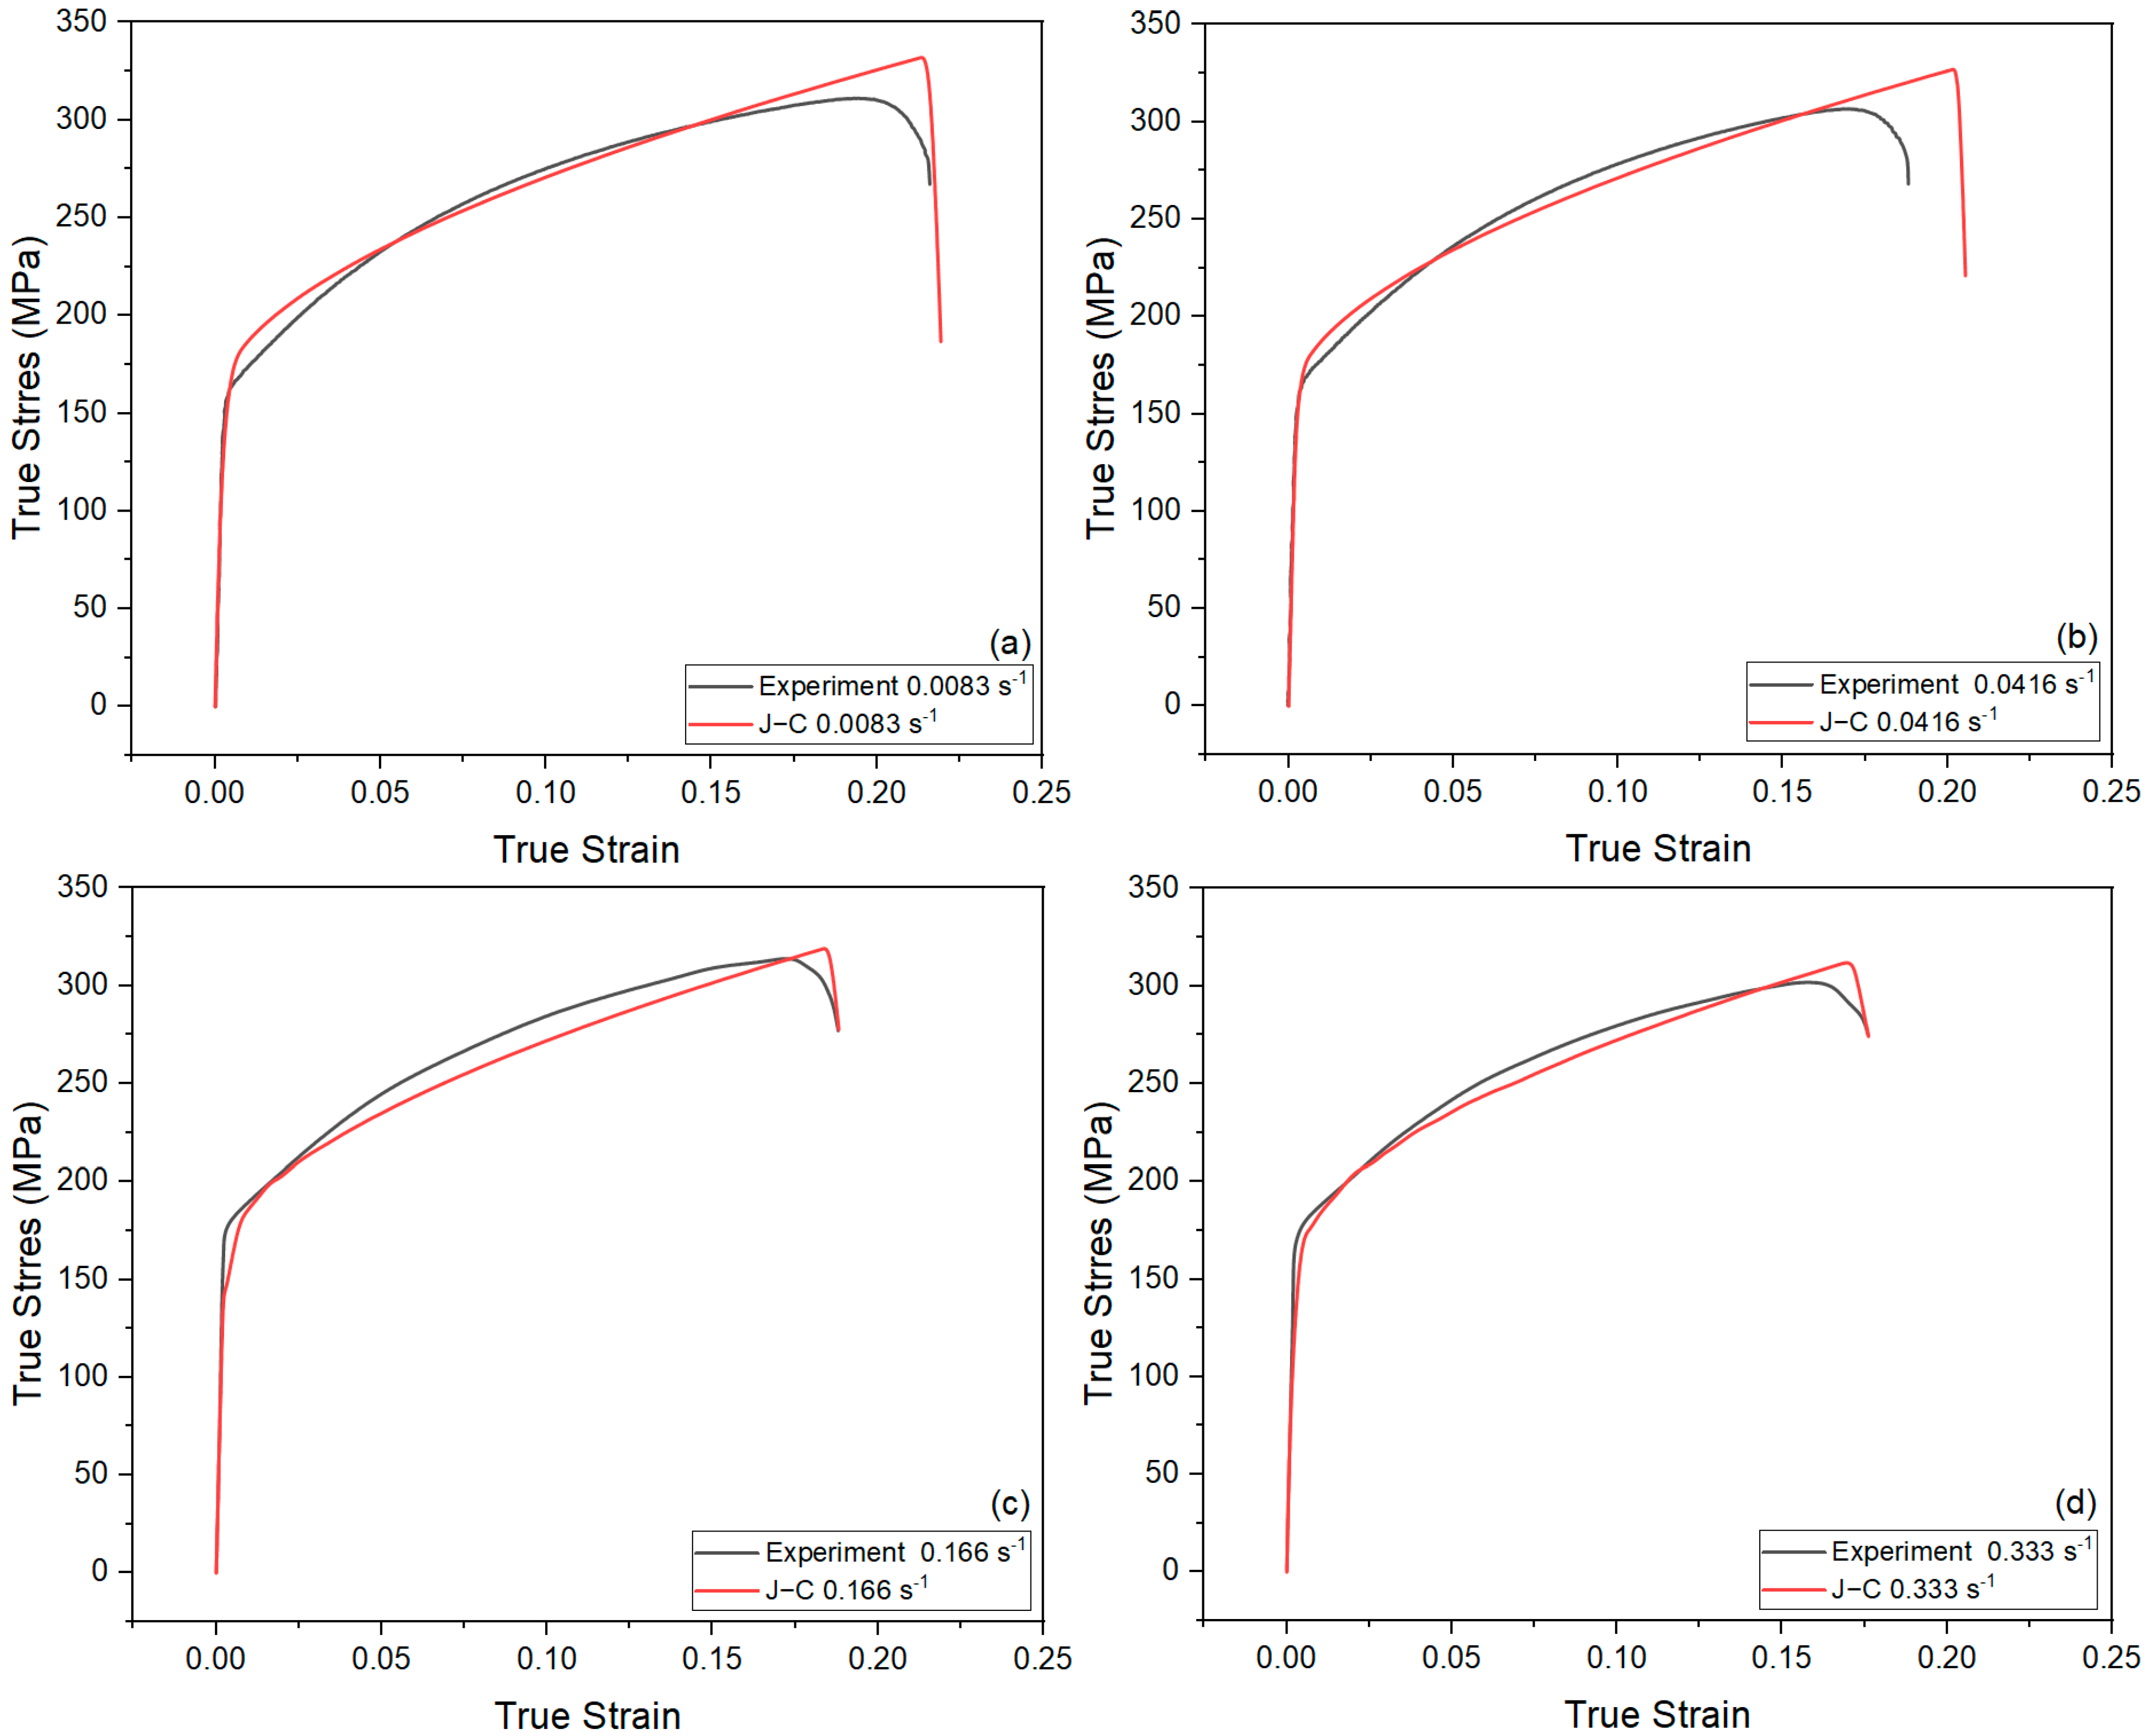
In this study, experimental tensile test results and tensile test simulation results obtained using the Johnson–Cook (J-C) plasticity and damage model for the 6181A-T4 aluminum alloy were compared with four different strain rates (0.0083 s
−1, 0.0416 s
−1, 0.166 s
−1, and 0.333 s
−1). Therefore, an evaluation was conducted to evaluate the predictive performance of the J-C plasticity and damage model. As shown in
Figure 7, the results of the tensile test and the tensile test simulation are presented. The tensile test was performed according to the J-C plasticity and damage model. Increasing the strain rate has been shown to generally increase yield and tensile strength while decreasing elongation [
27]. Upon a thorough examination of
Figure 7, a high agreement is found between the J-C model and the experimental results obtained from the tensile tests performed at a strain rate of 0.0083 s
−1. As the deformation transitioned from the elastic to the plastic region, the J-C model demonstrated an exceptional level of accuracy in predicting the yield strength. In the plastic deformation region, it is observed that the stress values of the model demonstrate a high agreement with the experimental data. However, while a slight deviation was noted near the fracture, it was observed that the J-C model parameters predicted the mechanical behavior of the material with reasonable success at a strain rate of 0.0083 s
−1. At a strain rate of 0.0416 s
−1, the experimental curve demonstrates a high agreement with the J-C model, showing a strong correlation both in the elastic region and in the initial stages of plastic deformation. The model demonstrated an ability to accurately predict the yield strength and stress values within the plastic deformation region. In the later stages of plastic deformation, a slight deviation in the stress values of the model was observed in the region proximate to the fracture point. At 0.166 s
−1, the J-C model demonstrated an accurate representation of the elastic region and yield strength; however, there was a slight increase in the discrepancy with the experimental data in the plastic deformation region. It was observed that the model exhibited a tendency to underestimate stress values, particularly in the later stages of plastic deformation. However, the overall trend up to the point of fracture largely corresponds to the experimental curve. This demonstrates that, at a strain rate of 0.166 s
−1, the J-C model accurately predicts the strain-rate-dependent plastic behavior. The J-C model demonstrates a high efficiency in the elastic region at a strain rate of 0.333 s
−1. In the plastic deformation region, it is observed that the model predicts stress values that decrease slightly compared to the experimental data. As the fracture point was approached, the model’s curvature exhibited a congruence with the experimental data, thereby demonstrating an effective predictive capacity. The model demonstrates a high accuracy at strain rates of 0.0083 s
−1, 0.166 s
−1, and 0.333 s
−1. At a strain rate of 0.0416 s
−1, variations from the expected results were observed in the plastic deformation zone and the ductility. In general, the J-C model successfully predicted the actual stress–strain curves obtained from the tensile tests at different strain rates for the aluminum alloy 6181A-T4. These results suggest that the model is highly reliable in accurately representing the plastic deformation behavior of alloy 6181A-T4.
To evaluate the results presented in
Figure 7 from a statistical point of view, the present study attempted to analyze the agreement between the Johnson–Cook model and the experimental data. To this aim, the coefficient of determination (R
2) values of the tensile curves obtained at different strain rates and the simulation results obtained using the J-C model in finite element analyses were examined. At a strain rate of 0.0083 s
−1, the model demonstrated an R
2 value of 0.9143, indicating a satisfactory fit to the experimental data. At a strain rate of 0.0416 s
−1, the R
2 value exhibited a decline to 0.8601, accompanied by a concomitant decrease in the model’s prediction accuracy at this rate. At a strain rate of 0.166 s
−1, the coefficient of fit was determined to be R
2 = 0.9578. The value of R
2 was determined to be 0.9837 at the highest strain rate of 0.333 s
−1. This outcome indicates that the model exhibits a substantial level of agreement with the experimental data. These results demonstrate that the J-C model, a material model, has the ability to predict experimental data with a high level of accuracy in the context of uniaxial tensile behavior.
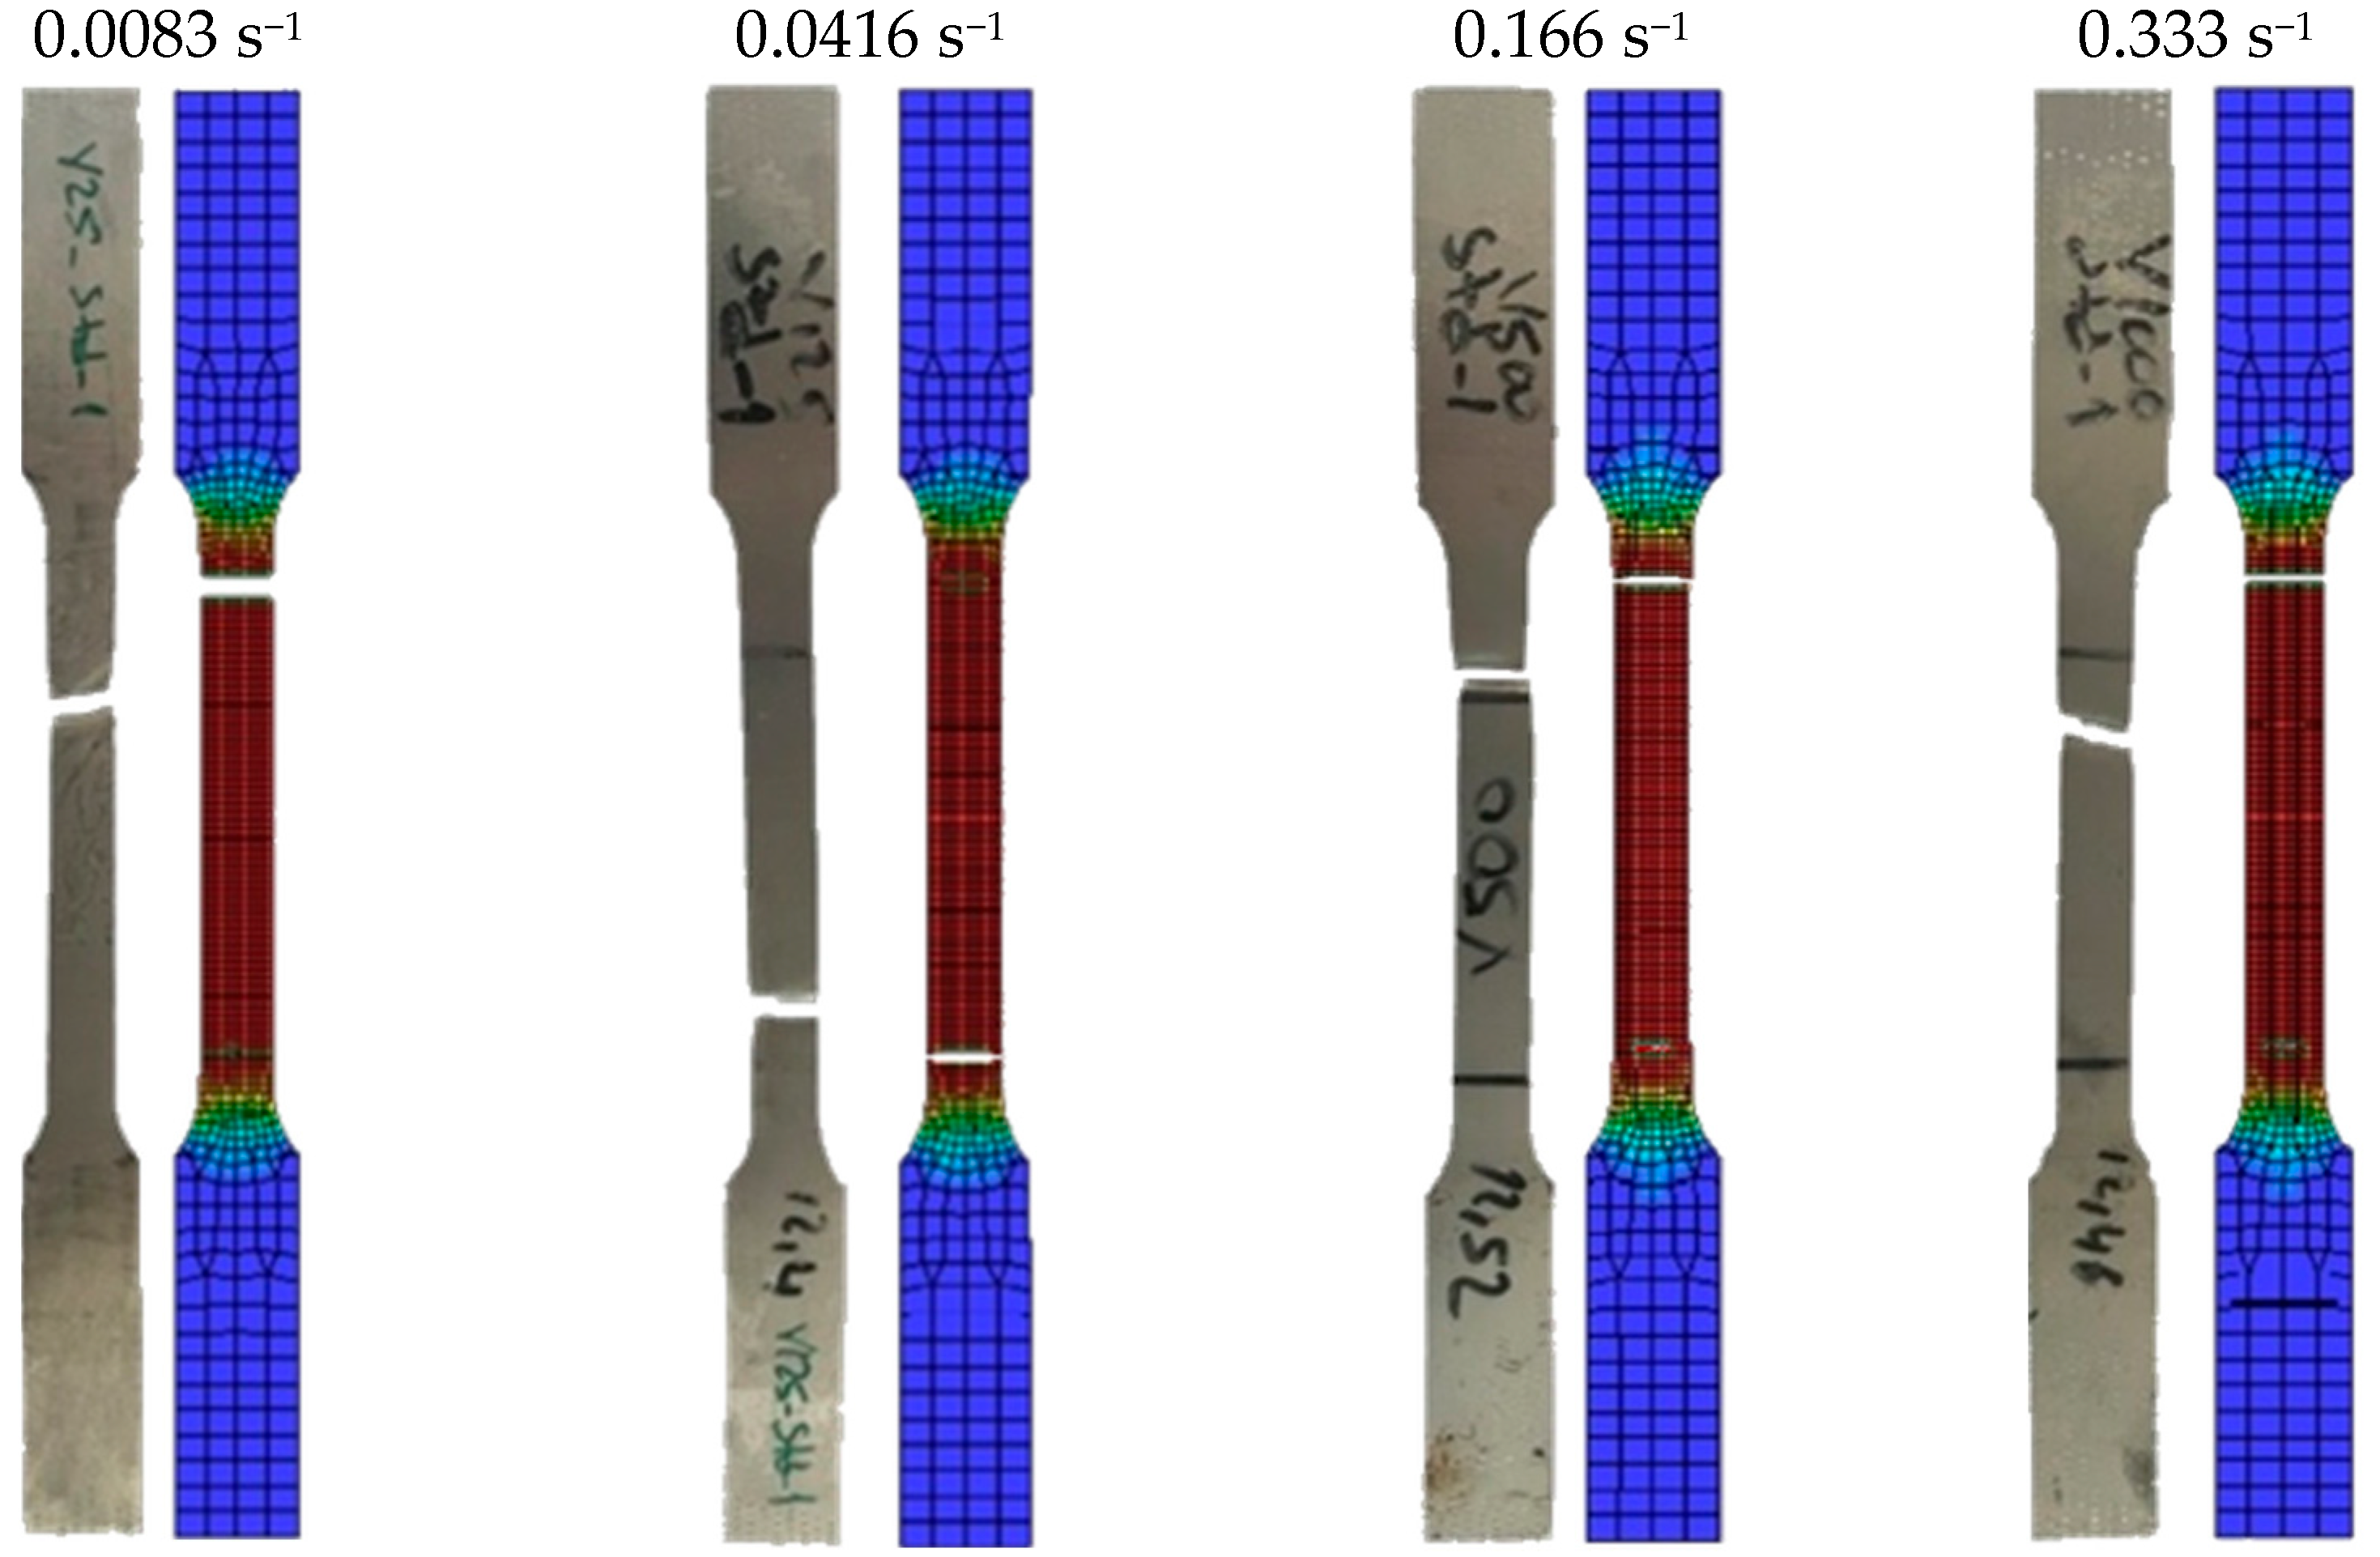
As seen in
Figure 8, a comparative analysis is performed between the experimental results of the tensile tests and the simulations using the J-C model to elucidate the changes in the fracture behavior of the material as a function of strain rate at the macroscale. At the 0.0083 s
−1 strain rate, a large necking region and ductile fracture are observed in the experimental specimen. The fracture location occurred near the center of the specimen. The J-C model exhibited satisfactory accuracy in predicting the experimental fracture location and necking width at this strain rate. However, while the fracture surface and plasticity effects were more pronounced in the experimental specimen, the simulation distributed the deformation more homogeneously. The necking of the experimental specimen appears to be concentrated in a narrower region at the strain rate of 0.0416 s
−1. Despite the fracture position remaining in the central region of the specimen, the plastic deformation appears to be more localized. In the J-C model, while the prediction of the fracture location is highly accurate, the width of the necking zone does not precisely align with the experimental outcomes. In the simulation, the strain distribution is relatively wider. The fracture in the experimental specimen exhibited a more brittle mode of fracture at the strain rate of 0.166 s
−1, and was concentrated in a very narrow area. The necking area is indicative of the fact that the deformation is clearly concentrated in the center of the specimen. The J-C model demonstrated a high efficiency in predicting strain concentration and fracture location at this deformation rate. At the strain rate of 0.333 s
−1, the J-C model accurately predicted the experimental fracture position and the overall strain concentration, but could not accurately simulate the geometrical details of the post-fracture surface and the mechanisms of sudden fracture. A comparison of the experimental and simulation results indicates that the J-C model demonstrates a general capacity to accurately predict fracture behavior at varying strain rates on a macro level. It is proposed that enhancing the sensitivity of the finite element analysis can substantially enhance the congruence between the simulation outcomes and the experimental data, as well as the visual accuracy. In this regard, the use of a finer mesh structure is believed to allow for a more accurate modeling of strain concentration and deformation distribution, especially in the fracture zone.
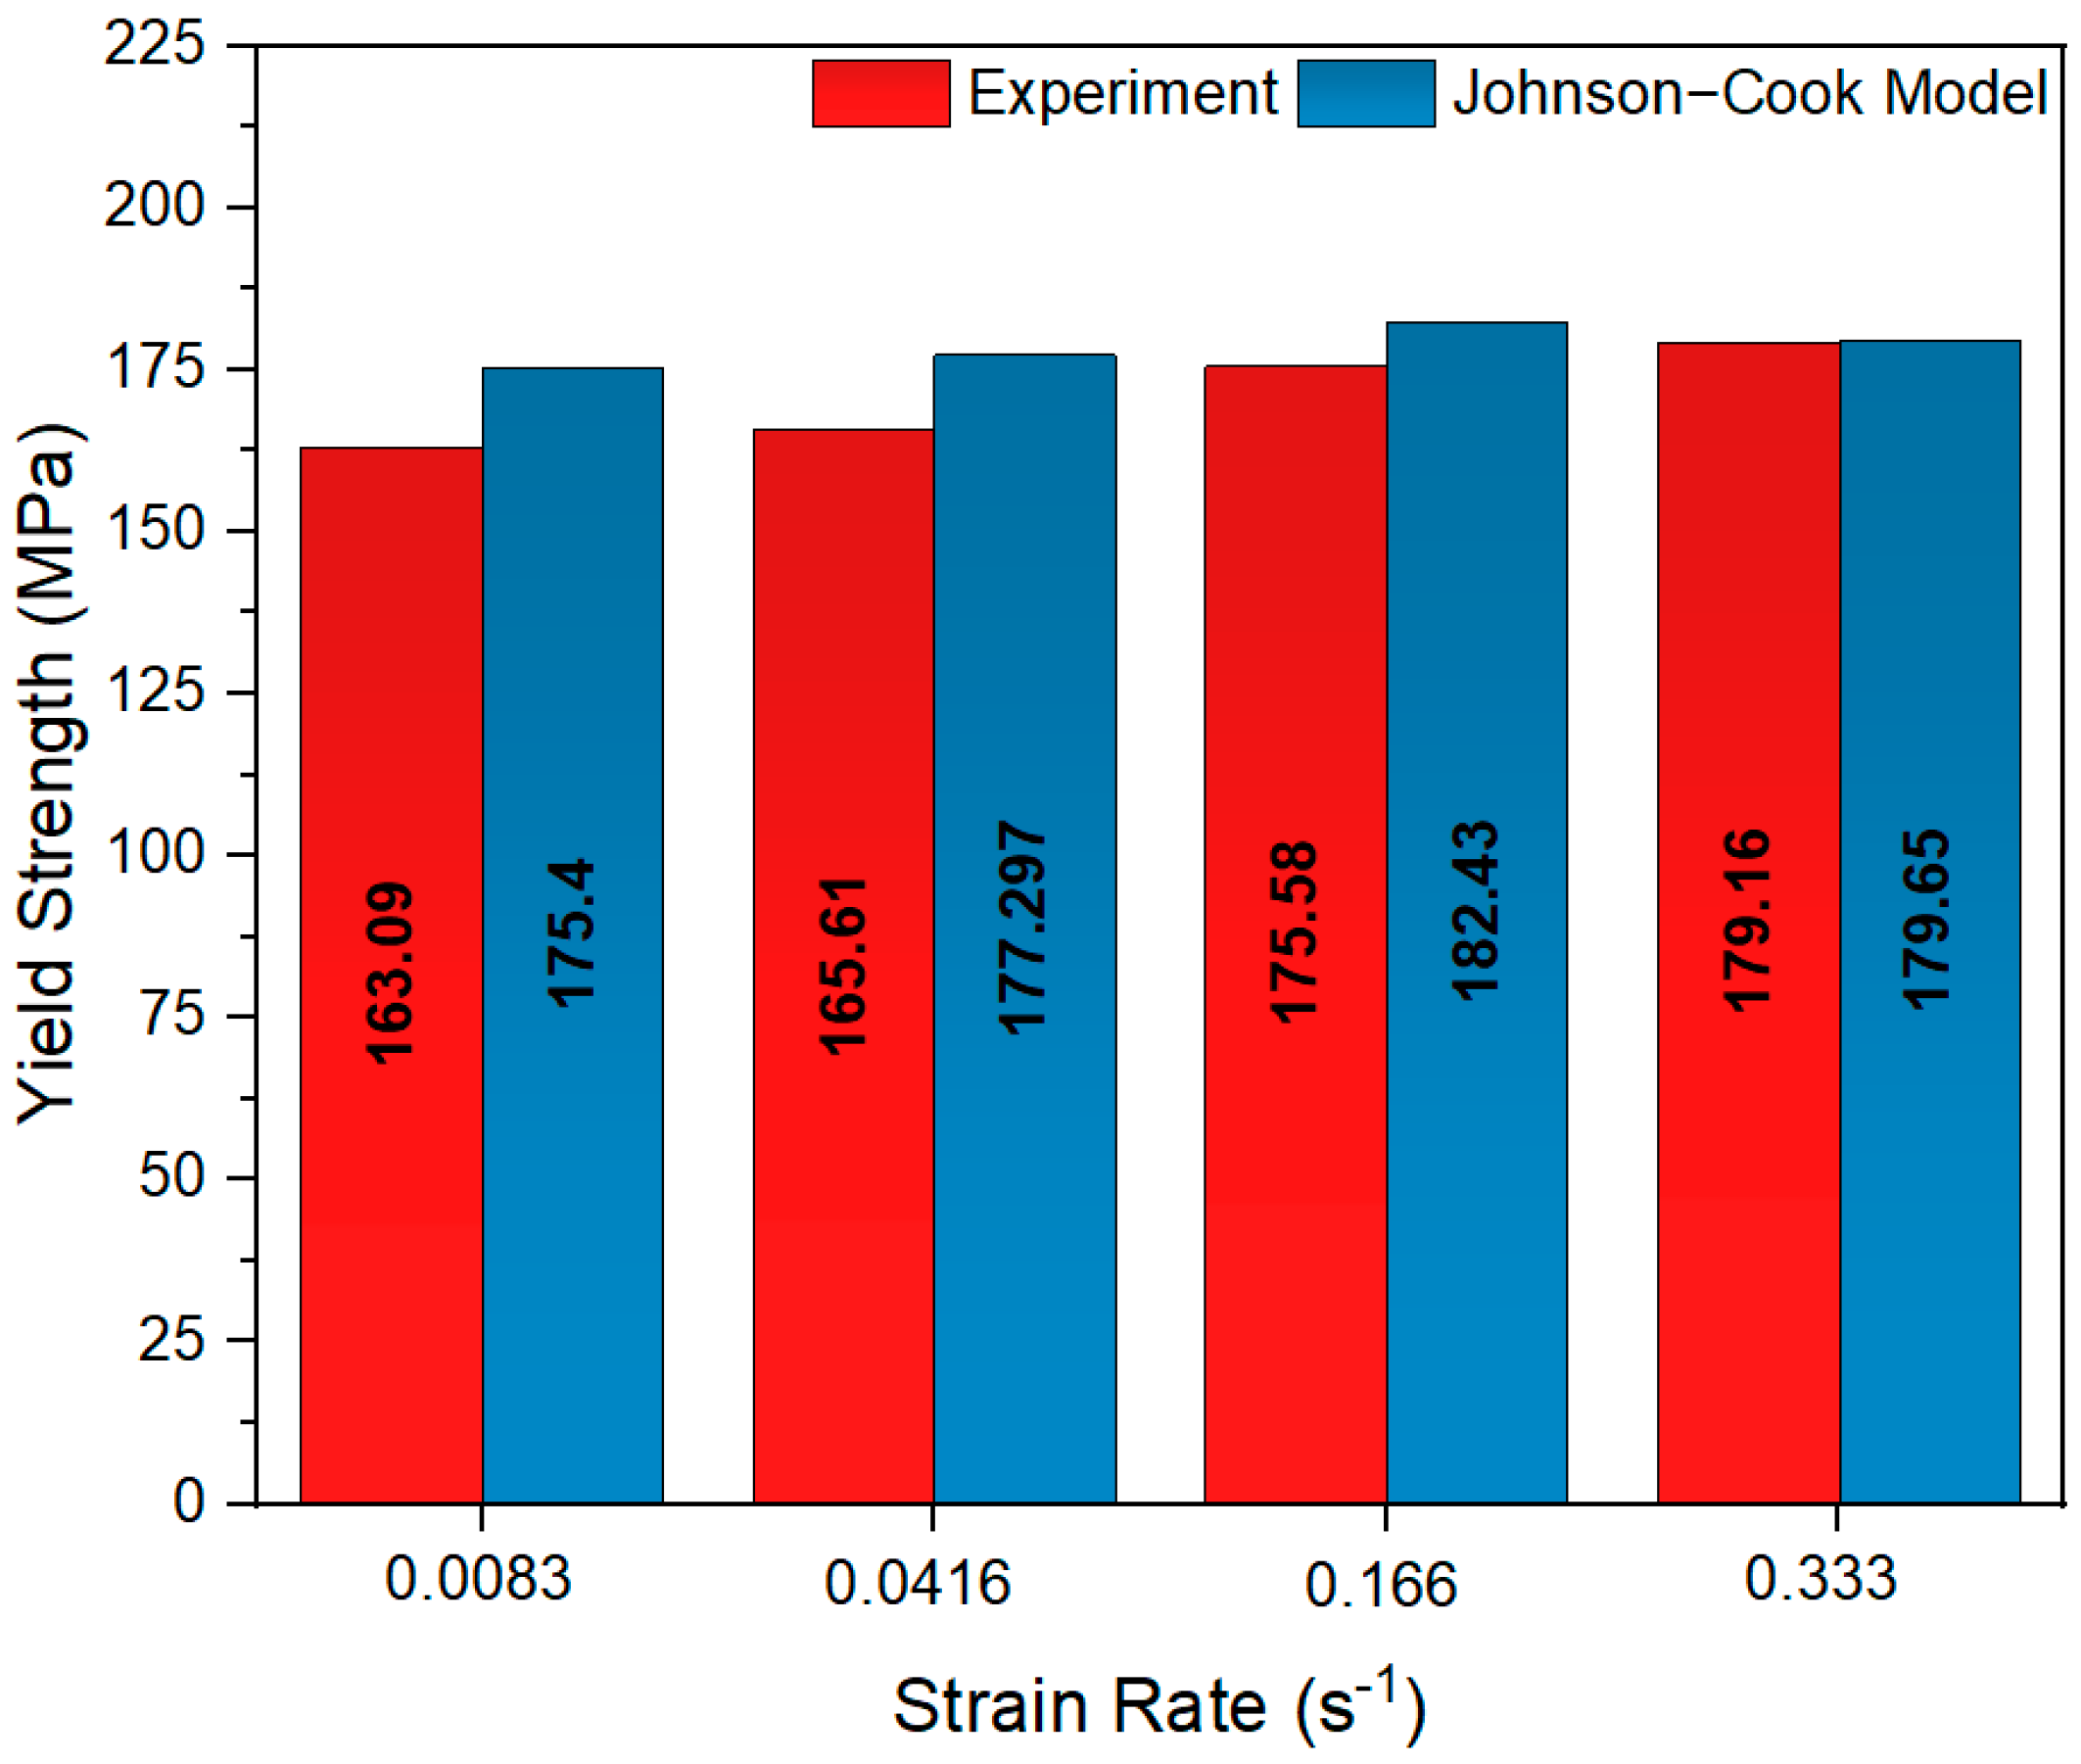
As
Figure 9 shows, the yield strength values of the 6181A-T4 aluminum alloy at four different strain rates (0.0083 s
−1, 0.0416 s
−1, 0.166 s
−1, and 0.333 s
−1) were compared with the experimental results and Johnson–Cook (J-C) model predictions. In the case of heat-treated aluminum alloys, an increase in yield and tensile strength is observed. This phenomenon can be attributed to the rise in strain rate, which is a consequence of the limitation of dislocation movement due to precipitation hardening [
28]. At a strain rate of 0.0083 s
−1, the J-C model’s predicted yield strength values demonstrated a high agreement with the experimental results. The experimental yield strength was measured to be 163.09 MPa, while the J-C model predicted a value of 175.4 MPa. The error rate was calculated to be 7.55%. The observed discrepancy can be attributed to the strain hardening parameters (A, B, n), which serve to define the initial model values. The Johnson–Cook model is predicated on empirical mathematical formulations; consequently, microstructural mechanisms such as dislocation interactions, dynamic recovery, and localized strain accumulation are not explicitly incorporated. It is particularly evident that, at higher strain rates, where such effects become more significant, the model may not fully capture the complexity of the material’s deformation behavior. This limitation may provide a partial explanation for the observed deviations between the experimental and simulated stress–strain responses. However, the slight scatter effect observed in the experimental curve results in a slight overestimation of the yield strength by the model. At a strain rate of 0.0416 s
−1, the experimental yield strength was measured at 165.61 MPa, while the J-C model predicted a value of 177.29 MPa. The error rate was determined to be 7.06%, and it was observed that the strain hardening effect of the material increased with an increase in strain rate. However, the J-C model exhibits a slight tendency to overestimate the strain-rate effect and the stress value derived from the experimental results. Furthermore, at the strain rate of 0.0416 s
−1, the local effect of dislocation motions in the material and the heterogeneous distribution in the microstructure may be the sources of the discrepancy between the experimental values and the model. At a strain rate of 0.166 s
−1, the experimental yield strength was determined to be 175.58 MPa, while the J-C model predicted a value of 182.43 MPa. The error rate was 3.90%, and the model’s accuracy exhibited a substantial improvement. It has been observed that under these strain-rate conditions, the strain-rate hardening effect becomes apparent and the yield strength experiences an increase. The J-C model demonstrated a high efficiency in predicting these effects, showing strong agreement with the experimental data during the plastic deformation process. Nonetheless, the minor discrepancies are believed to be attributable to the absence of consideration for microstructural variations and localized deformation regions that may arise under experimental conditions. Consequently, the deformation process is regarded as an average behavior, as the model does not directly account for these factors. At a strain rate of 0.333 s
−1, the experimental yield strength was measured to be 179.16 MPa, and the J-C model predicted this value to be 179.65 MPa. The error rate was found to be 0.27%, and it was observed that the model provides a high level of accuracy at high deformation rates. At higher strain rates, the strain-rate hardening effect reaches its maximum level, thereby maximizing the yield strength. At this strain-rate value, it was observed that the J-C model accurately represented the strain-rate effect and agreed with the experimental data.
As illustrated in
Figure 10, a comparison is made between the tensile strength values that were obtained through experimental means and the values that were predicted by the Johnson–Cook (J-C) model. It is a common principle in the field that tensile strength is expected to increase with an increase in strain rate. Nonetheless, given the material’s low strain-rate sensitivity and the fact that the strain-rate range falls within quasi-static values, it is conceivable that the tensile strength may not show a significant increase in response to an increase in strain rate [
29]. In cases where the strain-rate value exceeds a certain threshold, a decrease in the hardening effect can be observed. This phenomenon is attributed to two processes: thermal softening and dislocation recovery due to local heating in the material. At the same time, a decrease in tensile strength can be observed [
30,
31,
32]. At a strain rate of 0.0083 s
−1, the tensile strength predicted by the J-C model is approximately 10 MPa higher than the experimental data. The error rate was determined to be 3.31%. This error rate is at an acceptable level. At the 0.0416 s
−1 strain rate, the tensile strength was measured to be 308.92 MPa, while the J-C model predicted a value of 332.32 MPa. The error rate was calculated to be 7.58%. It is hypothesized that the local strain intensity in the plastic deformation zone of the material at these deformation rates may slightly reduce the experimental tensile strength. However, the J-C model is unable to fully predict this effect and may overestimate the tensile strength. At a strain rate of 0.166 s
−1, the experimental and J-C model tensile strength values exhibited a high closeness, with a calculated error rate of 1.87%. While the experimental tensile strength was 311 MPa, the J-C model predicted a value of 316.84 MPa. In this instance, an enhancement in tensile strength was observed, attributable to an augmentation in strain hardening. The J-C model exhibited a high degree of efficacy in calculating this effect and predicting tensile strength with a high accuracy. At a strain rate of 0.333 s
−1, the experimental tensile strength was measured at 302.91 MPa, while the J-C model predicted a value of 325.34 MPa. The error rate was determined to be 7.41%. It is assumed that the tensile strength of the material will increase due to the strain-rate hardening effect, as observed in tests conducted at higher strain rates; however, the presence of local instabilities in the microstructure and the initiation of cracks in the experimental results may result in a slight decrease in tensile strength. Conversely, the J-C model tends to overestimate tensile strength by relying on numerical trends derived from mathematical equations to assess strain-rate effects.
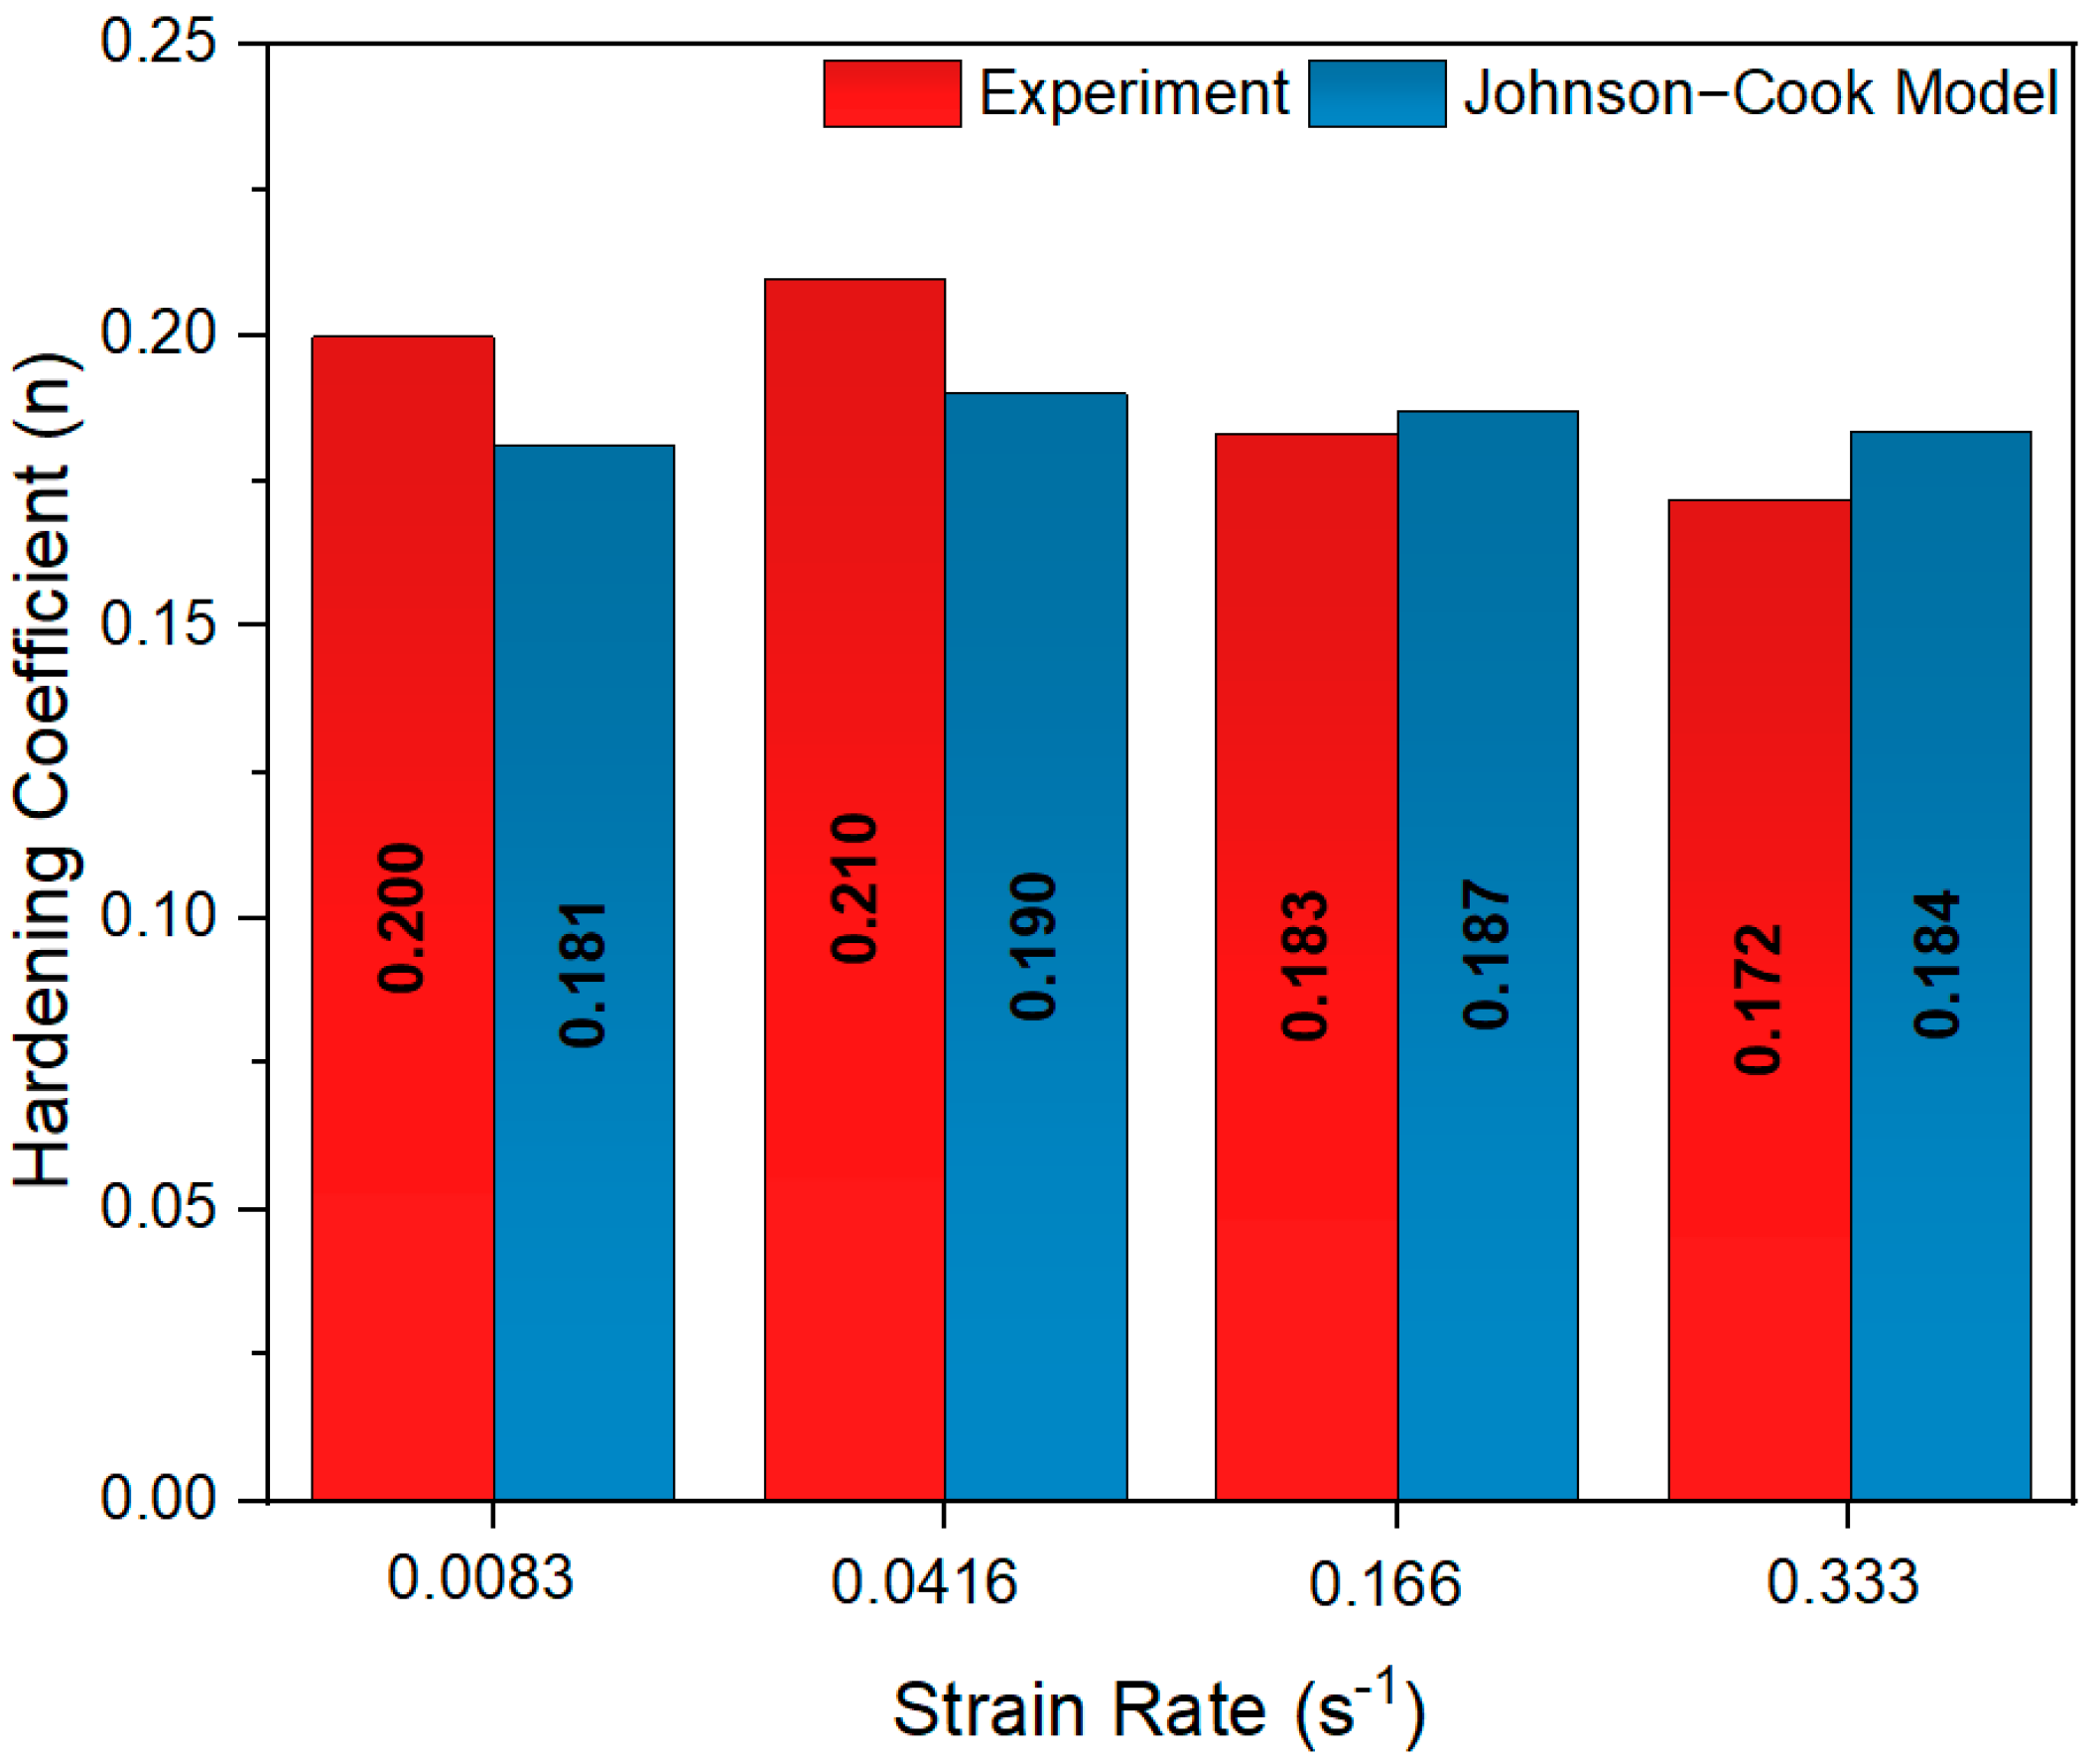
As shown in
Figure 11, the experimental coefficient of hardening (n) values are plotted against the Johnson–Cook (J-C) model prediction results. It has been observed in the literature for different aluminum alloys that the coefficient of hardening varies in a very narrow range and decreases slightly depending on the strain rate [
33,
34]. These findings corroborate the experimental outcomes related to the coefficient of hardening in this study. At a strain rate of 0.0083 s
−1, the experimentally obtained coefficient of hardening was 0.19975, while the J-C model predicted this value to be 0.181. The calculation of the error rate resulted in a result of 9.38%. As plastic deformation occurs at a low strain rate, two phenomena occur: an increase in dislocation density and an increase in the consolidation coefficient. Nonetheless, the J-C model may have underestimated the slowness of dislocation motions at low deformation rates and may have slightly underestimated the coefficient of hardening. At a strain rate of 0.0416 s
−1, the experimental coefficient of hardening was determined to be 0.2095, while the J-C model predicted a value of 0.1899. The error rate was 9.35% and the accuracy of the model was found to be limited at this strain rate. At this strain rate, the strain hardening effect becomes more pronounced, resulting in an increase in the material’s strength. It has been hypothesized that the J-C model may not be able to fully represent the actual dislocation interactions at this strain rate. In this case, it is thought that the model may have fallen short in its prediction of strain hardening behavior, particularly in scenarios involving higher strain rates. At a strain rate of 0.166 s
−1, the experimental and J-C model coefficient of hardening values were found to be highly correlated, with an error rate of 2.1% being calculated. While the experimental value was 0.18305, the J-C model estimated this value as 0.1869. The J-C model demonstrated a higher accuracy in predicting the hardening coefficient of the material at this strain-rate level. The experimental coefficient of hardening was measured at a strain rate of 0.333 s
−1, yielding a result of 0.17165. In comparison, the J-C model predicted an outcome of 0.1836. The error rate is 6.97%, which indicates that, at high strain rates, the model generally agrees with the prevailing trend but has a slight tendency to overestimate the strain-rate hardening effect. At this strain rate, the movement of dislocations becomes constrained, and crack formation is observed during material deformation.
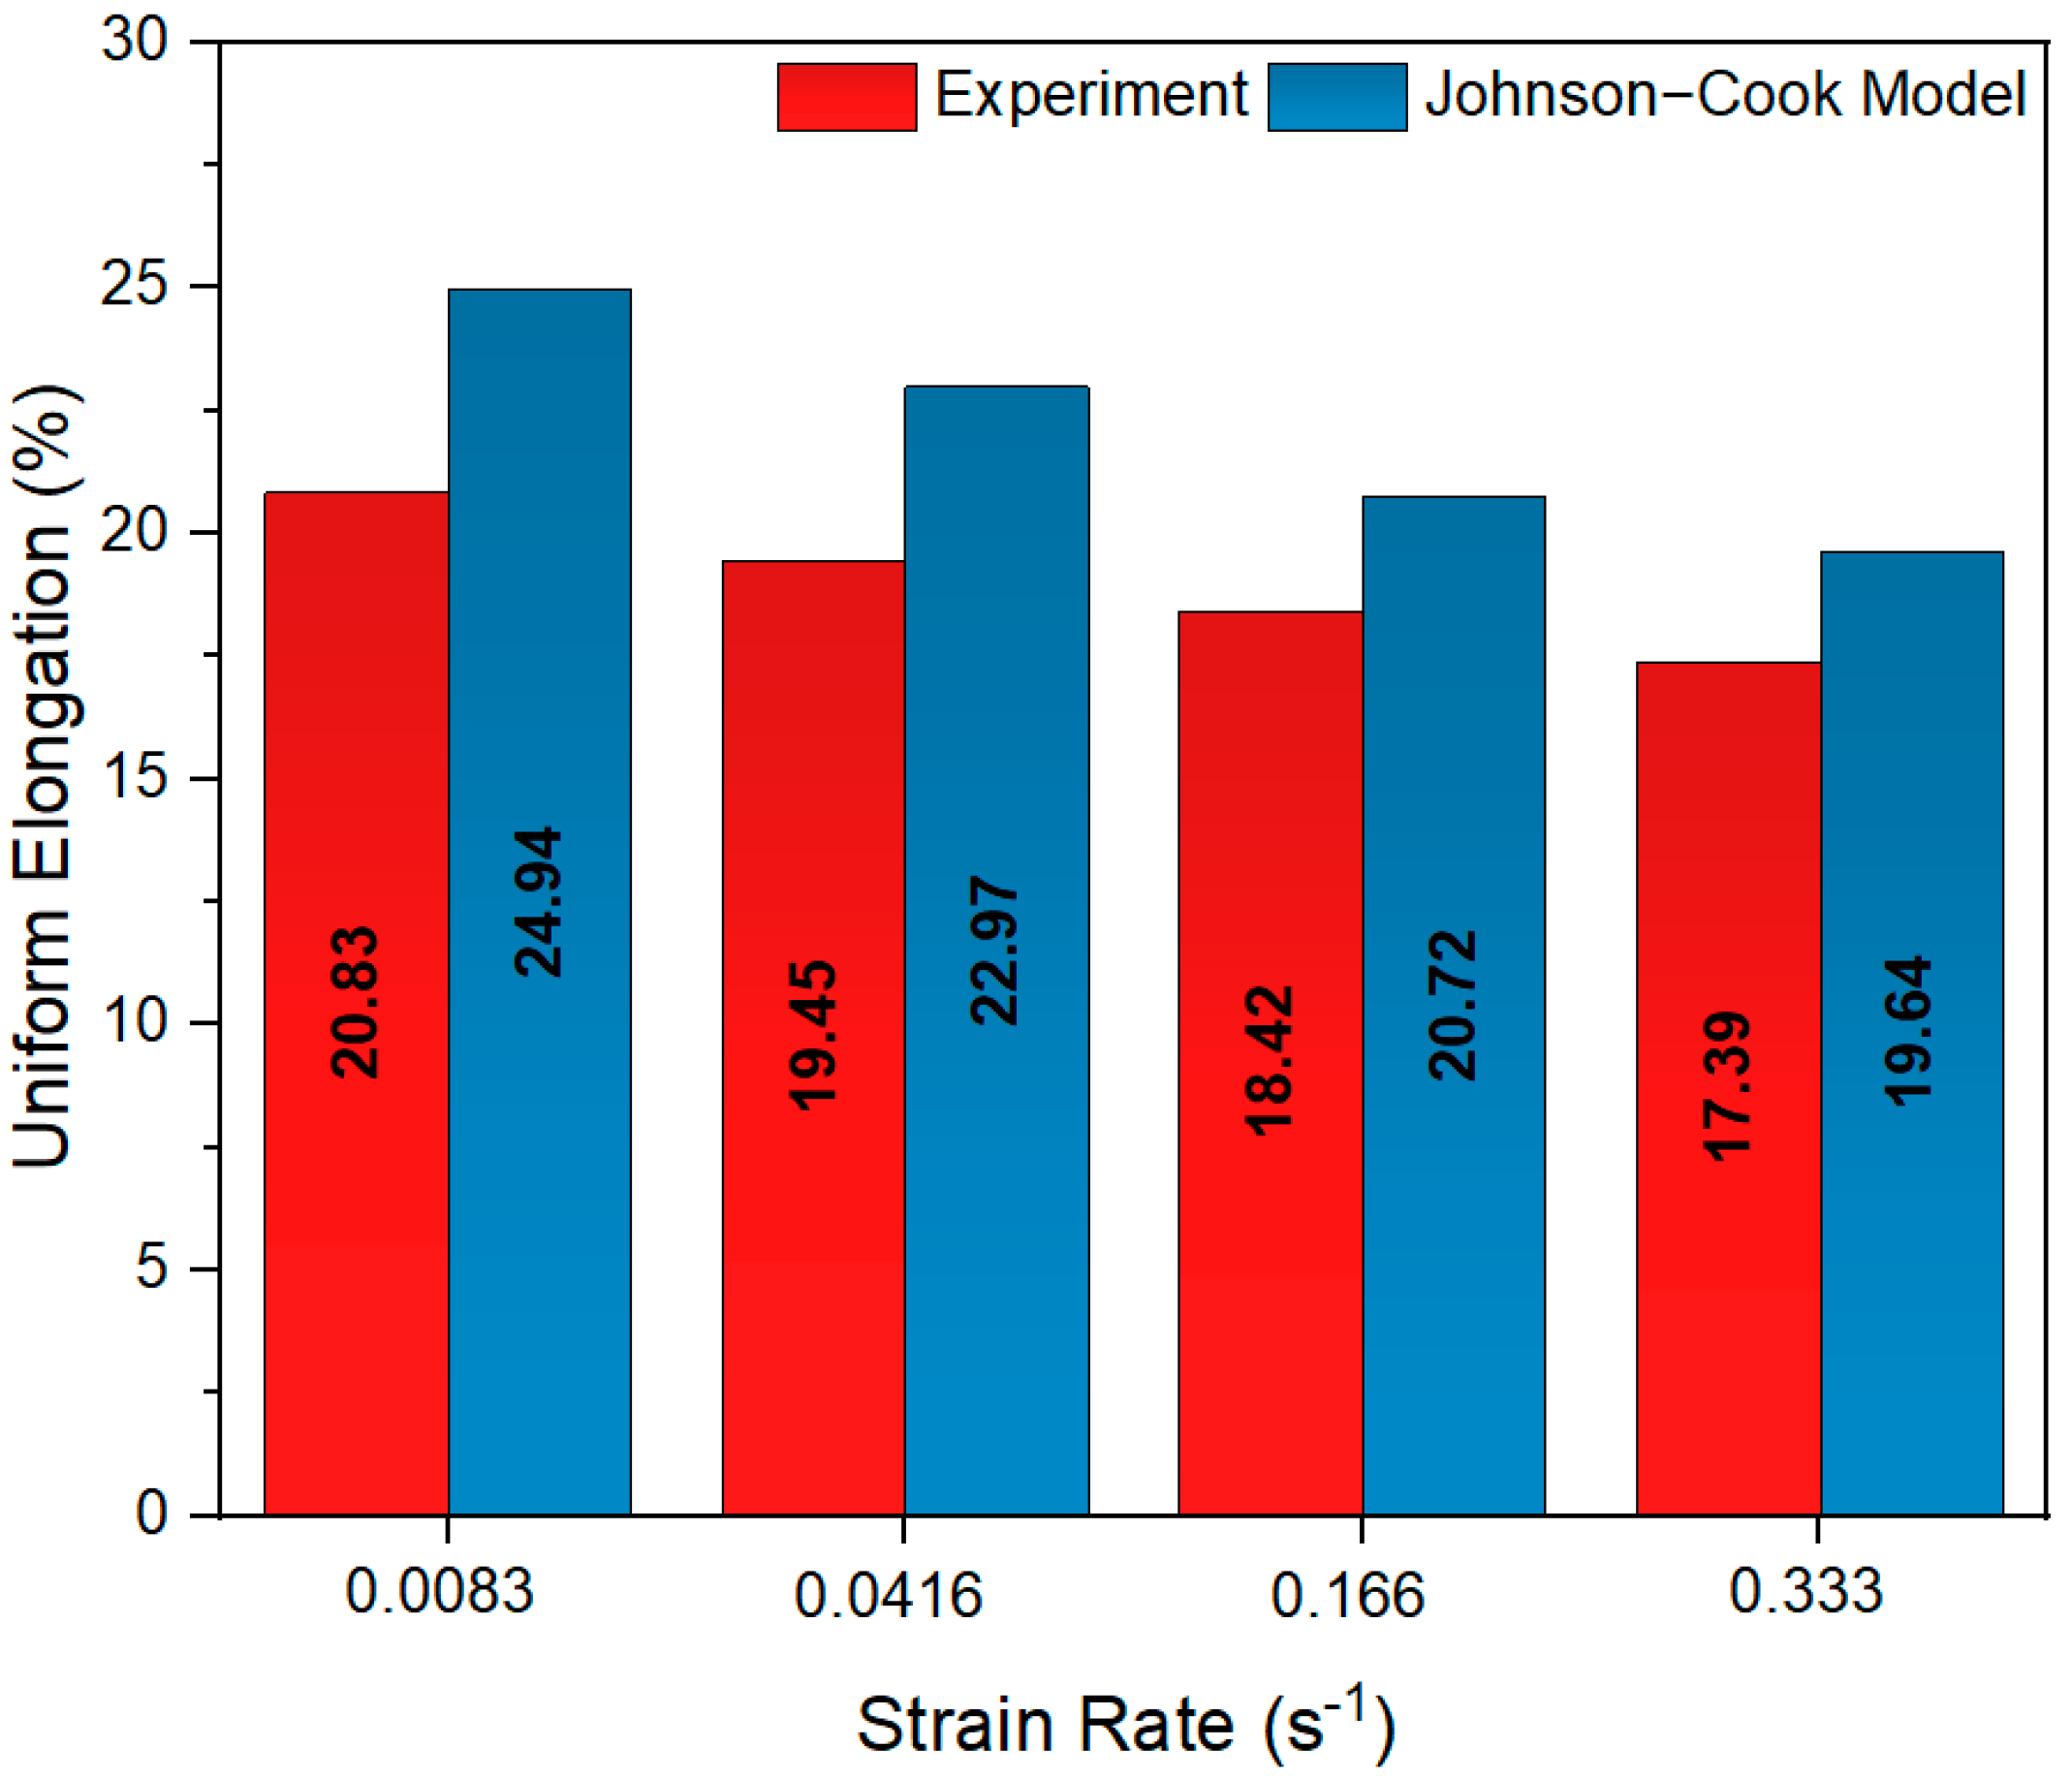
As
Figure 12 indicates, the experimental uniform strain values obtained at different strain rates are compared with the J-C model predictions. In the quasi-static strain-rate range, the extent of uniform elongation exhibited a narrow range of variability, contingent on strain-rate changes [
33]. According to the experimental findings, the uniform strain value was determined to be 20.83% at a strain rate of 0.0083 s
−1. In comparison, the J-C model prediction resulted in a value of 24.94%, indicating reasonable agreement between the two methods. The error rate was found to be 19.73%. The J-C model provided a higher uniform strain than the experimental results. At a strain rate of 0.0416 s
−1, the experimental uniform strain value was determined to be 19.45%, while the J-C model prediction was 22.97%. The error rate was determined to be 18.1% at this strain rate. The discrepancy between the experimental data and the uniform strain predictions of the J-C model is thought to be primarily due to local strain intensity effects on the material. The J-C model evaluates these local effects in a homogeneous form. In the experimental data, the limiting effects of microcrack formation and deformation mechanisms are included. At a strain rate of 0.166 s
−1, the experimental uniform strain value is calculated to be 18.42%, while the J-C model predicts a value of 20.72%. In this particular case, the error rate was found to be 12.5%. The experimental uniform strain value was determined to be 17.39% at a strain rate of 0.333 s
−1. In comparison, the J-C model prediction resulted in a value of 19.64%. The error rate at this strain rate was 12.9%. The experimental findings indicate that the uniform elongation decreases due to the restriction of dislocation motion during deformation and the propagation of microcrack initiation within the material. This decrease in error rates at higher strain rates is hypothesized to be due to the increased effect of the C parameter at these higher strain rates of the model.
As illustrated in
Figure 13, a comparison is made between the toughness values, experimental results, and predictions from the Johnson–Cook (J-C) model. It has been observed that the energy absorption capacity of 6000-series aluminum alloys tends to decrease within a narrow range due to an increase in strain rate [
35,
36]. While the toughness value obtained experimentally at a strain rate of 0.0083 s
−1 was 56.97 MJ/m
3, the J-C model predicted this value as 58.77 MJ/m
3. The error rate is 3.16%, and it is evident that the model performs with a high success at low strain rates. At this strain rate, the material exhibits homogeneous energy absorption during plastic deformation, with the deformation process persisting for an extended duration subsequent to yielding. While the J-C model effectively represents the accumulation of deformation energy at a low strain rate, the observed discrepancy is hypothesized to result from the experimental observation of energy dissipation in localized regions of the material due to dislocation motion. While the toughness value obtained experimentally at the 0.0416 s
−1 strain rate was 48.91 MJ/m
3, the J-C model predicted this value as 54.43 MJ/m
3. The error rate is 11.30%, and it is determined that the model overestimates the toughness value at this strain rate. Increasing the strain rate has been shown to decrease the time required for plastic deformation and reduce energy absorption. Nevertheless, as the J-C model considers the strain-rate effect through an average strain-rate dependence, it may not fully reflect the local plastic deformation losses in the material behavior, resulting in the model overestimating the energy absorption. The experimental toughness value was obtained at a strain rate of 0.166 s
−1 and was found to be 50.25 MJ/m
3. The J-C model predicted an experimental toughness value of 48.94 MJ/m
3. The error rate is 2.59%, and it is evident that the model demonstrates a high level of accuracy at this strain rate. As the strain rate increases, the strain hardening effect during deformation becomes more pronounced, and the material strength increases. It has been demonstrated that this process provides homogeneous energy absorption during plastic deformation. At a strain rate of 0.333 s
−1, the experimental and J-C model toughness values exhibited a high agreement, with an error rate calculated at 1.12%. The experimental value was estimated to be 45.64 MJ/m
3, while the J-C model value was determined to be 45.13 MJ/m
3. It has been shown that, under conditions of higher strain rate, the deformation time is reduced, and the capacity for energy absorption is limited. At this strain rate, the material exhibits an increase in resistance to deformation and an absorption of less energy with the strain-rate hardening effect. The J-C model effectively captures this phenomenon in its prediction outcomes, exhibiting a strong concordance with the experimental results. A comparison of the toughness values revealed a decrease in energy absorption, which was concomitant with an increase in strain rate. The Johnson–Cook model has been demonstrated to be a reliable predictor of the toughness value of materials, particularly at strain rates of 0.166 s
−1 and 0.333 s
−1. Consequently, the J-C model is substantiated as a reliable model for energy absorption, particularly at higher strain rates.
It has been observed that, at higher strain rates, the material exhibits an increase in strength with respect to deformation, a phenomenon that can be attributed to the strain-rate hardening effect. In this process, the material’s microstructure is subject to various forms of degradation, including the formation of local cracks, dislocation accumulations, and micro-sized deformation anisotropies. Therefore, given that the J-C model evaluates these microstructural effects through a homogeneous strain-rate effect, it may not be in full agreement with the experimental data. Furthermore, during deformation at higher strain rates, energy transformations occur within the material, inducing thermal softening. While thermal softening reduces the resistance of the material to deformation, it can concomitantly result in decreases in mechanical properties, such as yield strength and tensile strength. However, given that the J-C model only expresses thermal softening through a specific temperature dependence, strain-rate-dependent softening is not fully realized, which may lead to deviations in the predicted mechanical properties.
In experimental settings, particularly under conditions of high strain rates, the occurrence of heterogeneous deformations can become predominant. These deformations stem from specific processes within the material’s microstructure, including the formation of local voids, the initiation of cracks, and the movement of dislocations. However, experimental findings have shown that these heterogeneous deformations result in a decrease in properties such as yield strength and tensile strength. The J-C model addresses these effects through a generalized deformation behavior; therefore, discrepancies may emerge between model predictions and experimental results.
It has been demonstrated that, under conditions of higher strain rates, the deformation time is significantly reduced—a phenomenon that affects not only the process of energy absorption, but also the prediction of mechanical strength during the course of plastic deformation. The reduction in the plastic deformation time limits the strain hardening behavior of the material, leading to a decrease in properties such as toughness, yield strength, and tensile strength. As the J-C model generalizes these effects according to strain-rate dependence, discrepancies between the model and experimental results can be observed.
Figure 13,
Figure 14,
Figure 15 and
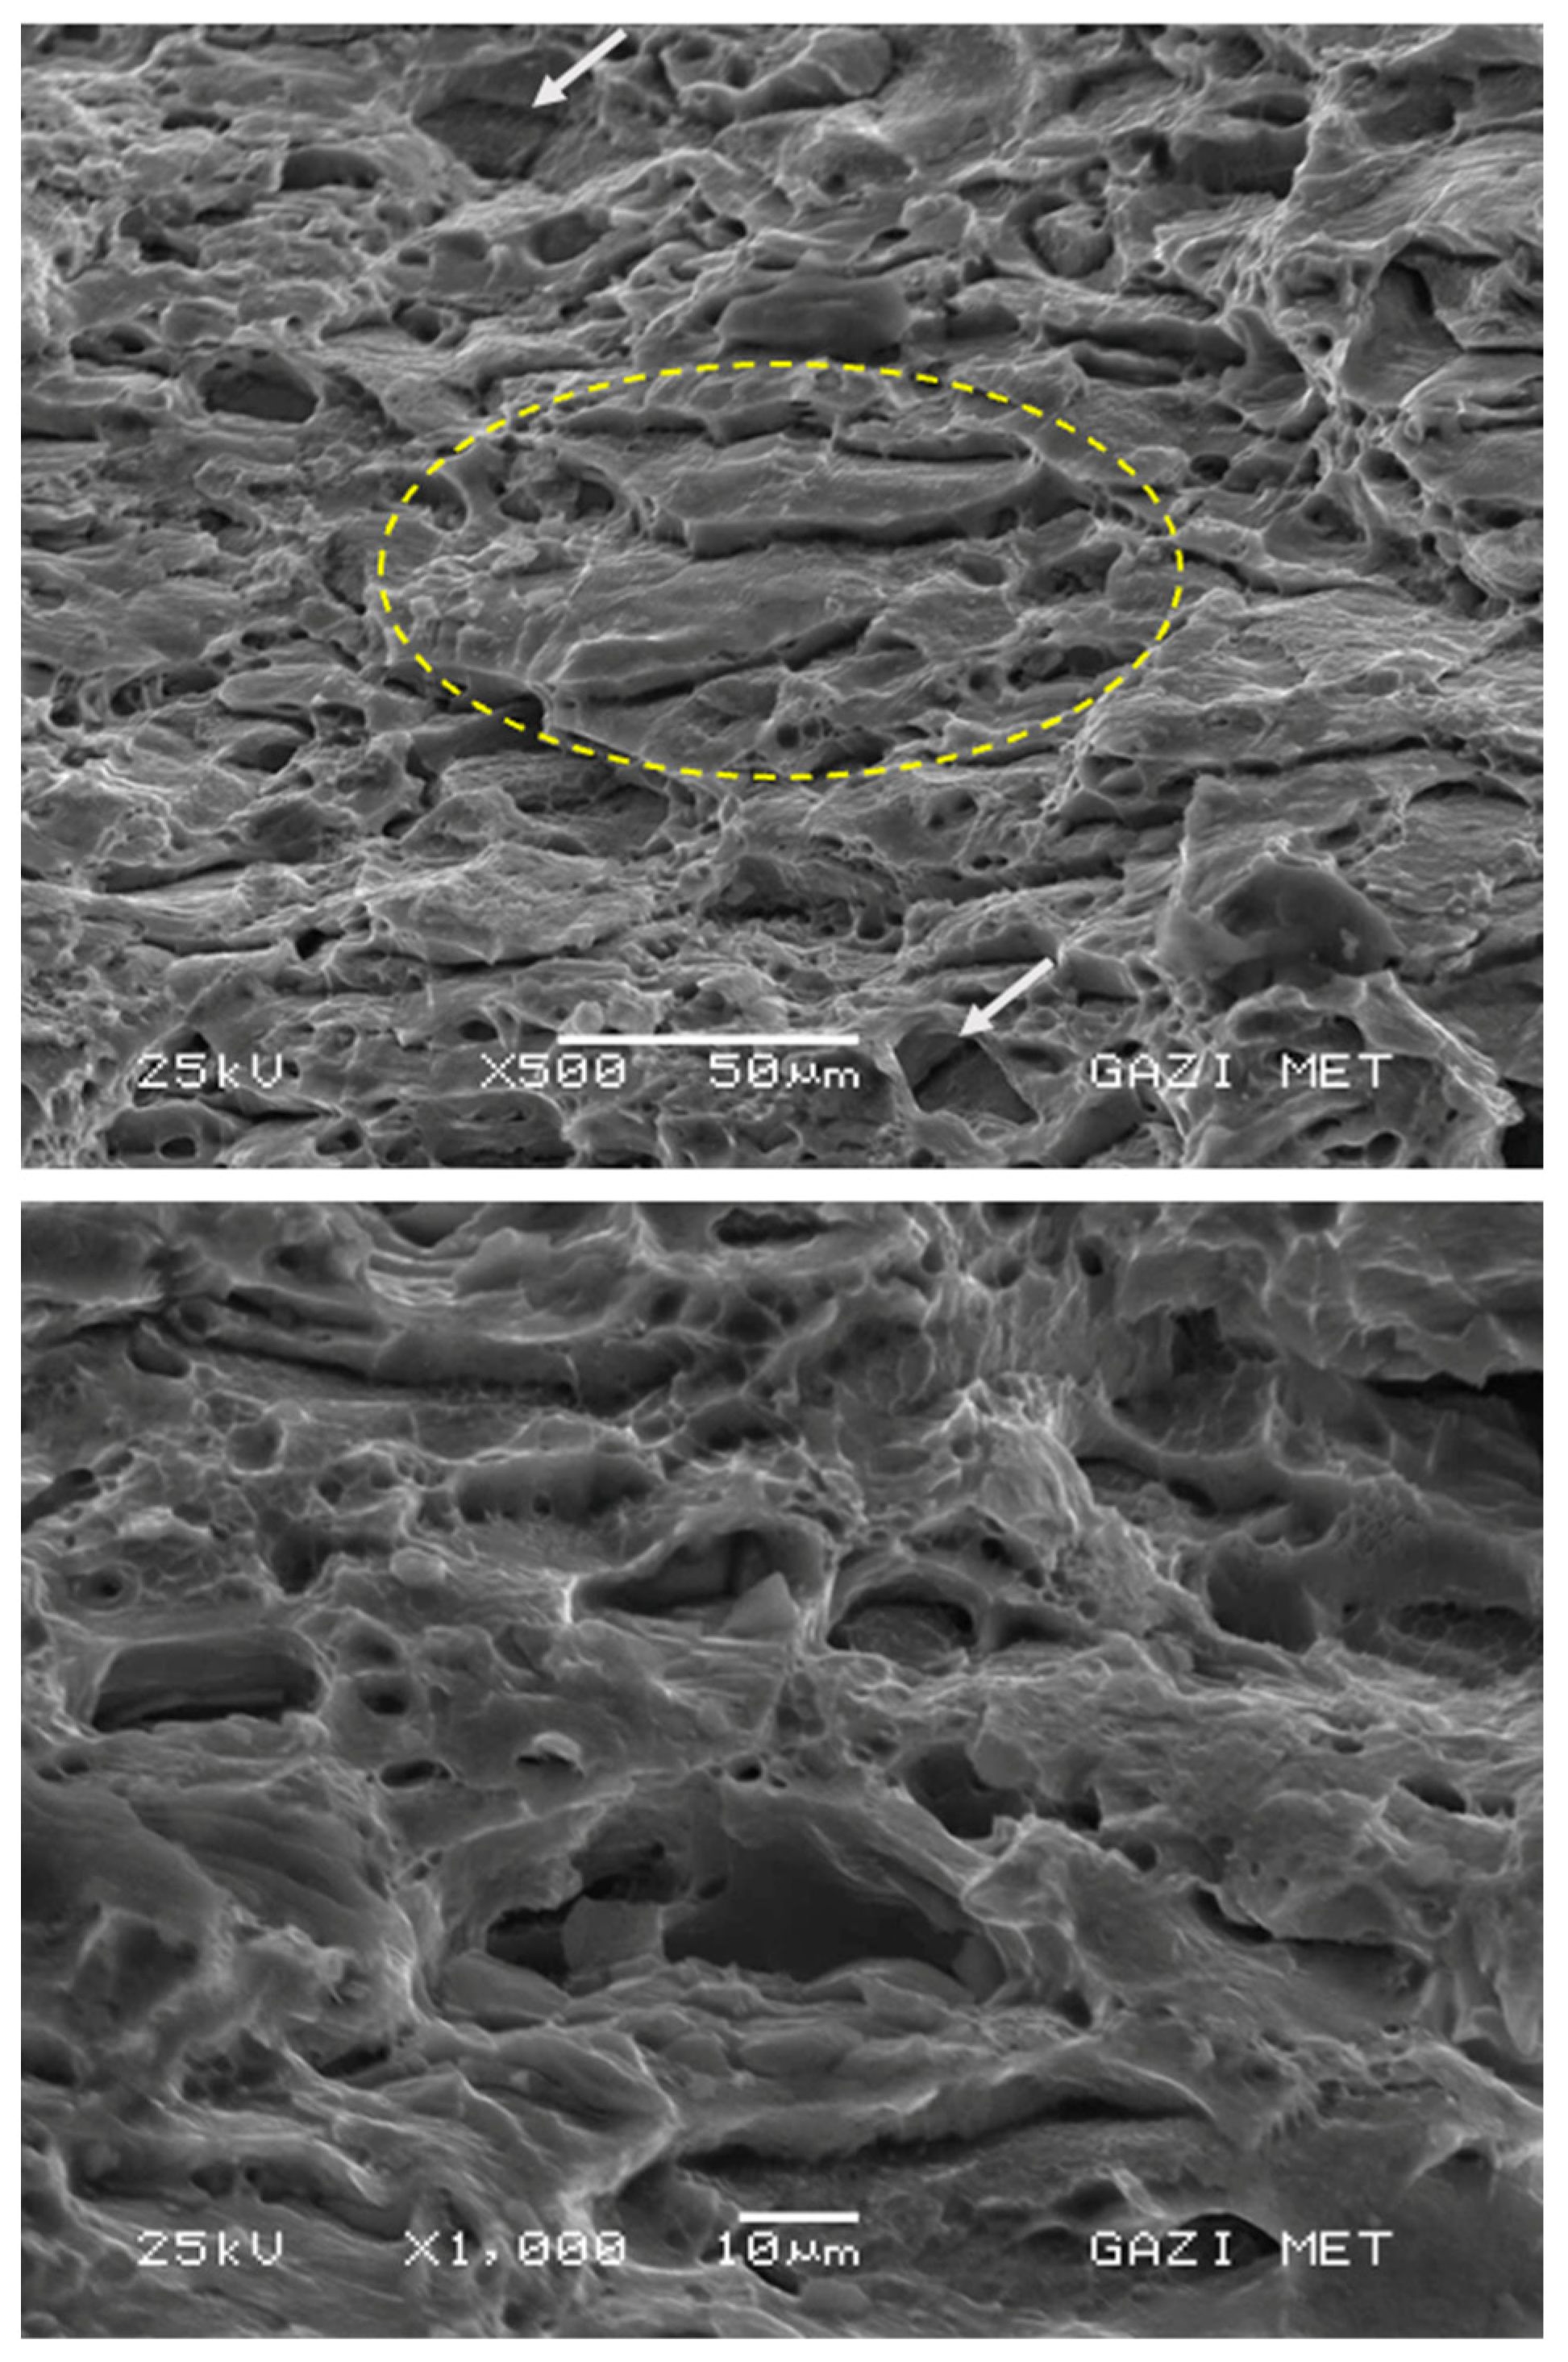
Figure 16 illustrate the SEM (scanning electron microscope) morphologies of the fracture surfaces of the standard tensile test specimens obtained at varying magnification ratios after tensile tests performed at different strain rates. The present study utilizes these figures to conduct a thorough examination of the morphological features that influence the fracture behavior of the material under varying strain rates.
As seen in
Figure 14, specimens obtained at a strain rate of 0.0083 s
−1 exhibited the highest ductility value, and dimple morphologies were observed on the fracture surface. It has been established that these dimples are predominantly concentrated in the rolling direction, as illustrated by the yellow oval region. In the regions delineated by the gray arrow, in-grain fractures manifest in deep dimples. The probable cause of these fractures is considered to be the transformation of stress into in-grain cleavage morphology as a result of deformation hardening after the maximum tensile stress.
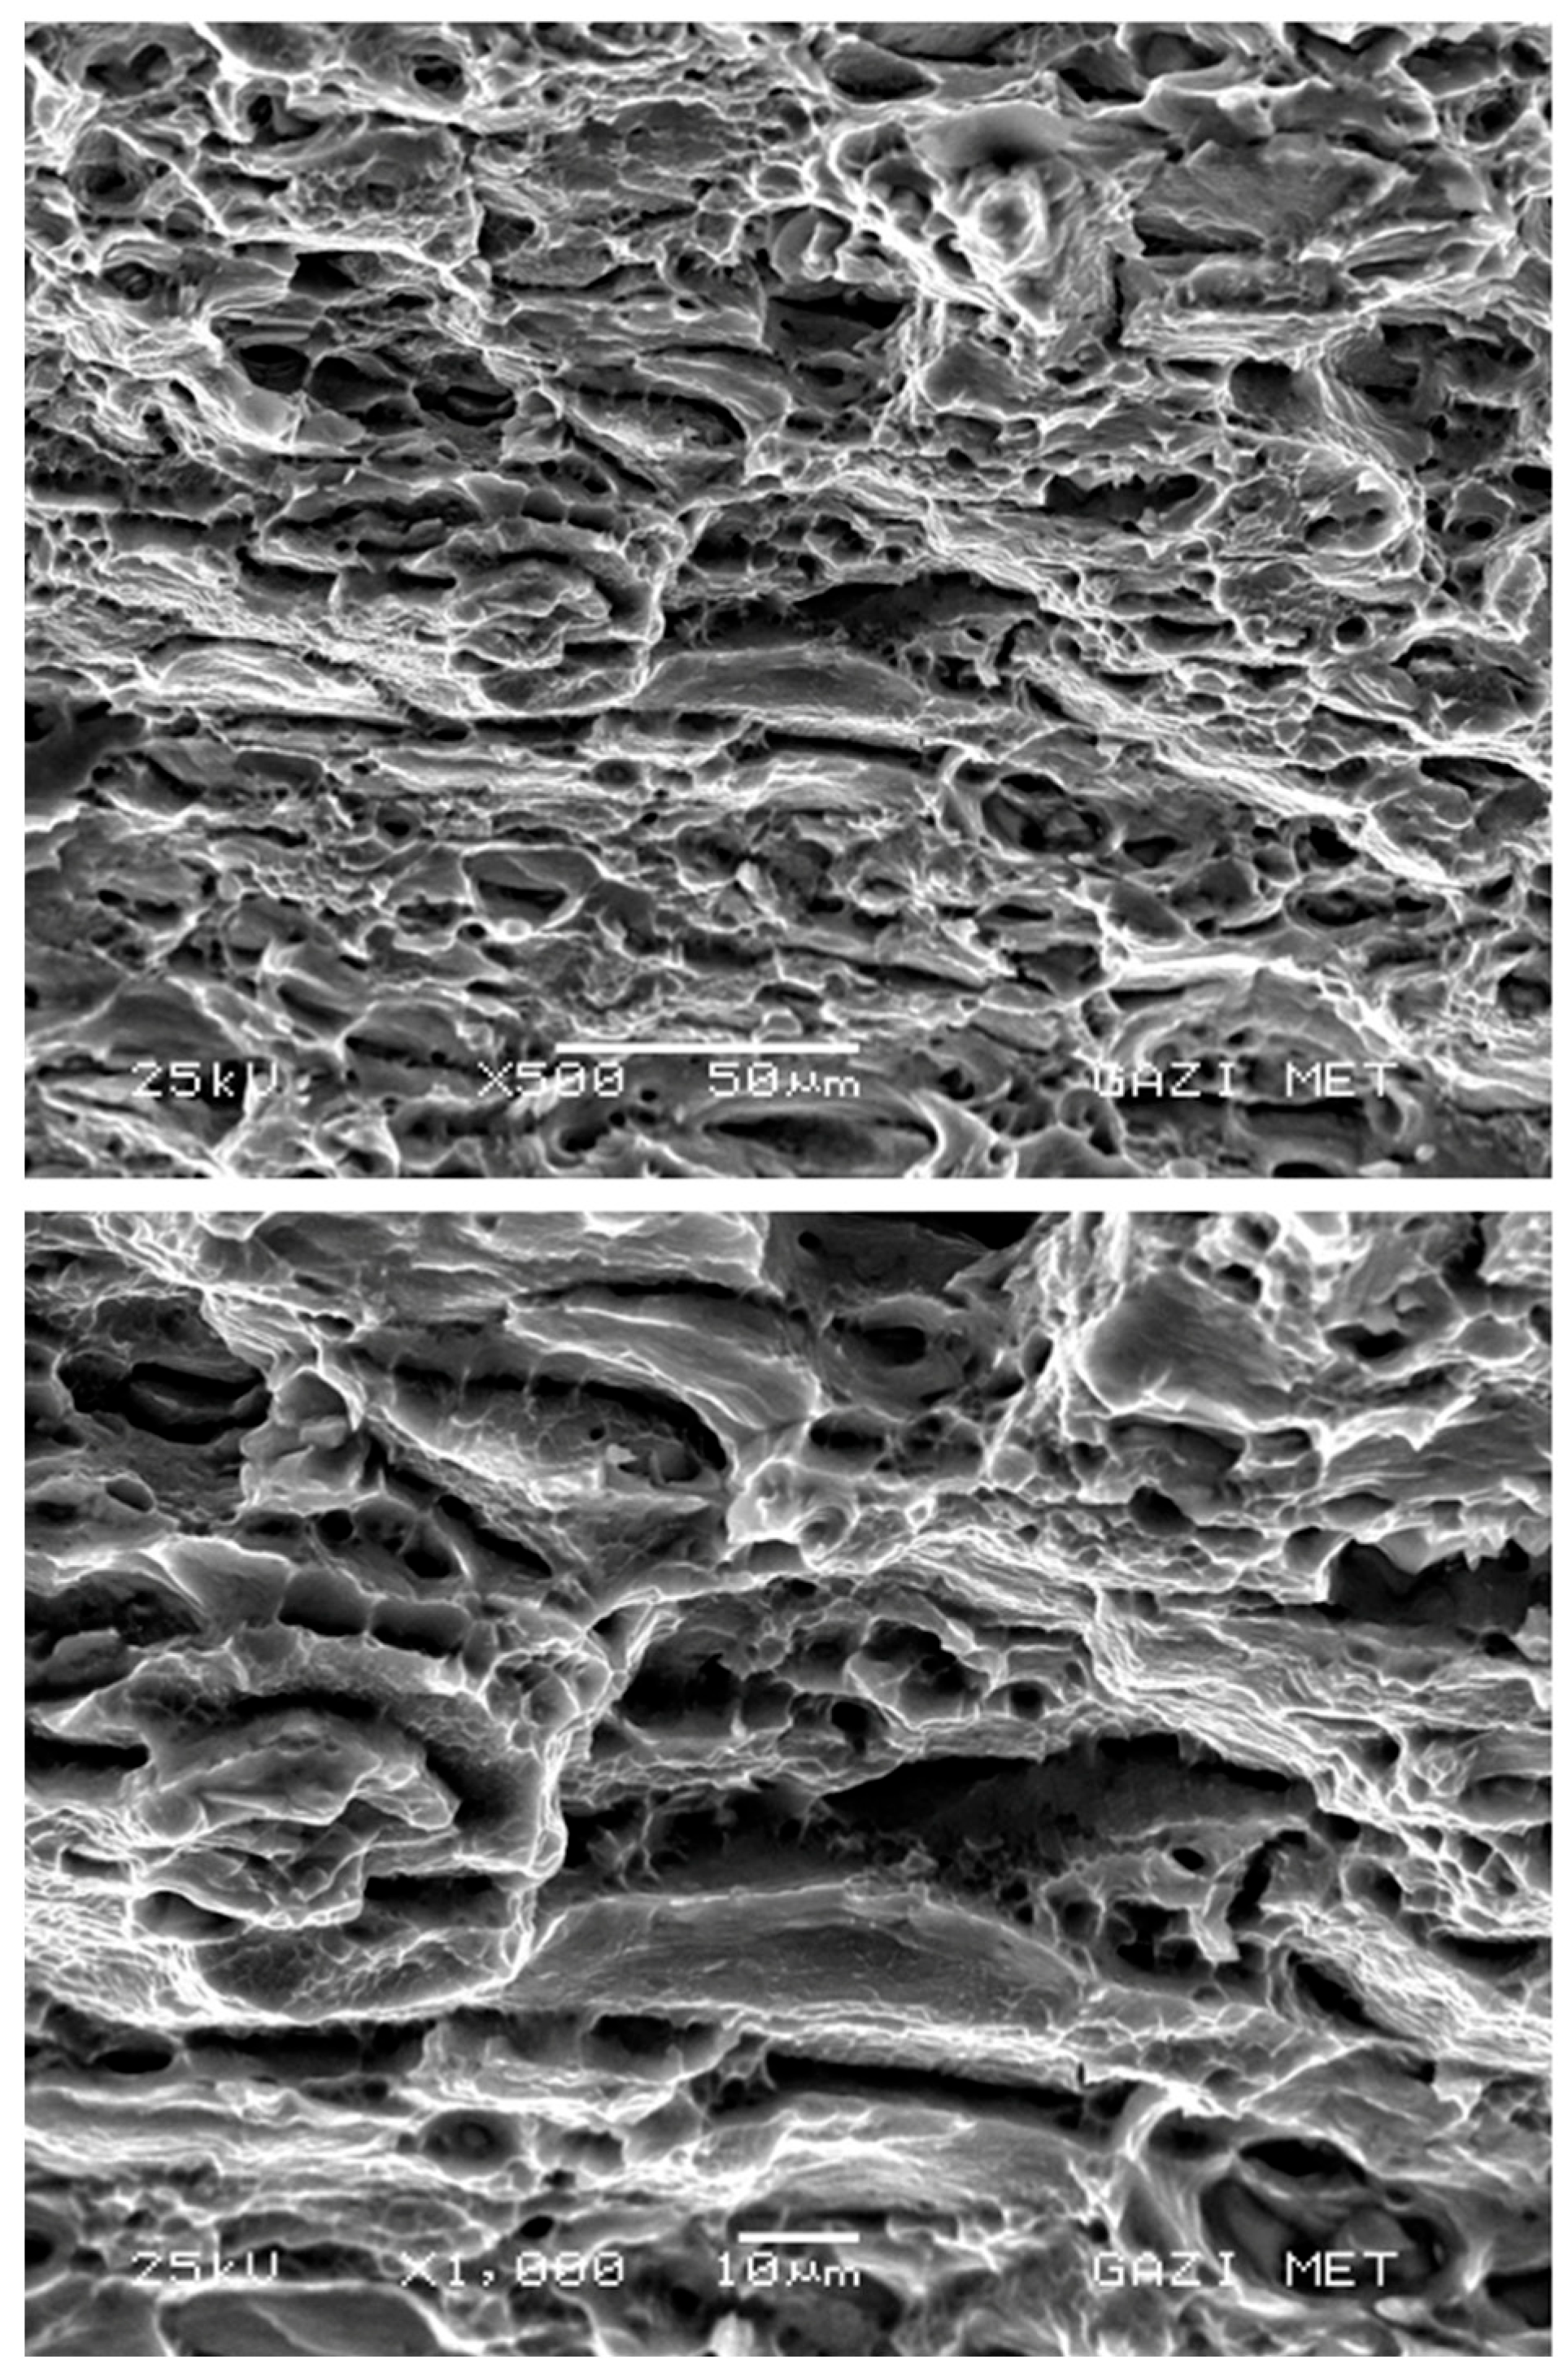
The fracture surfaces obtained at a strain rate of 0.0416 s
−1 (see
Figure 15) demonstrate high ductility, with the presence of dimples observed to be concentrated in both the rolling direction and the regions not influenced by the rolling direction. In this fracture surface, it is understood that the dimple areas are concentrated, especially near the grain boundaries. As indicated by the yellow dashed oval, the deep, elongated dimples seen on the fracture surface demonstrate the material’s high local plastic deformation and the coalescence of microvoids within the grains. In the regions designated by the green arrow, the presence of microvoids and their susceptibility to forming microcracks is evident. This phenomenon manifests subsequent to the occurrence of maximum tensile stress in materials characterized by elevated ductility, thereby inducing a delayed fracture effect.
The fracture surfaces obtained at a strain rate of 0.166 s
−1 strain are presented in
Figure 16. A higher ductility was observed in comparison to other strain-rate values. It is observed that dimple morphologies concentrated close to the grain boundaries are dominant. These dimples manifest serrated elongation in the tensile direction, as indicated by the orange arrow. In the fracture mode, a wide array of ductile fracture types is observed. The analysis revealed the predominance of both macro- and micro-dimple regions. Subsequent to the occurrence of maximum tensile stress, in-grain fractures (indicated by the gray arrow) manifested at the base of the macro-dimple, a consequence of deformation hardening.
As illustrated in
Figure 17, the fracture surfaces obtained at a strain rate of 0.333 s
−1 continue to manifest increased ductility, albeit to a lesser extent compared to other strain rates. The fracture surface exhibits prominent dense micro- and macro-dimple areas. Nonetheless, it was ascertained that a minimal amount of cleavage-type fracture modes emerged in conjunction with an increase in strain rate. The increase in strain rate leads to cleavage fractures on the twin planes and in the {110} and {100} plane families. These fractures are not dense in the FCC (Face-Centered Cubic) crystal system; rather, they occur as a result of intragrain slippage. This phenomenon can be attributed to the fact that the {111} plane, where atomic packing density is at its maximum, does not have sufficient time to accommodate dislocation movement as the strain rate increases. Insufficient time leads to cleavage-type fractures in the twin planes.


