Article

Geometric Characterizations of Non-Uniform Structure I Methane Hydrate Behaviors Under Pressure

Department of Chemical Engineering, McGill University, Montreal, QC H3A 0C5, Canada
*
Author to whom correspondence should be addressed.
Crystals 2025, 15(6), 518; https://doi.org/10.3390/cryst15060518
Submission received: 30 April 2025 / Revised: 25 May 2025 / Accepted: 28 May 2025 / Published: 29 May 2025

Abstract

:
Gas hydrates have been identified as one of the leading candidates for future energy sources. According to conservative estimates, the energy contained in natural hydrates is double that of the fossil fuel that has been explored. This substantial energy storage motivates the investigation of natural hydrates. Prior research on mechanical/material properties has assumed that the lattice would be the smallest unit and averaged all the features within the lattice, disregarding smaller-scale geometric properties. We investigated the geometric features of sI methane hydrate under pressure. The sI methane hydrate is made up of two kinds of cages (polyhedrons) with two kinds of faces (polygons), and the vertices of the polygons are occupied by water oxygen atoms. Based on these three categories, we examined the cage integrity, face deformation, and water oxygen atom bond lengths and angles within and beyond the stability limits. The presence of forbidden zones was confirmed in bond length and angle distributions, validating the effects of geometric features. The predictive nature of water molecule angular displacement with pressure was validated. This multiscale computational materials science methodology describes and defines the range of the elastic stability of gas hydrates, a crucial contribution to energy materials science and engineering.

1. Introduction

The increase in global population combined with diminishing natural resources necessitates a greater focus on energy exploration and allocation. With sustainability at the forefront of much discussion in this century, renewable sources of energy are being sought to replace fossil fuels. However, the significant initial investment, combined with the relatively low energy conversion rates, storage requirements, and intermittence, makes renewable energy sources less attractive than fossil fuels. Thus, finding a high-energy-density fuel source is of utmost importance. Gas hydrates (GH) are a promising energy source due to their high energy density and abundance in nature [1]. They usually appear in deep oceans and permafrost areas where low temperatures and high pressures favor their formation and stability. GHs possess special guest–host interactions that allow them to form stable structures, where a backbone of water molecules contains significant amounts of gaseous guests, such as methane, carbon dioxide, and hydrogen, in cavities or cages. Theses structures are periodic solids composed of hydrogen-bonded water molecules that form a crystal lattice that contains these cages, which are polyhedrons with pentagonal and hexagonal faces. The literature has shown that GHs, in the form of deposits in continental shelves, possess exploitable energy reserves nearly equal to the total amount of fossil fuels available currently. Therefore, it is critical to consider hydrates as strong candidates to meet global energy demands [2,3]. GHs are also being considered in other fields, namely methane extraction, flue gas sequestration, and planetary ices [4,5,6,7,8,9].
The unique structures that these clathrates form provide an excellent opportunity for gas storage and transportation applications. Storing carbon dioxide in GHs would be a great way to reduce the atmospheric concentration of this greenhouse gas and mitigate its effect on global warming. In addition, storing hydrogen in this way would provide a safe and efficient way to transport this gas, which is difficult to store in its gaseous form. For methane, carbon dioxide, and hydrogen, the corresponding uses of gas hydrates are methane hydrate exploitation, carbon dioxide sequestration, and hydrogen hydrate transportation and storage. Intensive experimental studies of gas hydrate nucleation in engineering conditions show that the synthesis pathway is complex and multifacted, and various additives and transport phenomena are involved in the exploitation of GHs for these applications [10,11,12]. However, at the root of these complexities is the stability of the hydrate structure at various stages of formation and structural integrity, which is a function of the guest–host interactions and the local environment. The main problem concerning stability remains unsolved and, thus, applications remain limited. Therefore, there is a significant need to understand and characterize the stability of these hydrates under different piezo-composition-thermal conditions to promote their practical applications [1].
The urgent need for research on the stability of gas hydrates has precipitated a large number of studies of these materials and their structures [13,14,15,16,17]. Vlasic et al. [18] studied the stability of sII hydrates using Equations of State (EOS) and the effect of different guest molecules on the material properties of GHs. They found that the hydrogen bond density, which serves as the lattice’s sustaining force, and the bulk modulus were shown to have a position linear correlation. However, the bulk modulus drops as the atomic volume rises. Additionally, it was found that larger guest molecules exert an outward force due to van der Waals repulsions, growing the cages and thereby the lattice volume. Daghash et al. [19] studied sH gas hydrates in a detailed manner to analyze their stability. They reported physical properties at the atomistic level using Density Functional Theory (DFT) and quantified the dispersion forces. They also used DFT-based infrared spectroscopy (IR) [20] to identify the hydrogen bond vibration frequency, which can be used to determine the hydrate’s Young modulus. Since vibrational frequency depends on the pressures and bond length, they present a new route for mechanical property determination. Additionally, the same work determined positive linear relationships between the elastic constants and pressure, implying the physics properties of GHs would change and should be quantified under pressure.
Mathews et al. [21] examined the thermal properties of sI hydrates under various pressures and concluded that DFT can provide accurate predictions of the heat capacity and thermal expansion, particularly at low temperatures, and it does so better than molecular dynamics (MD) simulations. Jia et al. [22] found that there were significant correlations between the second-order elastic constants (SOECs) and pressures and that the piezo-effects may differ depending on the type of guest molecules. Mirzaeifard et al. [23] computed the surface tension of hydrate/water mixtures using MD simulations to provide a better understanding of the interfacial properties of hydrates. Other MD works have shown that standard experimental methods fail to provide adequate insight into the surface and interfacial properties of hydrates [24,25], and thorough characterization of the molecular phenomena in these environments remains limited and incomplete [26,27,28]. Zhu et al. [29,30] investigated the stability limits of sI methane hydrates under pressure and found that the piezo-effect might be seen from the perspective of electron clouds, atoms, cages, and lattices.
In the aforementioned relevant literature, the typical methods for analyzing the piezo-effect on hydrates involve looking at the SOECs, as well as other mechanical characteristics including the bulk and Young moduli. However, all of these methods are based on the assumption that forces and energies are distributed uniformly throughout the lattice and the unit cell. However, this is often not the case. The fracture mechanism dictates that cracks always initiate at specific locations and that local failures precede the global failure of the material. This local failure is caused by an imbalance of forces and energies, manifesting as the presence of a local structural change, which causes certain locations in the lattice to become more fragile and prone to failure due to interactions among backbone molecules or between the guests and the backbone [31,32,33,34,35]. The structure of the lattice determines the energy and stress distributions, and it becomes important to study the structure of the hydrate to find the weakest point in the lattice.
Accordingly, this work sought to address the lack of quantitative understanding and knowledge regarding the location and non-uniform characteristics of sI methane hydrates under pressure. In this paper, we first examined the heterogeneity of GHs in terms of cage types. Since the small and large cages that form the lattice of hydrates both have pentagonal faces, it is difficult to differentiate face effects based solely on the cage size. Thus, we advanced one level to the cages’ vertices as opposed to their faces. The cage vertices are made up of oxygen atoms in the water molecules that form that backbone, and we sought to classify them into three groups based on their neighbors. Fully occupied sI methane hydrates were examined using DFT, as implemented in the Vienna ab initial Simulation Package (VASP) [36,37,38,39], to determine the local structure of the hydrate at zero Kelvin with first principles calculations.
This paper is organized as follows. First, we describe the methods and computational techniques employed for this study. Then, we discuss, in depth, the different classifications methods, local environment characterization, and the local structure of the hydrate. We then study the gas hydrate system at the different pressures corresponding to the tensile stability limit and the compressive stability limit, comprehensively analyzing bond, angle, and displacements throughout the conditions in question. Finally, we present the results of this study and discuss their implications for the stability of sI methane hydrates under pressure, including identifying the trends and locations of potential failures in the lattice that appear in trends of bond lengths and angles.

2. Materials and Methods

2.1. DFT Simulations and Computational Methods

The first principles calculations were performed using DFT, as implemented in the VASP code [36,37,38,39]. To obtain the lowest energy system under different pressures, the sI unit cell, where all cages were filled with methane molecules, was relaxed in all three degrees of freedom (atomic positions, lattice volume, and lattice shape). The sI backbone is composed of water molecules whose oxygen positions were determined using X-ray diffraction methods. The protons were arranged to follow the Bernal–Fowler ice rules and to reduce any net forces [40]. The methane molecules were placed in the large and small cages of the sI unit cell.
The unit cell was composed of 46 water molecules that formed two small cages and six large cages. The small cages contained twelve pentagonal faces ( 5 12 ), and the large cages contained twelve pentagonal faces ( 5 12 ) and two hexagonal faces ( 6 2 ). Each cage contained only one guest molecule, regardless of the cage type. This cell was relaxed at zero Kelvin with periodic boundary conditions throughout and the desired pressure imposed as a hydrostatic pressure. The pressure ranged from −11.0 GPa to 7.5 GPa, and this encompassed the stability limits of the hydrate [29]. The conjugate gradient algorithm was employed to obtain the lowest energy configuration of the system due to its reliable performance at or beyond the hydrate stability limits [29]. The revised Perdew–Burke–Ernzerhof (revPBE) exchange–correlation functional [41] and the DFT-D2 dispersion correction [42] methods were selected due to their extensive proven performance in predicting the properties of hydrates [29]. The energy cutoff was set to 520 eV and the Brillouin zone was sampled using a 4 × 4 × 4 Monkhorst-Pack grid.

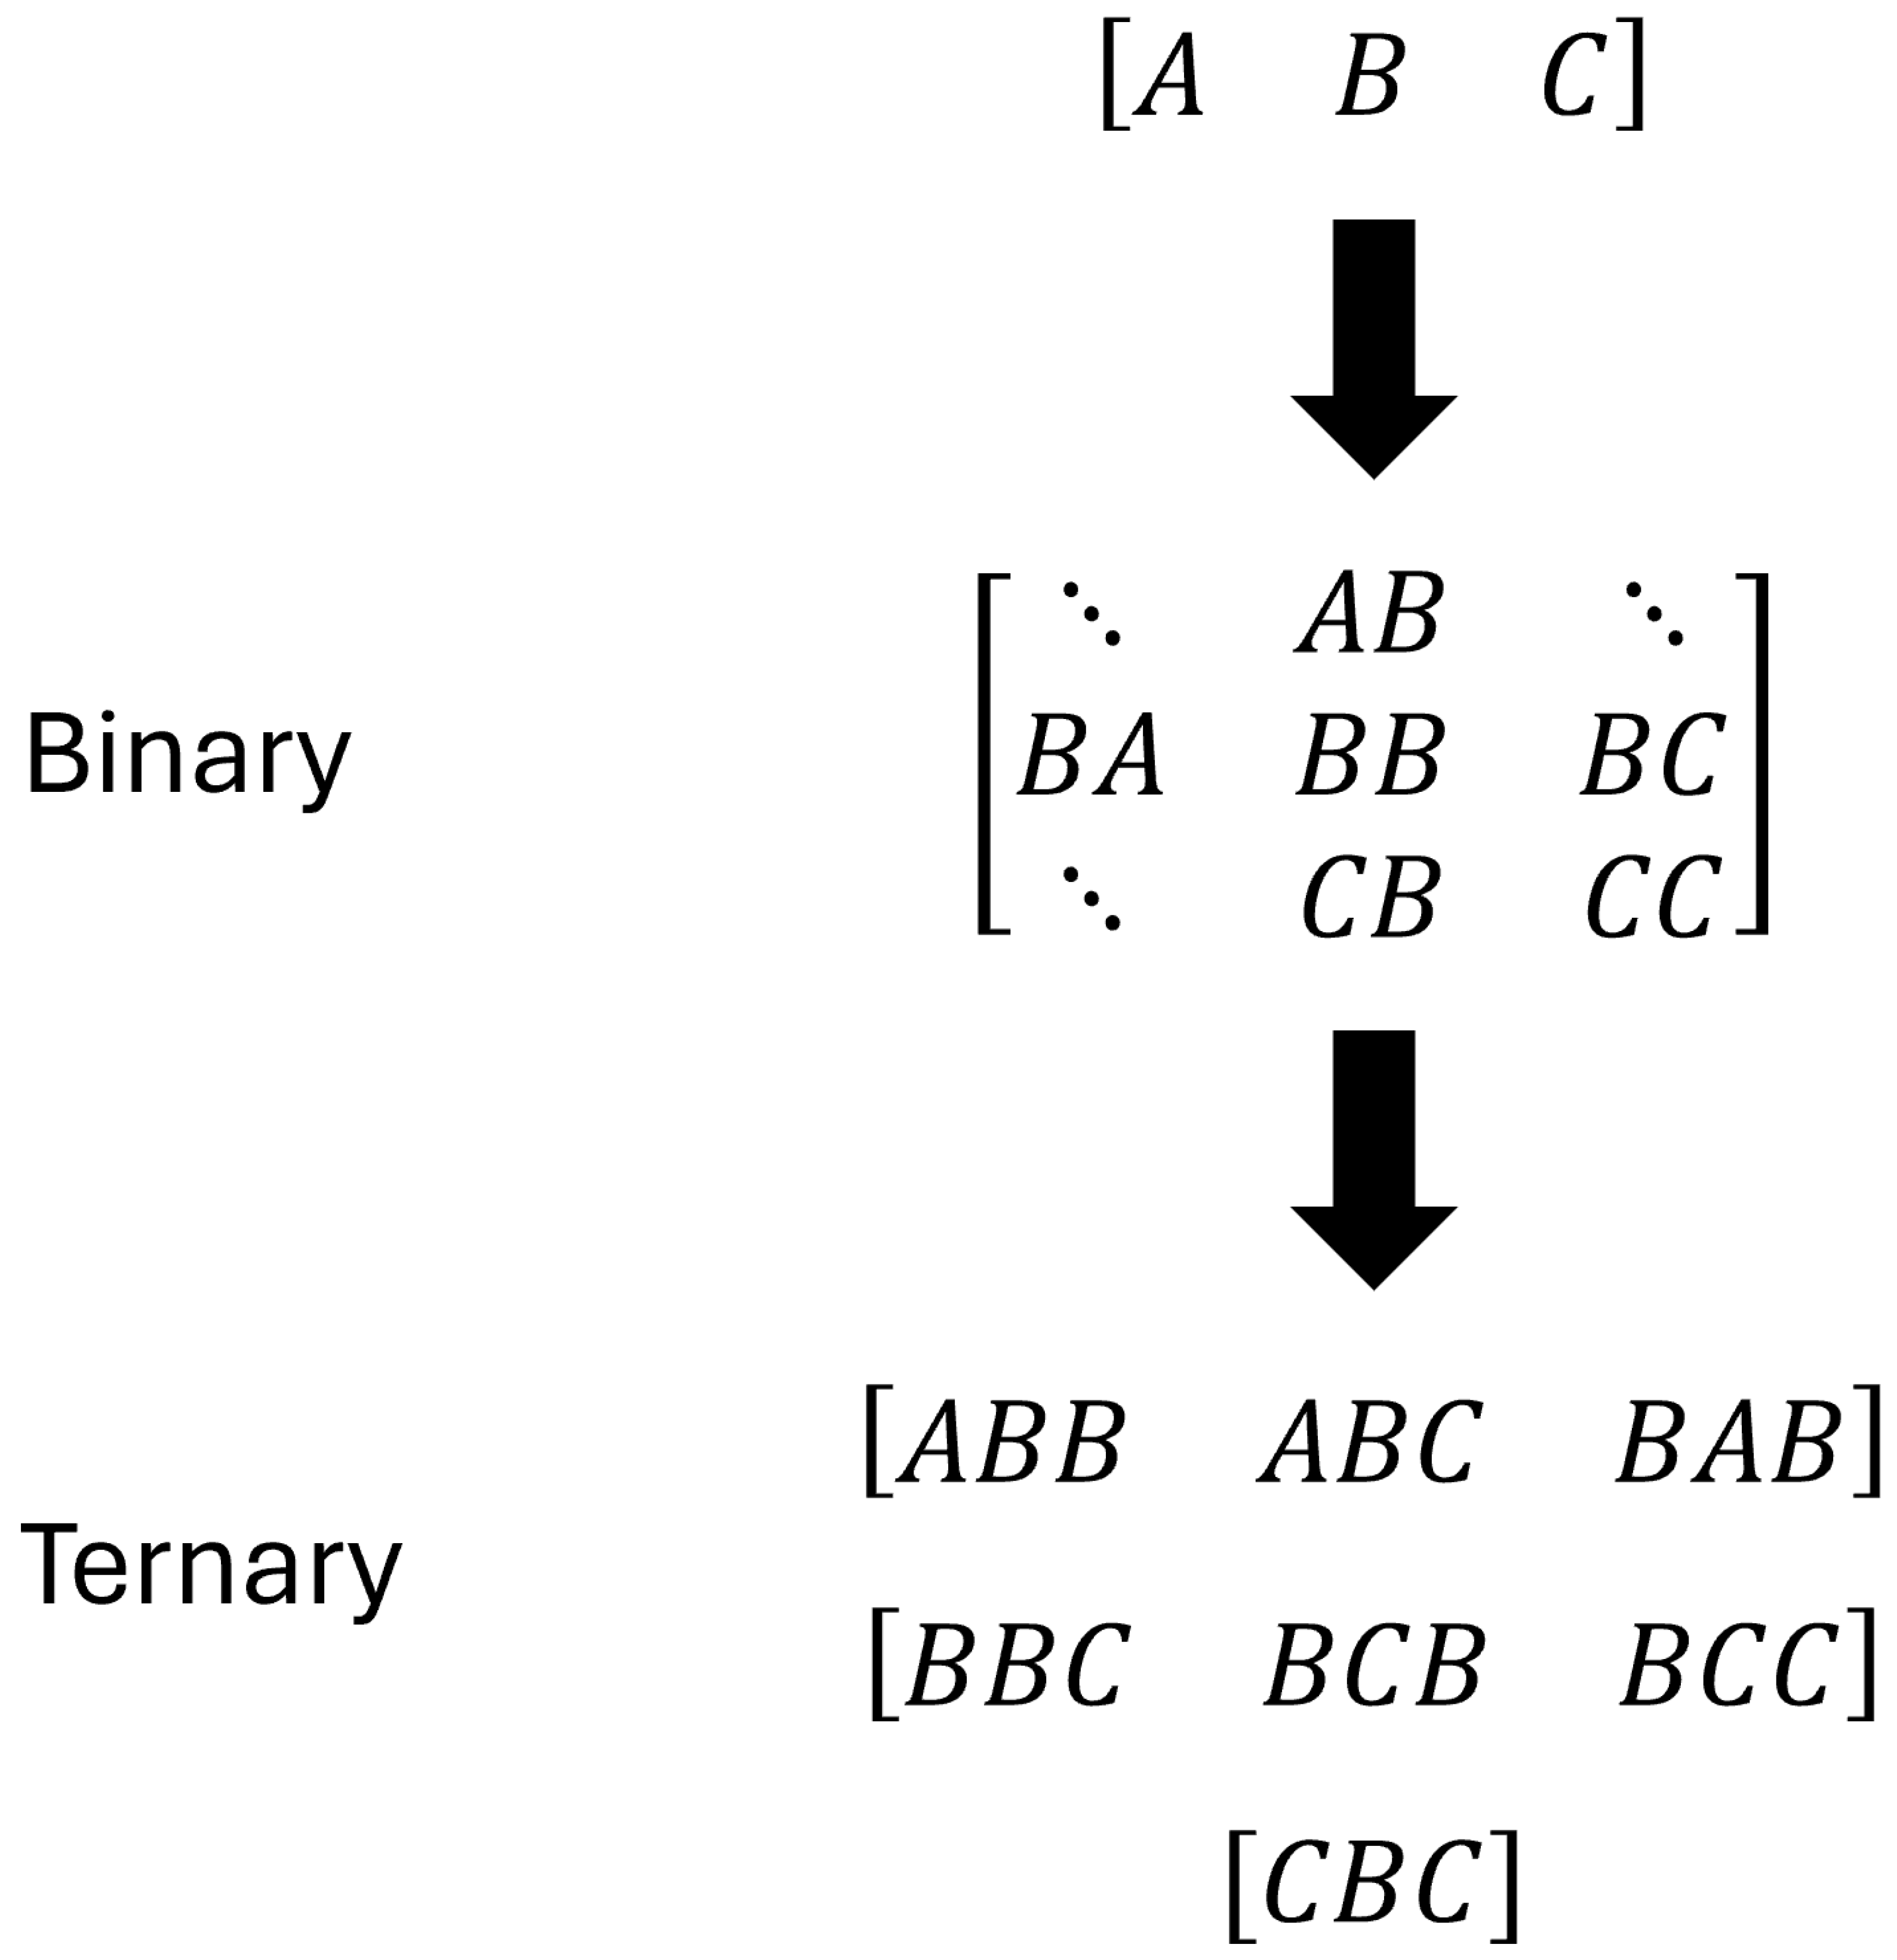
2.2. Classification Scheme of Water Oxygen Atoms

Since both the kinds of cages have pentagonal cages, a challenge lay in determining whether the impacts on the structural integrity were caused by the small or large cages. To address this important phenomenon, we classified the water oxygen atoms in the unit cell into three groups based on which group their surrounding atoms belonged to. A schematic of the classifications scheme is shown in Figure 1. We classified these groups based on the faces they belonged to. If the target atoms had four neighbors that, in any combination, may have only belong to pentagonal faces, this oxygen was labeled a C atom. If the target atom had four neighbors that, in some combination, may have only belong to pentagonal and hexagonal faces, this oxygen was labeled a B atom. If the target atom had four neighbors that, in some combination, may have only belong to two hexagonal faces, this oxygen was labeled a A atom. This classification scheme allows for the separation of oxygens into groups that connect two hexagonal faces (A), i.e., those that connect a hexagonal and pentagonal face (B) and those that only connect pentagonal faces (C), as well as provides more granular descriptions than those considering the differences as layers [43,44] or as polygons exclusively [45].
From these primary correlations based on oxygen atoms, we could also determine the binary correlations based on bonds and the ternary correlations based on angles formed between different oxygen atoms. The nature of these correlations is detailed in Figure 2. The combinations allowing for bonds and angles are not simply permutations and combinations of the available classifications, but also, rather, possess the limitations of the neighbor identity. This is why some elements of the binary combinations are not shown. Bond and angle patterns that were the reversed versions of each other were considered equivalent. This classification scheme provides a way to organize oxygen atoms based on their local environment with geometric criteria and a way to follow this identification with changes in pressure to ultimately show the evolution of the structure at various scales. While this division of the interactions into bonds (dimers) and angles (trimers) appeared discrete in nature, our analysis considers the nature of their evolution as part of the crystal structure. Therefore, we did not seek to analyze the individual formations in isolated environments as the entire, periodic structure was required for the formation and stability of the hydrate. Additionally, the cyclic structures that looked like isolated trimers of water were not important members of the overall continuous phases of ice and liquid water and, as such, their isolated analysis would not be relevant to the study of the hydrate structure [46]. This technique does not seek to quantify the post failure or post fracture behavior of the hydrate but rather to understand the structure leading up to fracture while still maintaining structural integrity.

2.3. Bond Length and Angle Calculations

Representing all the intermolecular and intramolecular bonds as vectors allows us to calculate the population of the bond lengths and angles between the different groups of atoms. The bond lengths were calculated as the distance between the two oxygen atoms, and the angles were calculated as the angle between the two vectors formed by the two bonds. In Figure 3, we show the vectors that were formed by the bonds between the oxygen atoms. The vectors u and v were defined according to Equation (1).
u = a b c .
The bond length between the two atoms was defined as the magnitude of the vector connecting the two atoms, which is given by Equation (2).
u = a 2 + b 2 + c 2 .
The angle between two vectors is given by Equation (3).
θ = arccos u · v u v .

3. Results

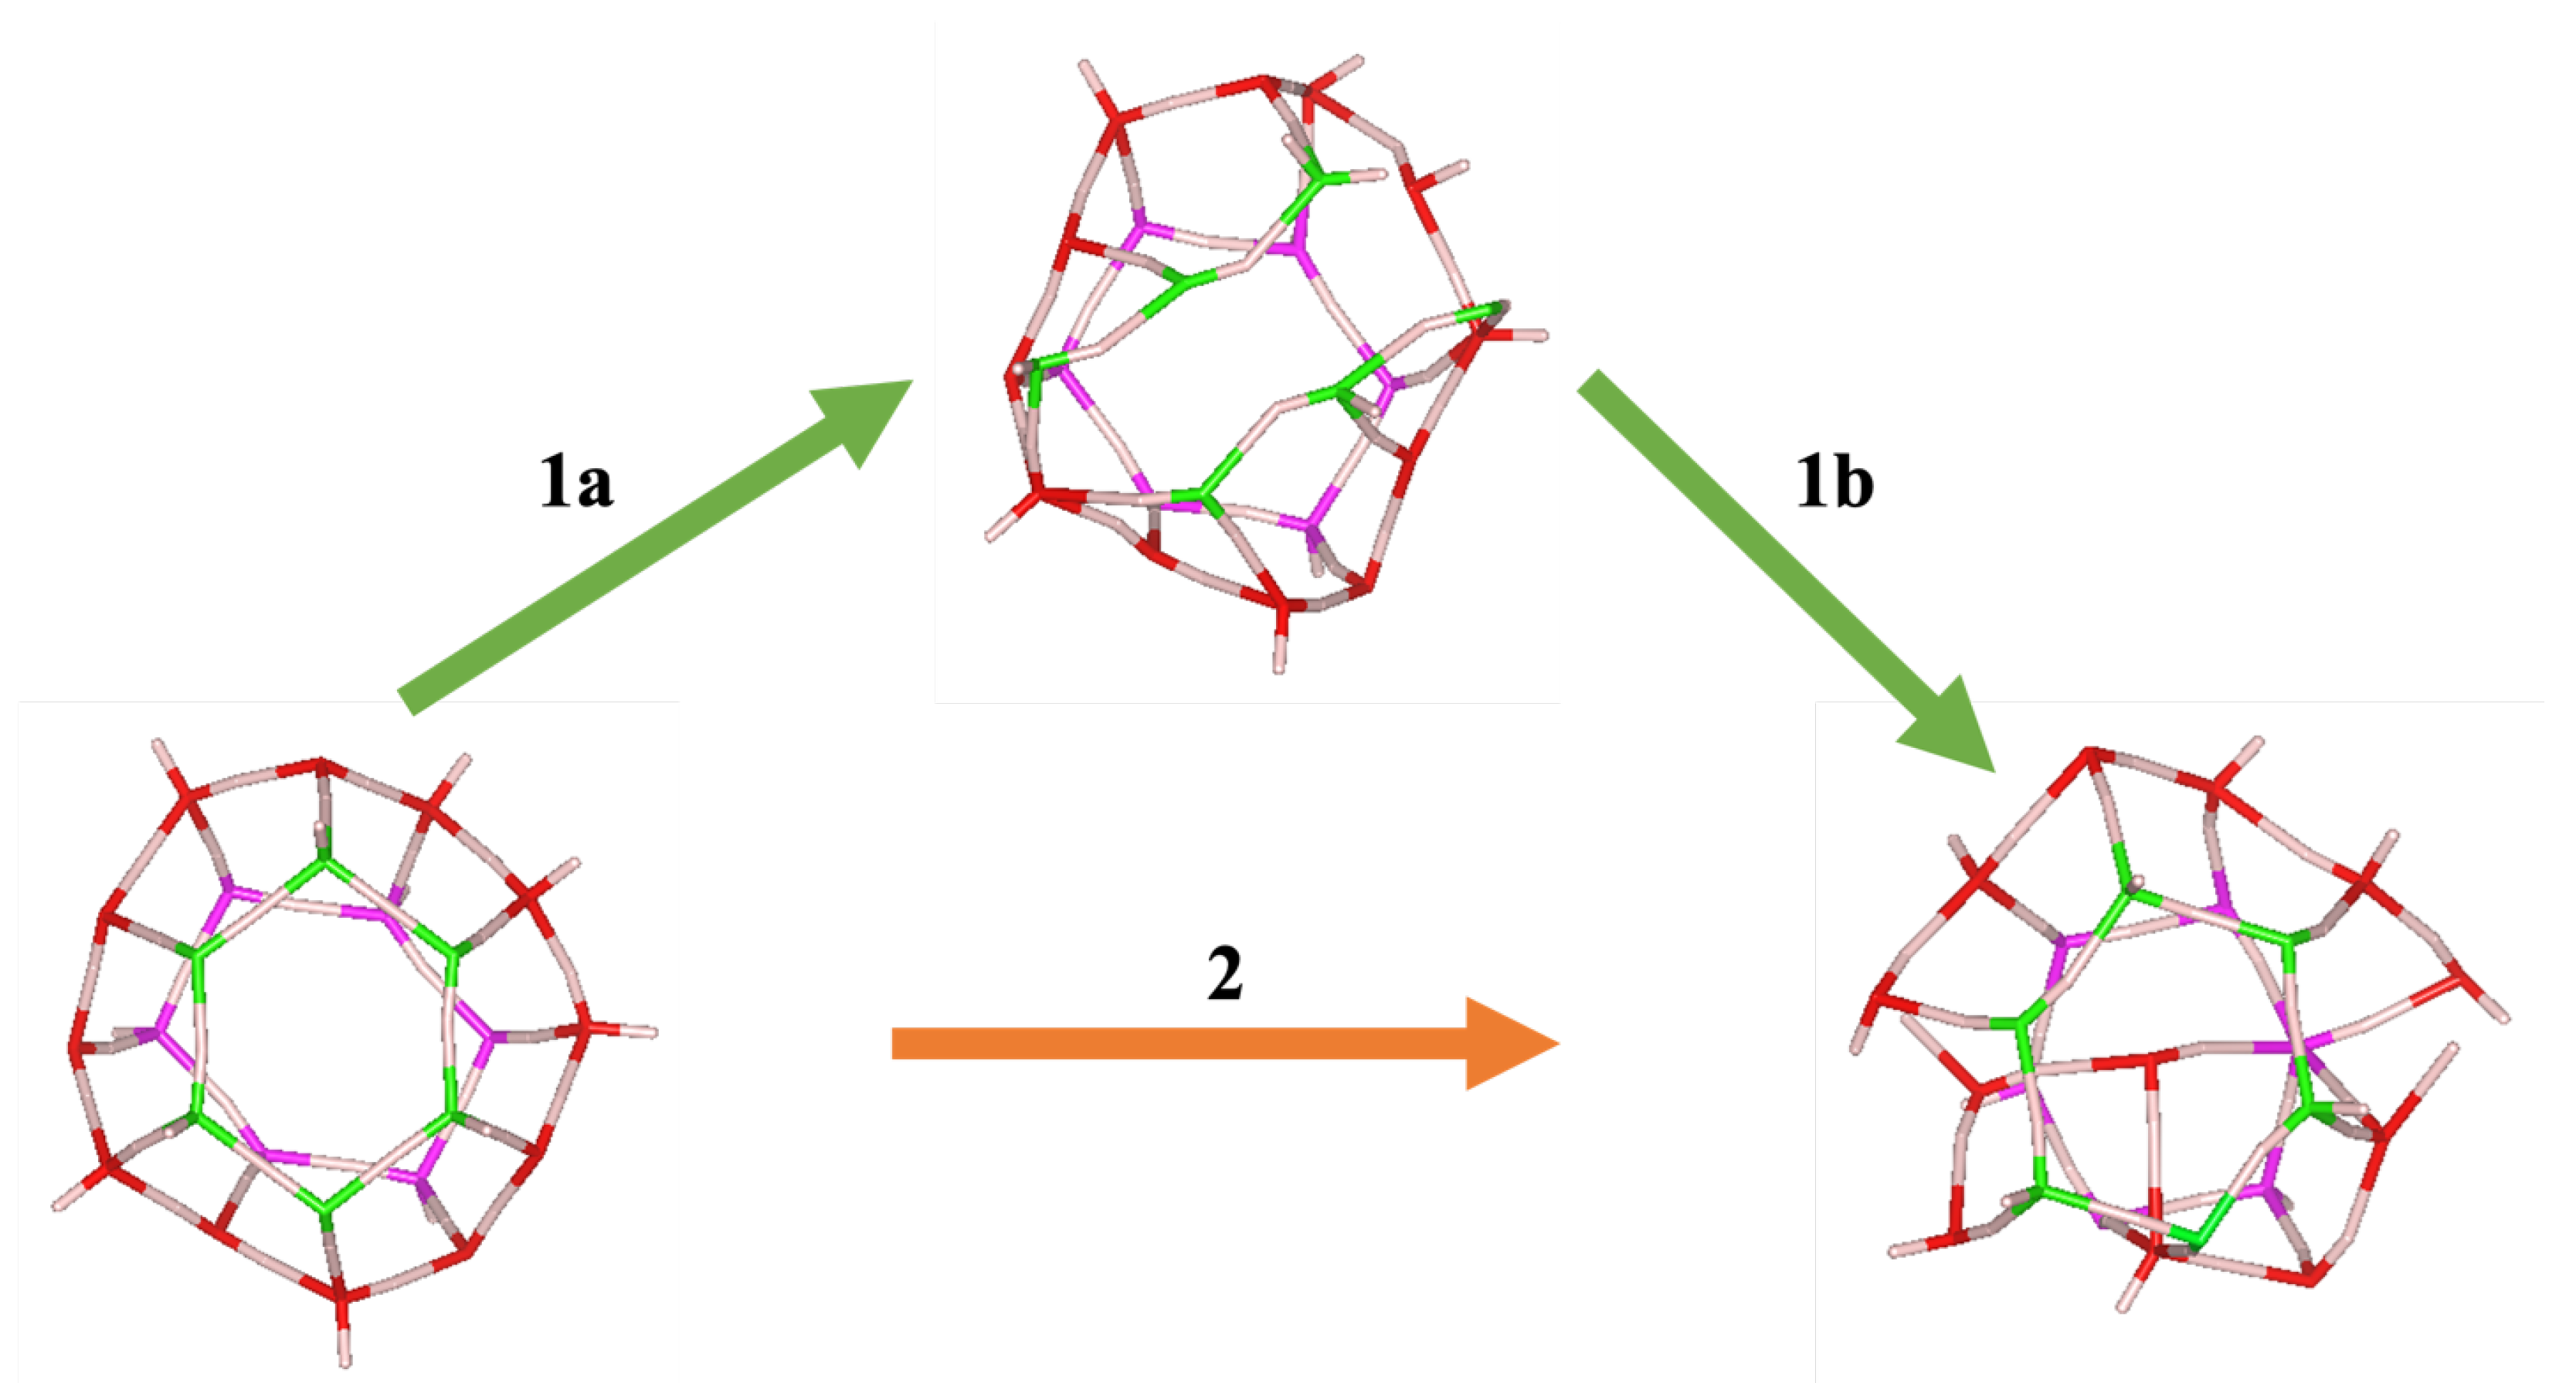
3.1. Fracture Mechanisms Under Pressure

Our previous work details the fracture mechanisms of sI methane hydrates under pressure and some of the different failure mechanisms involved [29,30]. The levels of occupation of the cages have a significant impact on the stability limits of the structures. The empty hydrate undergoes a complete structural collapse at 4.6 GPa, and the hydrate with occupied small cages and empty large cages decomposes at 4.9 GPa. The hydrate with occupied large cages and empty small cages begins a multistep structural decomposition at 6.3 GPa with a second step at 7.0 GPa. The fully occupied hydrate decomposes at 7.3 GPa with little metastability before complete structural collapse. The different fracture mechanisms discovered created some questions about the various fracture paths that may exist for hydrates, as seen in Figure 4.
With certain metastability existing along complicated fracture pathways, it is important to understand and characterize the local structure of the hydrate and how it changes under pressure. This also describes that certain interactions in the hydrate structure are able to redistribute stresses and strains and absorb the energy changes that accompany changes in the local and lattice structure. The cage integrity is supported by the different faces of the cage, which, in turn, are composed of the atoms that allow for the transfer and redistribution of forces. For the first pathway (1) shown in Figure 4, it is possible that several intermediate states precede the ultimate collapse. Regardless of the cage type, the structural integrity relies on the pentagonal faces. In some cases, the intermediate step of the first pathway results in an open hexagonal ring with the structural integrity maintained. In the second pathway (2), structural integrity does not exist anymore despite the maintenance of the hexagonal faces. The multistep fracture mechanism is a result of geometric changes in the lattice that overcome the energy barrier of decomposition in partially filled hydrates but are stopped by the same barrier in the filled hydrate. Therefore, studying the local structures of the fully occupied GHs will uncover the locations that may precipitate fracture in less filled hydrates, yielding important fracture information without requiring computationally expensive simulations of total fracture. Such multipath morphologies of fracture may be related to the path-dependent features that exist in the nucleation and dissociation of hydrates in experimental systems and, thus, should be further examined [11].
To explain the reasons and mechanisms behind the two pathways, Figure 5 summarizes the different divisions and numbers of faces and cages in the unit cell, as well as how they were shared. There are 48 pentagonal faces in one unit lattice, half of them being shared by one small cage and one large case. The other half are shared by two different large cages. The two small cages do not have any common faces. All the hexagonal faces are shared by two large cages. Previous work in the literature [30] describes that the occupied large cages spread the guest–host interactions’ supporting force because the large cages connect with all faces. The small cages only connect with the pentagonal faces and are disperse inclusions, and thus the guest–host interactions were not able to be redistributed. These connections and interactions require a comprehensive study beyond simply the faces and needs to describe the bonds and angles correctly to understand how certain polygons are able to bear and redistribute loads accordingly.

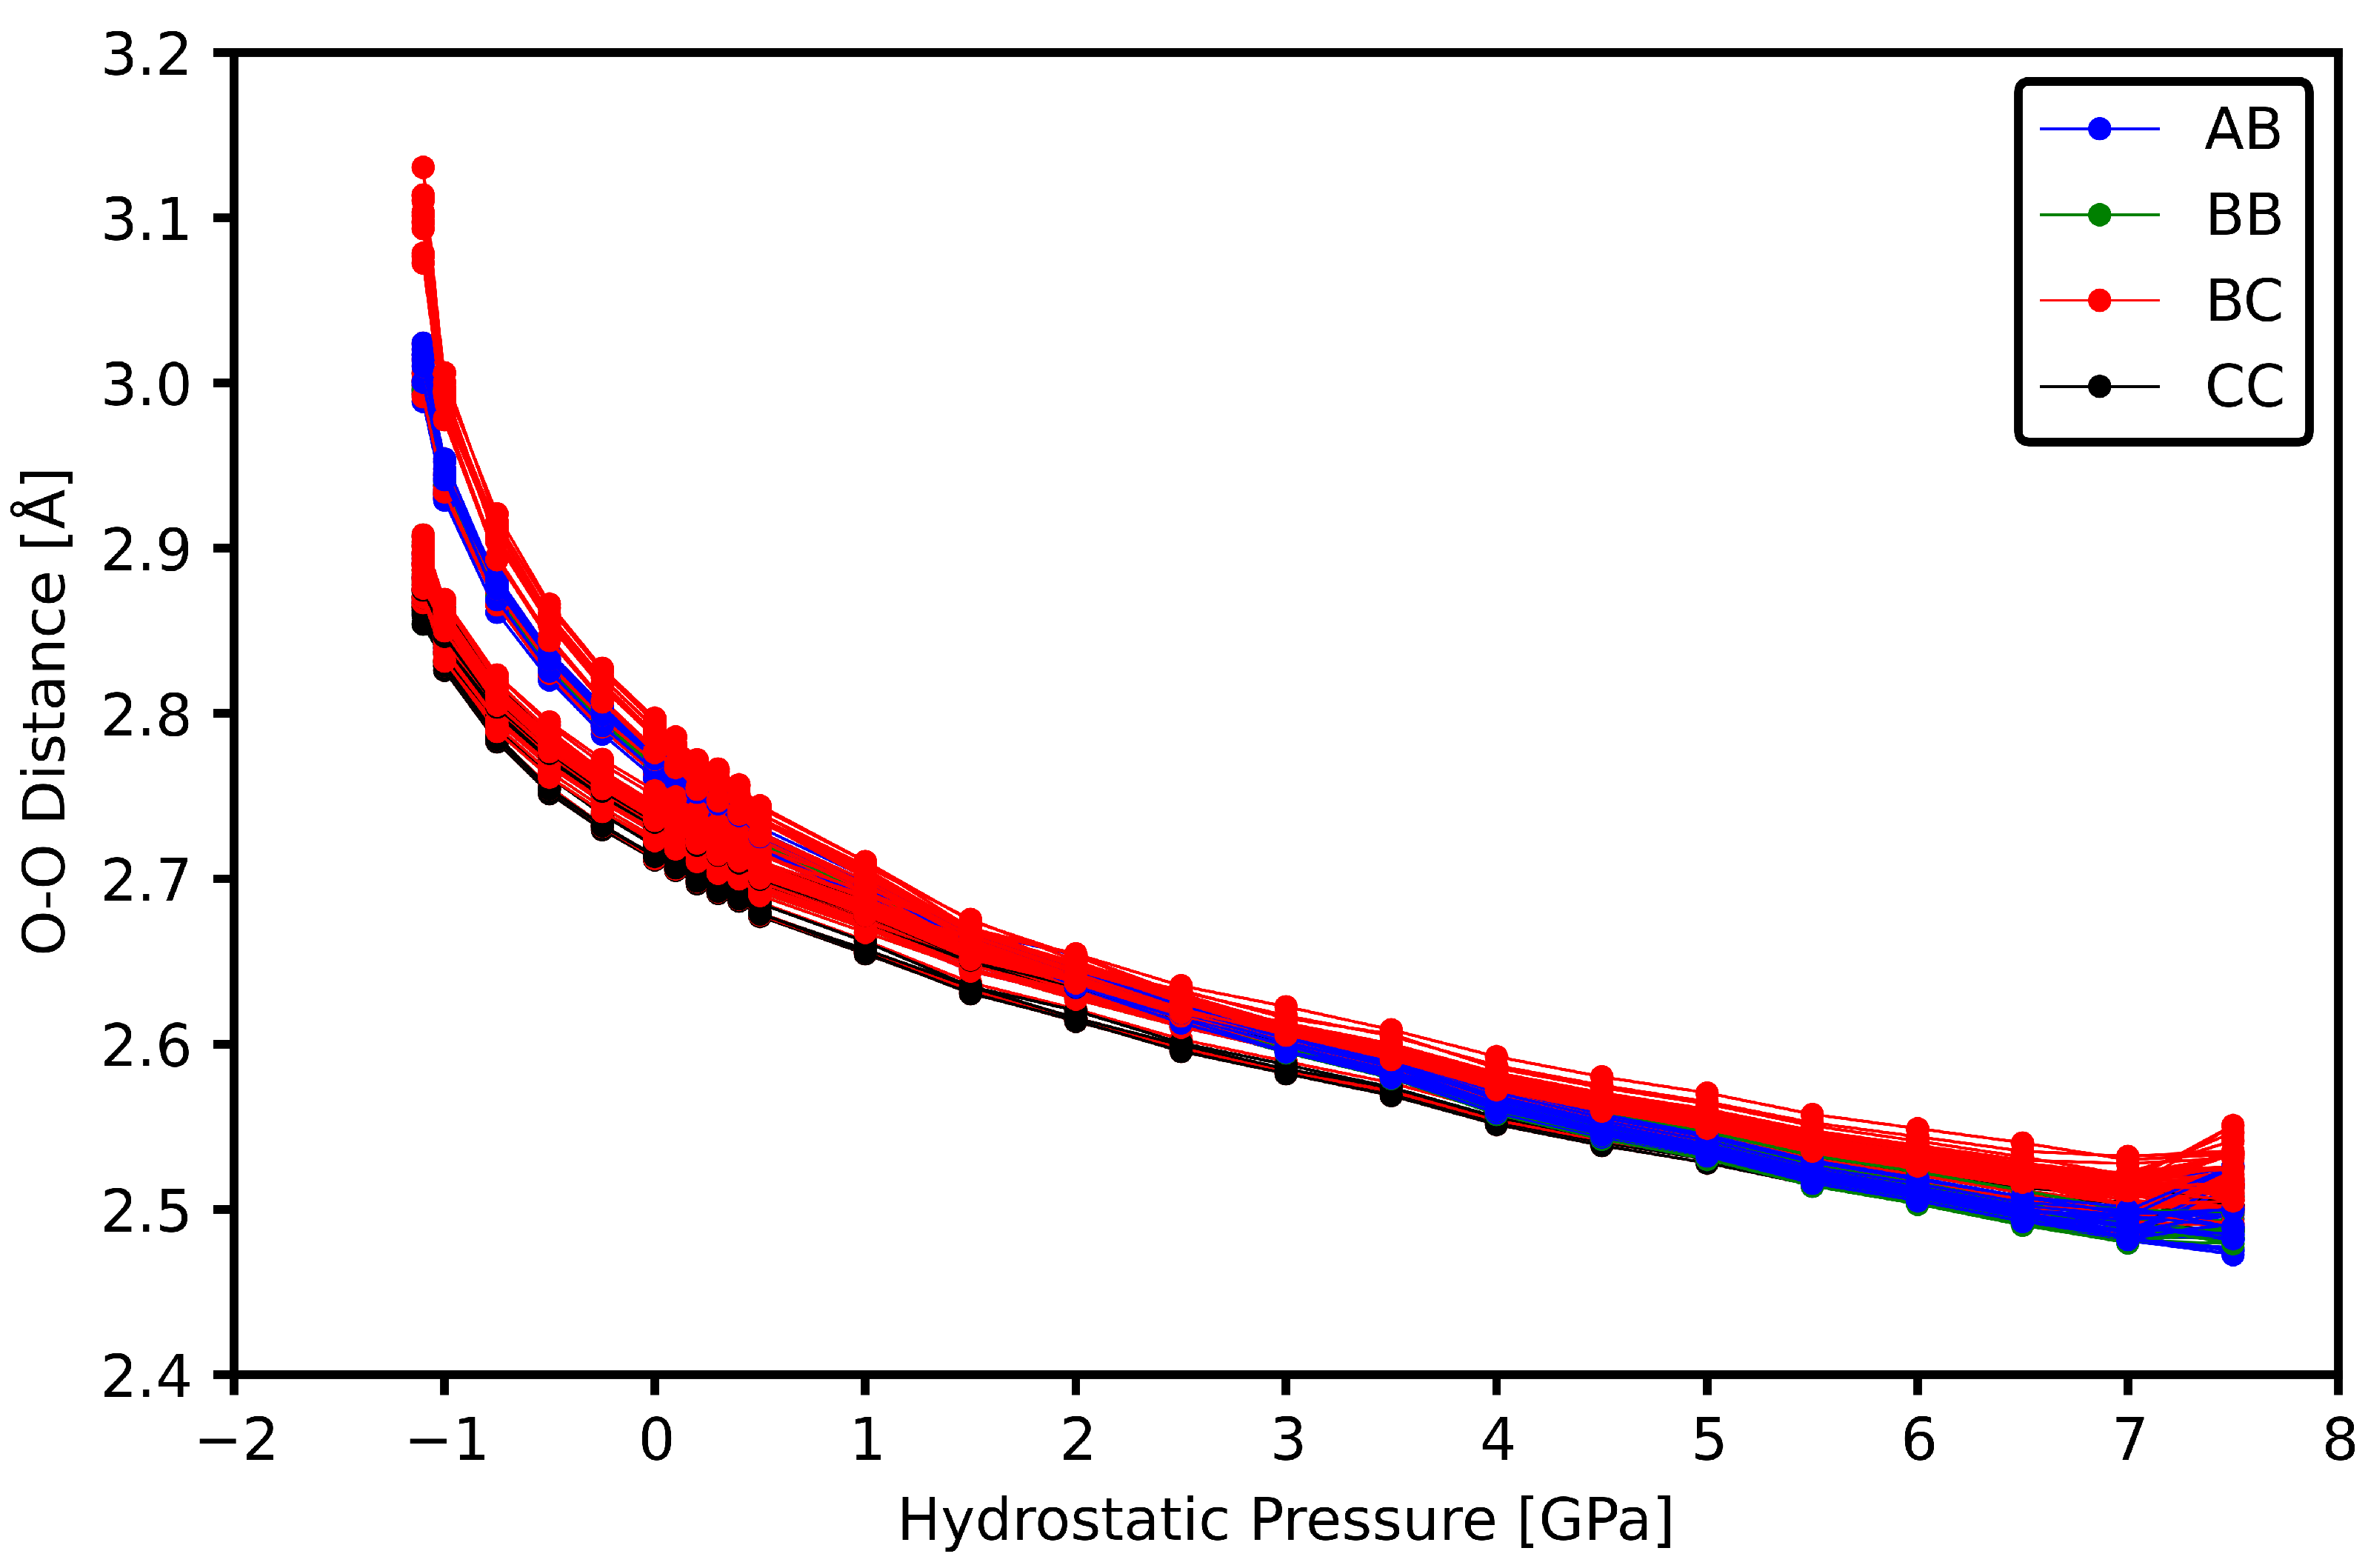
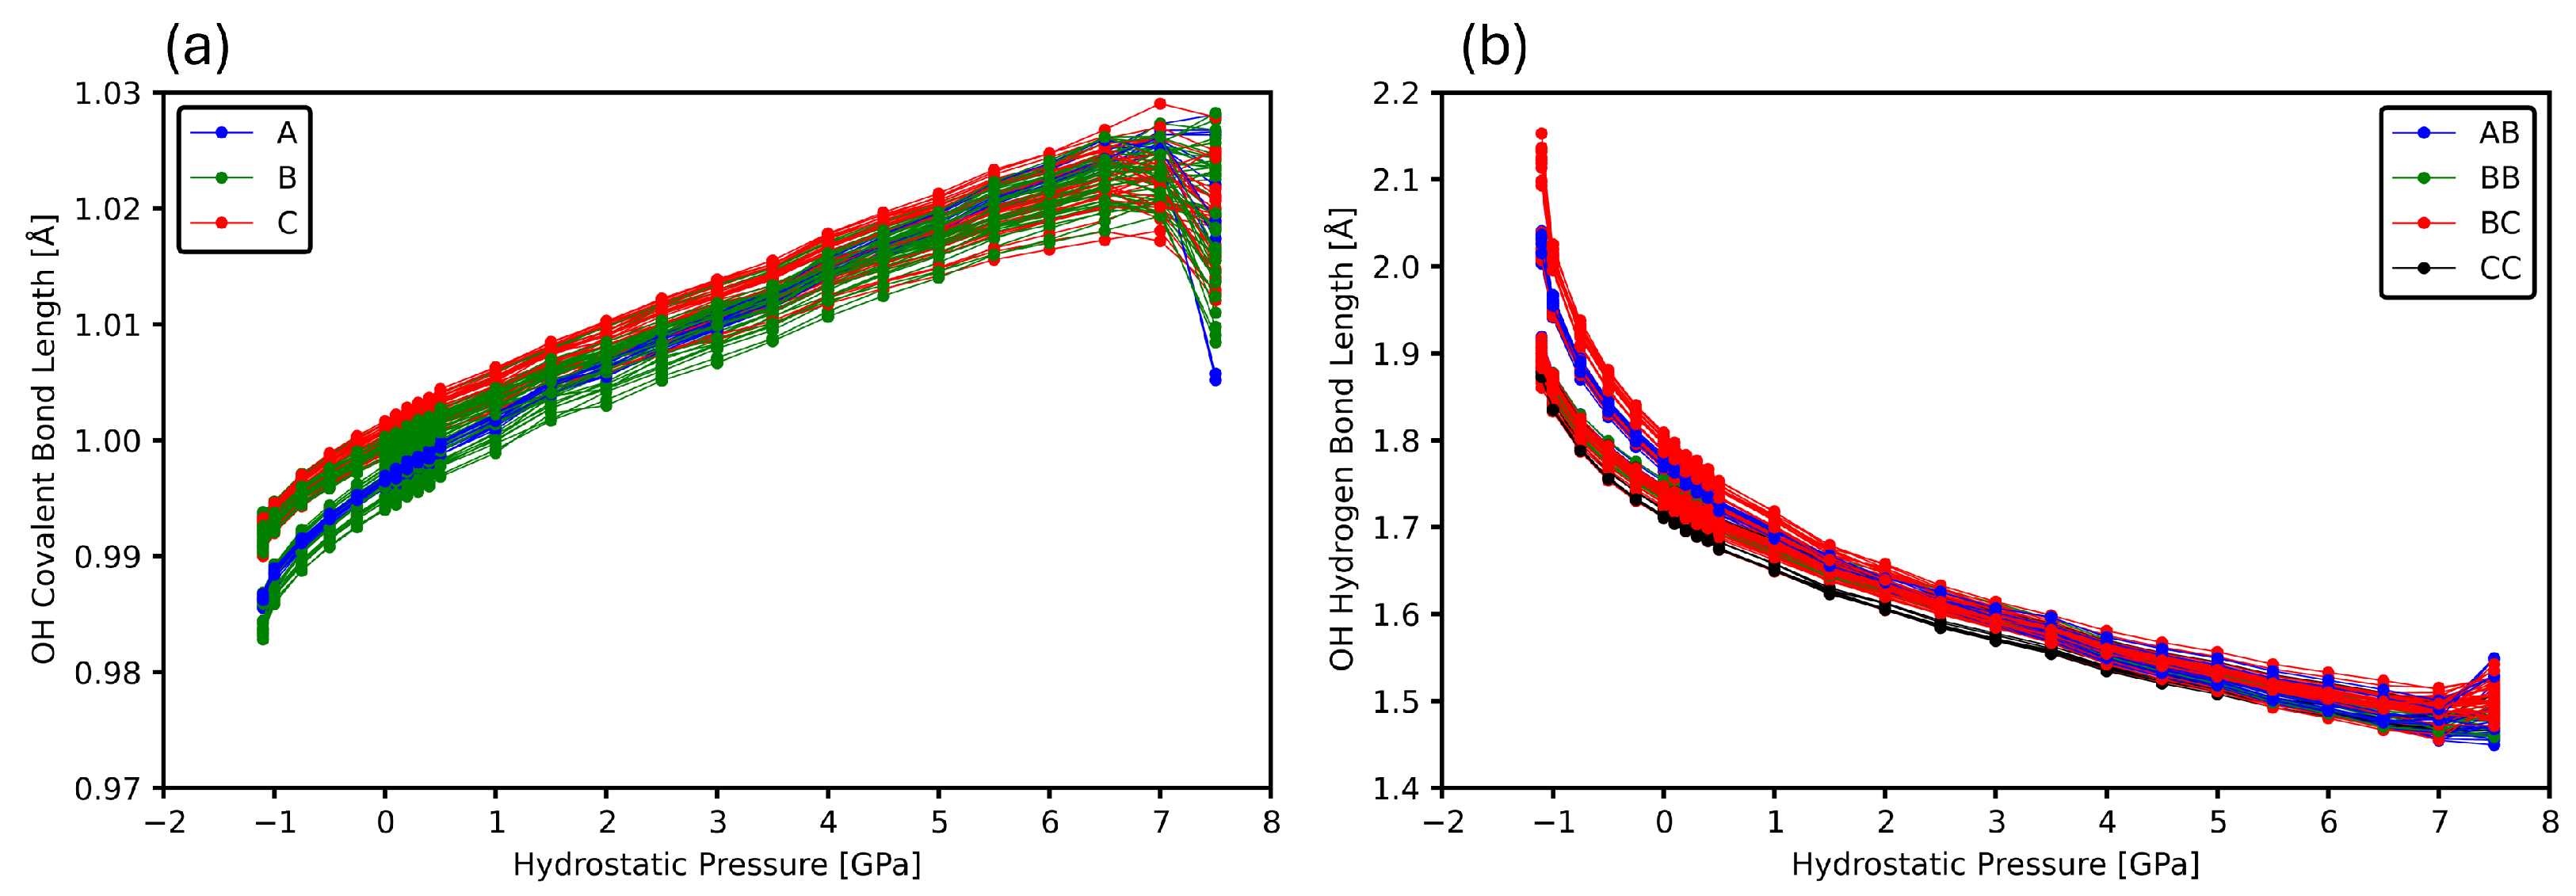
3.2. Intermolecular Bonds

The first step in quantifying the local structure under pressure is to examine the oxygen–oxygen (O-O) distance, which is equivalent to the side length of the polygons involved. Figure 6 illustrates how the O-O distance changes with pressure. The overall decreasing trend with increasing pressure is expected as the lattice shrinks and shows the general elastic response of the material. The four different curves, based on the atom types classified according to the aforementioned strategies, suggest slight anisotropy in the compressibility of different local environments. Each line represents the pressure evolution of one specific bond in the unit cell. The convergence of the curves at higher pressures indicates that the structure becomes more homogenized in terms of the O-O distance. The differences in the initial bond lengths diminished as the pressure forced the lattice into an isotropic configuration. This implies that the pressure causes a reduction in differences between the different atom types and their environments, providing possible fracture locations that correspond to the multistep fractures in cases where the large cages are occupied and the small cages are empty.
In the low-to-negative pressure region, particularly under 0.5 GPa of pressure, there was a clear split in the trends among the O-O distances. This region displayed a lack of existence of the parameters we were measuring. It existed from 1.1 GPa to 0.5 GPa, starting at 0.01 Å wide and ending at 0.0 Å wide, with its widest at 0.1 Å. We will refer to this region as a forbidden zone (FZ), and it was the first encountered in our analysis herein (FZ1). These regions appeared in the following analysis and are labeled appropriately. All the FZs are summarized together in Table 1. FZ1 shows the tendency of the O-O distances to present as a bimodal distribution before collapsing into a unimodal distribution as pressure increases. Interestingly, the BB and CC distances existed below this FZ (seen as white gaps and lack of points), and the AB distances existed above this region. Only the BC regions can exist on both sides of this forbidden zone. This divergence suggests that, at low pressures and under tension, the structure retains its anisotropic nature, and the local geometry of the cages and polygons has a larger influence on the spacing of the vertices. This splitting could be indicative of preferential weakening or stretching of the O-O distances in certain cage orientations, which is a precursor to local fracture.
The type B oxygens are the only oxygens that have two neighbors belonging to a pentagon and two neighbors belonging to a hexagon. This suggests that it is the only oxygen that is able to distribute the stress in the structure and it does so by participating in the formation of both types of polygons. The BC bonds in particular are able to exist in both regions, and they transmit the forces between the numerous pentagons and the few hexagons from the B to the C atoms. In higher-pressure regions, particularly beyond 7 GPa, the final steps in the compression of the lattice are seen, with fractures manifesting as large jumps and deviations. The O-O distance is actually composed of the covalent bond of the oxygen and its hydrogen, as well as the hydrogen bond of this proton with the other oxygen. Thus, we proceeded and examined the pressure trends of the two component bond types.
Figure 7 shows the covalent and hydrogen bond trends with pressure in the unit cell of the sI methane hydrates, describing the intramolecular and intermolecular interfaces in the system. The covalent bonds were classified based on the identity of the oxygen atom to which the proton was bonded, while the hydrogen bond was classified by the identity of the oxygen to which the proton was covalently bonded and the identity of the oxygen to which it was hydrogen bonded. In terms of trend progression, the covalent bond length tended to rise as pressure increased. The hydrogen bond length had a completely different pattern. This diminishing trend can be explained by the fact that, when the pressure rises, the distance between atoms decreases due to the volume reduction in the unit cell. As a result, the interatomic hydrogen bond was shortened. Furthermore, the covalent bond will behave in the opposite way as the hydrogen bond according to the previously studied compensation mechanism [18,19]. As a result, the growing trend in the length of the covalent bond can be explained. To reconcile the covalent and hydrogen bonds with the O-O distances, the covalent bond lengthens and the hydrogen bond shortens.
Both the covalent bonds and the hydrogen bonds showed distinct behaviors as the pressure limit is approached. On the tensile pressure side, the lengths of both bonds still maintained their initial trends, but the changes were much more pronounced. In contrast, the compressive side showed a more pronounced change in trends from initial behaviors. For both tensile and compressive pressures, the sudden increase in the amplitude of change indicated a approach to the limits of lattice stability. Since the initial relation between the pressure and the bond lengths could no longer withstand the external pressures, the system made more structural sacrifices to maintain the integrity of the lattice. Moreover, this change in the trend and reaction of the system was indicative of anisotropy with pressure. The atomic root of this lies in the proximity to the repulsive limits of the interactions and forces the bonds to elongate. Thus, both anomalous behaviors under extreme tensile and compressive pressures can be considered as strong indications of lattice instability that lead to fractures in empty or partially filled structures.
Furthermore, taking into account the change in the range of values, the range of bond values was projected to decrease with rising pressure since the drop in volume led to a decrease in the distance between atoms. As a result, regardless of the distribution, the range of the hydrogen bond lengths shrinked. As the stretching or compression limit was approached, the range expanded and the lengths fanned out. Then, the bond connections became unstable, causing the atoms to shift away from their initial bonding direction, leading to the expansion in bond lengths.
Apart from the trends in the bonds, the forbidden zones shown in Figure 6 were also present in the covalent and hydrogen bond lengths. For the covalent bond, we refer to the zone as the second forbidden zone (FZ2); for the hydrogen bond, we refer to it as the third forbidden zone (FZ3), and their details are summarized in Table 1. FZ2 and FZ3 caused the bond lengths to start as bimodal distributions and to collapse into unimodal distributions as the pressure increased, which was similar to the O-O distance. This challenges the conventional wisdom that material properties are distributed uniformly and continuously throughout the lattice. The pressure length of the forbidden lengths was the same, but the hydrogen bonds showed near identical similarities to the O-O distances and also the same splits across the forbidden zones. When the pressure was less than 0.2 GPa, the forbidden zone appeared. The bonds of Groups BB and CC were below the forbidden zone, Group AB’s were above, and Group BC’s bonds existed on both sides. The same splits showed in the hydrogen bond; however, the trends were flipped, a consequence of the compensation mechanisms that existed. The bonds involved in the small cages would have a relatively short length, which is the CC and the BC bonds. Due to the benefit of the B atoms being able to connect to both types of cages, the B atoms were able to maintain a more varied bond length (in the form of a BC bond); thus, the B atoms were able to maintain their structural integrity. The unique positioning of the Group A oxygen atoms, which were at the junction of the two hexagonal faces, can be used to explain the comparatively short bond lengths.
The bond lengths of the sI methane hydrates were conclusively and considerably impacted by changes in the external hydrostatic pressures. Additionally, the peculiar behaviors at the stability limits confirmed the structure instability under extreme pressures. The geometric properties of the oxygen atoms resulted in the non-uniform distributions of the bond lengths, creating forbidden zones in the bond lengths. This suggests that, rather than being a tool in the uniform distribution of forces and energies, the geometry of the system is responsible for localization of features and properties. A natural extension of the bond lengths was local angles in the system; therefore, those were also analyzed.

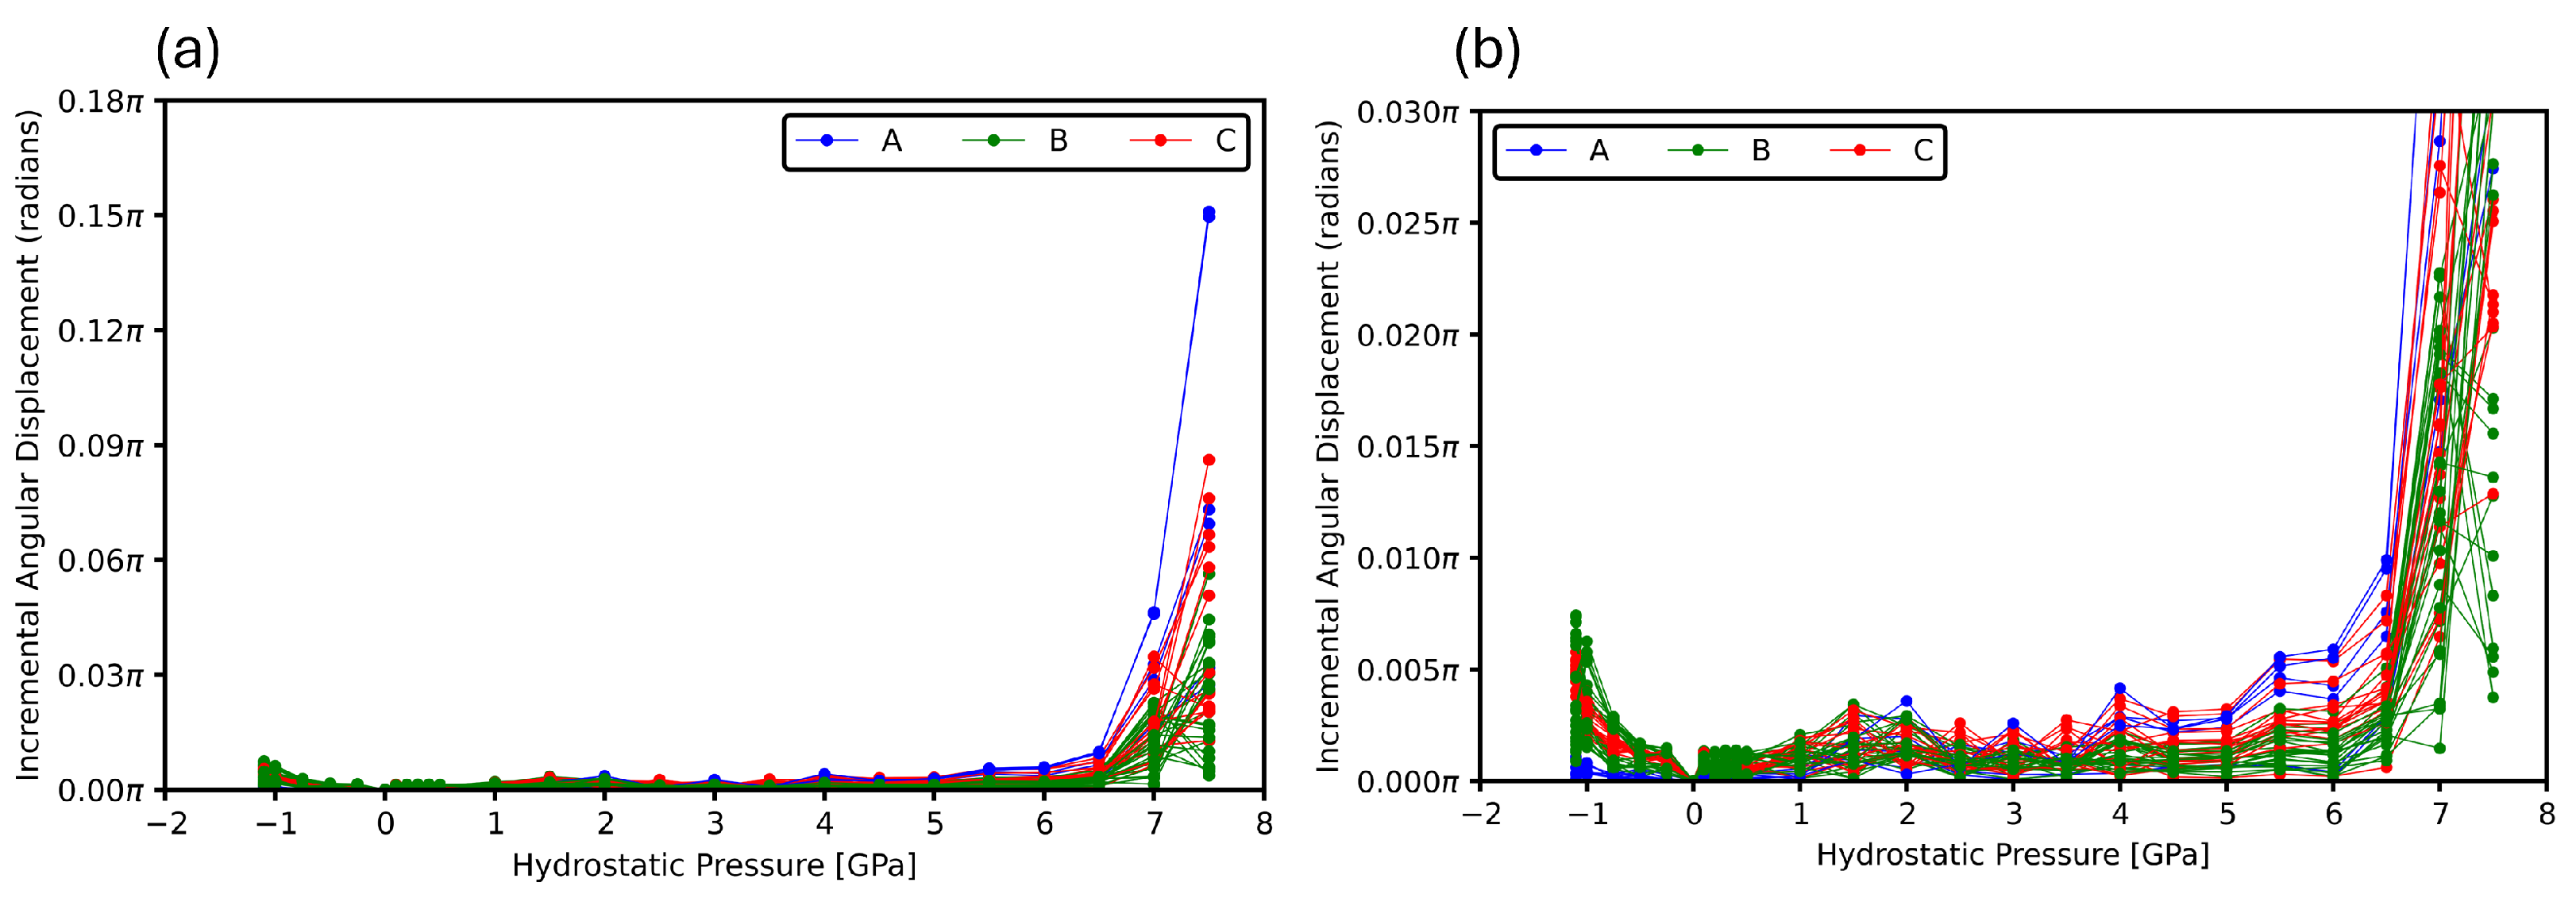
3.3. Intermolecular Angles

The anomalous behavior near the stability limit implies that the atomic motions did not follow their initial pressure trends. In order to quantify the deviations further, we evaluated the water molecule angles (HOH angle) and the oxygen–oxygen–oxygen angles (OOO angle) in the system. We employed the same oxygen classification as before. While it may seem important to classify the angles into three atom labels (BAB and CBB, for example), the trends observed were controlled by the central atom, and it became clearer when we classified the angles based on the central atom. Figure 8 shows the trends in the angles with pressure.
The HOH angles showed an increase from −1.1 GPa to 7.5 GPa. A fourth forbidden zone (FZ4), which was also bimodal at first, formed between 0.5 GPa and 4.0 GPa (seen as white gaps and a lack of points), where the water molecules were not able to exist. FZ4 started at 0.0 radians wide and ended at 0.0 radians wide, with its widest at 0.002 π radians. FZ4 is summarized and compared to the other FZs in Table 1. The HOH angles remained bimodal until the forbidden zone closed at 4.5 GPa, and then they became unimodal. In the entire pressure range, all of the HOH angles were greater than the water molecule angle of 0.58 π , and they showed an increasing tendency with the pressure, as well as a widening of the possible angles. This increase in spread cane from the increasing repulsive interactions resulting from the atoms getting closer during contraction with increasing pressure. To relieve the repulsion from both intramolecular and intermolecular interactions, the water hydrogen atoms would deviate from their initial bonding directions and try to move apart, increasing the resultant HOH angle.
We found water molecules with central C oxygens that are able to have angles on both sides (above and below) of the fifth and final forbidden zone (FZ5) that our analysis discovered, starting at 1.1 GPa and ending at 6.5 GPa. FZ5 started at 0.005 radians wide and ended at 0.0 radians wide, with its widest at 0.01 π radians. This zone was the widest, relatively, and persisted the longest, showing the bimodal nature of the OOO angles present in the system. FZ5 is summarized and compared to the other FZs in Table 1. The C atoms were the least flexible and had the smallest, as found previously, bond lengths. They also crossed the least of the covalent bond length space when compared to the other bonds. This means that to disperse and distribute the energy and stress, they must do so via angle changes and not through bond changes. Water molecules with a central A oxygen cross more of the covalent bond space under compression and thus maintain their water molecule angles stronger. Those with the B oxygens passed below the forbidden zone and displayed the least angle variability because they participated in hexagons and pentagons and used bond lengths to distribute the energy, as changes in the angles would involve overcoming more energy barriers due to the chained rearrangement of the two different polygonal structures that would be required.
When approaching the compressive stability limit, the HOH angles diverged. At 4.5 GPa, the forbidden zone closed and the pressure point was where the HOH angles began to show significant increasing tendencies. When pressures reached 6.5 GPa, strong fluctuations appeared that show manifestations of instability. Our previous work shows that this corresponds to just after the moment that the lattice of a hydrate with filled large cages and empty small cages would begin its multistep fracture pathway [30]. As the filled GH lattice had not decomposed yet, it still displayed weaknesses that would collapse a weaker, partially filled structure. Therefore, the trends in the HOH angles with pressure served as a predictive measure of the stability of the hydrate in such a way that avoided needing to simulate the myriads of possibilities in simulating populations of partially filled hydrates.
The bulk of the OOO angles in Figure 8, particularly the bottom portion of the plot, show the angle distributions and values similar to the HOH angles near the standard water molecule angle. This was expected since the ideal case had oxygen atoms and hydrogen atoms aligned and the corresponding angles would be the same or similar. However, as the B atoms can participate in both hexagons and pentagons, they should have two very distinct stability trends on either side (above and below) of the new forbidden zone that extends over a much wider pressure range and the previous zones. Under tensile stress, the atoms of B and A approach the value of 0.67 π , which corresponds to one sixth of the total internal angle of a hexagon. This implies that, as the pressure decreases and the tensile stress increases, the atoms are moving farther apart and one then approaches a purely geometric regime, where the repulsive forces of the entirely of the lattice are not dominant. This is more evidence that the B atoms are able to provide the energy and force dissipation benefits of both polygons in the system.
In GH systems, the OOO angles were confined within the hydrogen-bonded framework. The narrow distributions around normal pressure regimes corresponded to the highly ordered and symmetric hydrogen bonding network, which was critical for maintaining the rigidity and stability of the hydrate lattice. Under external pressures, these stability regions disperse and widen as a result of the competing attractive and repulsive forces, along with the spatial optimizations occurring as the lattice shrinks. The narrowness of the angular distribution, while indicative of a structural order, also reveals a potential brittleness: the hydrate can maintain its form well under equilibrium conditions but it lacks the angular flexibility needed to absorb large mechanical or thermal stresses without breaking. Some trends in the angles of the systems have shown changes corresponding to breakdowns in structures that are partially filled.
To supplement the systematic predictive abilities of the angles and their changes in determining if partially filled structures would collapse, we also examined the changes in the orientation of the water molecules and how they changed with pressure.

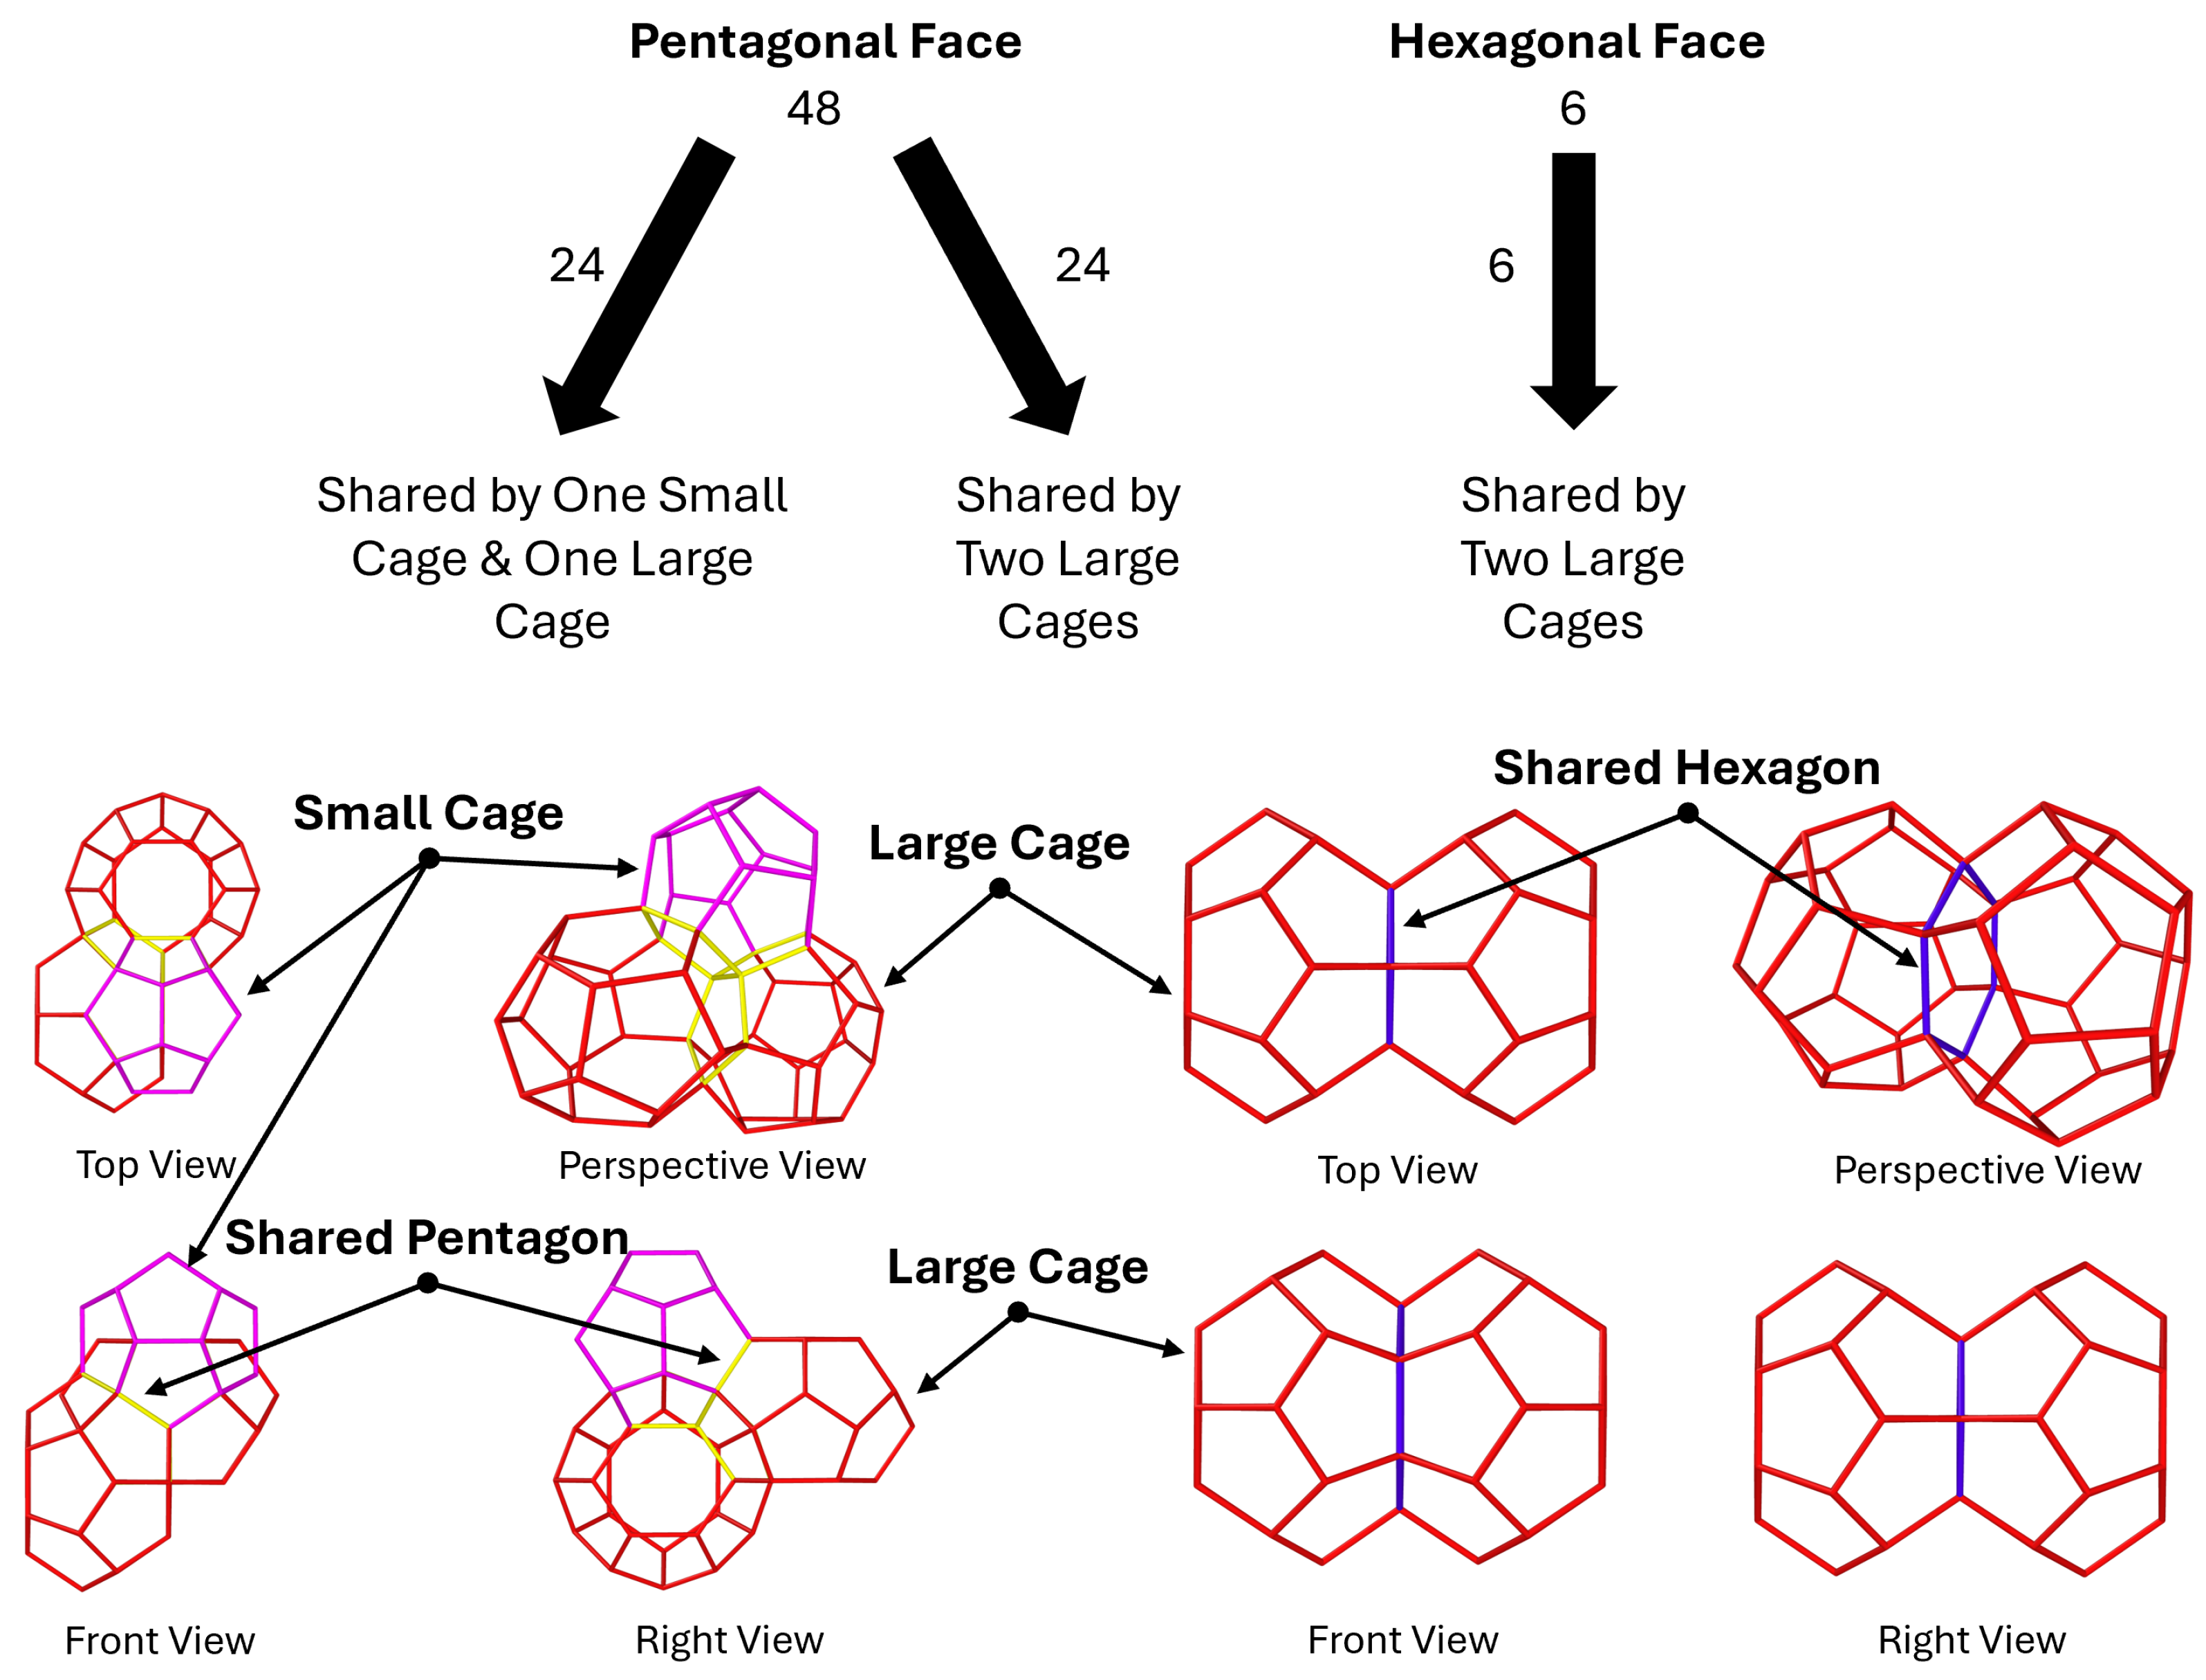
3.4. Structural Breakdowns

The bond lengths and angles already provided insight into how the structure of the hydrate changes with pressure. Additionally, they tell us how the lattice in general may change with pressure. However, certain angles and bonds are quite stiff, and the accumulation of stress may not display itself in atomic interactions. Therefore, we analyzed the orientation changes in the water molecules in the system. This allowed us to see how water molecules are adapting to the increasing pressures beyond the changing of distances between the oxygen and the hydrogens or the distance between the two hydrogens. Given the dipolar nature of the water molecule, such orientational analysis provides an additional dimension of insight to the structure [24].
To accomplish this, we first defined a vector with its origin at the oxygen atom of the given water molecule. The vector points to the midpoint between the two hydrogen atoms of the water molecule. This vector was then transformed into spherical coordinates, which allowed us to visualize the orientation of the water molecule in a more intuitive way. Figure 9 shows the population of the vectors, one per water molecule, which were plotted over all pressures. The dots connected by lines indicate a single water molecule vector, and the increasing diameter of the dots represents increasing pressure, while the shaded region shows the periodic nature of the angular domain.
Figure 9 allows for the visualization of how all the water molecules were changing orientation. Water molecules with oxygens of type B showed the least variation with pressure. These atoms and molecules showed the most variability in bond lengths and angles and, thus, the least variability in orientation as they were able to distribute the forces and energies through the bond lengths and angles. The A and C atoms showed, particularly with the final pressure steps, the largest distance (in orientation space) between the two orientations. As these two atom groups, when considering situations where they are not bound to C atoms, cannot exist on both sides of any of the aforementioned forbidden zones, they were forced to change their orientation to maintain the stability of the lattice. Figure 9 also shows some of the symmetric nature of the lattice, with the water molecules possessing the largest jumps often reflected in pairs. While this may provide certain insight into clusters of changing orientations, analyzing the distance in orientation space directly with increasing pressure may elucidate the structural changes that cause lattice collapse in a partially filled system. Therefore, this relation is shown in Figure 10.
Figure 10 shows the distance traveled in orientation space for each water molecule with increasing pressure relative to its previous orientation. It provides a way to relate how much more each increase in pressure caused the water molecule to change its orientation. While the plot on the left shows the clear jump at 6.5 GPa, corresponding to the start of structural breakdown, it does not clearly show some of the rearrangements at lower pressures that could also indicate changes. Therefore, the right portion of Figure 10 show the same data with a smaller range in angular displacement.
Recall that the empty hydrate structure decomposes at 4.6 GPa, the sI hydrate with occupied small cages and empty large cages decomposes at 4.9 GPa, the hydrate with occupied large cages and empty small cages starts to decompose along a multistep path at 6.3 GPa, and the fully occupied hydrate decomposes at 7.6 GPa [30]. When undergoing compression from the zero pressure state, the first significant spike in angular displacement occurs at 4 GPa. This means that the water molecules had the largest angular displacement with pressure, indicating an initial large-scale rearrangement of the water molecules. As the structure reached this point, it neared the fracture point for an empty hydrate as further pressure increases led to even smaller displacements that would have broken the cage. The next significant and sustained displacements happened between 5.5. and 6.0 GPa, the pressures preceding the multistep breakdown of partially filled hydrates. This indicates that the water molecules were making increasingly large rearrangements to dissipate the increased energy and forces from the increasingly larger hydrostatic pressure. At some point, any further displacement, even if small in magnitude, will cause the structure to break. The continued and large scale displacement of water molecules beyond 6.5 GPa indicated that the structure was no longer able to maintain its integrity and the system was breaking down. The narrow range of stable tensile stresses in this case did not provide an intricate structural change because the system was not dealing with such complicated balances. The atoms of type A led the displacement trends because the pentagons were smaller and less stable than the hexagons. Thus, the polygonal structure was more sensitive to changes in its shape because there were less atoms to distribute the geometric changes among. While the fully occupied structure simulated herein did not decompose at any intermediate pressures, the displacement jumps were indicative of local rearrangements that, in a partially occupied system that possesses an energy barrier to fracture lower than the fully occupied hydrate, would lead to ultimate fracture. As such, the findings presented here provide a method of identifying at which pressures and which types of atomic junctions (pentagons, hexagons, etc.) the fracture would be likely start at for similar conditions.

4. Conclusions

This research investigated the sI methane hydrates atomistic geometric features in terms of pressure loads under a zero Kelvin configuration through a systematic atomistic computational methodology and a multiscale analysis (from lattice to cage to face to vertices). We found that, in all aspects, the pressure stability limits can be determined as −1.1 GPa to 7.5 GPa for sI methane hydrates by looking at their bond lengths and angles. Two different fracture mechanisms that have been previously proposed were validated by explaining how specifically classified oxygen atoms were distributing and dispersing force and energy through the system via specific changes in their bonds and angles [30].
The study of the bond length and bond angle distributions under pressures shows the existence of forbidden zones. These forbidden zones are contributed to by the geometric features of the oxygen atoms. The type of central and neighboring oxygens that encompass the local structure of the hydrate lattice are able to provide a more complete picture of the local structure and how it changes with pressure, and they also show the strength of geometric analysis in crystal structure studies. Additionally, the angular displacement of water molecules corresponded closely to the stability limits of partially filled hydrates without directly simulating them, significantly cutting down on costly computational simulation time.
DFT calculations were performed at zero Kelvin, which means thermal effects were not included in the computations. While this limited the ability of DFT to capture certain temperature-dependent phenomena, the zero Kelvin calculations were still able to provide a good approximation of the system’s behavior. Geometric analysis techniques that focus on structural arrangements without considering electronic, atomic, and molecular interactions explicitly may show some similar limitations. However, these techniques have proven adequate in GH systems and provide a strong basis of fundamental analysis and understanding for future works with larger system sizes that will balance accuracy with computational cost.
The results from this work fill the knowledge gap of non-uniform distribution of material properties within the lattice and also investigate the geometric features of atoms that make up GHs. The specific features of spatial distributions of bonds, angles, and orientations of the component water molecules emphasize that the impact of geometric features cannot be ignored. All of these findings can be applied on any hydrogen-bonded system and provide a robust foundation for future applications and research of similar systems that have costly formation conditions or complex structures. In turn, this system creates a strong method of predicting possible fracture paths and stress concentrations without needing to study an experimental structure to failure at molecular resolution. Additionally, the geometric features can be extracted from characterization methods to allow the performance of simulations of materials within stable regions of its phase diagram such that expensive computations near the failure limits are minimized. Following this multiscale computational materials science methodology, the characterization of the adaptive geometry of crystalline GHs describes and defines the range of elastic stability, which is a crucial contribution to energy materials science and engineering.

Author Contributions

Conceptualization, S.M., X.Z., A.G., P.S. and A.R.; data curation, S.M. and X.Z.; formal analysis; S.M. and X.Z.; funding acquisition, P.S. and A.R.; investigation, S.M. and X.Z.; methodology, S.M. and X.Z.; project administration, P.S. and A.R.; resources, P.S. and A.R.; software, S.M. and X.Z.; supervision, P.S. and A.R.; validation, S.M.; visualization, S.M.; writing—original draft, S.M.; writing—review and editing, S.M., P.S. and A.R. All authors have read and agreed to the published version of the manuscript.

Funding

This research was funded by the Natural Sciences and Engineering Research Council of Canada Discovery under Grant numbers 223086 and 206269.

Data Availability Statement

Data are contained within the article.

Acknowledgments

This work was supported by the Fonds de Recherche du Québec Nature et Technologies through the Bourse de Doctorat en Recherche. This research was enabled, in part, by the support provided by Calcul Quebec, the BC DRI Group, and the Digital Research Alliance of Canada (https://alliancecan.ca/).

Conflicts of Interest

The authors declare no conflicts of interest.

References

  1. Carroll, J. Natural Gas Hydrates: A Guide for Engineers, 3rd ed.; Gulf Professional Publishing: Houston, TX, USA, 2014. [Google Scholar]
  2. Koh, C.A.; Sloan, E.D.; Sum, A.K.; Wu, D.T. Fundamentals and Applications of Gas Hydrates. Annu. Rev. Chem. Biomol. Eng. 2011, 2, 237–257. [Google Scholar] [CrossRef]
  3. Sloan, E.D. Fundamental Principles and Applications of Natural Gas Hydrates. Nature 2003, 426, 353–359. [Google Scholar] [CrossRef]
  4. Mathews, S.; Daghash, S.; Rey, A.; Servio, P. Recent Advances in Density Functional Theory and Molecular Dynamics Simulation of Mechanical, Interfacial, and Thermal Properties of Natural Gas Hydrates in Canada. Can. J. Chem. Eng. 2022, 100, 2557–2571. [Google Scholar] [CrossRef]
  5. Cannone, S.F.; Lanzini, A.; Santarelli, M. A Review on CO2 Capture Technologies with Focus on CO2-Enhanced Methane Recovery from Hydrates. Energies 2021, 14, 387. [Google Scholar] [CrossRef]
  6. Cheng, C.; Wang, F.; Tian, Y.; Wu, X.; Zheng, J.; Zhang, J.; Li, L.; Yang, P.; Zhao, J. Review and Prospects of Hydrate Cold Storage Technology. Renew. Sustain. Energy Rev. 2020, 117, 109492. [Google Scholar] [CrossRef]
  7. Das, S.; Tadepalli, K.M.; Roy, S.; Kumar, R. A Review of Clathrate Hydrate Nucleation, Growth and Decomposition Studied Using Molecular Dynamics Simulation. J. Mol. Liq. 2022, 348, 118025. [Google Scholar] [CrossRef]
  8. Gambelli, A.M.; Presciutti, A.; Rossi, F. Review on the Characteristics and Advantages Related to the Use of Flue-Gas as CO2/N2 Mixture for Gas Hydrate Production. Fluid Phase Equilibria 2021, 541, 113077. [Google Scholar] [CrossRef]
  9. Sayani, J.K.S.; Lal, B.; Pedapati, S.R. Comprehensive Review on Various Gas Hydrate Modelling Techniques: Prospects and Challenges. Arch. Comput. Methods Eng. 2022, 29, 2171–2207. [Google Scholar] [CrossRef]
  10. Chen, W.; Pinho, B.; Hartman, R.L. Flash Crystallization Kinetics of Methane (sI) Hydrate in a Thermoelectrically-Cooled Microreactor. Lab Chip 2017, 17, 3051–3060. [Google Scholar] [CrossRef]
  11. Zhang, J.; Yin, Z.; Khan, S.A.; Li, S.; Li, Q.; Liu, X.; Linga, P. Path-Dependent Morphology of CH4 Hydrates and Their Dissociation Studied with High-Pressure Microfluidics. Lab Chip 2024, 24, 1602–1615. [Google Scholar] [CrossRef]
  12. Feng, Y.; Li, M.; Han, Y.; Li, Q.; Lv, X.; Zhao, J.; Yang, L.; Liu, Y.; Song, Y. Gas Hydrate Nucleation and Growth in a Micro-Reactor: Effect of Individual Component Separated from the Crude Oil in the South China Sea. Chem. Eng. J. 2023, 459, 141483. [Google Scholar] [CrossRef]
  13. Demirbas, A. Methane Gas Hydrate; Springer Science & Business Media: Berlin/Heidelberg, Germany, 2010. [Google Scholar]
  14. Sun, Z.; Wang, H.; Yao, J.; Sun, Z.; Bongole, K.; Zhu, X.; Liu, L.; Wang, J. Effect of Cage-Specific Occupancy on the Dissociation Rate of a Three-Phase Coexistence Methane Hydrate System: A Molecular Dynamics Simulation Study. J. Nat. Gas Sci. Eng. 2018, 55, 235–242. [Google Scholar] [CrossRef]
  15. Balcı, F.M.; Uras-Aytemiz, N. Exploring Vacancy Defects in S-I Clathrate Hydrates. J. Mol. Graph. Model. 2025, 136, 108969. [Google Scholar] [CrossRef]
  16. Yanes-Rodríguez, R.; Prosmiti, R. Analysing the Stability of He-filled Hydrates: How Many He Atoms Fit in the sII Crystal? Phys. Chem. Chem. Phys. 2024, 26, 2519–2528. [Google Scholar] [CrossRef]
  17. Zhang, Z.; Kusalik, P.G.; Guo, G.J.; Ning, F.; Wu, N. Insight on the Stability of Polycrystalline Natural Gas Hydrates by Molecular Dynamics Simulations. Fuel 2021, 289, 119946. [Google Scholar] [CrossRef]
  18. Vlasic, T.M.; Servio, P.D.; Rey, A.D. Effect of Guest Size on the Mechanical Properties and Molecular Structure of Gas Hydrates from First-Principles. Cryst. Growth Des. 2017, 17, 6407–6416. [Google Scholar] [CrossRef]
  19. Daghash, S.M.; Servio, P.; Rey, A.D. Elastic Properties and Anisotropic Behavior of Structure-H (sH) Gas Hydrate from First Principles. Chem. Eng. Sci. 2020, 227, 115948. [Google Scholar] [CrossRef]
  20. Daghash, S.M.; Servio, P.; Rey, A.D. From Infrared Spectra to Macroscopic Mechanical Properties of sH Gas Hydrates through Atomistic Calculations. Molecules 2020, 25, 5568. [Google Scholar] [CrossRef] [PubMed]
  21. Mathews, S.L.; Servio, P.D.; Rey, A.D. Heat Capacity, Thermal Expansion Coefficient, and Grüneisen Parameter of CH4, CO2, and C2H6 Hydrates and Ice Ih via Density Functional Theory and Phonon Calculations. Cryst. Growth Des. 2020, 20, 5947–5955. [Google Scholar] [CrossRef]
  22. Jia, J.; Liang, Y.; Tsuji, T.; Murata, S.; Matsuoka, T. Elasticity and Stability of Clathrate Hydrate: Role of Guest Molecule Motions. Sci. Rep. 2017, 7, 1290. [Google Scholar] [CrossRef]
  23. Mirzaeifard, S.; Servio, P.; Rey, A.D. Multiscale Modeling and Simulation of Water and Methane Hydrate Crystal Interface. Cryst. Growth Des. 2019, 19, 5142–5151. [Google Scholar] [CrossRef]
  24. Mathews, S.; Servio, P.; Rey, A. Multiscale Interfacial Structure and Organization of sII Gas Hydrate Interfaces Using Molecular Dynamics. Nanomaterials 2025, 15, 464. [Google Scholar] [CrossRef]
  25. Guerra, A.; Mathews, S.; Marić, M.; Servio, P.; Rey, A.D. All-Atom Molecular Dynamics of Pure Water–Methane Gas Hydrate Systems under Pre-Nucleation Conditions: A Direct Comparison between Experiments and Simulations of Transport Properties for the Tip4p/Ice Water Model. Molecules 2022, 27, 5019. [Google Scholar] [CrossRef]
  26. Kuo, I.F.W.; Mundy, C.J.; Eggimann, B.L.; McGrath, M.J.; Siepmann, J.I.; Chen, B.; Vieceli, J.; Tobias, D.J. Structure and Dynamics of the Aqueous Liquid-Vapor Interface: A Comprehensive Particle-Based Simulation Study. J. Phys. Chem. B 2006, 110, 3738–3746. [Google Scholar] [CrossRef]
  27. Tanaka, R.; Sakemoto, R.; Ohmura, R. Crystal Growth of Clathrate Hydrates Formed at the Interface of Liquid Water and Gaseous Methane, Ethane, or Propane: Variations in Crystal Morphology. Cryst. Growth Des. 2009, 9, 2529–2536. [Google Scholar] [CrossRef]
  28. Asserson, R.B.; Hoffmann, A.C.; Hø iland, S.; Asvik, K.M. Interfacial Tension Measurement of Freon Hydrates by Droplet Deposition and Contact Angle Measurements. J. Pet. Sci. Eng. 2009, 68, 209–217. [Google Scholar] [CrossRef]
  29. Zhu, X.; Rey, A.D.; Servio, P. Piezo-Elasticity and Stability Limits of Monocrystal Methane Gas Hydrates: Atomistic-continuum Characterization. Can. J. Chem. Eng. 2023, 101, 639–650. [Google Scholar] [CrossRef]
  30. Zhu, X.; Guerra, A.; Servio, P.; Rey, A.D. Atomistic-Geometric Simulations to Investigate the Mechanical Stability of Monocrystalline sI Methane Hydrates under Pressure. Sci. Rep. 2023, 13, 1907. [Google Scholar] [CrossRef]
  31. Zhang, C.; Zhang, F.; Cheng, D.; Liu, L.; Xia, F.; Liu, X.; Hou, J.; Ni, H. The Key Role of CO2 Molecules’ Rotation on the Shear Mechanical Properties of CO2-N2 Hydrates. Fuel 2025, 381, 133581. [Google Scholar] [CrossRef]
  32. Zhang, Y.; Liu, X.; Shi, Q.; Qu, Y.; Hao, Y.; Fu, Y.; Wu, J.; Zhang, Z. Mechanical Properties and Cage Transformations in CO2-CH4 Heterohydrates: A Molecular Dynamics and Machine Learning Study. J. Phys. D Appl. Phys. 2024, 57, 465302. [Google Scholar] [CrossRef]
  33. Arzbacher, S.; Rahmatian, N.; Ostermann, A.; Massani, B.; Loerting, T.; Petrasch, J. Macroscopic Defects upon Decomposition of CO2 Clathrate Hydrate Crystals. Phys. Chem. Chem. Phys. 2019, 21, 9694–9708. [Google Scholar] [CrossRef] [PubMed]
  34. Liang, S.; Liang, D.; Wu, N.; Yi, L.; Hu, G. Transient Translational and Rotational Water Defects in Gas Hydrates. J. Phys. Chem. C 2017, 121, 17595–17602. [Google Scholar] [CrossRef]
  35. Uras-Aytemiz, N.; Balcı, F.M. Bjerrum Defects in S-II Gas Hydrate. J. Mol. Graph. Model. 2024, 133, 108878. [Google Scholar] [CrossRef] [PubMed]
  36. Kresse, G.; Furthmüller, J. Efficiency of Ab-Initio Total Energy Calculations for Metals and Semiconductors Using a Plane-Wave Basis Set. Comput. Mater. Sci. 1996, 6, 15–50. [Google Scholar] [CrossRef]
  37. Kresse, G.; Furthmüller, J. Efficient Iterative Schemes for Ab Initio Total-Energy Calculations Using a Plane-Wave Basis Set. Phys. Rev. B 1996, 54, 11169–11186. [Google Scholar] [CrossRef] [PubMed]
  38. Kresse, G.; Hafner, J. Ab Initio Molecular Dynamics for Liquid Metals. Phys. Rev. B 1993, 47, 558–561. [Google Scholar] [CrossRef]
  39. Kresse, G.; Joubert, D. From Ultrasoft Pseudopotentials to the Projector Augmented-Wave Method. Phys. Rev. B 1999, 59, 1758–1775. [Google Scholar] [CrossRef]
  40. Takeuchi, F.; Hiratsuka, M.; Ohmura, R.; Alavi, S.; Sum, A.K.; Yasuoka, K. Water Proton Configurations in Structures I, II, and H Clathrate Hydrate Unit Cells. J. Chem. Phys. 2013, 138, 124504. [Google Scholar] [CrossRef]
  41. Zhang, Y.; Yang, W. Comment on “Generalized Gradient Approximation Made Simple”. Phys. Rev. Lett. 1998, 80, 890. [Google Scholar] [CrossRef]
  42. Grimme, S. Semiempirical GGA-type density functional constructed with a long-range dispersion correction. J. Comput. Chem. 2006, 27, 1787–1799. [Google Scholar] [CrossRef]
  43. Kosyakov, V.I. Gas Hydrate Frameworks of Allen’s Polyhedra. 1. Frameworks on 3–5 Nets. J. Struct. Chem. 2002, 43, 622–631. [Google Scholar] [CrossRef]
  44. Komarov, V.Y.; Solodovnikov, S.F.; Kurnosov, A.V.; Kosyakov, V.I.; Manakov, A.Y. Design of Tetrahedral Frameworks as Layered Packings of Uniform Polyhedral Cavities. J. Struct. Chem. 2005, 46, S181–S187. [Google Scholar] [CrossRef]
  45. Komarov, V.U.; Solodovnikov, S.F.; Grachev, E.V.; Kosyakov, V.I.; Manakov, A.Y.; Kurnosov, A.V.; Shestakov, V.A. Phase Formation and Structure of High-Pressure Gas Hydrates and Modeling of Tetrahedral Frameworks with Uniform Polyhedral Cavities. Crystallogr. Rev. 2007, 13, 257–297. [Google Scholar] [CrossRef]
  46. Keutsch, F.N.; Cruzan, J.D.; Saykally, R.J. The Water Trimer. Chem. Rev. 2003, 103, 2533–2578. [Google Scholar] [CrossRef]
  47. Huš, M.; Urbic, T. Strength of Hydrogen Bonds of Water Depends on Local Environment. J. Chem. Phys. 2012, 136, 144305. [Google Scholar] [CrossRef]
  48. Petrucci, R.H. General Chemistry: Principles and Modern Applications, 10th ed.; Pearson Prentice Hall: Upper Saddle River, NJ, USA, 2010. [Google Scholar]
Figure 1. Classification of the water oxygen atoms. The green atom represents the target oxygen atom in the classification and the orange atoms are the neighboring oxygens. The red atoms are oxygen and the white atoms are hydrogen. Hydrogen bonds are visualized with dashed lines. (A) If the target oxygen belonged to two hexagonal faces, it was classified as Group A. (B) If the target oxygen belonged to one hexagonal and one pentagonal face, it was classified as Group B. (C) If the target oxygen belonged to two pentagonal faces, it was classified as Group C.
Crystals 15 00518 g001
Figure 2. Oxygen classification scheme. The atomic classification leads to bond length classifications that are binary and bond angle classifications that are ternary. The black dots in the binary correlation indicate that those specific atoms are not bonded in the hydrate structure. In the ternary correlation, the central letter is the central atom of the angle. This scheme classifies oxygen atoms based on their neighboring molecules to determine the local structure based on geometric criteria.
Crystals 15 00518 g002
Figure 3. Definition of the two vectors in the GH system that compose the bond and angle calculations.
Crystals 15 00518 g003
Figure 4. sI methane fracture mechanisms under pressure. The green path (1) contains an intermediate step where face decomposition did not necessarily cause structural disintegration. The second one (2) had no intermediate step and decomposed immediately. The red vertices represent the oxygen atoms that were not participating in the hexagonal face, the green vertices represent the oxygen atoms that were participating in the hexagonal face in the foreground, and the pink vertices represent the oxygen atoms that were participating in the hexagonal face in the background.
Crystals 15 00518 g004
Figure 5. Types of polygons in the GH structure and to which cages they belong. The red polyhedra represent the large cages, the pink polyhedra represent the small cages, the blue polyhedra represent the hexagonal faces shared by two large cages, and the yellow polyhedra represent the pentagonal faces shared by one small cage and one large cage. Each arrangement of cages is shown in the front, right, top, and perspective views. Only the relevant vertices are shown and the rest were suppressed for clarity.
Crystals 15 00518 g005
Figure 6. The oxygen–oxygen distance for the sI methane hydrates as a function of hydrostatic pressure. All the bonds were divided into four groups according to the classification scheme. Group AB is the blue line, Group BB is the green line, Group BC is the red line, and Group CC is the black line. The Group BB atoms were superimposed under the Group CC lines. A forbidden zone was observed between 1.1 GPa and 0.5 GPa, starting 0.1 Å wide and ending at 0.0 Å wide, with its widest at 0.1 Å. We refer to this as the first forbidden zone (FZ1).
Crystals 15 00518 g006
Figure 7. The OH covalent and hydrogen bond lengths as a function of the hydrostatic pressure for the sI methane hydrate system. For the covalent bond, the classification was based on the water molecule’s hydrogen atom. For the hydrogen bond, the classification was based on the identity of the acceptor and donor molecules. (a) The covalent bond distribution, where the intramolecular interactions are quantified. The standard OH covalent bond length was 0.97 Å [47]. A forbidden zone was observed between 1.1 GPa and 0.5 GPa, starting 0.005 Å wide and ending at 0.0 Å wide, with its widest at 0.005 Å. We refer to this as the second forbidden zone (FZ2). (b) The hydrogen bond distribution, where the intermolecular interactions are quantified. The standard OH hydrogen bond length was 1.97 Å [47]. A forbidden zone was observed between 1.1 GPa and 0.5 GPa, starting 0.1 Å wide and ending at 0.0 Å wide, with its widest at 0.1 Å. We refer to this as the third forbidden zone (FZ3).
Crystals 15 00518 g007
Figure 8. The HOH and OOO angles as a function of the hydrostatic pressure for the sI methane hydrate system. The classification is based on the water molecule’s hydrogen atom. (a) The water molecule HOH angle, where the intramolecular interactions are quantified. The standard HOH angle was 0.58 π [47]. A forbidden zone was observed between 0.5 GPa and 4.0 GPa, starting 0.0 radians wide and ending at 0.0 radians wide, with its widest at 0.002 π radians. We refer to this as the fourth forbidden zone (FZ4). (b) The OOO angle, where the intermolecular interactions are quantified. The standard tetrahedral angle, for reference, was 0.61 π [48]. A forbidden zone was observed between 1.1 GPa and 6.5 GPa, starting 0.005 π radians wide and ending at 0.0 radians wide, with its widest at 0.01 π radians. We refer to this as the fifth forbidden zone (FZ5).
Crystals 15 00518 g008
Figure 9. The azimuthal and polar angles of the spherical coordinate representation of the water molecule vectors. The vector points from the oxygen atom to the midpoint between the two hydrogens in a water molecules. The increasing diameter of the dots represents the general trend of the increasing pressure of the simulations. The molecules were classified into A, B, and C. The lines are meant to connect dots to emphasize each of the clusters represented a molecule. The shaded regions emphasize the periodic nature of the spherical coordinate system, and they also clarify when molecules appear to move off domain. The dashed lines were placed on a selection of trends to show the nature of each moving vectors with increasing pressure.
Crystals 15 00518 g009
Figure 10. The displacement in azimuthal–polar parameter space from one data point to the next with increasing pressure of a given water molecule’s vector. The significant increases with higher pressure represent molecules making larger and larger shifts in their orientation as the GH lattice approaches breakdown. (b) The same data as (a) with the y-axis zoomed to differentiate in the lower-pressure regions.
Crystals 15 00518 g010
Table 1. The forbidden zones in the relevant angles and distances with associated ranges for both axes.
LocationLabelStart End Widest
O-O DistanceFZ1 1.1 GPa 0.5 GPa
0.1 Å 0.0 Å 0.1 Å
OH Covalent Bond LengthFZ2 1.1 GPa 0.5 GPa
0.005 Å 0.0 Å 0.005 Å
OH Hydrogen Bond LengthFZ3 1.1 GPa 0.5 GPa
0.1 Å 0.0 Å 0.1 Å
HOH AngleFZ4 0.5 GPa 4.0 GPa
0.0 rad 0.0 rad 0.002 π rad
OOO AngleFZ5 1.1 GPa 6.5 GPa
0.005 π rad 0.0 rad 0.01 π rad
Disclaimer/Publisher’s Note: The statements, opinions and data contained in all publications are solely those of the individual author(s) and contributor(s) and not of MDPI and/or the editor(s). MDPI and/or the editor(s) disclaim responsibility for any injury to people or property resulting from any ideas, methods, instructions or products referred to in the content.

