Article

Effect of Deposits on Micron Particle Collision and Deposition in Cooling Duct of Turbine Blades

1
Department of Engineering Mechanics, Henan University of Science and Technology, Luoyang 471000, China
2
Particulate and Multiphase Flow Science International Joint Laboratory of Henan Province, Luoyang 471000, China
3
LuoYang Bearing Research Institute Co., Ltd., Luoyang 471000, China
4
Office of Educational Administration, Henan University of Science and Technology, Luoyang 471000, China
*
Author to whom correspondence should be addressed.
Crystals 2025, 15(6), 510; https://doi.org/10.3390/cryst15060510
Submission received: 28 April 2025 / Revised: 22 May 2025 / Accepted: 22 May 2025 / Published: 26 May 2025
(This article belongs to the Section Inorganic Crystalline Materials)

Abstract

:
Aerospace engines ingest small particles when operating in a particulate-rich environment, such as sandstorms, atmospheric pollution, and volcanic ash clouds. These micron particles enter their cooling channels, leading to film-cooling hole blockage and thus thermal damage to turbine blades made of nickel-based single-crystal superalloy materials. This work studied the collision and deposition mechanisms between the micron particles and structure surface. A combined theoretical and numerical study was conducted to investigate the effect of deposits on particle collision and deposition. Finite element models of deposits with flat and rough surfaces were generated and analyzed for comparison. The results show that the normal restitution coefficient is much lower when a micron particle impacts a deposit compared to that of particle collisions with DD3 nickel-based single-crystal wall surfaces. The critical deposition velocity of a micron particle is much higher for particle–deposit collisions than for particle–wall collision. The critical deposition velocity decreases with the increase in particle size. When micron particles deposit on the wall surface of the structure, early-stage particle–wall collision becomes particle–deposit collision when the height of the deposits is greater than twice the particle diameter. For contact between particles and rough surface deposits, surfaces with a shorter correlation length, representing a higher density of asperities and a steeper surface, have a much longer contact time but a lower contact area. The coefficient of restitution of the particle reduces as the surface roughness of the deposits increase. The characteristic length of the roughness has little effect on the rebounding rotation velocity of the particle.

1. Introduction

Turbine blades are one of the most critical components of aero-engines and are subjected to extremely harsh environments, such as high temperature, high pressure, and high rotational speed. To meet the demands for a high thrust-to-weight ratio, the turbine inlet temperature has been increased over 2000 K. Single-crystal alloys are highly advantageous in terms of temperature resistance as they eliminate grain boundaries and avoid the inter-granular fracture issues [1]. As a result, turbine blades composed of high-performance nickel-based single-crystal alloy combined with cooling film holes have been widely applied in aerospace engines. However, when an aircraft engine operates in a particulate environment, such as during sandstorms or in the presence of atmospheric pollutants, volcanic ash clouds, or marine salt mist, it ingests a large amount of micron particles like sand and dust. Although particle separators can filter out larger particles, particles smaller than 10 μm enter the internal cooling channels of the turbine blades and deposit on the wall, causing film-cooling hole blockage, localized thermal damage, and even mechanical failure [2,3].
Particle deposition has become one of the important factors threatening the safety of aircraft engines, and research is necessary on the formation and development mechanisms of particle deposition. It is essential to investigate and understand the mechanisms of particle collision and deposition. Experimental studies have shown that the process of particle deposition starts from an early stage of deposition formation to a middle stage of deposits growth, and the last stage is deposition stability [4,5]. The surface roughness of the deposits has a significant impact on the rebound and deposition characteristics of colliding particles [6].
A significant amount of experimental research has been conducted to explore the particle deposition process through high-temperature, accelerated deposition experiments [7,8] and low-temperature, low-speed deposition experiments [9,10,11]. Since these experiments are costly, time-consuming, and unable to reveal the deposition mechanism, numerical simulations have become an important tool for deposition prediction with the advancement of computer technology [12]. Establishing an accurate collision–deposition model is critical for precise deposition forecasting. Many factors influence the characteristics of particle collision, rebound, and deposit, including particle size, collision velocity, angle, as well as the material and roughness of the collision surface. The current theoretical models for characterizing micron particle collision deposition are mostly based on direct particle–wall collisions. These models can be broadly classified into three types: the critical velocity model [13], which is based on classical Hertz theory and applies to elastic collisions under low-speed and low-temperature conditions; the critical viscosity model, which precisely predicts high-temperature deposition based on the relationship between viscosity and temperature [14,15]; and the energy dissipation model, which accounts for energy loss during the collision process and provides high accuracy in early-stage deposition predictions [16,17]. Numerous researchers have studied the deposition characteristics and patterns of micron particles on turbine blade surfaces and within cooling channels based on different deposition models [18,19,20,21,22]. The aforementioned studies only consider the collision and deposition characteristics between particles and wall surfaces, which are ideally supposed to be flat and smooth.
As the particles adhere and accumulate on the structure surface, the roughness and topology of the deposited surface are altered, which significant impact the particle collision behavior as well as the boundary layer. The role of deposit roughness cannot be ignored, particularly during the last stable deposition stages for long-term deposition. The continuous accumulation of particle deposits on a wall surface leads to changes in both the mechanical properties and surface roughness of the wall.
During the collision processes, the surface roughness is one of the most important factors that has a significant impact on the angle of rebound [23], contact force [24], adhesion force [25] and friction force [26]. The coefficient of restitution (COR) for ideal rough surfaces on which asperities are distributed uniformly has been widely studied through experiments, theoretical analyses, and numerical simulations [27,28,29]. Some random rough surfaces that are more similar to real surfaces have also been developed to investigate particle collision behavior [30,31,32,33]. The results demonstrated that the COR significantly depends on surface roughness. Random roughness models also increase the uncertainties of an investigation.
Most research has focused on the roughness of a structure’s surface, without considering surfaces covered by deposits. Additionally, the material of the collision surface changes from a single metal wall to a composite material that is formed through the coupling of the deposits and the structure. Particularly, the surface roughness of deposits exhibits an irregular distribution due to particle accumulation, as demonstrated schematically in Figure 1. Both the properties and roughness of the surface undergo significant changes, which inevitably affect the subsequent particle collision and deposition behaviors. Further research is needed to better understand the effect of deposits on particle collision, which is essential for improving the accuracy of long-term particle deposition predictions.
This study investigated the influence of deposits on particle rebound and deposition characteristics. Firstly, the influence of deposits on collision particle rebounding and depositing was analyzed based on particle–wall collision theory. Subsequently, finite element simulation was adopted to study the effect of height changes in the ideal planar deposition layers on the particle collision characteristics. Finally, a numerical study was conducted to investigate the effect of the surface roughness of the deposits on the particle collision behavior. The critical thickness of the deposition layer was obtained during the particle–wall to particle–deposit collision transition. The effect of surface roughness on particle rebound behavior was discussed. This work aimed to provide a foundation for developing particle collision theory for application in the prediction of long-term particle deposition.

2. Analysis of Deposits’ Influence Based on Particle–Wall Collision Theory

Based on the high-temperature elastic–plastic collision theory proposed by Yu [16,17,18], the normal collision process between a particle and a wall may undergo three stages, elastic, elastic–plastic, and fully elastic–plastic deformation, depending on the normal incident velocity Vni of the micron dust. The coefficient of restitution for the collision between micron-sized dust particles and a DD3 nickel-based single-crystal material was predicted. During the rebound phase, the elastic strain energy stored due to elastic or elastic–plastic deformation in the compression stage is released and converted into rebound velocity. According to Hertzian contact theory, the post-collision rebound kinetic energy can be expressed as
W R F = 8 15 E R 1 / 2 δ r c 5 / 2
where δrc is the recovery deformation; E* and R* are the equivalent elastic modulus and equivalent radius, respectively. The difference between the incident normal kinetic energy Wni and the rebound normal kinetic energy WRF represents the energy lost due to the plastic deformation of the particle. In addition to the energy lost from particle plastic deformation during the collision, energy losses, including the work of the adhesive forces WA and the plastic energy loss induced by surface roughness Wasp, are considered during the particle–wall separation process [17]
W A = Δ γ π ( a p 2 + a c 2 / 2 4 / 3 )
W a s p = 1 24 π 2 a max 2 r a s p σ a s p
where Δγ, ac, and ap are the surface energy per unit area, the critical contact radius between the elastic and elastic–plastic stage, and the plastic contact radius, respectively.
σasp is the yield strength of the wall material. rasp is the radius of the surface roughness. The normal COR can be determined according to the energy absorption, as shown in Equation (4). Particle deposition occurs when the normal COR equals zero, representing that energy losses are caused by adhesive forces, and the plasticity of a rough surface is greater than the rebound kinematic energy.
C O R = ( W R F W A W a s p ) / W n i
The properties of the particle and wall in this particle–wall collision and deposition model, which was initially developed and validated in previous work, are listed in Table 1 [20]. As particles accumulate on the structure surface over a long duration, the surface becomes covered by a deposition layer, the particle–wall collision mode transitions to the particle–deposits collision mode; the rebounding and deposition behavior of the particles changes due to the changes in the surface material.
If a particle obliquely collides with a wall, the tangential recovery coefficient CORt can be calculated. Although the tangential effect on deposition behavior was not considered, the tangential recovery coefficient is of great importance in particle motion. A function predicting sand particle tangential rebound or recovery behavior is written as [12]
C O R t = 1 μ s tan α ( 1 + C O R )
where α is the angle between the particle’s incidence velocity direction and the wall surface; μs is the coefficient of sliding friction.
Figure 2a shows the normal restitution coefficients of micron-sized sand particles of different diameters colliding with a wall at various velocities under the two collision modes, particle–wall and particle–deposit, collisions at a temperature of 1273 K. From the figure, it can be observed that the dashed lines representing the particle–deposit collisions are significantly lower than the solid lines for particle–wall collisions. All the lines show that when the incident particle velocity exceeds the critical deposition velocity, as the initial velocity increases, the normal restitution coefficient first increases and then decreases. The energy loss shifts from being dominated by adhesive forces at low speeds to being dominated by plastic deformation energy loss at high speeds. For incident particles of different sizes, the decline in the normal restitution coefficient occurs at different rates due to variations in the collision surface material, but, for the same-size particles, the solid line and dashed line generally maintain parallel trends after their peak values. As the particle size increases, the difference between the different collision modes gradually decreases. The statistical analysis of the collision rebound data reveals that when the wall material properties change and the particle impact velocity exceeds the critical deposition velocity, the two collision modes differ.
When particles collide with a wall surface, the particles deposit once if their recovery coefficient is zero; thus, the critical deposition velocity Vcr of the particle can be obtained. When the normal collision velocity of particle Vni is larger than the critical deposition velocity Vcr, the particle rebounds with a velocity according to the normal COR; otherwise, the particle deposits on the wall. Figure 2b shows the critical deposition velocity Vcr for particles of varying sizes colliding with the surface of a DD3 nickel-based single-crystal metal and the deposits under a temperature of 1273 K. The figure shows that as the particle size increases, the critical deposition velocity decreases rapidly due to the adhesion force decreasing. The critical deposition velocity for particle–deposit collisions is higher than that for particle–wall collisions, indicating that as a thicker deposition layer forms on the wall, the probability of particle adhesion increases.
The influence of the deposition layer on the subsequent particle collision behavior cannot be neglected. The interaction between particles and the wall transforms into a collision between particles and the deposit, leading to alterations in the physical properties of the surface. A numerical study was continually conducted to investigate the coupling effect between the deposited particles and the wall surface. The recovery coefficient of particle colliding on a wall with deposition layers of various thicknesses was compared and the critical deposition thickness at which the wall properties transition from the original wall material to the deposited material was obtained. A particle with diameter of 1 μm was adopted as the representative for this research since 1 μm sand particles are most likely to deposit in cooling ducts.

3. Particle Collision with Surface Covered with Deposits

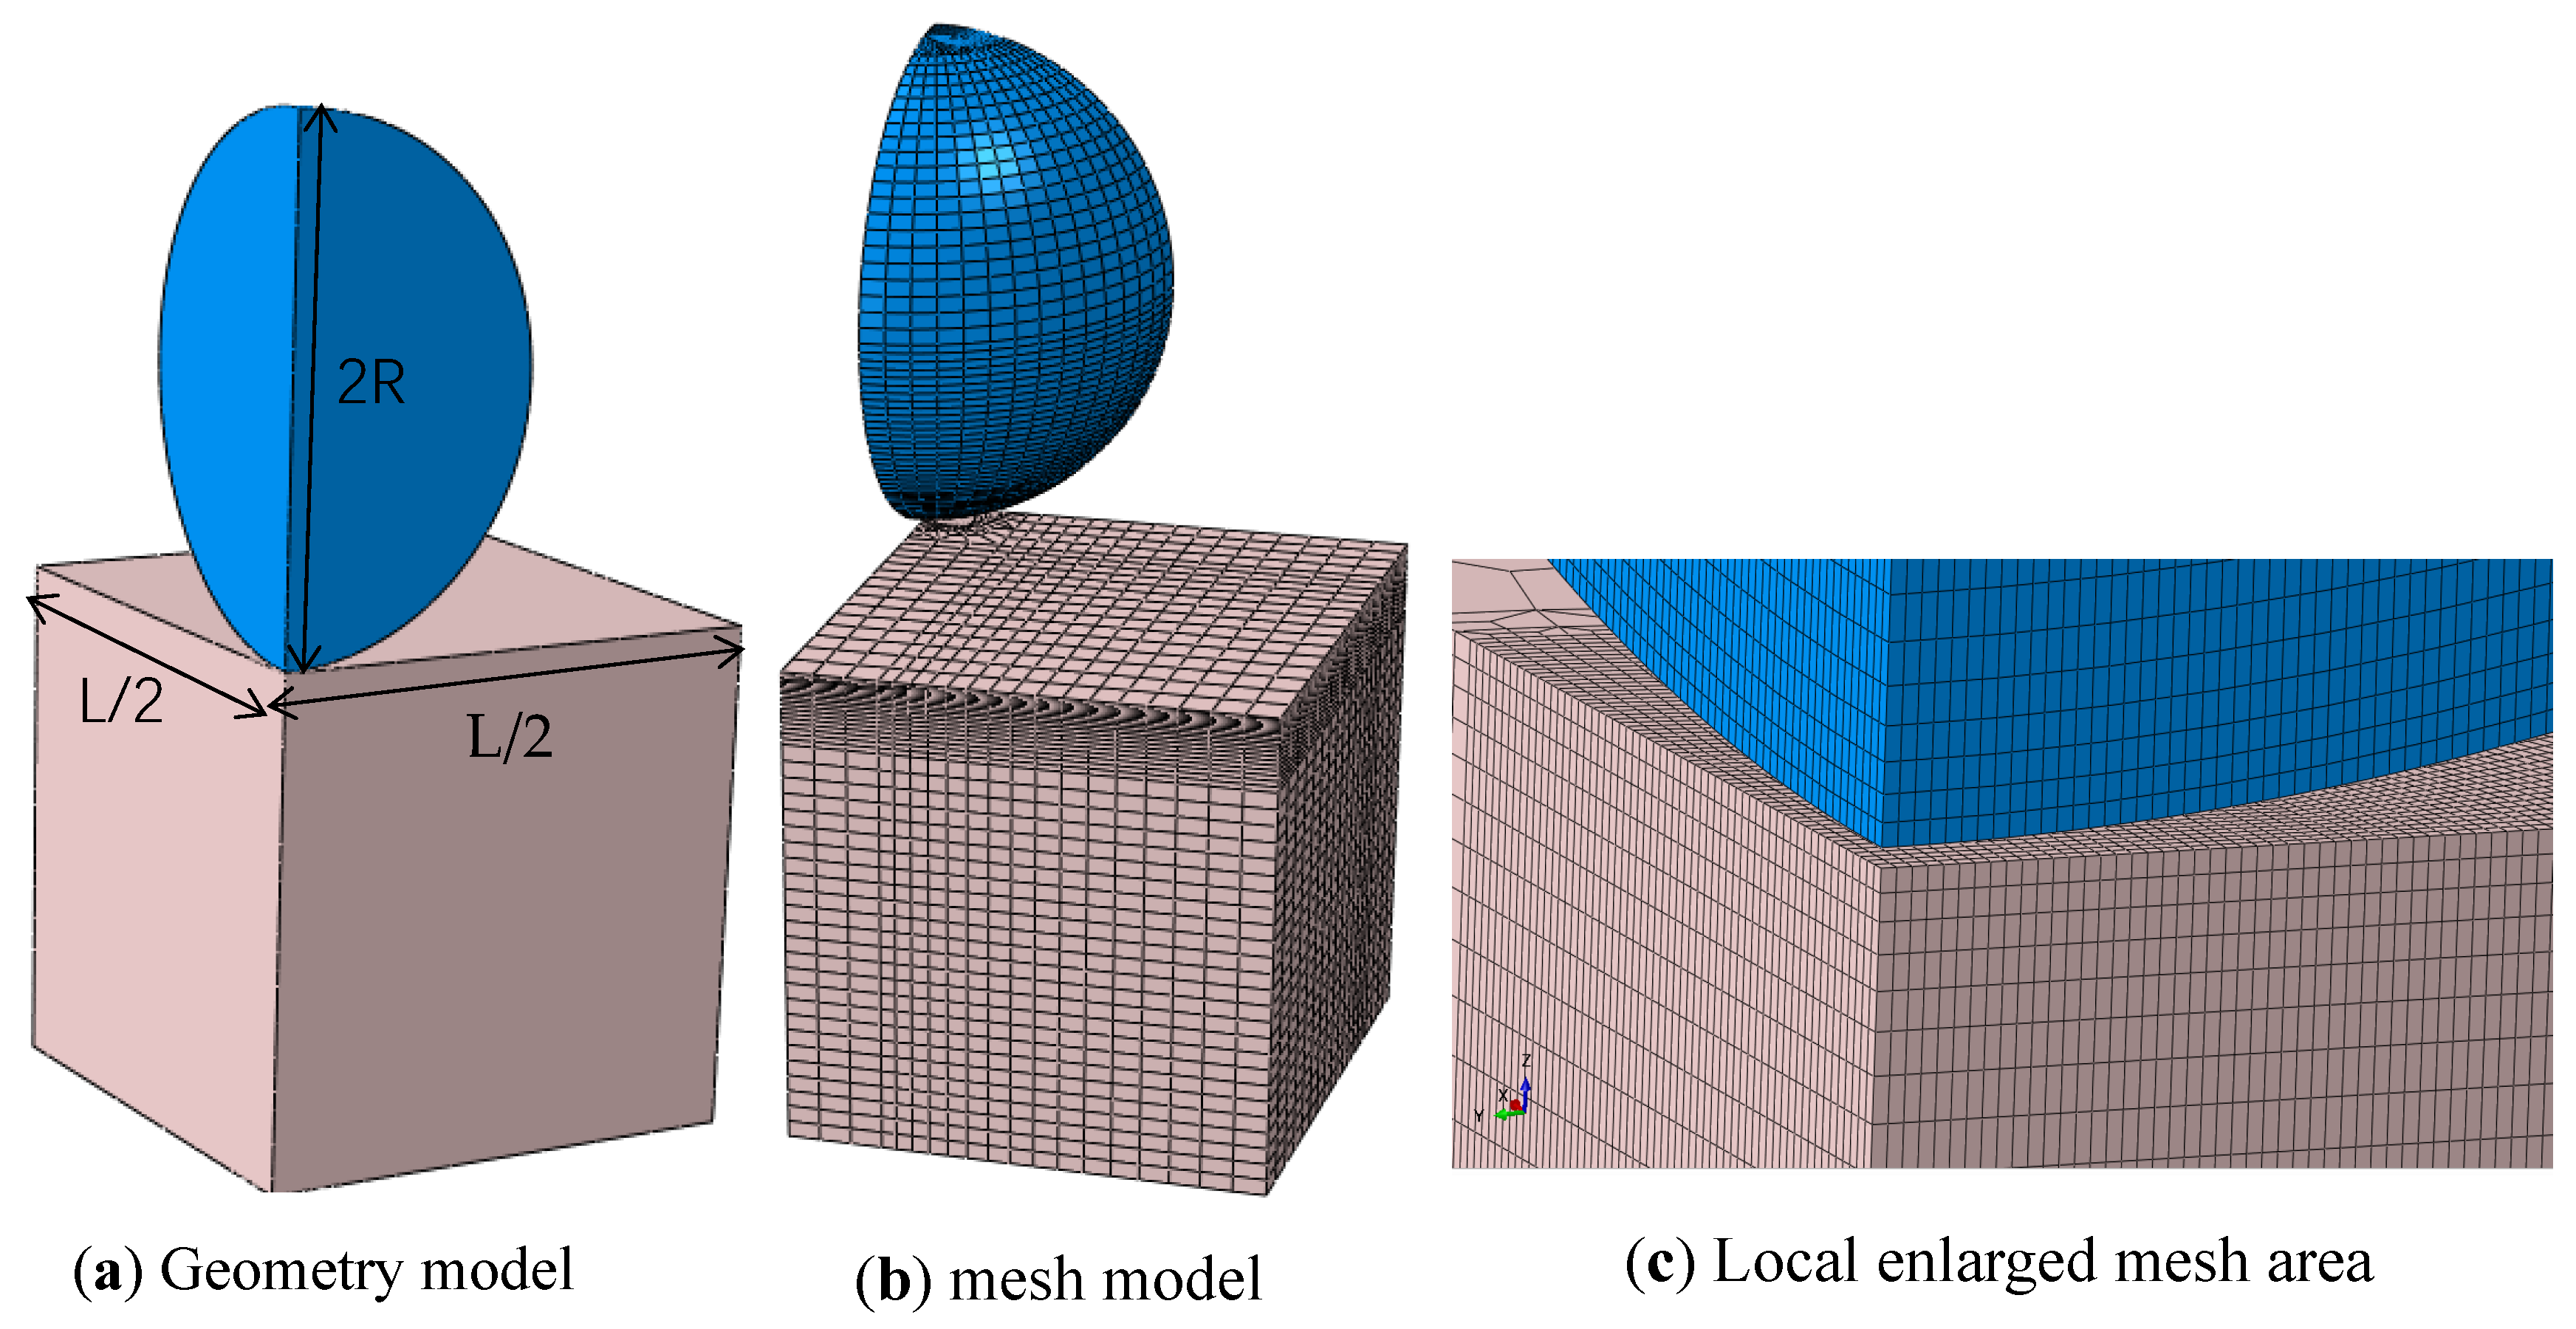
3.1. Model of Flat Surface for Particle Collision

Figure 3 shows the geometry and finite element model of normal collisions between a spherical particle and a substrate with deposits. The 1/4 model was adopted in the simulation, using symmetrical boundary conditions for computation efficiency. A plate with dimensions L = 2R was constructed according to the research conducted by Wu et al. [34]. The lower portion of the substrate was fixed. The contact region was refined to improve the simulation accuracy and efficiency. A surface-to-surface contact with finite sliding was used to define the interface interactions between the particles and plate. We supposed that the particles were distributed on the wall evenly and flatly, ignoring the surface roughness of the deposited particles. The effect of the height of the deposits on the particle rebounding characteristics was investigated. The height of each deposition layer was assigned the value of the particle diameter. As the deposits grew, the number of deposition layers was set as several times the particle diameter.
The material models and parameters used for both the particle and wall were obtained from our previous work, in which the models and parameter values were validated as reasonable and predictive [32]. The density and Poisson’s ratio of the particles were 2600 kg/m3 and 0.23, respectively, according to Yu et al. [16]. The elastic–perfectly plastic material model was adopted for the particle and deposition layer of the particle deposits; its elastic modulus E and the yield stress σY were set to 195.6 GPa and 2058 MPa, respectively. The elastic model was used to characterize the material behavior of the substrate made from aluminum, which adhered to the DD3 nickel-based single-crystal surface through an aluminized coating, with a density of 2700 kg/m3, a Poisson’s ratio of 0.33, and an elastic modulus of 69 GPa.

3.2. Deposit Thickness Analysis

With the particles depositing on the surface continuously, the structure surface is covered by deposition layers composed of particles, supposing that the deposited particles are distributed on the surface uniformly. Figure 4 shows the normal COR, the maximum contact force, the contact time, and maximum contact area variation relative to the impact velocity for a 1 μm particle when it impacts a wall covered by different numbers of deposition layers. The height of one deposition layer was set as the particle diameter. The thickness of deposits increases from 1 μm to 6 μm with the deposition layer number increasing from 1 to 6 as shown in the figure.
From Figure 4, it can be observed that when the particle impacts a deposit–wall surface, the normal COR is much lower than that of particles colliding with the surface of a substrate without deposits. The normal COR decreases as the impact velocity increases when ignoring adhesive forces. It also demonstrates that at a constant incident velocity, the COR decreases rapidly with increasing thickness of the deposits. It is noteworthy that when the thickness of the deposits is two times the particle diameter, the normal COR ceases to decrease and approaches a constant value. Therefore, in the gas–solid two-phase simulation, when the height of the deposits on the wall is greater than twice the particle diameter, the wall properties transform into those of the deposited particles, representing a particle–deposit collision. However, in this section, the surface roughness of the deposits is not considered and is investigated in the following section.

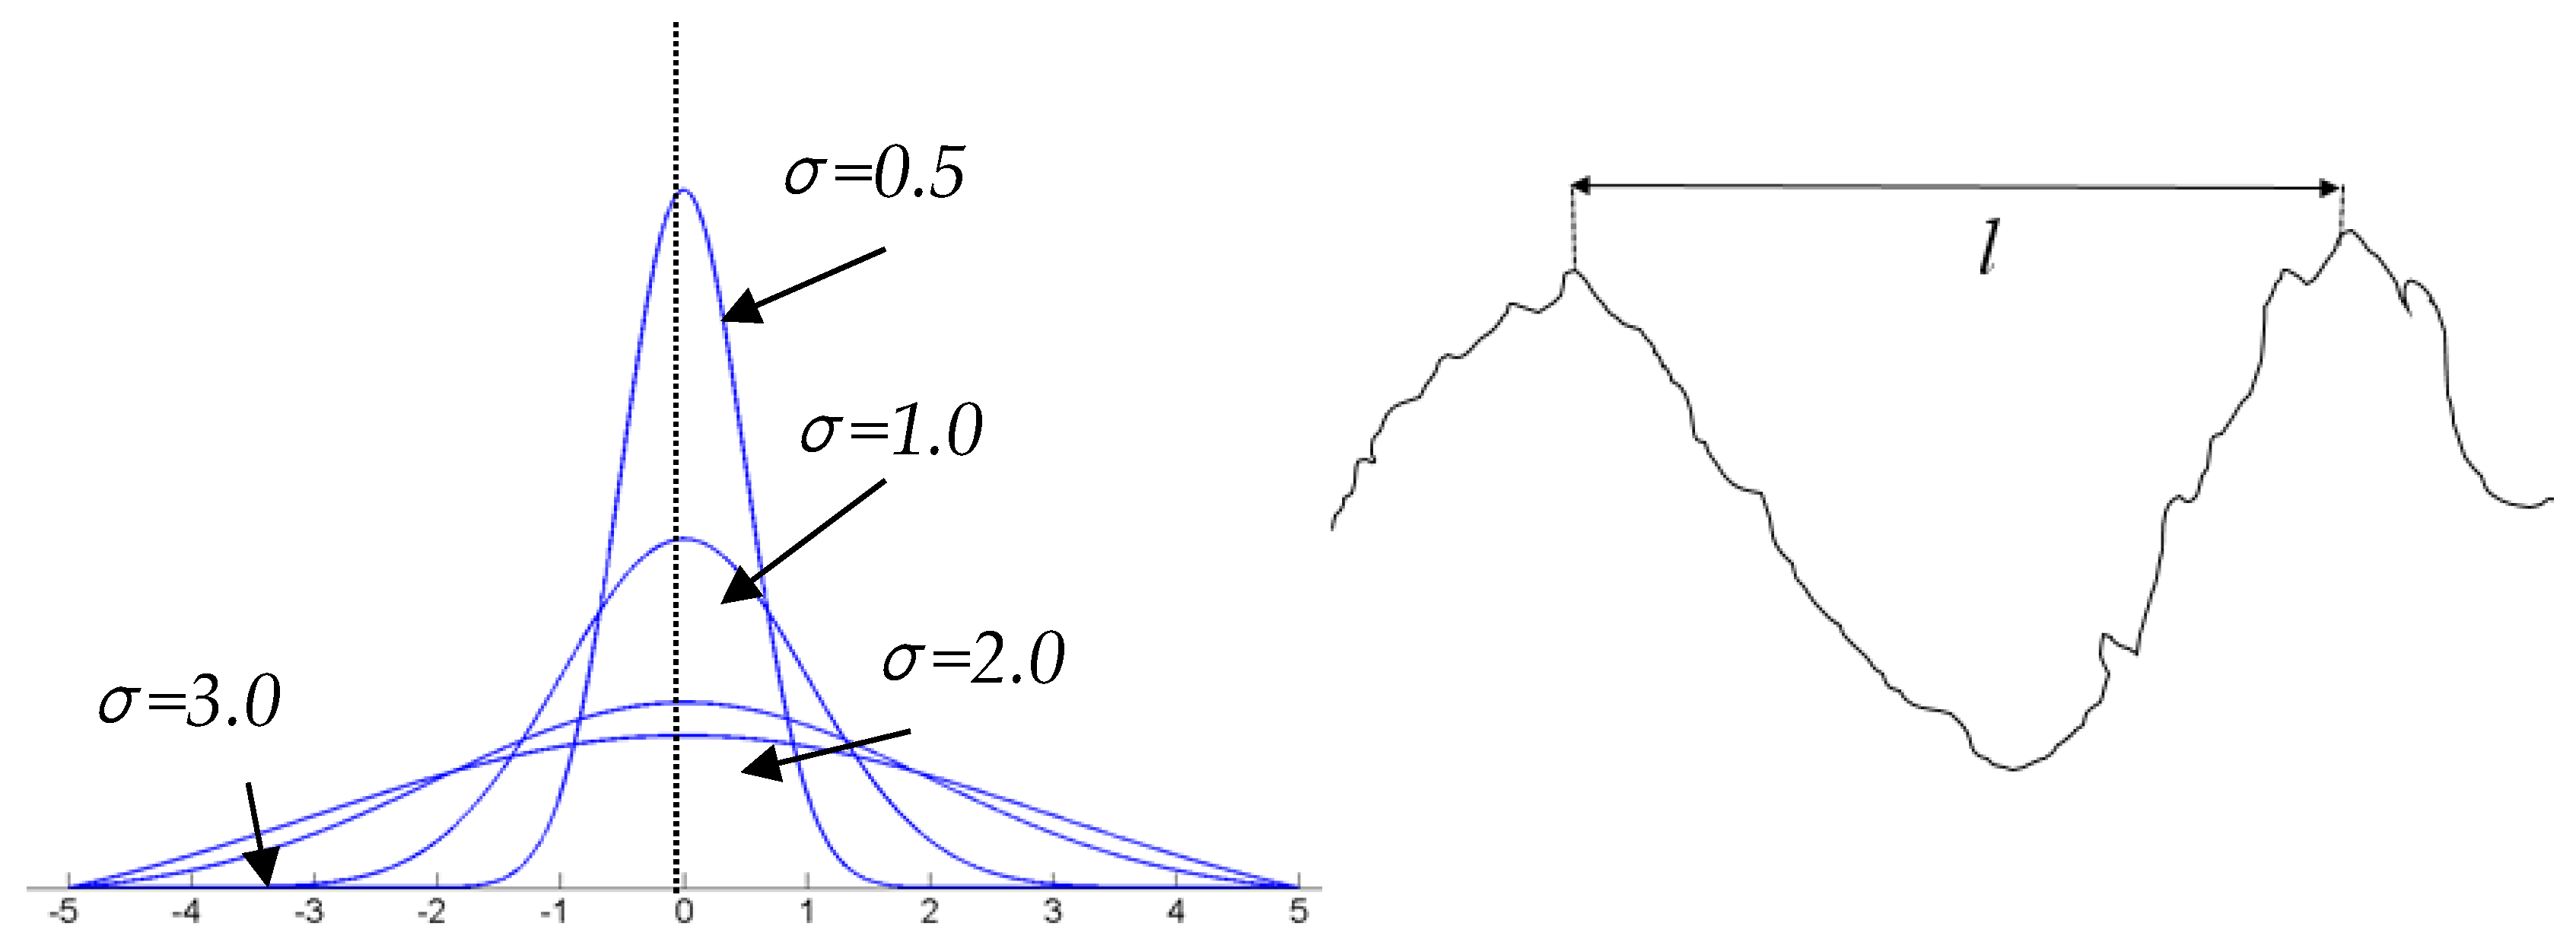
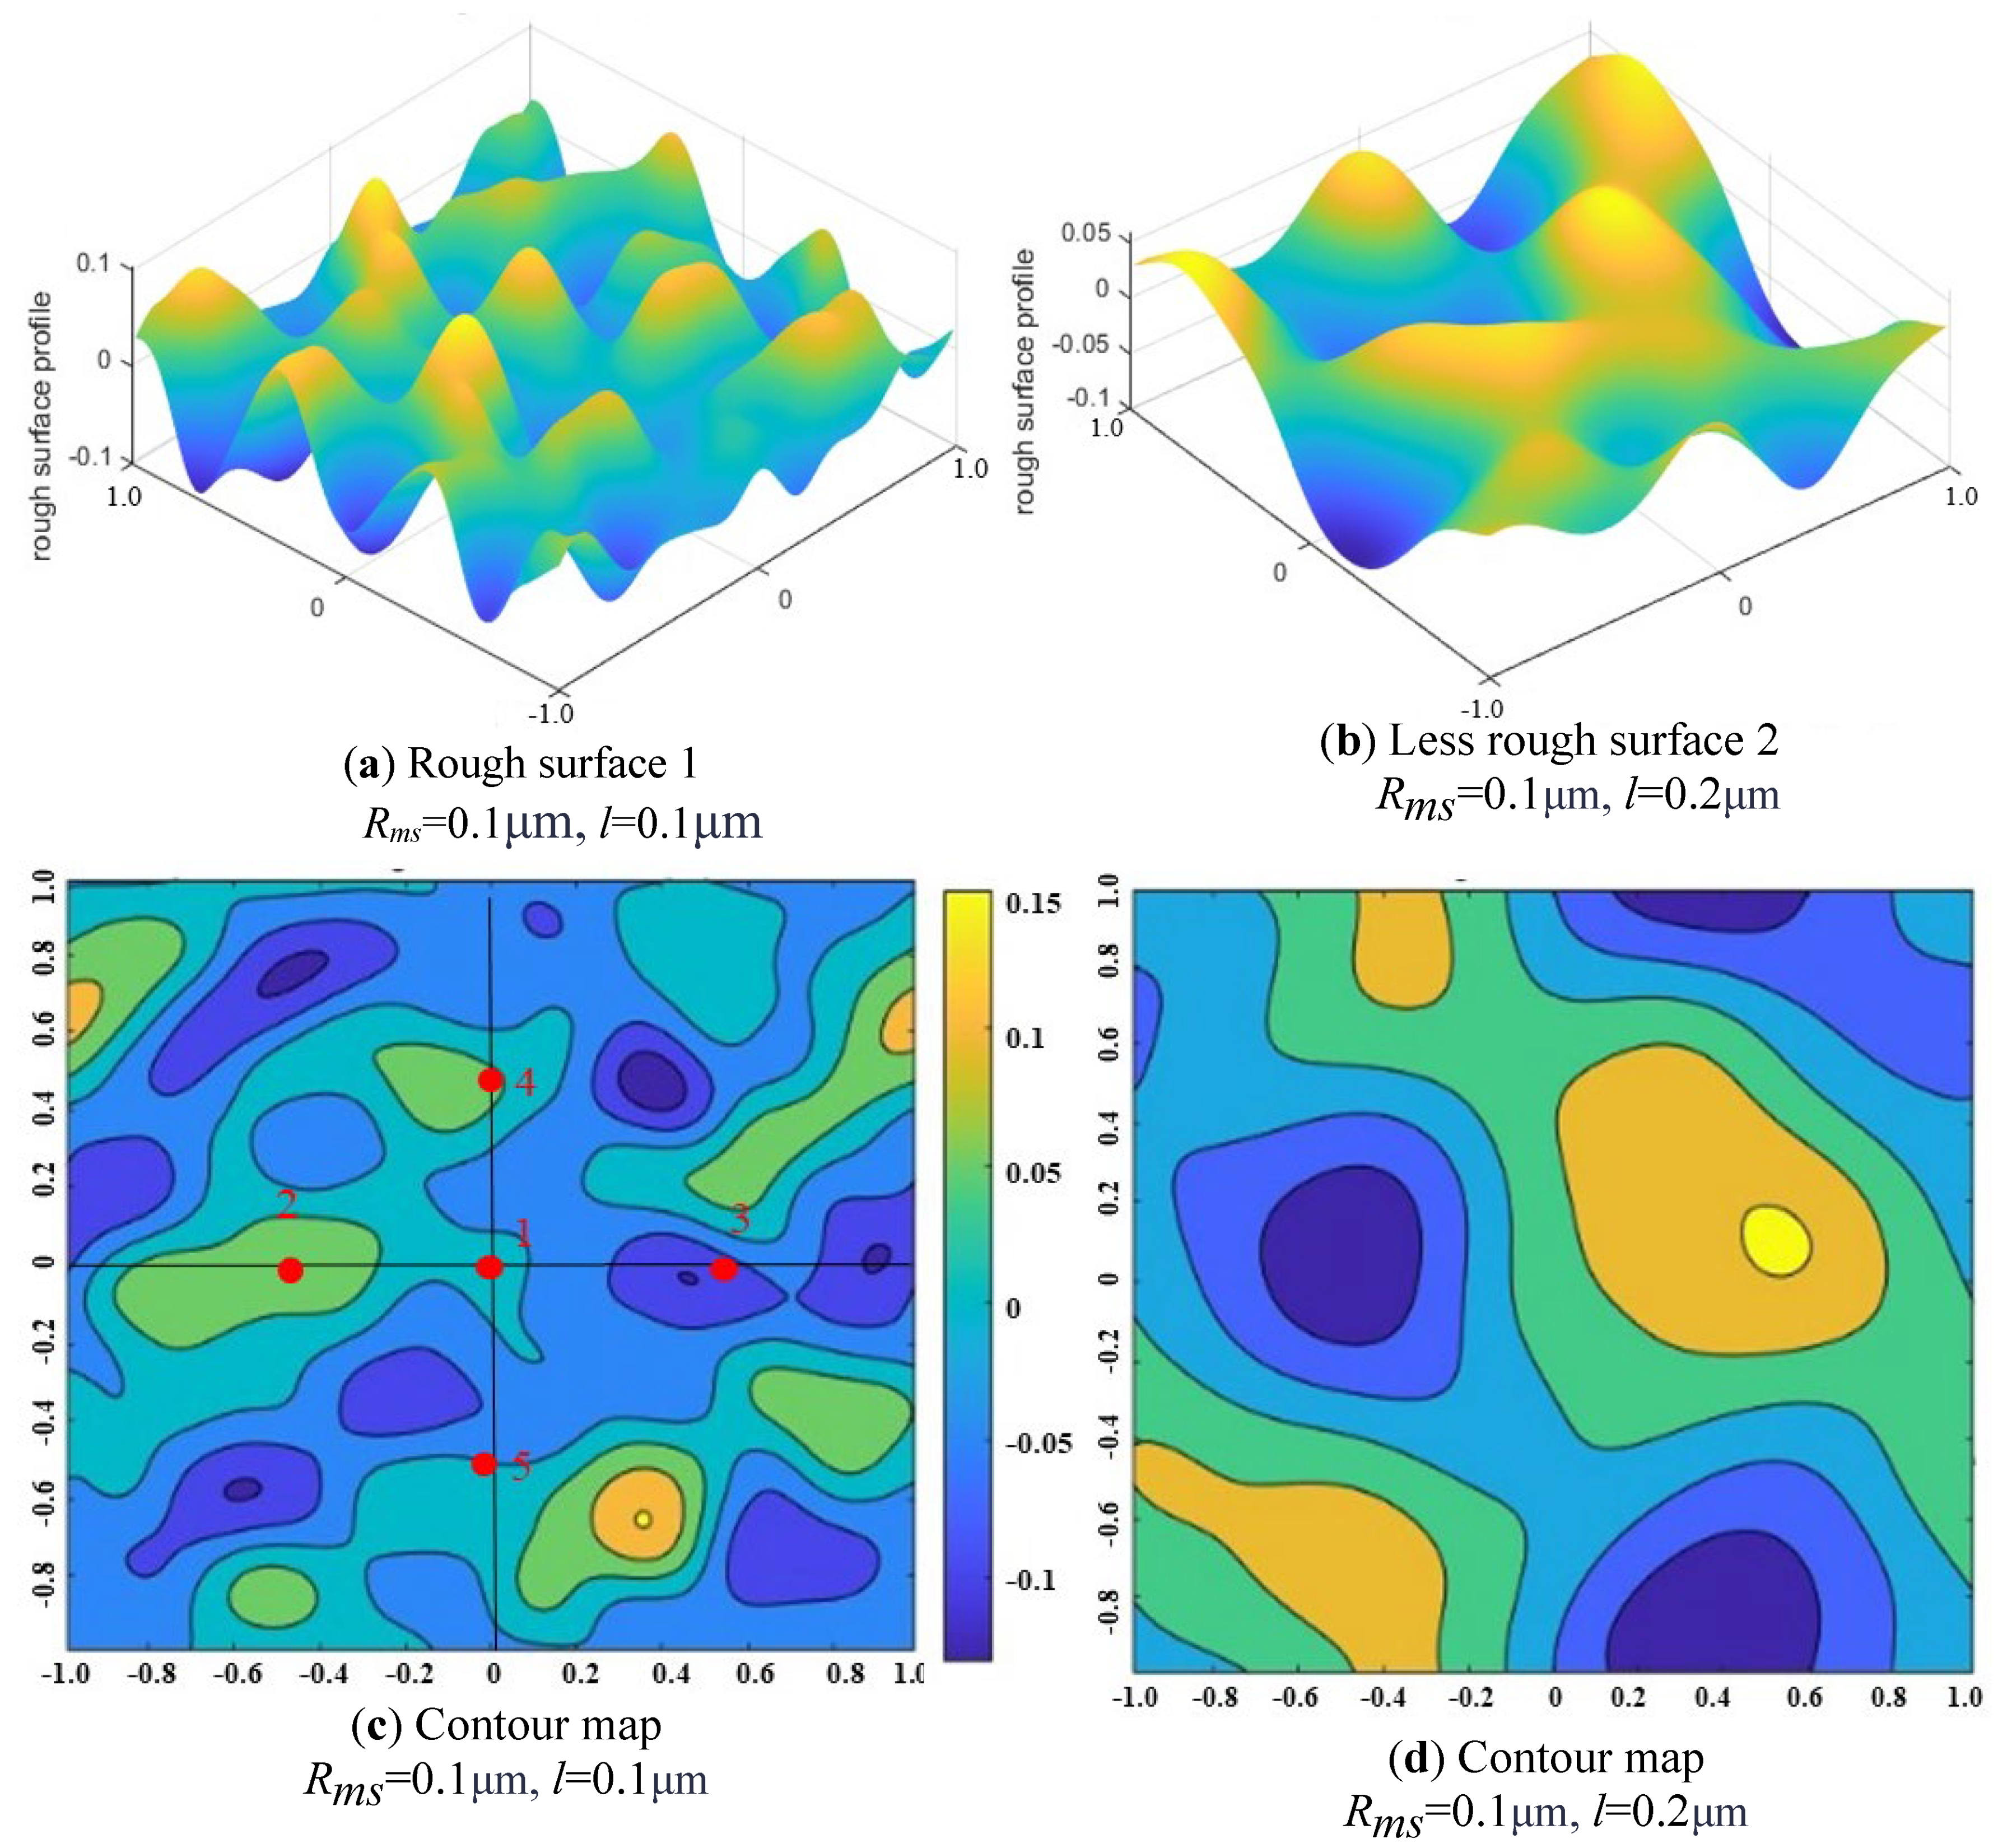
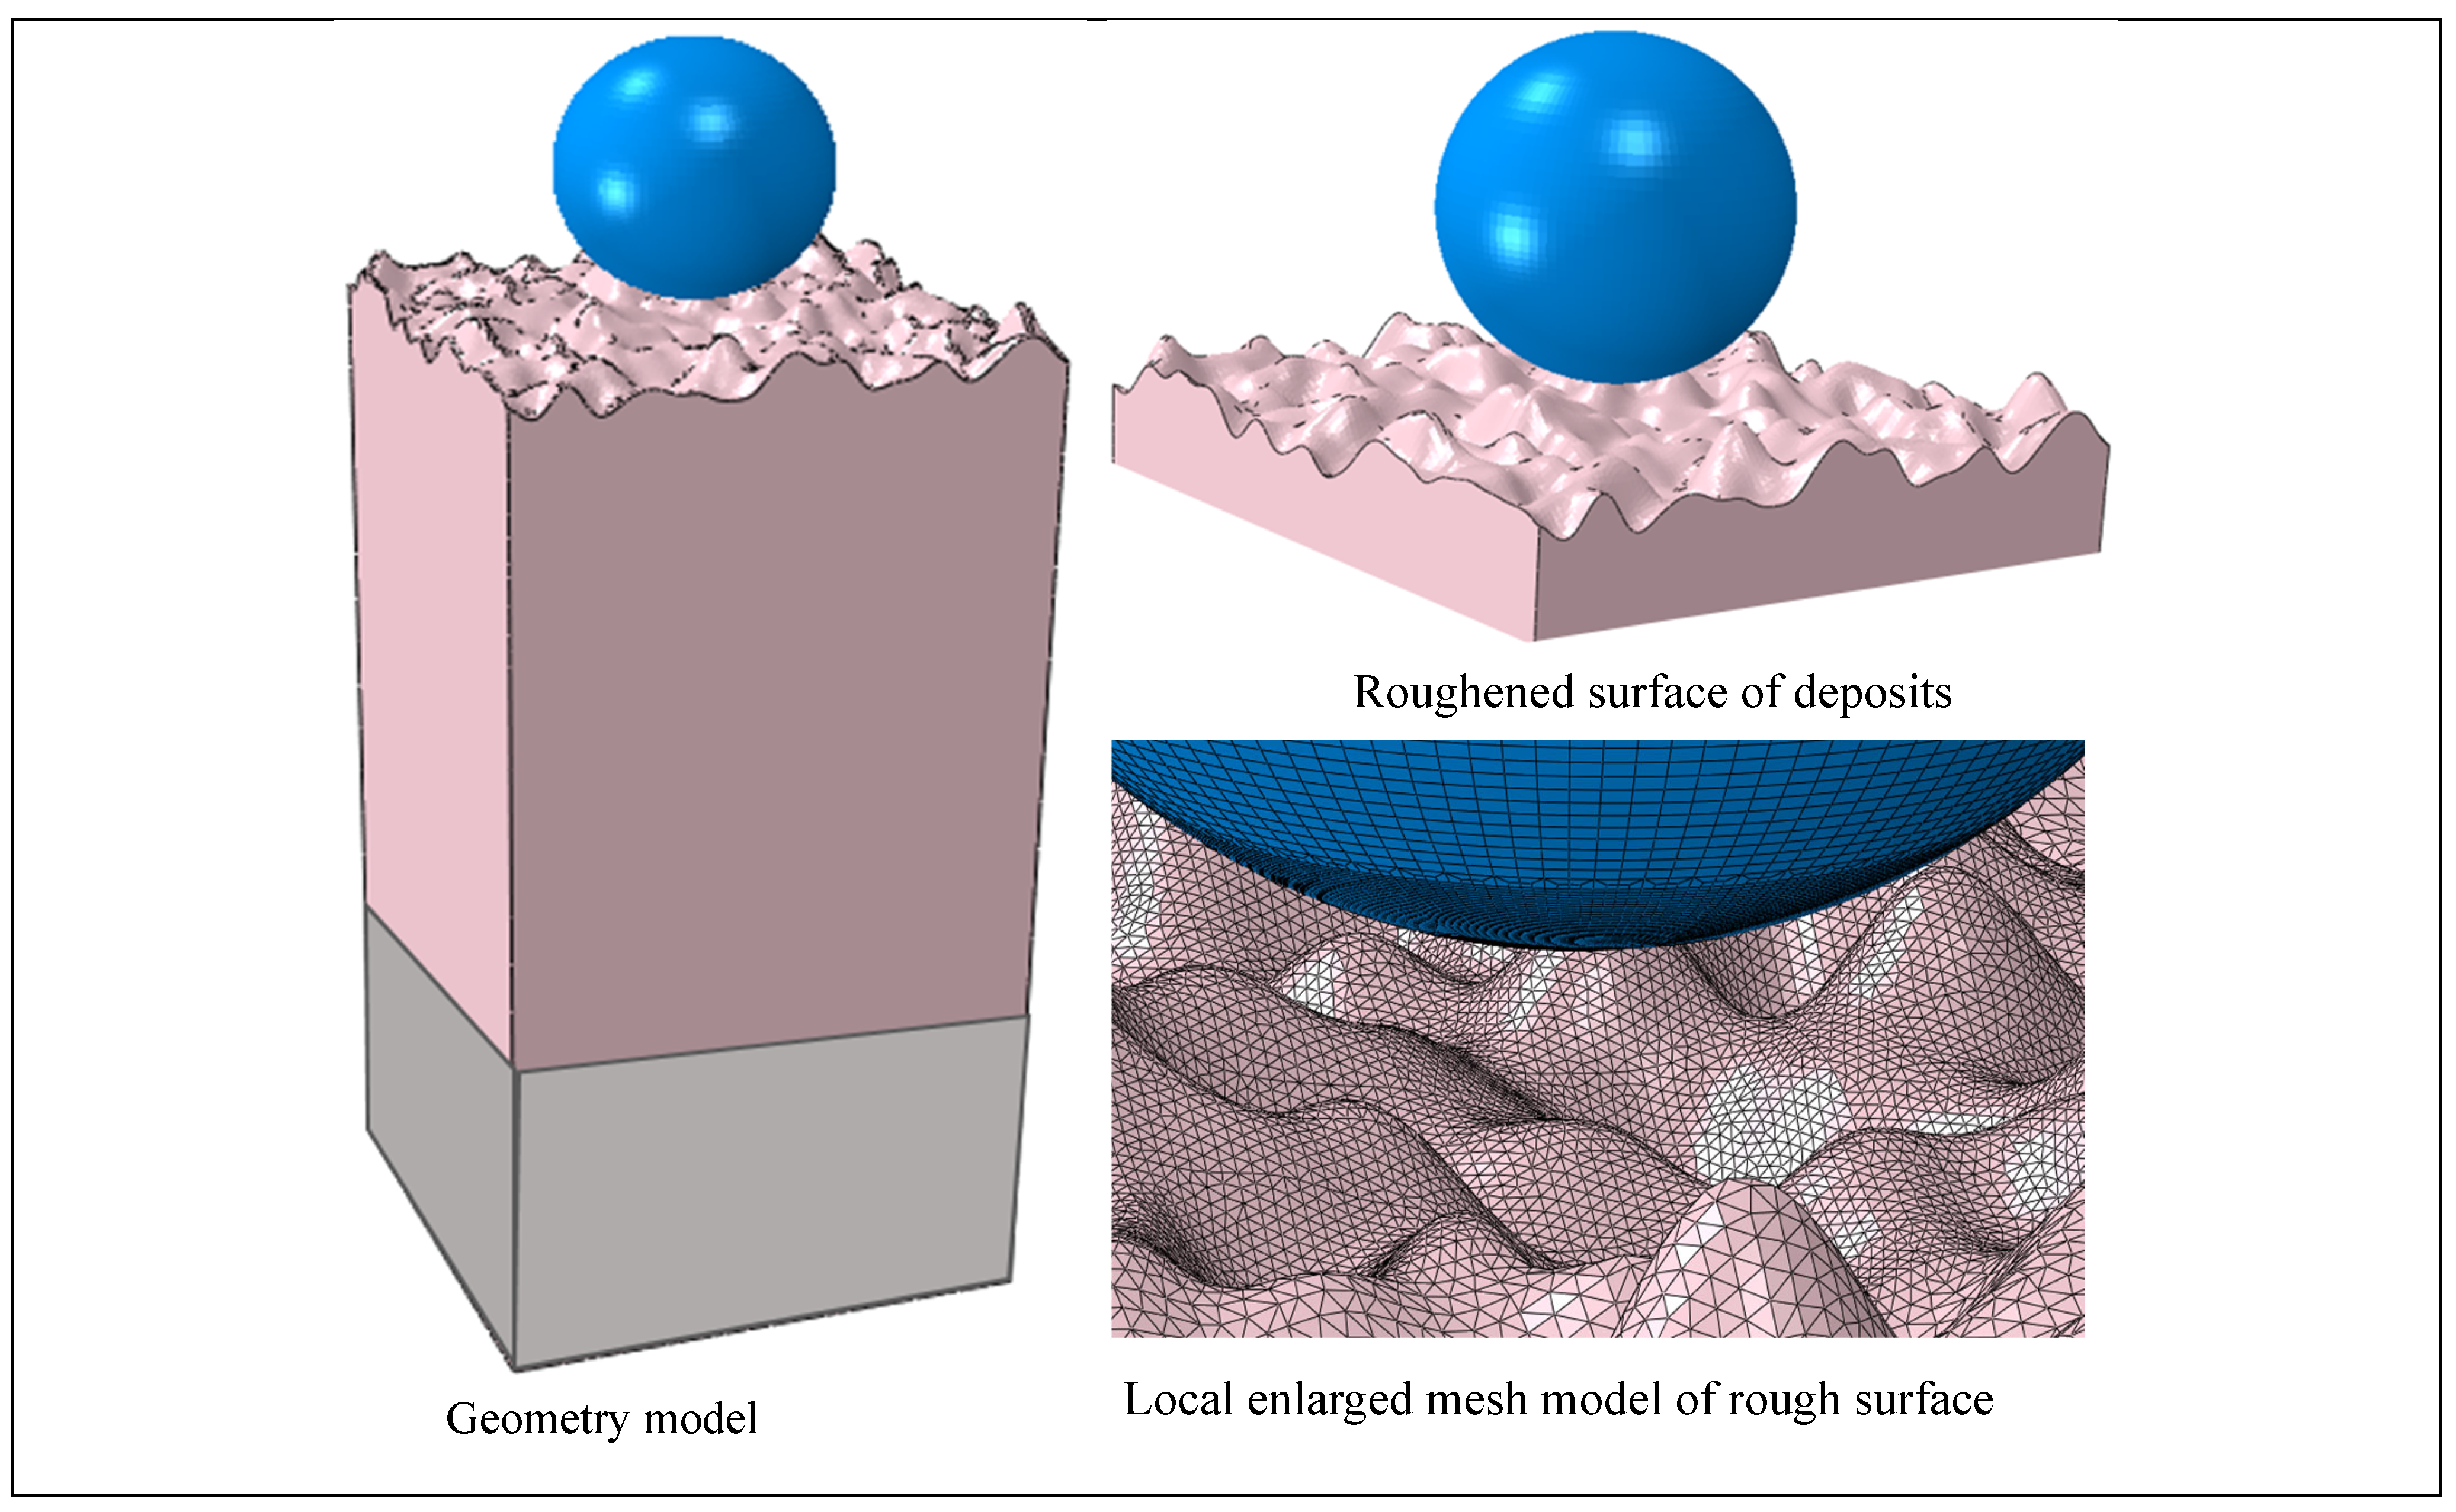
3.3. Generation of Rough Surface Model

As particles consistently accumulate on a structure’s surface, the impact with the roughened surface of the deposits causes skin friction and variations in the convective heat transfer rates [35]. Furthermore, the surface characteristics of these deposits exert a notable influence on the surrounding flow field, altering the collision dynamics for the subsequent particles. The surface roughness also plays an important role in affecting the contact behavior. The deposit surfaces, characterized by topographical irregularities rather than smoothness or uniform asperities, needed to be as real as possible.
Numerous research findings have shown that the height distribution of micro-asperities on rough surfaces follows a Gaussian distribution, and the surface profile exhibits an exponential autocorrelation function. A Gaussian probability density model has been employed to capture the three-dimensional morphology of deposits and reconstruct a rough surface of the structure for particle collision in our previous studies [12,32]. The z-axis coordinates are determined by sampling according to the Gaussian probability density function and evenly distributing them on the xy plane. The probability density function f(z) is given as follows [36]:
        f ( z ) = 1 δ 2 π e x p z 2 2 δ 2
where σ is the standard deviation of the Gaussian distribution. The exponential autocorrelation function is adopted to determine the distribution of asperities across a rough surface and is shown in the following:
C τ x , τ y = δ 2 e x p 1 l 2 ( x 2 + y 2 )
where l is defined as the correlation length along the x and y axes and represents the density of the surface asperities, as depicted in Figure 5. X and y represent the coordinates of a point along the x and y dimensions, respectively. The values of δ and l determine the statistical profile of the surface.
A three-dimensional random surface representation of the deposits was constructed to study the effect of the deposits’ surface roughness on particle collisions based on the Gaussian probability density function and exponential autocorrelation function. The roughness of the surface can be evaluated with the squared average roughness Rms, which is given as
R m s = 1 I J I = 0 I 1 J = 0 J 1 ( Z I J Z m e a n )
where I and J represent the number of positions along the x and y directions on the surface, respectively; ZIJ denotes the height of the surface at each point; Zmean represents the mean height of the surface.
According to the results for an ideal flat surface collision obtained from Section 3.2, when the thickness of the deposits is greater than or equal to twice the particle diameter, the particle collision behavior tends to be unchanged. Therefore, two deposition layers with the total thickness of twice the particle diameter were attached to the substrate surface, and the influence of the surface roughness of the deposition layer on the particle collision and rebounding characteristics was further examined. The surface roughness Rms was set to 0.1 μm according to the surface roughness analysis conducted in our previous work [12]. The effect of the correlation length l on the particle contact behavior was studied.
The effect of the correlation length l along the x and y axes describing the density of asperities in the x and y axes was analyzed. Figure 6 shows two typical rough surfaces: (a) a rougher surface, 1, with l = 0.1 μm; (b) a less-rough surface, 2, with l = 0.2 μm. Figure 6 c and d give the contour maps of the rougher surface 1 and less-rough surface 2. It can be seen from Figure 6 that as the correlation length l decreases, the number of asperities and the peak value of the surface both increase, and the surface shows a much higher roughness.
Figure 7 shows the corresponding geometry model and finite element model of an impacting plate consisting of a substrate and deposits with random surface roughness. A mesh independence analysis was conducted. The whole model was constructed since the surface roughness varied along the x and y axes; the remaining boundary conditions were set to be consistent with those applied in the smooth surface model. In particular, the particle impacts on the rough surface exhibited varying effects among the different impact points due to the random distribution of surface height and curvature. To comprehensively calculate the impacts’ outcomes on a rough surface, the simulation of five uniformly distributed impact points on three randomly generated Gaussian rough was conducted to find the mean value, which was used for comparison.

3.4. Effect of Surface Roughness of Deposits

A comparison of the contact parameters for the deposit surfaces with different roughnesses is shown in Figure 8. Fifteen data points at each impact velocity are listed for particle collisions at different positions on three random surfaces, which are depicted in Figure 6c. It demonstrates that the fifteen data points exhibit some variation at the same impact velocity on rough surfaces due to the irregular surface distribution. Particles contacting different positions with differences in curvature and height result in the dispersion of contact stress, with different friction and rotation characteristics. The curves fitting the collision data points were displayed and compared for different rough surfaces.
The contact area, playing a crucial role in determining the adhesion force, is substantially influenced by the surface roughness. Figure 8a shows the influence of the surface roughness on the maximum contact area. It is evident from the figure that, at a consistent incident velocity, the maximum contact area gradually decreases with increasing surface roughness. This is attributed to the surface roughness augmenting the curvature of the contact points and then diminishing the contact area. It also can be seen that the maximum contact area increases with the impact velocity. Regarding the effect of the surface roughness on the contact time, the contact time is longer when the surface is much rougher, while the maximum contact force shows the opposite trend. Particles exhibit rotational velocity due to the work of friction. Figure 8d illustrates effect of surface roughness on rotational velocity under different impact velocities. As depicted in the figure, the impact of correlation length roughness on rotational velocity is not prominent. An increase in correlation length decrease leads to a small rotational velocity increase. The figures show that the error between the fifteen data points for each case increases when the surface is much sharper, since the collision condition for each position impact is significantly different.
The total COR representing the ratio of the resultant rebound velocity to the incident velocity was defined for particle collisions with rough surfaces due to the random nature of the surface. Figure 9 shows the total COR of sand particles versus normal incident velocity under different surface roughness values. The COR of the particles colliding with the rough deposits’ surfaces decreases as the surface becomes rougher or sharper. This is attributed to a larger plastic energy loss being produced by rougher surfaces. A particle has a higher COR when it has a low incident velocity due to less energy being lost.

4. Conclusions

Particle collision and deposition in the cooling ducts of turbine blades may cause serious thermal damage to the engine. This study was conducted to investigate the effect of deposits on particle collision behavior. The influences of deposit height and surface roughness on the particles’ rebounding and deposition characteristics were both discussed. The main conclusions drawn were as follows:
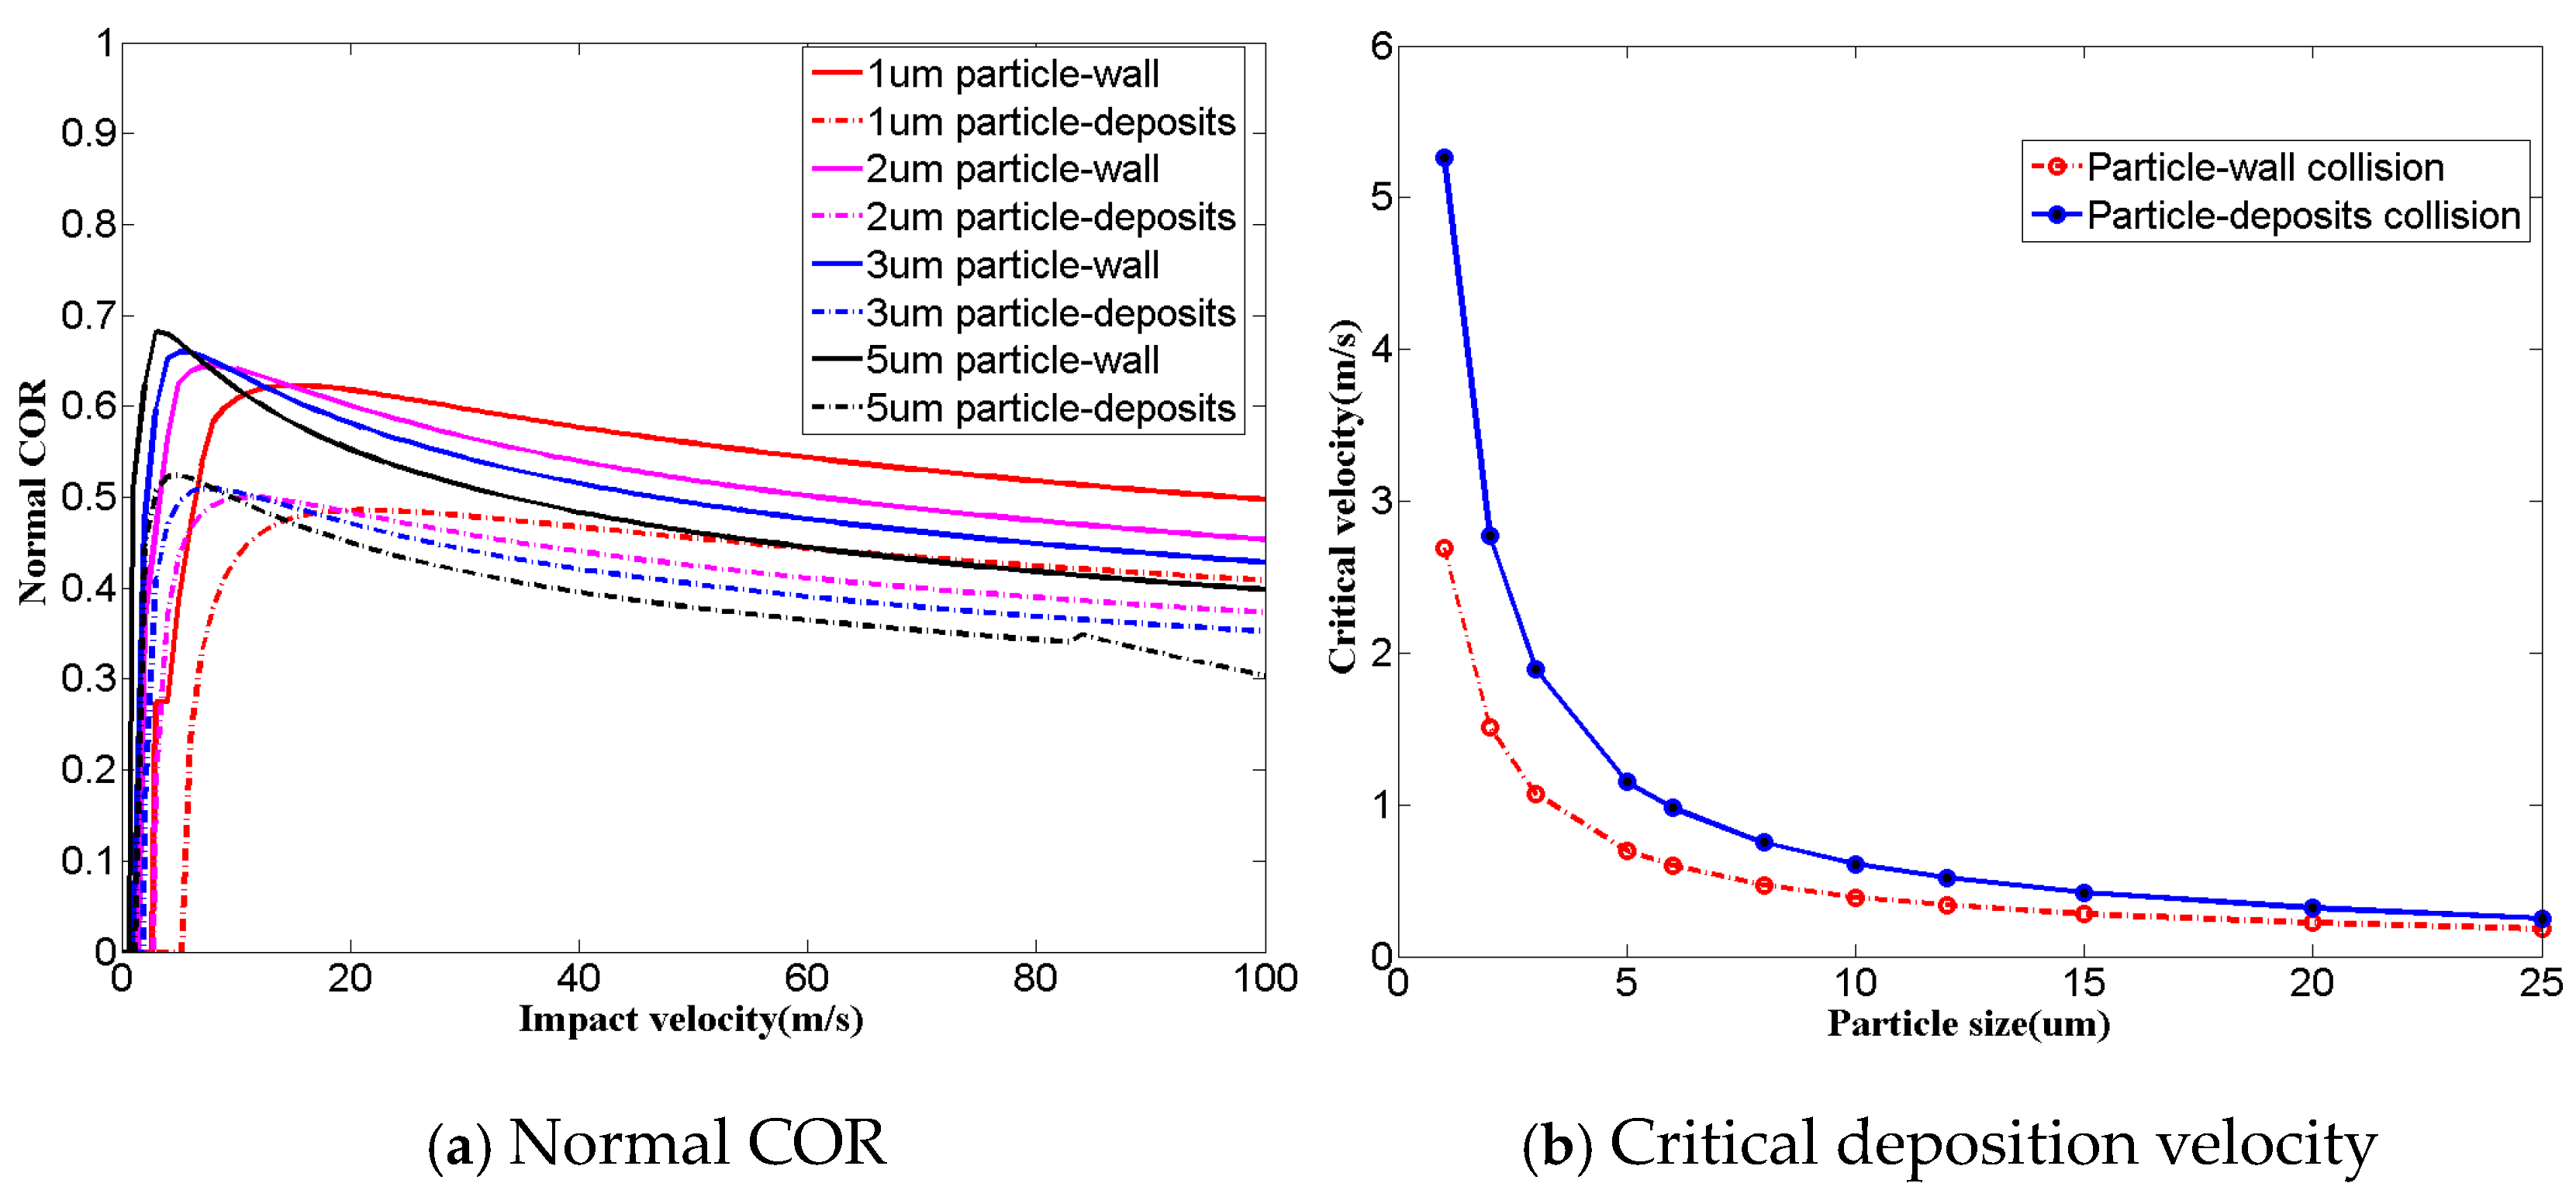
  • The theoretical analysis shows that the normal restitution coefficient for particle–deposit collision is much lower than that of particle–DD3 nickel-based single-crystal substrate collision. The critical deposition velocity of the particles is higher for particle–deposit collisions and decreases with the increase in particle size.
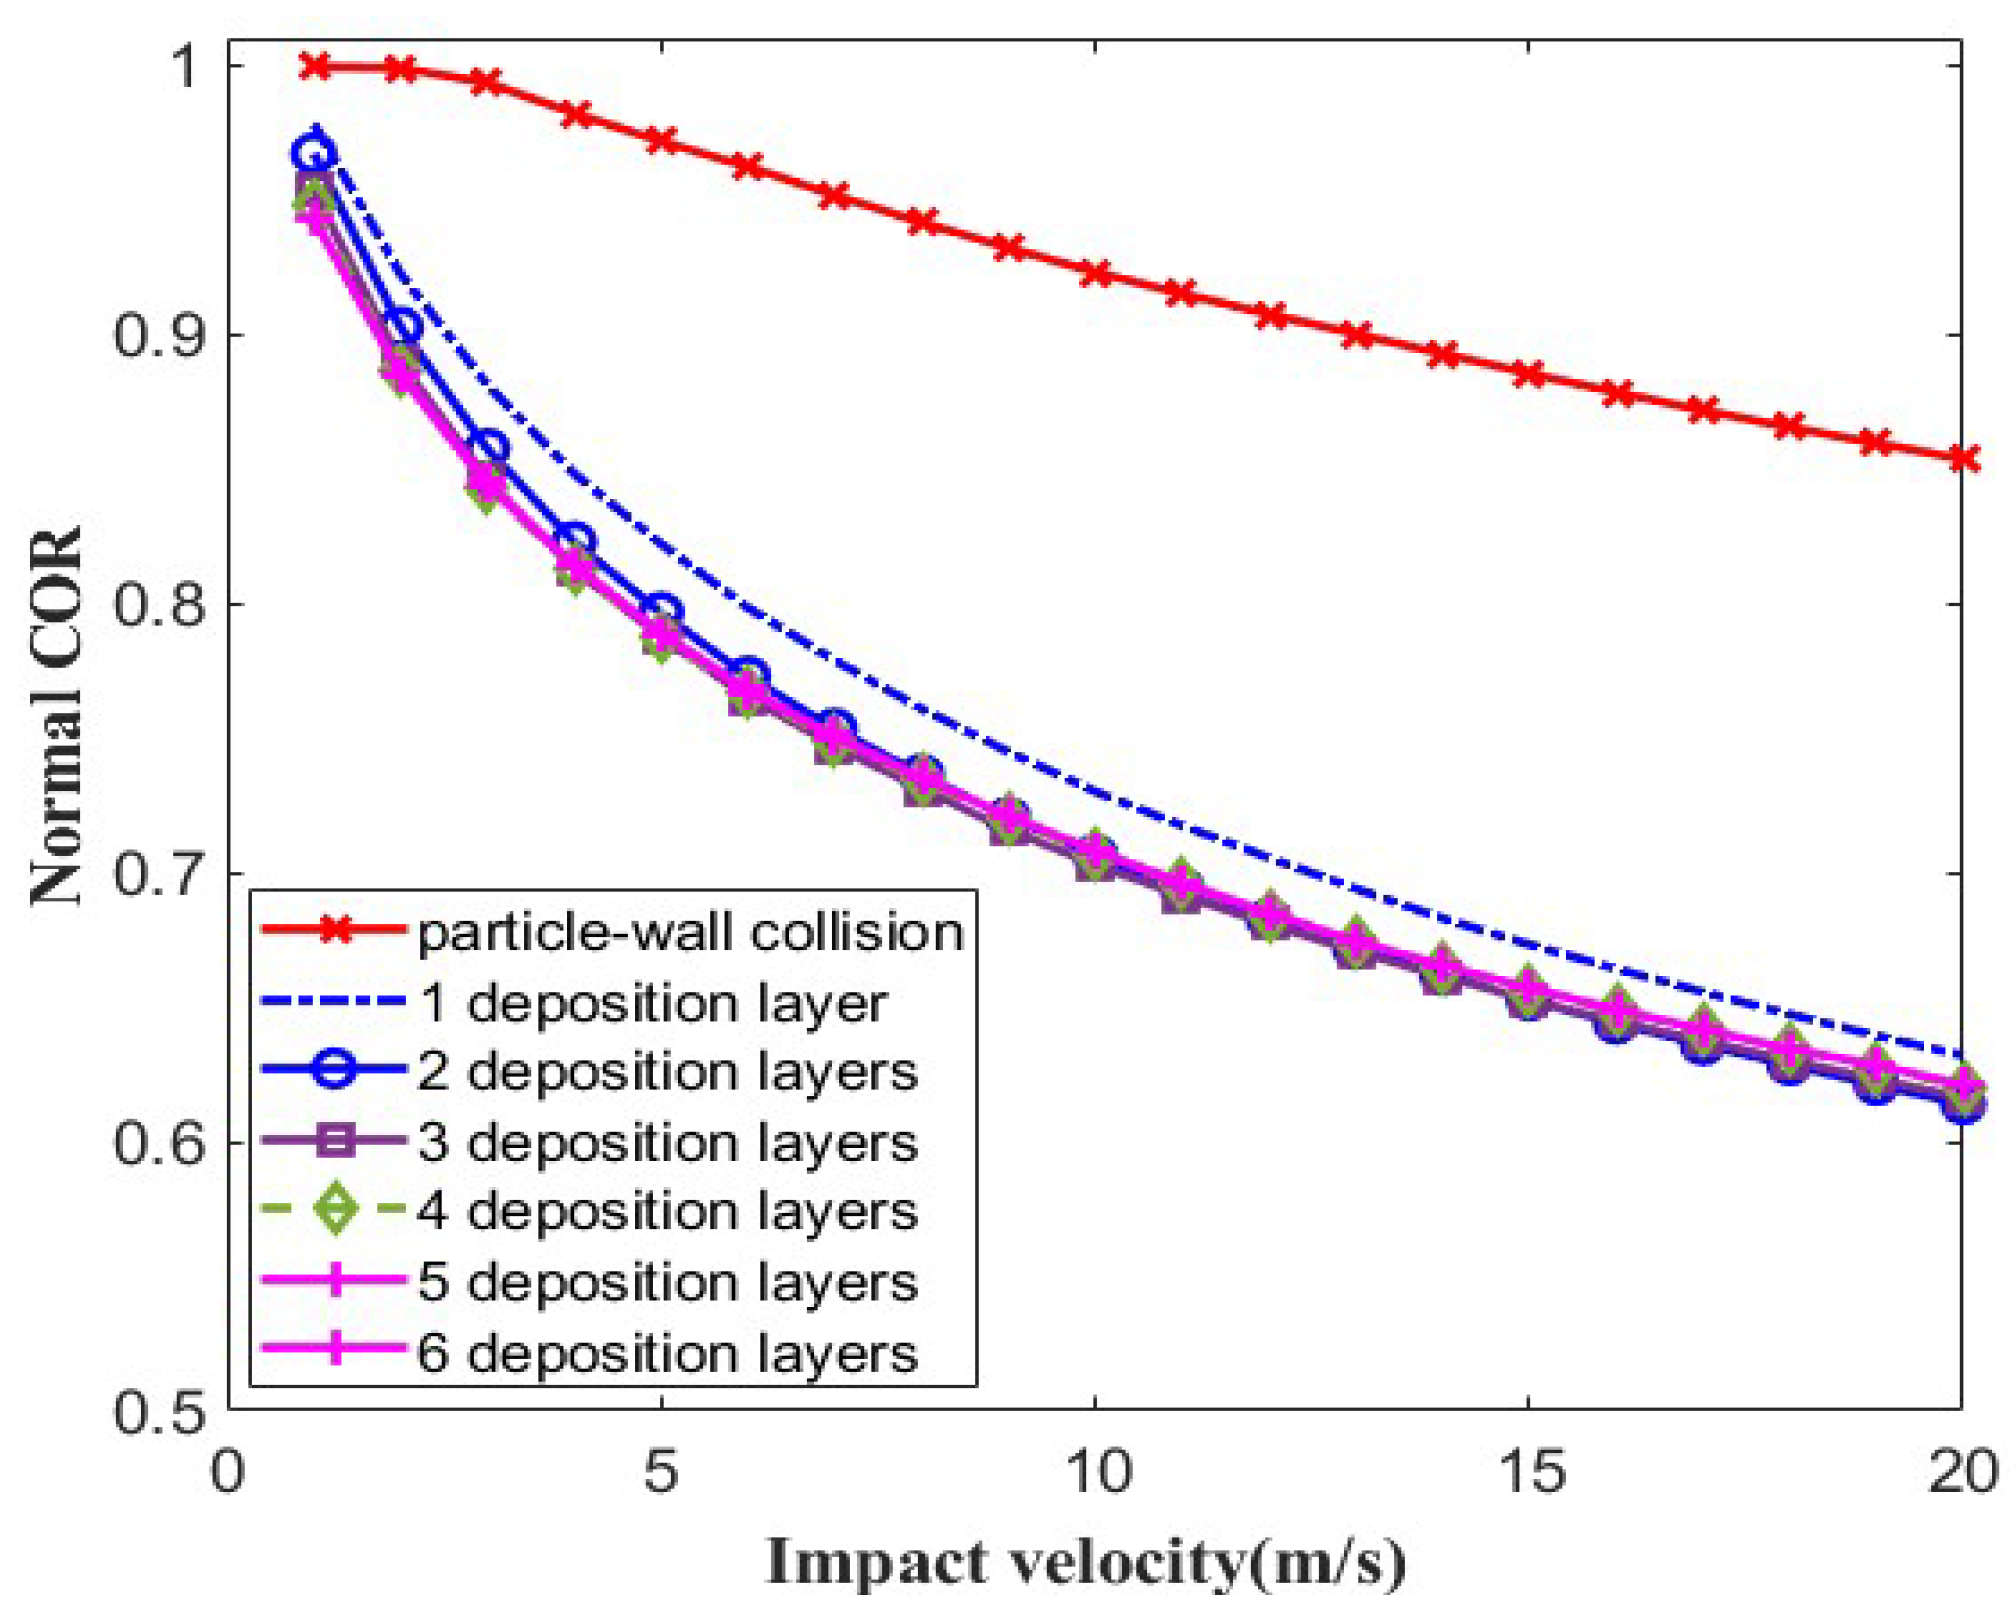
  • The numerical study of the effects of deposits with flat surfaces displayed that when the height of the deposits is greater than twice the particle diameter, the COR tends to be unchanged, which means particle–wall collision becomes particle–deposit collision.
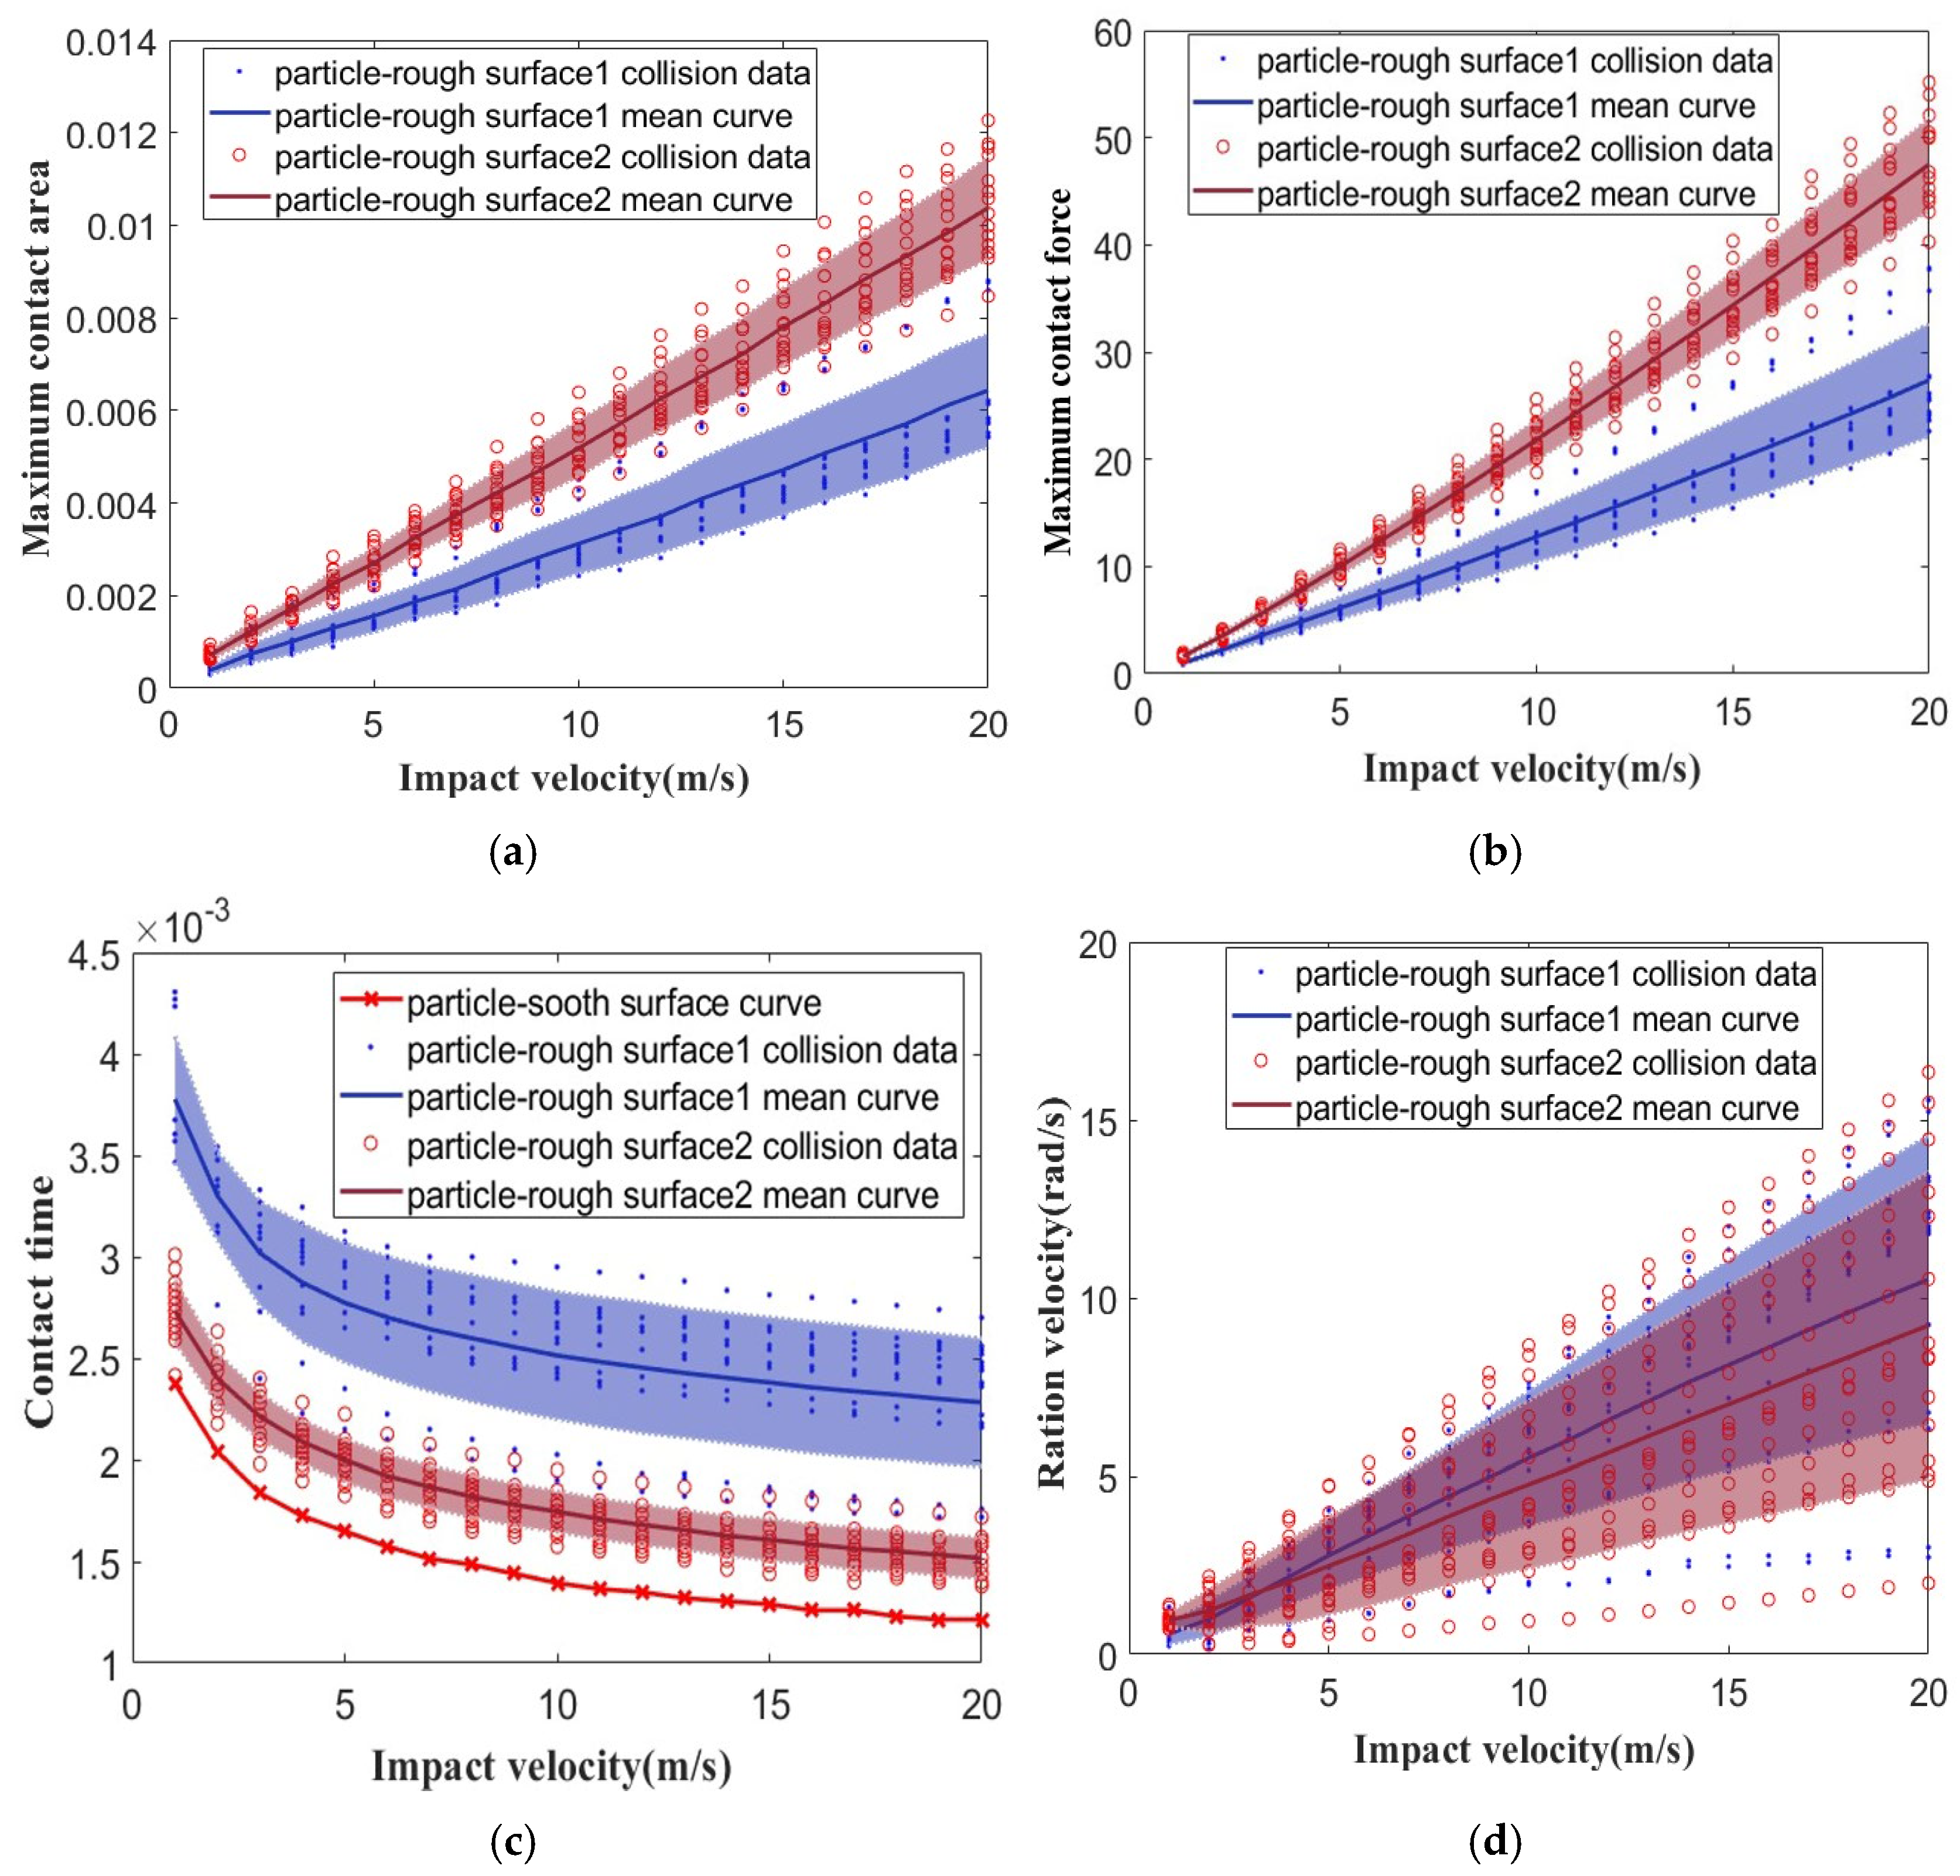
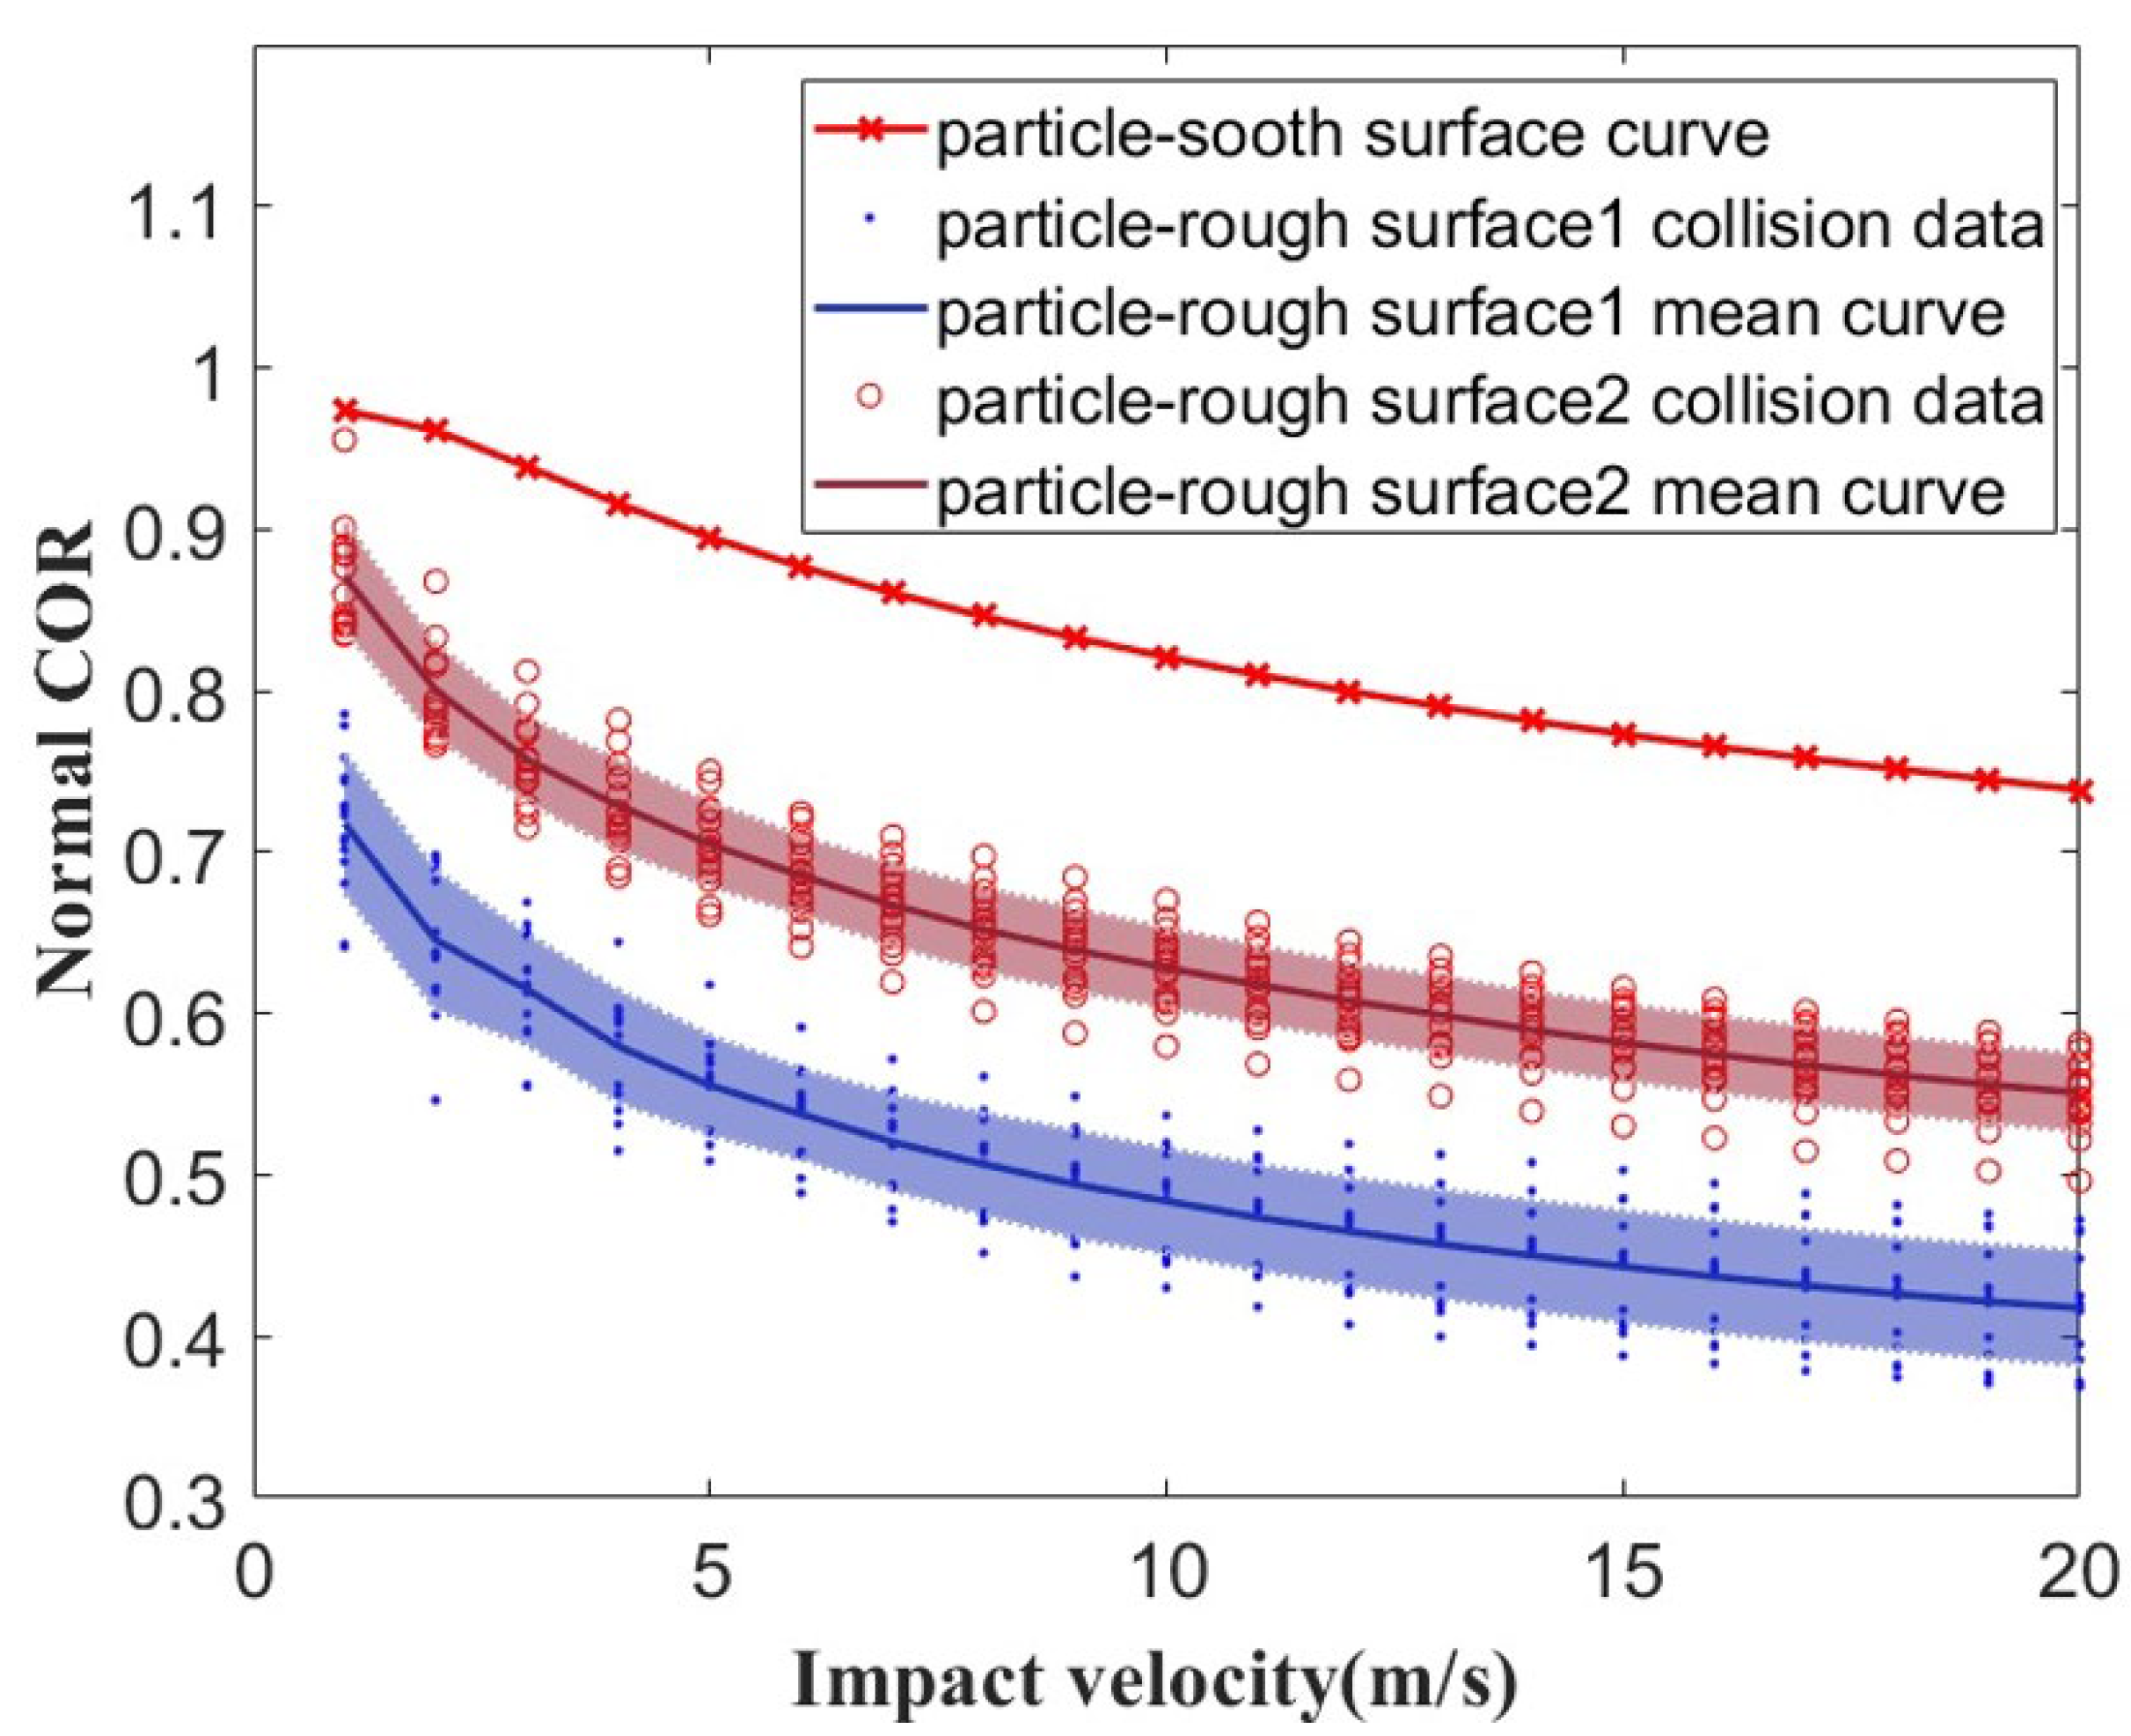
  • Random Gaussian rough surfaces with constant Rms and different correlation lengths l were constructed and analyzed under particle collision. The results demonstrate that surface roughness plays an important role in particle contact behavior. A rough surface with a smaller correlation length, representing a high density of asperities, and that is steeper has a longer contact time and smaller contact area. The restitution coefficient decreases with increasing surface roughness. The correlation length l has minimal effect on the rotational velocity.
The conclusions that can be drawn are that the thickness and surface roughness of deposits play a significant role in particle contact. It is necessary to take the effect of deposits’ properties and distributions into consideration when studying long-term transportation and deposition in cooling ducts. While we proved the influence of deposit thickness and surface roughness on particle collision, the quantitative relationship between them was not studied. This aspect will be thoroughly investigated in future research.

Author Contributions

S.X.: conceptualization, methodology, formal analysis, investigation, and writing—original draft of the manuscript. C.P.: methodology and investigation. J.Q.: methodology and investigation. B.S.: writing—review and editing. Y.X.: review and editing. All authors have read and agreed to the published version of the manuscript.

Funding

This work was supported by the Key Research & Development and Promotion Projects of Henan Province (232102220040).

Data Availability Statement

All data are included in the text.

Conflicts of Interest

Author Baiwan Su was employed by the company LuoYang Bearing Research Institute Co., Ltd. The remaining authors declare that the research was conducted in the absence of any commercial or financial relationships that could be construed as a potential conflict of interest.

References

  1. Liu, D.; Ding, Q.; Zhou, Q.; Zhou, D.; Wei, X.; Zhao, X.; Zhang, Z.; Bei, H. Microstructure, Mechanical Properties and Thermal Stability of Ni-Based Single Crystal Superalloys with Low Specific Weight. Crystals 2023, 13, 610. [Google Scholar] [CrossRef]
  2. Wylie, S.; Bucknell, A.; Forsyth, P.; McGilvray, M.; Gillespie, D.R. Reduction in flow parameter resulting from volcanic ash deposition in engine representative cooling passages. J. Turbomach. 2017, 139, 031008. [Google Scholar] [CrossRef]
  3. Boulanger, A.; Patel, H.; Hutchinson, J.; DeShong, W.; Xu, W.; Ng, W.; Ekkad, S. Preliminary experimental investigation of initial onset of sand deposition in the turbine section of gas turbines. In Turbo Expo: Power for Land, Sea, and Air; GT2016-56059; American Society of Mechanical Engineers: New York, NY, USA, 2016. [Google Scholar]
  4. Wammack, J.E.; Crosby, J.; Fletcher, D.; Bons, J.P.; Fletcher, T.H. Evolution of surface deposits on a high pressure turbine blade, part i: Physical characteristics. In Turbo Expo: Power for Land, Sea, and Air; American Society of Mechanical Engineers: New York, NY, USA, 2006; Volume 4238, pp. 1055–1063. [Google Scholar]
  5. Yang, X.J.; Cui, M.H.; Liu, Z.G. Experimental study on deposition of particulate on plate surface with cooling film. Propuls. Technol. 2018, 39, 1323–1330. (In Chinese) [Google Scholar]
  6. Lundgreen, R.; Sacco, C.; Prenter, R.; Bons, J.P. Temperature effects on nozzle guide vane deposition in a new turbine cascade rig. In Turbo Expo: Power for Land, Sea, and Air; GT2016-57560; American Society of Mechanical Engineers: New York, NY, USA, 2016. [Google Scholar]
  7. Davidson, F.T.; Kistenmacher, D.A.; Bogard, D.G. A Study of Deposition on a Turbine Vane With a Thermal Barrier Coating and Various Film Cooling Geometries. J. Turbomach. 2014, 136, 041009. [Google Scholar] [CrossRef]
  8. Laycock, R.; Fletcher, T.H. Independent effects of surface and gas temperature on coal fly ash deposition in gas turbines at temperatures up to 1400 °C. J. Eng. Gas Turbines Power 2016, 138, 021402. [Google Scholar] [CrossRef]
  9. Lawson, S.A.; Lynch, S.P.; Thole, K.A. Simulations of multiphase particle deposition on a non-axisymmetric contoured end wall with film-cooling. J. Turbomach. 2013, 135, 031032. [Google Scholar] [CrossRef]
  10. Albert, J.E.; Bogard, D.G. Experimental simulation of contaminant deposition on a film cooled turbine air-foil leading edge. J. Turbomach. 2012, 134, 51011. [Google Scholar] [CrossRef]
  11. Albert, J.E.; Bogard, D.G. Experimental simulation of contaminant deposition on a film-cooled turbine vane pressure side with a trench. J. Turbomach. 2013, 135, 51001. [Google Scholar] [CrossRef]
  12. Xin, S.; Yu, K.; Xu, X.; Yao, S.; Wang, H. Simulation of surface deposits of micron sand particles in the internal cooling duct with a Gaussian probability density model. Comput. Part. Mech. 2024, 11, 2465–2481. [Google Scholar] [CrossRef]
  13. Brach, R.M.; Dunn, P.F. A mathematical model of the impact and adhesion of microspheres. Aerosol Sci. Technol. 1992, 16, 51–64. [Google Scholar] [CrossRef]
  14. Tafti, D.; Sreedharan, S. Composition dependent model for the prediction of syngas ash deposition with application to a leading edge turbine vane. In Proceedings of the ASME Turbo Expo, 2010, GT2010-23655, Glasgow, UK, 14–18 June 2010. [Google Scholar]
  15. Singh, S.; Tafti, D. Particle deposition model for particulate flows at high temperatures in gas turbine components. Int. J. Heat Fluid Flow 2015, 52, 72–83. [Google Scholar] [CrossRef]
  16. Yu, K.; Tafti, D. Impact model for micrometer-sized sand particles. Powder Technol. 2016, 294, 11–21. [Google Scholar] [CrossRef]
  17. Yu, K.; Elghannay, H.A.; Tafti, D. An impulse based model for spherical particle collisions with sliding and rolling. Powder Technol. 2017, 319, 102–116. [Google Scholar] [CrossRef]
  18. Yu, K.; Tafti, D. Size and temperature dependent collision and deposition model for micron-sized sand particles. J. Turbomach. -Trans. ASME 2019, 141, 031001. [Google Scholar] [CrossRef]
  19. Dowd, C.; Tafti, D.; Yu, K. Sand transport and deposition in rotating two-passed ribbed duct with Coriolis and centrifugal Buoyancy forces at RE=100,000. In Turbo Expo: Turbomachinery Technical Conference and Exposition; GT2017-63167; American Society of Mechanical Engineers: New York, NY, USA, 2017. [Google Scholar]
  20. Yu, K.; Liu, J.; Xu, X.; Yao, S.; Hou, N.X.; Yue, Z. Dust transport investigation in ribbed cooling duct integrating temperature-dependent elastic-plastic particle collision model. Part. Sci. Technol. 2022, 40, 42–52. [Google Scholar] [CrossRef]
  21. Forsyth, P.R.; Gillespie, D.R.; McGilvray, M. Development and applications of a couple deposition dynamic mesh morphing approach for the numerical simulation of gas turbine flows. J. Eng. Gas Turbines Power Trans. ASME 2018, 140, 022603. [Google Scholar] [CrossRef]
  22. Mu, L.; Wang, S.; Zhai, Z. Unsteady CFD simulation on ash particle deposition and removal characteristics in tube banks: Focusing on particle diameter, flow velocity, and temperature. J.-Energy Inst. 2020, 93, 1481–1494. [Google Scholar] [CrossRef]
  23. Feuillebois, F.; Gensdarmes, F.; Mana, Z.; Ricciardi, L.; Monier, C.; Le Meur, G.; Reynaud, C.; Rabaud, M. Three-dimensional motion of particles in a shear flow near a rough wall. J. Aerosol Sci. 2016, 96, 69–95. [Google Scholar] [CrossRef]
  24. Mizes, H.; Ott, M.; Eklund, E.; Hays, D. Small particle adhesion: Measurement and control. Colloids Surf. A 2000, 165, 11–23. [Google Scholar] [CrossRef]
  25. Greenwood, J.A.; Williamson, J.B.P. Contact of nominally flat surfaces. Proc. R. Soc. Lond. 1966, 295, 300–319. [Google Scholar]
  26. Patil, D.B.; Eriten, M. Effects of interfacial strength and roughness on the static friction coefficient. Tribol. Lett. 2014, 56, 355–374. [Google Scholar] [CrossRef]
  27. Krull, F.; Mathy, J.; Breuninger, P.; Antonyuk, S. Influence of the surface roughness on the collision behavior of fine particles in ambient fluids. Powder Technol. 2021, 392, 58–68. [Google Scholar] [CrossRef]
  28. Rajupet, S.; Riet, A.A.; Chen, Q.; Sow, M.; Lacks, D.J. Relative importance of electrostatic and van der Waals forces in particle adhesion to rough conducting surfaces. Phys. Rev. E 2021, 103, 042906. [Google Scholar] [CrossRef] [PubMed]
  29. Wang, Y.; Zhang, Y.; Fang, Z.; Wu, X. The effect of surface roughness on the viscoelastic energy dissipation in a particle-wall collision. J. Aerosol Sci. 2024, 175, 106280. [Google Scholar] [CrossRef]
  30. Gao, Y.F.; Bower, A. Elastic-plastic contact of a rough surface with weierstrass profile. Proc. R. Soc. A Math. Phys. Eng. Sci. 2006, 462, 319–348. [Google Scholar] [CrossRef]
  31. Jackson, R.L.; Green, I. A statistical model of elasto-plastic asperity contact between rough surfaces. Tribol. Int. 2006, 39, 906–914. [Google Scholar] [CrossRef]
  32. Yu, K.; Peng, C.; Shang, L.; Tafti, D. Elastic-plastic collision mechanism of micron-sized particle impacting rough surfaces. Powder Technol. 2024, 442, 119903. [Google Scholar] [CrossRef]
  33. Liu, J.; Yu, K.; Tafti, D.; Yang, X.; Xu, H. Dust adhesion and deposition behavior in internal cooling duct with pin fins. Int. J. Therm. Sci. 2023, 184, 107943. [Google Scholar] [CrossRef]
  34. Wu, C.Y.; Li, L.Y.; Thornton, C. Energy dissipation during normal impact of elastic and elastic–plastic spheres. Int. J. Impact Eng. 2005, 32, 593–604. [Google Scholar] [CrossRef]
  35. Qu, X.; Cai, X.; Zhang, M.; Lin, H.; Leihong, Z.; Liao, B.Q. A facile method for simulating randomly rough membrane surface associated with interface behaviors. Appl. Surf. Sci. 2017, 427, 915–921. [Google Scholar] [CrossRef]
  36. Li, X.; Dong, M.; Jiang, D.; Li, S.; Shang, Y. The effect of surface roughness on normal restitution coefficient, adhesion force and friction coefficient of the particle-wall collision. Powder Technol. 2020, 362, 17–25. [Google Scholar] [CrossRef]
Figure 1. The transition of the collision mode from particle–wall to particle–deposit.
Crystals 15 00510 g001
Figure 2. The normal COR and critical deposition velocity for different collision modes.
Crystals 15 00510 g002
Figure 3. Geometry and mesh model of smooth surface.
Crystals 15 00510 g003
Figure 4. The effect of deposit thickness on normal COR.
Crystals 15 00510 g004
Figure 5. Surface roughness parameters of standard deviation σ and correlation length l.
Crystals 15 00510 g005
Figure 6. Rough surfaces with Gaussian distribution.
Crystals 15 00510 g006
Figure 7. The geometry model and finite element model with random surface roughnesses.
Crystals 15 00510 g007
Figure 8. Contact results for rough surface: (a) the maximum contact area; (b) the maximum contact force; (c) the contact time; (d) rotation velocity.
Crystals 15 00510 g008
Figure 9. The surface roughness effect on the COR.
Crystals 15 00510 g009
Table 1. Properties of the particle and wall for theoretical analysis [20].
Material Elastic Modulus/GPaYield Stress/MPa/Density/kg/m3Poisson’s Ratio
Particle 19590026300.23
Wall 6144082000.33
Disclaimer/Publisher’s Note: The statements, opinions and data contained in all publications are solely those of the individual author(s) and contributor(s) and not of MDPI and/or the editor(s). MDPI and/or the editor(s) disclaim responsibility for any injury to people or property resulting from any ideas, methods, instructions or products referred to in the content.

