Article

Sodium Dithiocuprate(I) Dodecahydrate [Na3(H2O)12][CuS2], the First Crystal Structure of an Exclusively H-Bonded Dithiocuprate(I) Ion, and Its Formation in the Alkaline Sulfide Treatment of Copper Ore Concentrates

by
Jörg Wagler
1,*,
Karsten Meiner
2,
Florian Gattnar
1,
Alexandra Thiere
2,
Michael Stelter
2 and
Alexandros Charitos
2
1
Institut für Anorganische Chemie, TU Bergakademie Freiberg, 09599 Freiberg, Germany
2
Institut für Nichteisenmetallurgie und Reinststoffe, TU Bergakademie Freiberg, Leipziger Str. 34, 09599 Freiberg, Germany
*
Author to whom correspondence should be addressed.
Crystals 2025, 15(6), 501; https://doi.org/10.3390/cryst15060501 (registering DOI)
Submission received: 3 May 2025 / Revised: 19 May 2025 / Accepted: 20 May 2025 / Published: 24 May 2025
(This article belongs to the Section Crystal Engineering)

Abstract

:
This article presents the single-crystal structure of the complex salt sodium dithiocuprate(I) dodecahydrate Na3CuS2·12(H2O), i.e., [Na3(H2O)12][CuS2], which forms in the high-sulfide concentrations of the alkaline solutions used for arsenic separation from copper concentrates. It features a linear hydrogen-bonded dithiocuprate(I) anion, a novelty in crystallographically characterized thiocuprates. During the study of the alkaline sulfide leaching of Chilean copper concentrates, an analytical investigation of the solution led to the detection of this complex. This study aimed to understand the chemical behavior of the leaching solution by identifying existing ions, which facilitated the discovery of the complex using single-crystal analysis. The newly discovered complex was also synthesized from a modeling solution based on the leaching solution recipe for arsenic removal, allowing for further crystal characterization through Raman and XRD analysis. By estimating the sodium sulfide threshold concentration that enhanced the formation of the copper disulfide complex, this study defined the upper technical threshold limit of sulfide concentration for the economic development of alkaline sulfide leaching to remove arsenic.

1. Introduction

Arsenic poses a global threat to health and to the environment in the copper mining industry [1,2]. Therefore, there is a significant economic and environmental interest in developing a sustainable and economical process chain for removing arsenic from copper concentrates [1,2]. In this regard, the partial roasting of copper concentrates is the current industrial standard for arsenic removal [3]. In recent years, numerous investigations have focused on potential methods of hydrometallurgical treatment, such as alkaline sulfide leaching, to remove mineralogically bonded arsenic from copper concentrates by dissolving it into the alkaline sulfide solution [1,2].
A previous study addressed the investigation of the thioarsenate species formed in the leaching solutions by 75As NMR spectroscopy [4], and thus allowed for deeper insights into the solution part of this process. The copper components were treated as essentially unaffected in terms of leaching. This is (at least in part) justified, as the chemistry of alkaline sulfide leaching involves the formation of chalcocite (Cu2S) and covellite (CuS), as well as sodium tetrathioarsenate from enargite or tennantite. The sulfide forms tetrathioarsenate and, in combination with the high pH of sodium hydroxide, passivates the copper as copper sulfides, which remain in the solid leaching residues [5,6,7,8] (cf. Figure 1a).
Regarding the chemical interaction of copper with the alkaline sulfide solution, R. N. Gow [5] describes the interaction between copper sulfide from enargite and the sulfide in alkaline sulfide leaching solutions. Consequently, it is probable that copper from enargite (Cu3AsS4), as well as from covellite (CuS) and chalcocite (Cu2S) in the resulting residues, forms further complexes depending on the sulfide concentration, with a typical potential of −0.5 V to −1.0 V and a pH of 13. With increasing sodium sulfide concentration, there is a higher probability of copper dissolving, although still in negligible amounts, up from a concentration of around 2 M NaOH [5].
The alkaline sulfide leaching medium typically operates at a pH of 11–14, depending on the sodium hydroxide concentration. In this study, a pH of 13 was achieved using 2.5 M NaOH as the alkaline medium. While the leaching solutions were prone to the crystallization of hydrates of sodium sulfide upon storage at room temperature, we investigated the solids formed by single-crystal X-ray diffraction upon random crystal picking. In addition to the well-known salt Na2S·9(H2O) [9], which was identified by unit cell determination, one sample contained small colorless crystals of a hitherto unreported structure, which must have formed in the leaching procedure (Figure 1b). Structure solution and refinement revealed the formation of the dithiocuprate(I) salt Na3CuS2·12(H2O), which confirmed the formation of discrete [CuS2]3− ions (Figure 1c).
The following paper addresses this compound, Na3CuS2·12(H2O), which unequivocally underlines the role of thiocuprate(I) formation as a potential means of the loss of copper during alkaline sulfide leaching and which represents the first crystallographic evidence of a simple dithiocuprate(I) salt with an exclusively hydrogen-bonded anion.

2. Materials and Methods

2.1. General Considerations

Leaching solutions were prepared using sodium hydroxide (VWR, Darmstadt, Germany, analytical grade 95–100%) and sodium sulfide trihydrate (VWR, Darmstadt, Germany, chemical analysis quality 58–64% Na2S content). Solutions for the deliberate preparation of Na3CuS2·12(H2O) were prepared with sodium hydroxide (Th. Geyer GmbH, Renningen, Germany, 98.8% analytical grade) and sodium sulfide hydrate (Carl Roth GmbH, Karlsruhe, Germany, 60% Na2S content).
For single-crystal X-ray diffraction analyses, crystals were selected under an inert oil and mounted on a glass capillary (which was coated with silicone grease). Diffraction data were collected on a Stoe IPDS-2/2T diffractometer (STOE, Darmstadt, Germany) using Mo Kα radiation. Data integration was performed with the STOE software XArea (version 2.3). The structures were solved using SHELXT-2018/2 and refined with the full-matrix least-squares methods of F2 against all reflections with SHELXL-2019/3 [10,11,12]. All non-hydrogen atoms were anisotropically refined, and hydrogen atoms were located as residual electron density peaks and were refined without restraints. For details of data collection and refinement see Appendix A, Table A1. Graphics of the molecular structures were generated with ORTEP-3 [13,14] and POV-Ray 3.7 [15]. CSD 2447939 (entry 1), 2447941 (entry 2), and 2447940 (entry 3) contain the supplementary crystal data for this article. These data can be obtained free of charge from the Cambridge Crystallographic Data Centre via https://www.ccdc.cam.ac.uk/structures/ (accessed on 30 April 2025).
Single point Raman spectra in the range of 100–3800 cm−1 were measured at room temperature using a confocal Raman microscope (XploRA™ Plus, Horiba Jobin Yvon SAS, Villeneuve d’Ascq, Département Nord, France) with an excitation wavelength of 532 nm (P = 10 mW). For each measurement, an average spectrum was obtained from ten individual 10 s scans, collected by directing the laser beam through the outer wall of a glass vial containing the crystals using a 10× objective in backscattering geometry. The spectral resolution was approximately 1.4 cm−1, achieved with a 1800 grooves/mm grating. Signal detection was carried out using a CCD detector (Syncerity OE, Horiba France SAS, Paris, France), cooled by the Peltier effect to −60.1 °C. Prior to measurement, external calibration was performed using a silicon standard (520.5 cm−1). Data collection and export were performed using LabSpec6 (Version 6.5.2.11) [16], and graphics were generated with Origin(Pro) (Version 2019b) [17]. Apart from offsetting the y-axis for clarity, no data manipulation was applied to the individual spectra. For a stack plot for direct comparison, the spectra were normalized to the intensity at 184 cm⁻1, and the y-axes were offset to improve clarity.

2.2. Leaching Experiments

The alkaline sodium sulfide solution for leaching (2.5 M NaOH/2.0 M Na2S·3(H2O)) was prepared by dissolving 100 g of sodium hydroxide (titer factor: 1.075) into 0.6 L of deionized water. The resulting sodium hydroxide solution was made up to 1 L with deionized water. This prepared sodium hydroxide solution was subsequently used to dissolve the weighed mass of sodium sulfide trihydrate to obtain a solution of 2 M of sodium sulfide trihydrate at 80 °C or 90 °C inside a drying cabin for the leaching tests, as previously described in the Copper 2022 conference paper [18]. These solutions were used for the investigation of leaching with different Chilean copper concentrates. The sample used herein was a weathered sample, which contained chalcopyrite, enargite, tennantite, and chalcanthite as the Cu-containing constituents in addition to greater amounts of pyrite and melanterite. The concentrate was prepared for initial analysis and leaching experiments by sieving and grinding (vibratory disk mill), passing through a 315 µm sieve (the sieve tower consisted of five sieves of 1 mm, 500 µm, 315 µm, 100 µm, and 63 µm; for leaching the combined fractions that had passed through the, ≤ 315 µm sieves were used). In the sieving procedure, 20 rubber balls were used in the steps from 1 mm to 500 µm and from 500 µm to 315 µm for the soft deagglomeration of the concentrate feed to prevent reagglomeration due to inner wetness.
The grinding was performed during each turn by vibration swing grinding (Haver) and by vibration sieving (Haver EML). The standard analysis sieves (d = 400 mm) for the vibration sieves were made of stainless steel, whereby each sieving turn was run for 5 min at amplitude 5. The upper limit of the 315 µm sieve threshold for the concentrate was chosen due to the measuring limit of the particle size measuring system.
The results from the leaching experiment of the concentrate are shown in Table 1. The leaching test was conducted in a 400 mL double-walled glass vessel connected to an external thermostat. Solid–liquid mixing was ensured by a Teflon stirrer driven by an overhead motor. The vessel lid featured a port for inserting the CrNi temperature sensor or the pH electrode. The total volume for all experiments was set to 200 mL. For the monitoring of the leaching progress, a 3 mL sample was taken every hour, transferred to a 5 mL centrifuge tube, and centrifuged at 3000 rpm for 1 min for solid–liquid separation. The arsenic leaching yield was based on the analytical determination of residual arsenic concentration with the digestion of 0.5 g of the solid in aqua regia and the AAS measurement of the diluted aqua regia solution filled up to 50 mL with deionized water.
The copper concentrate for leaching was treated with alkaline sulfide solution for 4 h at 80 °C. Afterwards, the residues were separated from the solution by centrifugation and washed with water. After the leaching experiment, the double-wall glass vessel was decoupled from the external thermostat, and the stirring unit and lid were lifted up and cleaned. In the course of ca. 30–40 min, the suspension consisting of the alkaline sulfide solution and the leaching residue was allowed to cool down from the reaction temperature to the temperature range of 30–40 °C to ensure a safe transfer of the suspensions to the 250 mL centrifugation bottles (PP plastic bottles) by a 50 mL syringe and 10 mL pipettes. At the time of centrifugation, the sample had attained room temperature, and the centrifuge temperature program was set at 21 °C using a cooling table centrifuge (type 5910 RI, Eppendorf, Hamburg, Germany).
Within ca. 1 h, the centrifugation procedure was carried out in four consecutive stages: In the first step (at 3000 rpm for 10 min), the sulfide leaching solution was separated from the leaching residues for the analytical determination of the content of the solution by AAS. Afterwards, the leaching residues were washed with deionized water (two cycles of washing with 200 mL of deionized water (SERAL-water systems) followed by centrifugation at 3000 rpm for 10 min; in a third cycle, centrifugation was carried out for 30 min at 3500 rpm) to eventually obtain sulfide-free washing solutions. Upon the removal of the supernatants (which were discarded into sulfide-containing residues), the leaching residues were dried in the PP bottle with an open lid inside a drying box at 60 °C. After 24 h in the drying cabin, the solid residues were used for analytical determination.
The solution was analyzed by AAS. Differences in arsenic content were related to the norming conditions of the two different analytical methods. Upon storage at room temperature, some crystalline solid formed in the leaching solution (mainly sodium sulfide nonahydrate, as identified by determination and comparison of the unit cell parameters [9]). By crystal picking, some crystals of Na3CuS2·12(H2O) were detected in small amounts.

2.3. Deliberate Preparation of Crystals of Na3CuS2·12(H2O)

Batch 1: A total of 80 mL of an NaOH/Na2S stock solution was prepared from NaOH (8.60 g), Na2S·3(H2O) (21.13 g), and 79.0 g of water. Two test tubes were charged with this solution (10 mL each), whereupon some solid Cu2O was added to the test tubes (10 mg and 25 mg, samples A and B, respectively). In both cases, a black precipitate formed immediately, and upon stirring at room temperature (using a glass rod), the precipitate did not dissolve. The tubes were sealed with glass stoppers and stored at room temperature. In the course of two days, colorless plates of Na3CuS2·12(H2O) formed spontaneously at the bottom of sample B (inside the black precipitate). Even though crystallization did not commence in sample A upon further storage for one week, the addition of a tiny seed crystal from sample B also initiated the formation of some crystals of the target product in sample A. The crystals obtained from sample B contained spots of black impurities as they grew inside the precipitate, but the edges of the crystals were clear and equipped with crystal faces that indicated a trigonal or hexagonal crystal structure. A piece of such a crystal was used for the X-ray diffraction analysis listed in Appendix A, Table A1, entry 2.
Batch 2: A test tube was charged with a solution prepared from NaOH (1.15 g), Na2S·3(H2O) (2.00 g), and 5.55 g of water. At room temperature, Cu2O was added to the solution in small portions of some milligrams, and upon stirring with a glass rod, the black precipitate, which had formed immediately upon addition, dissolved. The addition of Cu2O was stopped when the copper sulfide precipitate did not dissolve completely any longer, which was achieved upon the addition of 13 mg of Cu2O in total. The test tube was sealed with a glass stopper, and the almost clear and colorless solution obtained was stored at room temperature. In the course of two hours, bunches of thin colorless crystalline plates formed at the bottom of the sample tube. Single-crystal X-ray diffraction analysis then confirmed the formation of Na3CuS2·12(H2O), but the different crystal shape (no sharp edges and faces), the slightly different unit cell parameters, and the results of structure refinement indicated faults in this structure (cf. Table A1, entry 3). Upon further storage at room temperature, large amounts of crystals of Na2S·9(H2O) formed in the test tube. They did not dissolve upon slight warming (to ca. 35 °C) for some minutes. Upon the further storage of the contents at room temperature for one week, well-shaped colorless hexagonal plates and prisms formed on the wall of the test tube above the level of the Na2S·9(H2O) blocks. Single-crystal X-ray diffraction analysis then confirmed their identity as a well-crystallized version of Na3CuS2·12(H2O). With the aid of a spatula, a sample of those crystals and some of the supernatant were transferred into a small sample vial for Raman spectroscopic analysis. The crystals could be stored in the presence of the mother liquor. Any attempts at isolating crystals of Na3CuS2·12(H2O) as a pure compound for further analyses failed. When removed from the mother liquor and dried with a thin strip of filter paper (on a Petri dish on a microscope), the crystals started to turn dark in the course of some minutes. Immediate transfer of the crystals into a sample tube followed by evacuating and setting the sample under an inert atmosphere (dry argon) resulted in immediate decomposition to a black solid. Finally, the whole sample in the test tube was stored in a warm water bath at 45 °C with gentle shaking to eventually dissolve the solid Na2S·9(H2O). Colorless crystals of Na3CuS2·12(H2O) remained, which were filtered off with suction and immediately washed with ethanol. The latter caused a dark brown discoloration of the crystal surface. Yield: 20 mg. Upon transferring the isolated and washed crystals into a sample vial, followed by evacuating and setting under dry argon, the crystals turned black immediately.

3. Results and Discussion

3.1. Preparation of Crystals of Na3CuS2·12(H2O)

The discovery of small crystals of Na3CuS2·12(H2O) in a leaching solution, which aimed at extracting thioarsenates from enargite, gave a first indication that this salt could, in principle, be prepared in alkaline sodium sulfide solution from a suitable Cu(I) source. As the extractive decomposition of enargite (Cu3AsS4) and other copper-containing minerals with the formation of soluble thioarsenates and copper-rich sulfides may provide very fine copper(I) sulfide, the in situ preparation of Cu2S from Cu2O was chosen in order to also start with a fine powder of Cu2S and to avoid the introduction of further anions in this deliberate preparation. In a test which mimicked the leaching conditions, a small amount of Cu2O was added to a 2.5 M NaOH/2.0 M Na2S·3(H2O) solution in a test tube, and the immediate formation of a black precipitate (Cu2S) occurred. Upon the storage of this batch at room temperature, some large colorless plates formed at the bottom of the test tube. X-ray diffraction analysis (cf. Section 3.2 and Appendix A, Table A1, entry 2) confirmed the identity of these colorless crystals as the target compound, Na3CuS2·12(H2O). Resulting from the crystal growth inside the Cu2S precipitate, these colorless plates contained inclusions of black particles, and prolonged storage of the batch at room temperature did not lead to the full conversion of Cu2S into the target compound.
In order to start the preparation from a clear solution of Cu(I) sulfidic species, Cu2O was added to a more concentrated NaOH/Na2S solution in a test tube. Upon the initial formation of a black precipitate, a clear solution was obtained upon brief stirring at room temperature, and a small amount of colorless crystals formed at the bottom of the test tube upon standing at room temperature over the course of some hours. X-ray diffraction analysis (cf. Section 3.2 and Appendix A, Table A1, entry 3) of these crystals basically confirmed the identity of these colorless crystals as the target compound, Na3CuS2·12(H2O). In the course of prolonged storage at room temperature, large amounts of Na2S·9(H2O) formed in the test tube, which inhibited the isolation of the colorless crystals of the target compound. In an attempt at dissolving the crystals by heating (for recrystallization), complete dissolution was achieved, followed by the formation of a black precipitate upon further heating. The precipitate re-dissolved upon stirring as the solution had attained room temperature.
In a final attempt which basically repeated the previous procedure, upon the initial crystallization of Na3CuS2·12(H2O) followed by the crystallization of Na2S hydrates, the latter were dissolved in part by gentle warming, whereupon the batch was allowed to rest at room temperature for some days. In the course of storage, well-shaped crystals of Na3CuS2·12(H2O) formed at the walls of the test tube above the crystalline blocks of Na2S hydrates, which eventually allowed for the manual extraction of some of those crystals with a spatula. Their crystallographic analysis (not included in Table A1) confirmed a similar quality as in case of entry 2 in Table A1. The crystals were stable when stored under the original supernatant, but they decomposed (turned black) when exposed to air. Therefore, crystal preparation for X-ray diffraction analysis (for Section 3.2, preparation of crystals surrounded by a thin film of mother liquor under an inert oil) as well as Raman spectroscopic analysis of the crystals inside a sample vial in the presence of supernatant (Section 3.3) was possible. Removal of the film of mother liquor with, e.g., some filter paper resulted in the immediate dark discoloration of the crystals. Even without access to air, upon placing some crystals in a sample vial, drying in vacuum, and storing them under an inert atmosphere of dry argon, the crystals turned black. Thus, the procedure of drying itself, which may have initiated the loss of water of crystallization, can be regarded as the crucial step toward decomposition.

3.2. Crystallographic Analysis of Na3CuS2·12(H2O)

The compound Na3CuS2·12(H2O) crystallizes in the trigonal space group type R 3 ¯ c. Upon the initial structure determination from a small crystalline piece that had formed in a leaching solution (cf. Appendix A, Table A1, entry 1), the attempts at the deliberate synthesis of this compound gave access to different crystals of essentially the same compound. From solutions which corresponded to the Na2S/NaOH concentration levels of the leaching solutions, individual plates or prisms with well-shaped faces and trigonal or hexagonal appearance were obtained. Their size allowed for data collection at higher diffraction angles and the determination of this structure at an enhanced quality (Table A1, entry 2). Therefore, the data of the structure of entry 2 will be used for the discussion of molecular features. From more concentrated solutions, which allowed for the enhanced solubility of Cu2S, clusters of thin irregular plates were obtained, the individual plates of which had a fish scale-like appearance without any characteristic edges, faces, and angles. Nonetheless, these crystals gave rise to similar diffraction data (single-crystal diffraction patterns, related unit cell dimensions), which allowed for structure refinement in the same space group type (Table A1, entry 3). Comparison of entries 2 and 3 in Table A1 (both data sets were collected at 160 K) revealed that the latter crystals exhibited a significantly shortened c axis (by 0.10 Å, which corresponded to a shortening of 0.26%). The temperature-dependent determination of the unit cell parameters of another crystal, which corresponded to the structure of entry 2 (Table A2) showed that even a variation in temperature in the range of 240–120 K merely caused a shortening of the c axis by 0.18%, and even at 120 K the c axis was still noticeably longer than the length of the c axis found with the crystal of entry 3. Moreover, structure refinement for entry 3 resulted in a structure of markedly lower quality (according to R-values). These features, in combination with the highest residual electron density peaks (they are aligned in the (0 0 1) direction on the same axis with Na, S, and Cu atoms and thus may indicate ghost peaks from the heavy atoms), indicated the stacking faults of this structure. Even though we did not observe any noticeable streaking in the diffraction pattern as an additional sign of stacking faults, some reflections of systematic absences were observed with significant intensity, thus indicating some kind of twinning (e.g., contributions of local primitive hexagonal lattice types of similar unit cell dimensions). Problems like these were also encountered with a silyl derivative of nitrilotris (methylenephenylphosphinic) acid [19].
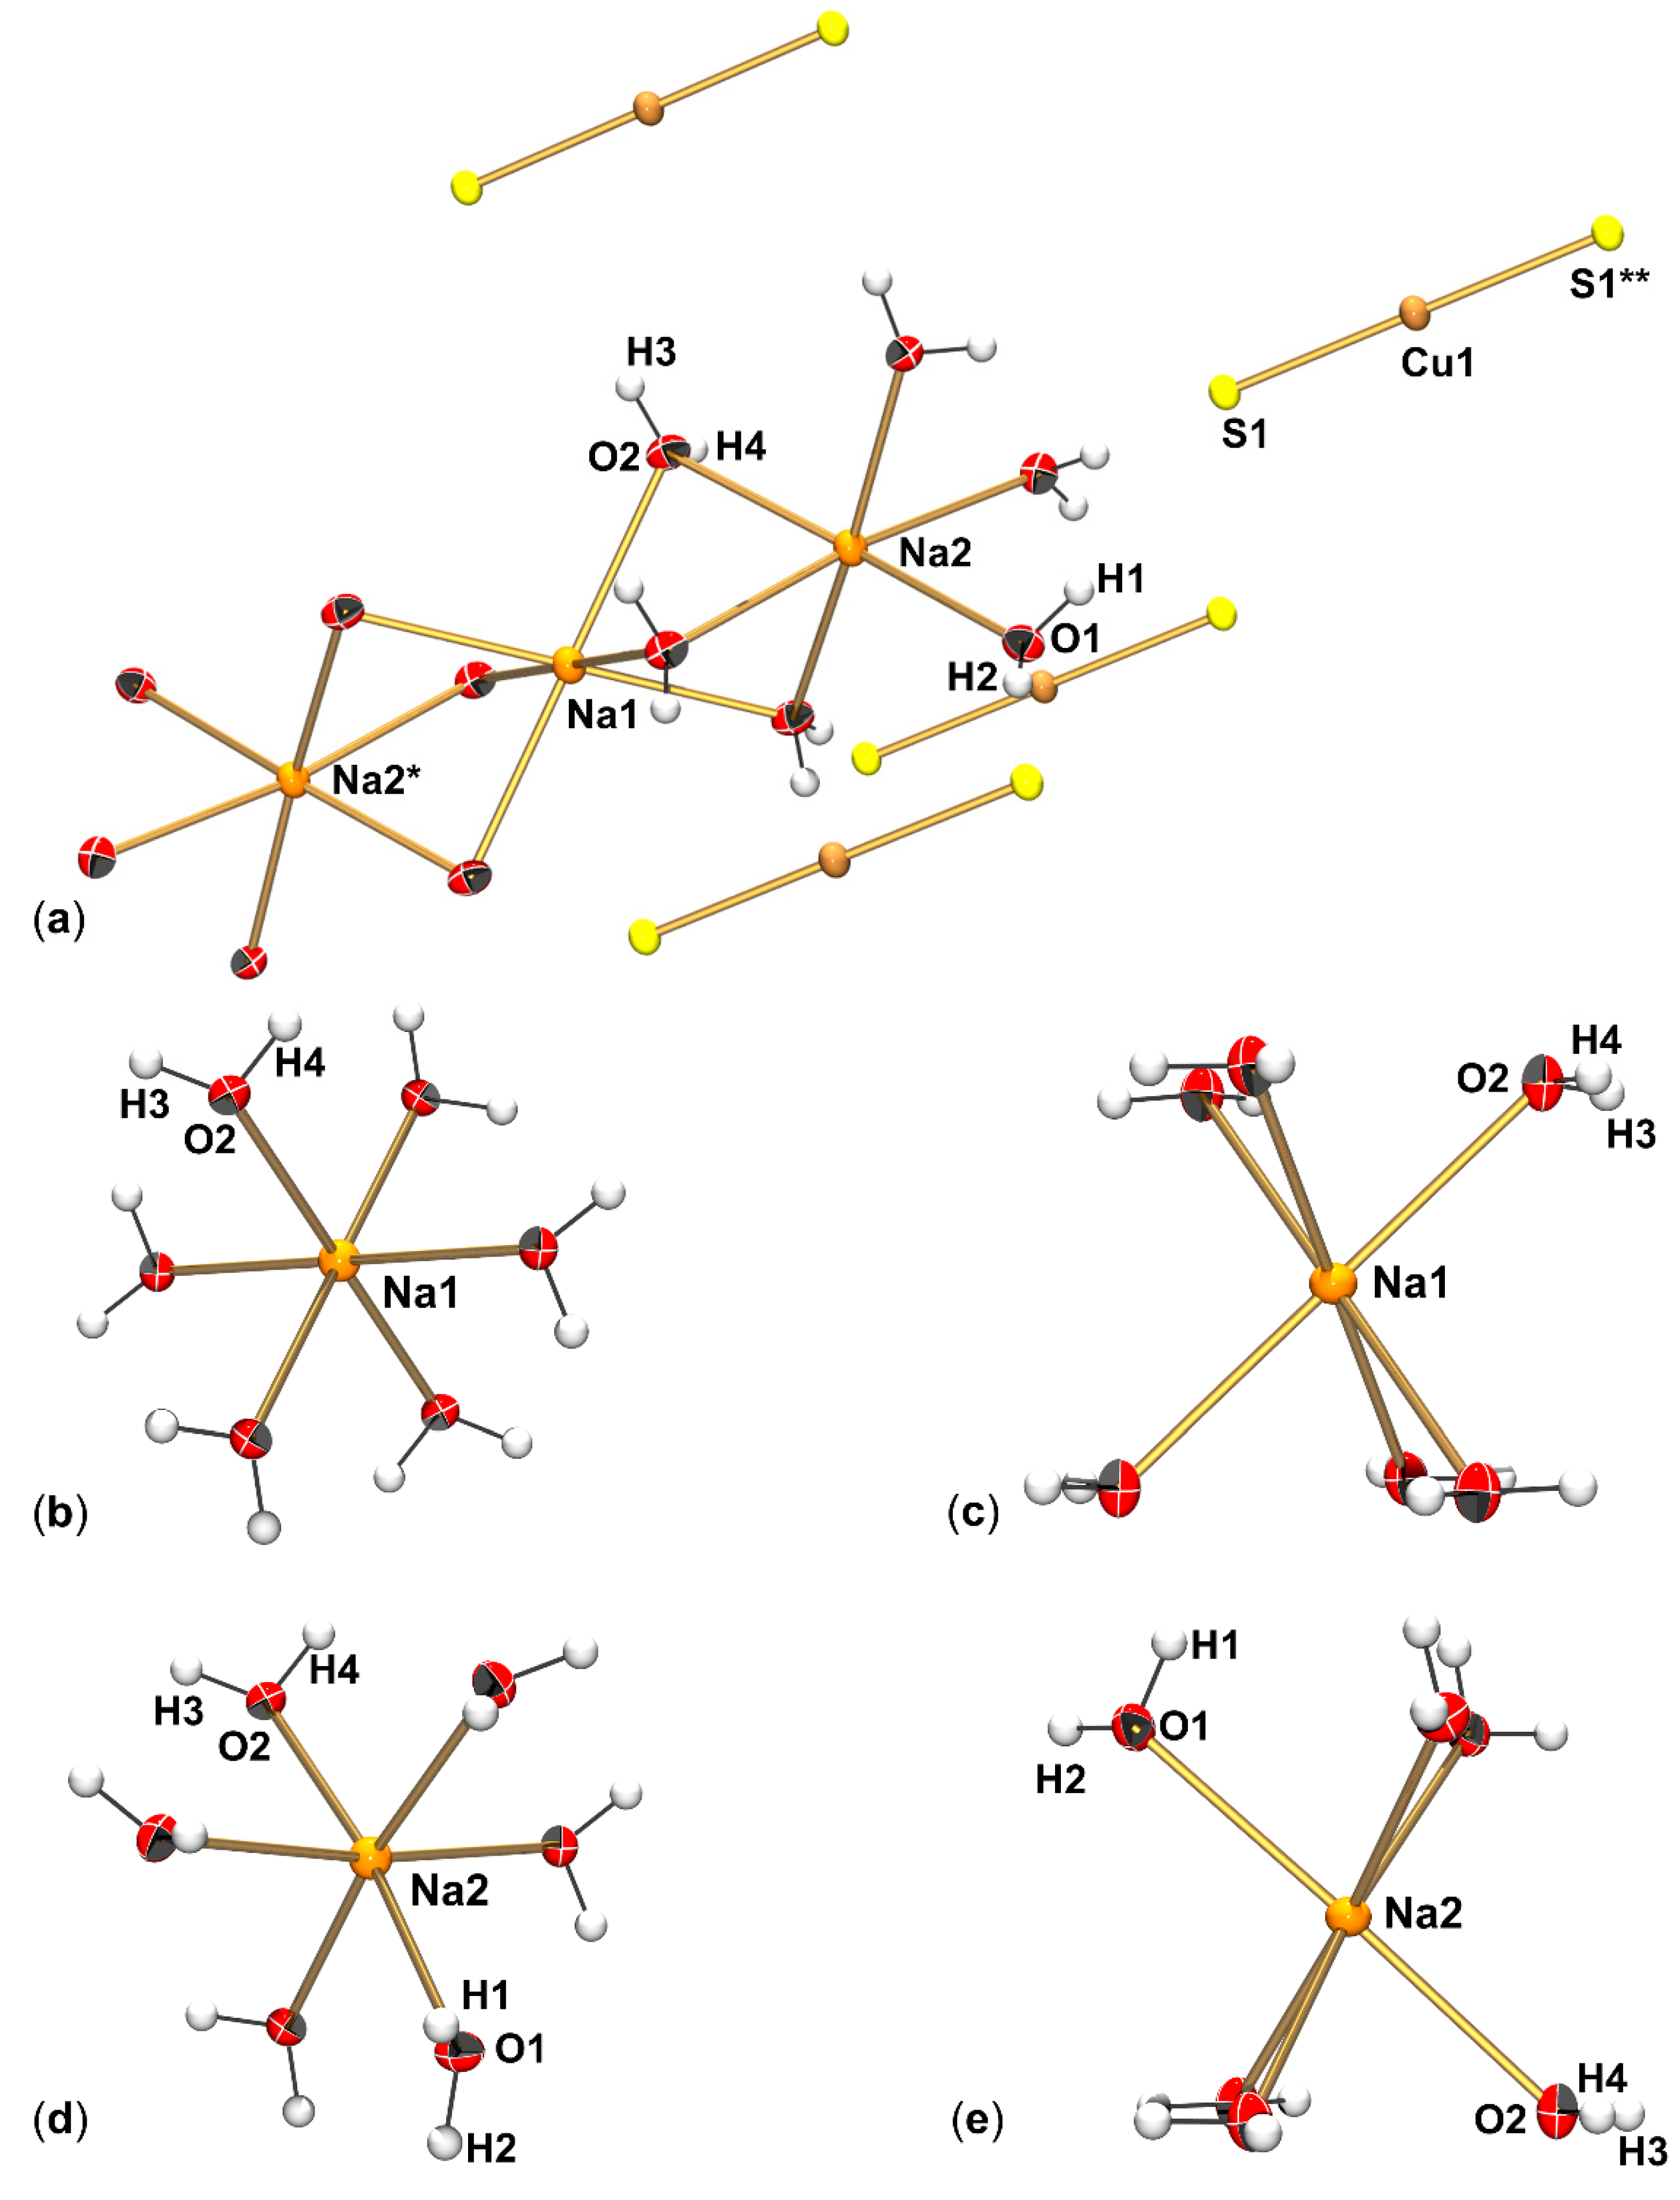
The asymmetric unit of the crystals of compound Na3CuS2·12(H2O) comprises the atomic sites which are labeled without asterisks (*) in Figure 2a. The two crystallographically independent H2O molecules have full site occupancy, whereas the atoms on special positions have partial site occupancy in the asymmetric unit (Na1, Na2, S1, and Cu1 with 1/6, 1/3, 1/3, and 1/6, respectively). The molecular moieties, which eventually constitute the crystal, are the cation [Na3(H2O)12]3+ and the anion [CuS2]3−. The former features three hexacoordinate Na ions in rather distorted octahedral coordination spheres, which form a column of three face-sharing octahedra (cf. Figure 2b–e).
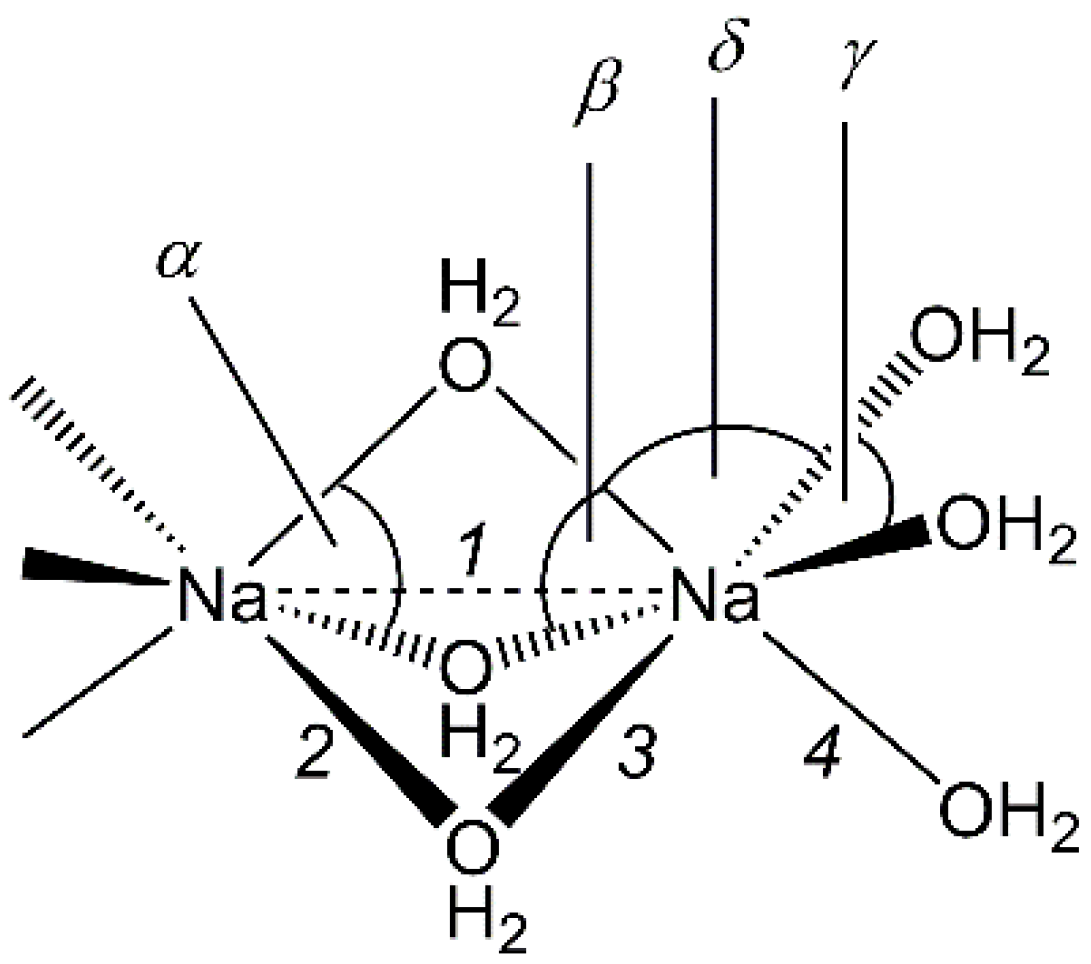
This type of cation has been reported with other salts of tri-anions that crystallize in a related manner (i.e., with the formation of columns of alternating cat- and anions along the crystallographic c axis of a trigonal lattice). For insights into the flexibility of the Na coordination spheres of this kind of cation, selected data on the structures of Na3CuS2·12(H2O) (cf. entry 2 in Table A1), Na3SPO3·12(H2O) [20], and Na3TlCl6·12(H2O) [21] are collated in Table 2 and Figure 3. As both reference structures featured severe disorders (in Na3TlCl6·12(H2O), both the anion and the terminal H2O sites of the cation were disordered by space group symmetry; in Na3SPO3·12(H2O), the anion was disordered by symmetry), we limited the discussion of the distortion of [Na3(H2O)12]3+ to the most striking difference: Whereas in Na3TlCl6·12(H2O) and Na3SPO3·12(H2O), the O-Na-O angles between the terminal H2O molecules (γ) were close to 90 deg., the corresponding angle in Na3CuS2·12(H2O) was markedly smaller (81 deg.). This deformation could be attributed to the O–H···X (X = Cl, S, O) hydrogen bonds formed with the respective tri-anion. Whereas in Na3CuS2·12(H2O), the H-bond acceptor sites (S) are located on the same axis as the Na atoms of the tri-cation, the other two anions ([TlCl6]3− and [SPO3]3−) featured H-bond acceptor sites (Cl and O, respectively) out of that axis. Moreover, the H-bonding to the anions perpendicular to the trigonal axis required different torsion of the opposing octahedral faces Na(OH2terminal)3 and Na(OH2bridging)3, which was reflected by the difference ∆δ within the individual pairs of H2Obridging-Na-OH2terminal angles (δ).
In sharp contrast to the tri-cation [Na3(H2O)12]3+, the anion of this structure represented a novelty. To our knowledge, this was the first crystallographic evidence of the anion [CuS2]3−. As far as related motifs are concerned, in the structure of jalpaite (Ag3CuS2) [22], an atomic ensemble with linear S-Cu-S arrangement and a two-coordinate central Cu atom has been reported (it can be regarded as a [CuS2]3− ion), but each of its S atoms is bound to three silver atoms as nearest neighbors (at Ag–S distances of 2.53, 2.55, 2.55 Å), thus furnishing a polymetallic sulfide cluster rather than a salt of a genuine [CuS2]3− ion. Resulting therefrom, the Cu–S bond length at the two-coordinate Cu(I) in jalpaite (2.1822(2) Å) is markedly longer than the Cu–S bond in Na3CuS2·12(H2O) (2.1188(2) Å). The latter is also shorter than the Cu–S bonds in di(thiolato)cuprate(I) salts such as [Et4N][Cu(StBu)2] (2.1380(7)–2.1434(6) Å, [23]) and [Ph4P][Cu(SSiMe3)2] (2.1412(6), 2.1475(6) Å, [24]). In these cases, the longer Cu–S bonds can be attributed to the higher coordination number of the S atom (2 instead of 1). Moreover, higher coordination numbers at Cu(I) give rise to further Cu–S bond lengthening, for example, with tri-coordinate copper in [HN(CH2CH2)3NH][Cu(SCN)3] (2.2304(7) Å, [25]) and [Et4N]2[Cu(SPh)3] (2.239(2)–2.258(2) Å, [26]) and with tetracoordinate copper in enargite Cu3AsS4 (2.291(3)–2.352(3) Å, [27]).
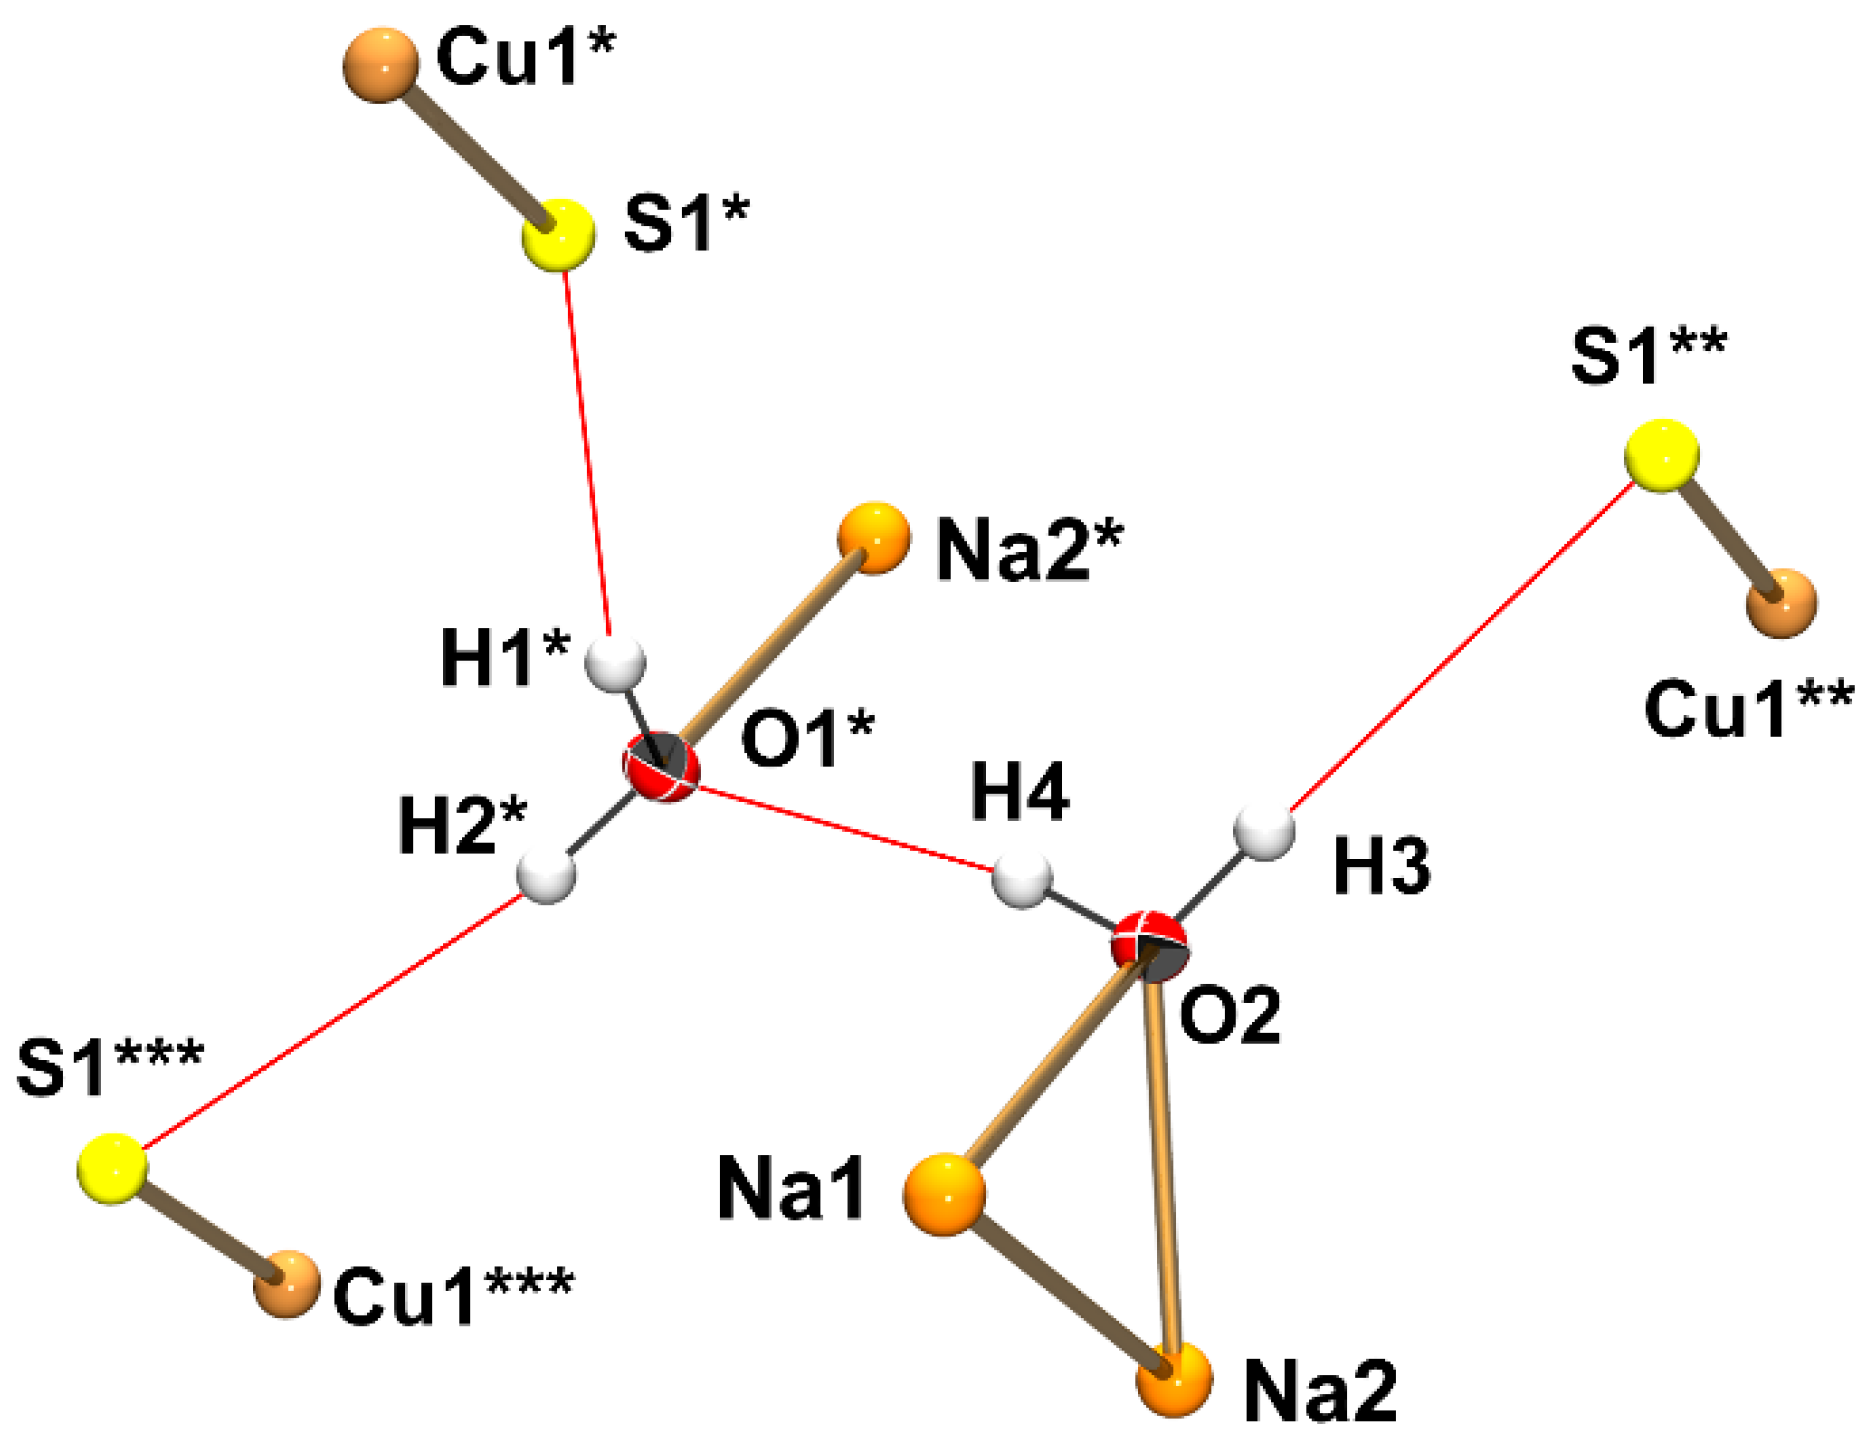
Even though the S atoms of the [CuS2]3− anion in Na3CuS2·12(H2O) do not carry any further substituents but the Cu atom, the Cu–S bond length of 2.1188(2) Å is still influenced by further interactions in the crystal structure, i.e., a cage of 9 O–H···S hydrogen bonds about each of the S atoms. This large number of hydrogen bonds about a single sulfidic S atom is not unusual. For comparison, the S atom in Na2S·5(H2O) is surrounded by ten O–H···S hydrogen bonds in addition to the S-bound cation [28]. In the structure of Na3CuS2·12(H2O), the O–H···S hydrogen bonds (O···S distances 3.218(1), 3.370(1), and 3.462(1) Å for O1–H1···S1, O1–H2···S1#1, and O2–H3···S1#2, respectively, with symmetry operations #1: −x + 1, −y, −z + 1 and #2: −y + 2/3, −x + 4/3, z−1/6) are formed by symmetry equivalents of H1, H2, and H3, whereas H4 and its symmetry equivalents are involved in O–H···O hydrogen bonding between adjacent [Na3(H2O)12]3+ ions (O···O distance 2.813(1) Å for O2–H4···O1#3, with symmetry operation #3: −x + 5/3, −x + y + 4/3, −z + 5/6). Figure 4 shows the four different hydrogen bonds in this structure using the single O–H···O hydrogen bond as the central motif.
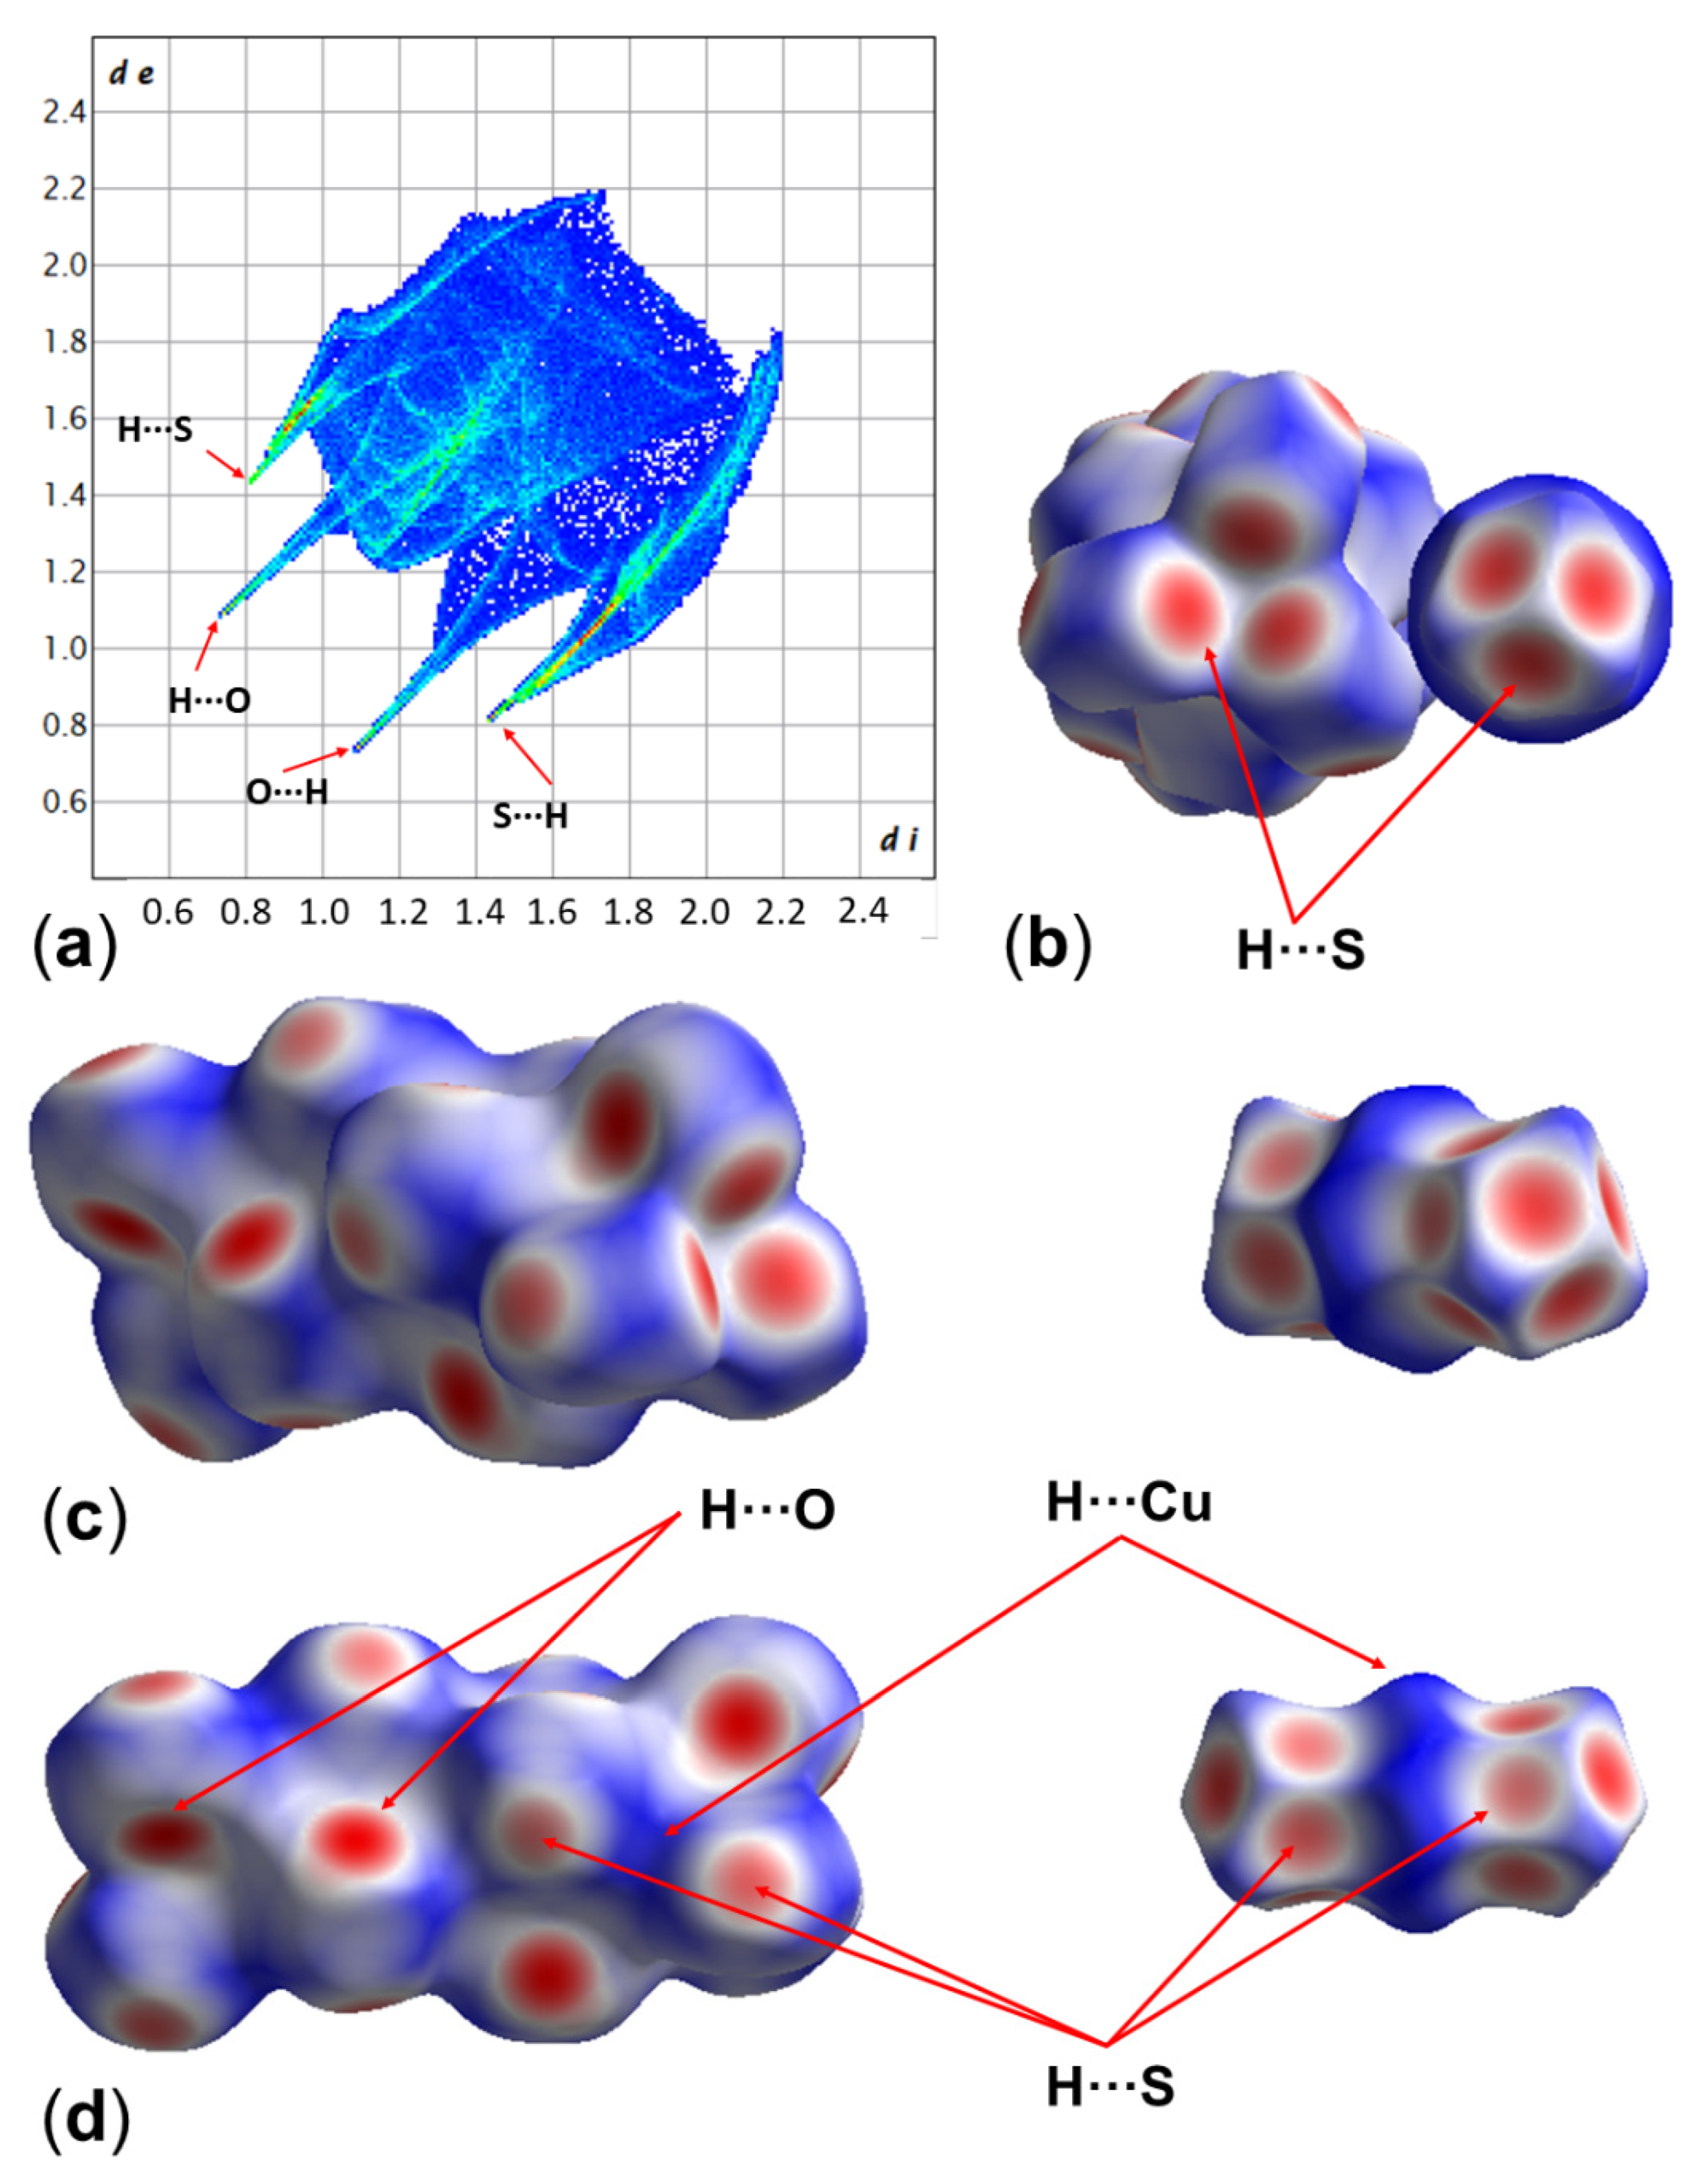
The role of H-bonding and the density of H-bonds about the [CuS2]3− anion are particularly visible in the results of a Hirshfeld surface analysis (Figure 5). This analysis was performed using the crystal structure associated with entry 2 in Table A1. (For comparison, a Hirshfeld surface analysis was performed on a structure refined against the same data set but with O–H bond lengths restrained to 0.98 Å, a more reasonable value in terms of O–H bond lengths determined by neutron diffraction [29]. Corresponding results from this comparison analysis are given as italicized numbers or italicized remarks in parentheses. They convey essentially the same picture.) In addition to the highly attractive interactions of the O–H···S and O–H···O hydrogen bonds, which sum up to 23.6% (23.6%) and 15.8% (16.5%), respectively, the remaining fraction of the Hirshfeld surface is connected with rather remote contacts of Cu···H (10.3% (10.5%), especially the blue equatorial “belt” around the anion and corresponding patches on the cation surface) and H···H (49.8% (48.7%), most of the blue areas on the surface of the cation).

3.3. Raman Spectroscopic Analysis of Na3CuS2·12(H2O)

As the crystals of Na3CuS2·12(H2O) decomposed upon their removal from the mother liquor, a sample of crystals with some drops of supernatant was filled into a small glass vial. For Raman measurements, the vial was held horizontally and the crystals were allowed to settle, whereupon the vial was turned 180 deg. about its axis to expose some crystals on the upper side of the vial which adhered to the glass wall in individual positions. The shape of the crystals (hexagonal plates or prisms) allowed for the visual identification of the positioning of the incident laser beam in the approximate (0 0 1) direction or perpendicular to this axis. Figure 6a–c give an impression of the positioning of three crystals used for three individual Raman measurements. Whereas in the case of positioning (c), the incident beam was directed along the trigonal axis, positionings (a) and (b) allowed for measurements in a rather perpendicular direction.
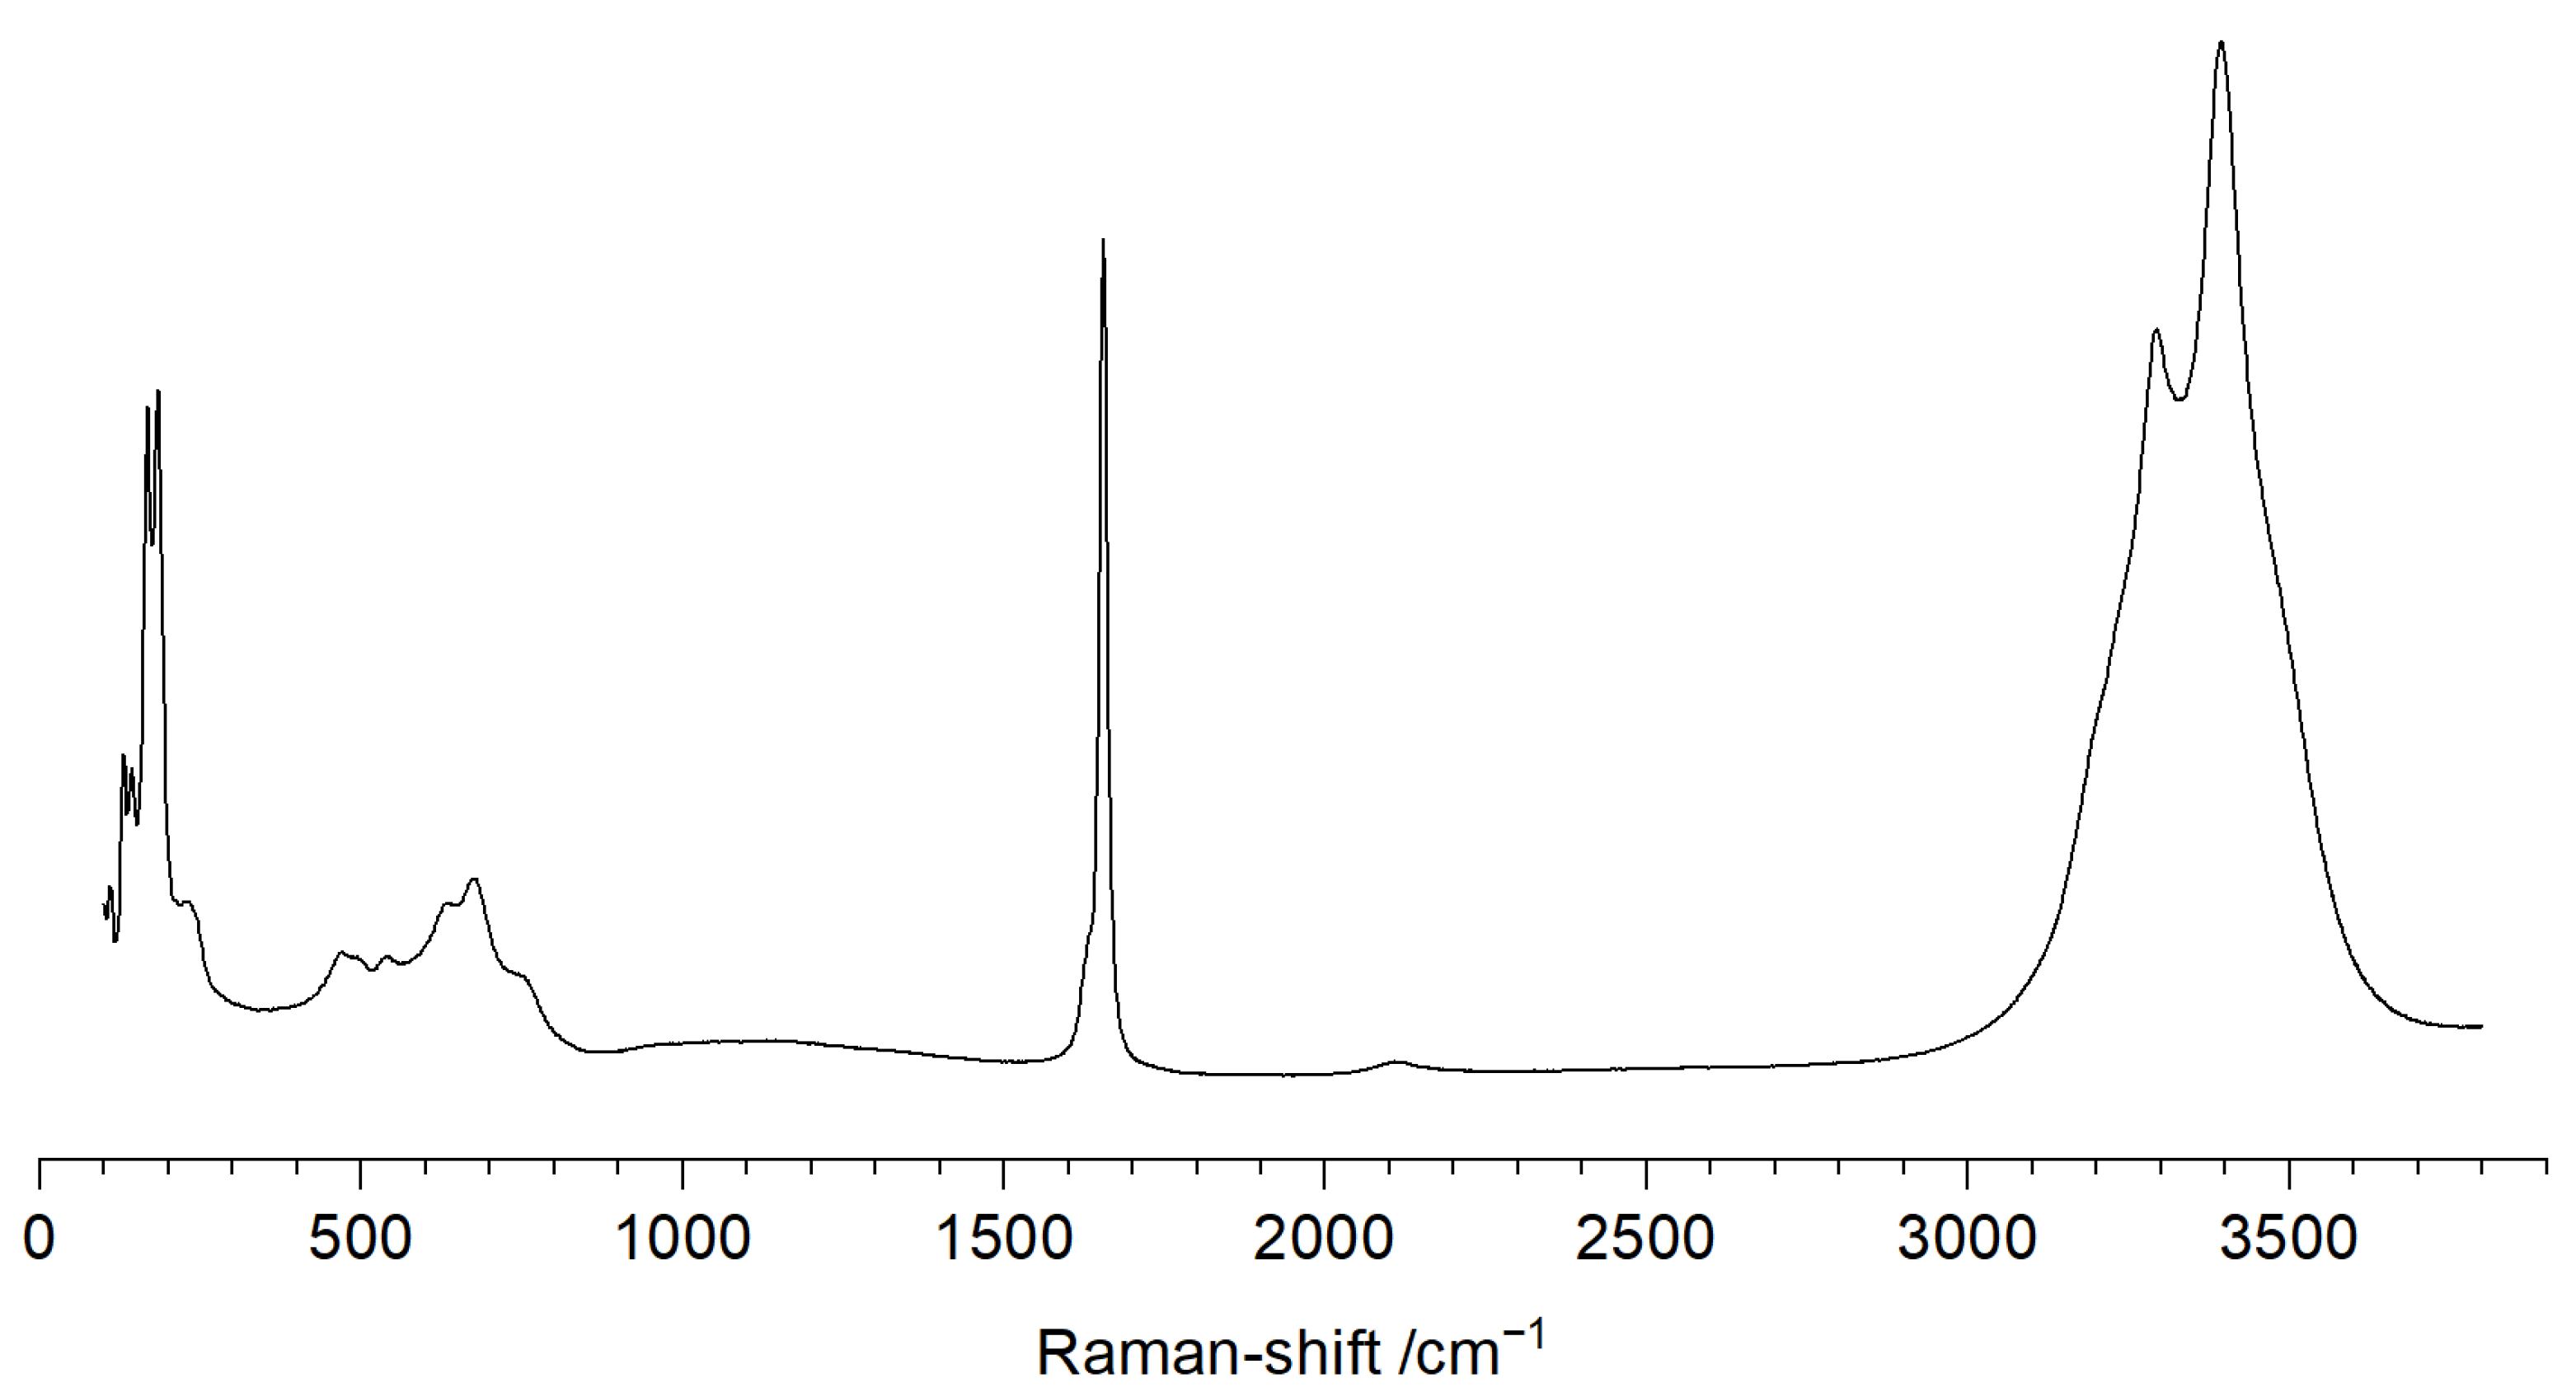
Figure 7 shows the full Raman spectrum recorded with the crystal positioning shown in Figure 6 a as a representative example. (The corresponding spectra for (b) and (c) are contained in the Supplementary Material.) The spectrum is dominated by strong bands of O–H stretch modes in the range of wavenumbers 3100–3500 cm−1 (in this spectrum, two maxima are found at 3293 and 3393 cm−1), and the sharp band around 1655 cm−1 can be assigned to H–O–H deformation modes, which are expected features because of the cation [Na3(H2O)12]3+. The range of lower wavenumbers features two distinct types of bands, i.e., sharp bands (in the range 100–200 cm−1) and broad bands (in the range 400–900 cm−1 as well as a shoulder at ca. 230 cm−1), which can be assigned to lattice vibrational modes and modes of the [CuS2]3− anion, respectively. As to the latter, the isolated linear anion [CuS2]3− has point group symmetry Dh (like CO2) and should thus give rise to Raman bands that correspond to the A1g, E1g, and E2g modes. The positioning of the anion in the crystal may give rise to further splitting of the bands.
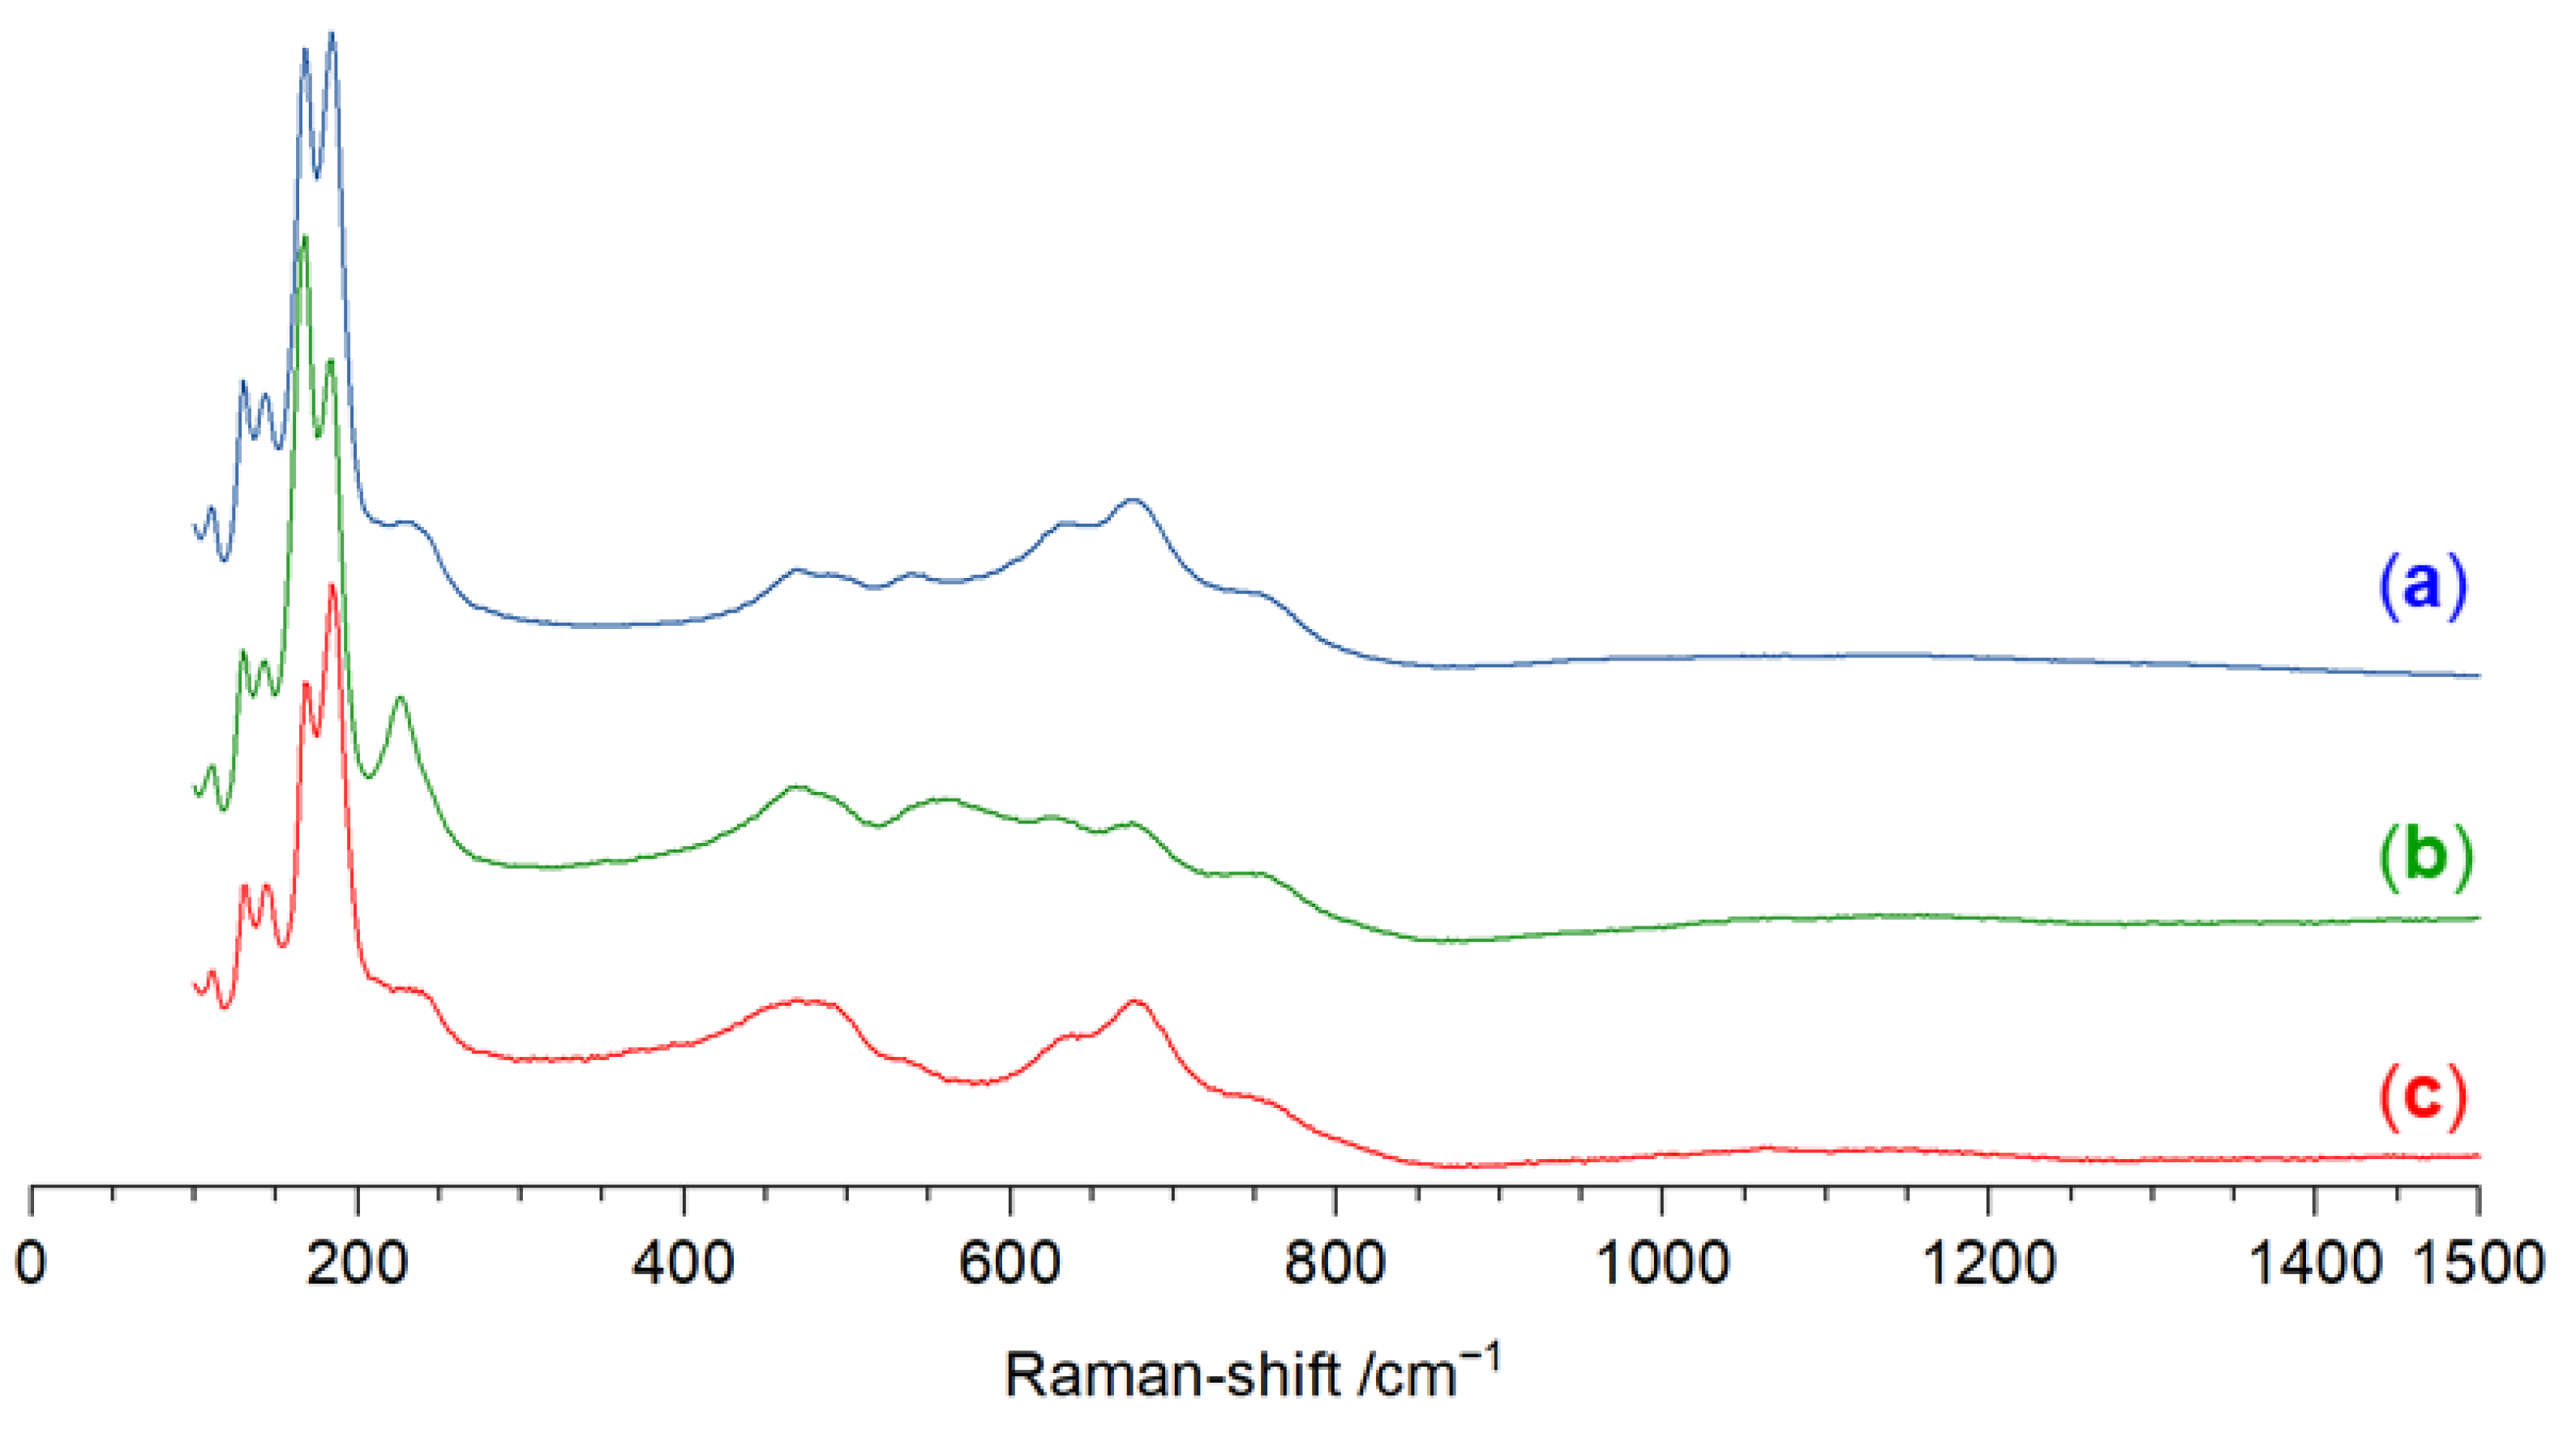
Figure 8 shows the lower wavenumber section of the spectra recorded from the three different crystal orientations shown in Figure 6. The direction-dependent relative susceptibility of the individual modes was in accordance with the axial symmetry of the crystal structure. (Direction-dependent Raman spectroscopic features have also been reported for other rather simple sulfides, e.g., wurtzite ZnS [31].) As to the overall position in the spectrum, the modes of [CuS2]3− are shifted to markedly higher wavenumbers with respect to bands arising from tetracoordinate Cu(I), like the CuS4 environment in enargite and tennantite, where characteristic bands appear in the range 300–400 cm−1 [32]. This shift to higher wavenumbers reflects the Cu–S bond shortening (or bond strengthening) in [CuS2]3−.

4. Conclusions

The simple dithiocuprate(I) anion, [CuS2]3−, combines both the thiophilicity of the HSAB soft d10 center Cu(I), which is also reflected in the abundance of sulfidic copper minerals such as enargite, and the tendency toward linear coordination, i.e., the formation of d10-ML2 complexes. The latter is well known for gold (e.g., [AuCl(PMe3] [33]), silver (e.g., [Ag(PBn3)2][BF4] [34]), and also for copper (e.g., formation of the anion [CuCl2] and salts thereof such as [NnBu4][CuCl2] [35] and thiolatocuprates such as [Cu(StBu)2] [23]). In this regard, it is rather surprising that the anion [CuS2]3− had not previously been confirmed crystallographically. Now it complements other (anhydrous) sodium thiocuprates(I) such as NaCu5S3 [36], Na2Cu4S3 [37], Na4Cu2S3 [38], and NaCu3S2 [39]. In addition to CuS3-coordination spheres (in NaCu5S3, Na2Cu4S3, and NaCu3S2) and CuS4-coordination spheres (in NaCu3S2), some of them also feature rather linear CuS2 arrangements (NaCu5S3 and Na4Cu2S3), but always complemented by a greater number of further Cu atoms and additional (more remote) S atoms. From the academic perspective, the finding of this simple anion is a novelty in general. Moreover, its initial finding in a product solution of an industry-related ore leaching solution rather than in a batch from a sophisticated laboratory synthesis clearly emphasizes the importance of further exploration of seemingly simple fundamental chemistry. Regarding the importance of the role of [CuS2]3− in alkaline sulfide leaching, attempts at the deliberate preparation of Na3CuS2·12(H2O) have shown that this anion forms from Cu2S and alkaline sulfide solution with dissolution at lower temperatures, whereas heating fosters its decomposition with the precipitation of Cu2S. Thus, the temperature range applied for alkaline sulfidic leaching serves a kinetic purpose to accelerate the leaching of, e.g., arsenic compounds, and also plays a thermodynamic role in suppressing the formation of dithiocuprate(I) in greater amounts. While the formation of oligosulfidic Cu(I) complexes in aqueous solution is well known, e.g., NH4CuS4 [40,41], and their formation can be suppressed by avoiding the prerequisite of a greater excess of sulfur in the alkaline sulfide solution (higher oligosulfide solution), the finding of Na3CuS2·12(H2O) provides new insights into the role of simple sulfide in the competitive dissolution of copper.

Supplementary Materials

The following supporting information can be downloaded at: https://www.mdpi.com/article/10.3390/cryst15060501/s1: Raman spectra of Na3CuS2·12(H2O) recorded from the crystal positionings shown in Figure 6a–c (Figures S1–S3. Raman spectrum of [Na3(H2O)12][CuS2] recorded from the crystal inside a glass vial, positioned as shown in the inset.) and selected views of the unit cell of Na3CuS2·12(H2O) (Figure S4. View along a of the unit cell of [Na3(H2O)12][CuS2]. (Ball-and-stick plot, color code: H white, O red, Na purple, S yellow, Cu brown.); Figure S5. View along a of the unit cell of [Na3(H2O)12][CuS2] with polyhedral view of the [Na3(H2O)12]3+ ions. (Color code: H white, O red, Na purple, S yellow, Cu brown.); Figure S6. View along a* of the unit cell of [Na3(H2O)12][CuS2]. (Ball-and-stick plot, color code: H white, O red, Na purple, S yellow, Cu brown.); Figure S7. View along a* of the unit cell of [Na3(H2O)12][CuS2] with polyhedral view of the [Na3(H2O)12]3+ ions. (Color code: H white, O red, Na purple, S yellow, Cu brown.); Figure S8. View along c of the unit cell of [Na3(H2O)12][CuS2]. (Ball-and-stick plot, color code: H white, O red, Na purple, S yellow, Cu brown.); Figure S9. View along c of the unit cell of [Na3(H2O)12][CuS2] with polyhedral view of the [Na3(H2O)12]3+ ions. (Color code: H white, O red, Na purple, S yellow, Cu brown.)) as well as a comparison of the fingerprint plots (de vs. di) obtained from the comparative Hirshfeld surface analyses performed with refined and with constrained (0.98 Å) O–H bond lengths (Figure S10. Fingerprint plots (de vs. di) of the contacts on the Hirshfeld surface. Plot (a) was obtained from the analysis of the crystal structure associated with entry 2 in Table A1 of the main paper, which was refined without restraints and, owing to refinement of positions of electron density peaks in a structure refinement from X-ray diffraction data, results in erroneous H atom positions (seemingly short O−H bond lengths). Plot (b) was obtained from a model refined against the same data set with O−H bond lengths restrained to 0.98 Å. The latter results in a slightly different fingerprint of the short H···H contacts (highlighted with red circles)).

Author Contributions

Conceptualization, J.W.; funding acquisition, M.S. and A.C.; investigation, J.W., K.M., F.G. and A.T.; writing—original draft preparation, J.W. and K.M.; writing—review and editing, J.W., K.M., F.G., A.T., M.S. and A.C.; visualization, J.W. and F.G.; project administration, K.M., A.T., M.S. and A.C.; supervision, M.S. and A.C. All authors have read and agreed to the published version of the manuscript.

Funding

The authors would like to thank the Federal Ministry of Education and Research (BMBF) for financing this project ReAK (Reduktion von Arsen in Kupferkonzentraten)—(project number: 033R205B).

Institutional Review Board Statement

Not applicable.

Informed Consent Statement

Not applicable.

Data Availability Statement

CSD 2447939 (entry 1), 2447941 (entry 2), and 2447940 (entry 3) contain the supplementary crystal data for this article, which correspond to the structure determinations listed in Table A1. These data can be obtained free of charge from the Cambridge Crystallographic Data Centre via https://www.ccdc.cam.ac.uk/structures/ (accessed on 30 April 2025).

Acknowledgments

The authors are grateful to the former ReAK project partner Wismut GmbH, which delivered the ICP-OES of the displayed solution results (P2A15), obtained during a combined test row for precipitation tests.

Conflicts of Interest

The authors declare no conflicts of interest.

Appendix A

Table A1. Crystallographic data from the data collection and refinement of the structure of Na3CuS2·12(H2O) out of data sets collected from a crystal formed in a leaching solution (entry 1), from a deliberate synthesis from Cu2O in a leaching solution (entry 2), and from a synthesis out of Cu2O in a more concentrated Na2S/NaOH solution (entry 3).
Parameter123
FormulaCu2H48Na6O24S4 1Cu2H48Na6O24S4 1Cu2H48Na6O24S4 1
Mr825.64825.64825.64
T (K)200(2)160(2)160(2)
Λ (Å)0.710730.710730.71073
Crystal size (mm3)0.15 × 0.10 × 0.050.42 × 0.38 × 0.100.35 × 0.30 × 0.08
Crystal systemtrigonaltrigonaltrigonal
Space group R 3 ¯ c R 3 ¯ c R 3 ¯ c
a = b (Å)8.5067(5)8.4801(2)8.4804(2)
C (Å)38.618(4)38.6136(13)38.5146(11)
V3)2420.2(4)2404.76(14)2398.77(13)
Z3 13 13 1
ρcalc (g·cm−1)1.6991.7101.715
μMoKα (mm−1)1.741.741.75
F (000)128412841284
θmax (°), Rint26.0, 0.031035.0, 0.031027.0, 0.0474
Completeness99.8%100%100%
Reflns collected601611,35512,829
Reflns unique5341189590
Reflns [I > 2σ(I)]391970495
Restraints000
Parameters46 246 245 2
GoF1.0211.0741.100
R1, wR2 [I > 2σ(I)]0.0188, 0.03770.0163, 0.03780.0287, 0.0907
R1, wR2 (all data)0.0311, 0.03980.0243, 0.03980.0355, 0.0954
Largest peak/hole (e·Å−3)0.25, −0.230.22, −0.430.90, −0.76
1 The formula and Z reported here are in accordance with the CheckCIF suggested values. In a more chemically reasonable way, the description of CuH24Na3O12S2 (i.e., Na3CuS2·12(H2O) in the form of [Na3(H2O)12][CuS2]), which then corresponds to Z = 6, is used in the discussion. 2 For the structures of entries 1 and 2, the additional parameter corresponds to the extinction parameter refined (0.0032(2) and 0.00094(12), respectively), whereas this parameter refinement is not applicable in case of 3 (in a test it converged to 0.0000(3)).
Table A2. Temperature-dependent unit cell parameters determined from a crystal of Na3CuS2·12(H2O) in the same orientation and with the same set of ω-scans in increments of 1 deg. using an IPDS2T (STOE, Darmstadt, Germany) image plate detector distance of 95 mm, allowing for data collection up to 2θ = 60 deg. (φ-angle, ω-range: 0, 0–10; 0, 40–50; 90, 20–30).
T = 240 (2) K T = 120 (2) K
a = b (Å)8.5046 (7) 8.4672 (7)
∆a (Å) 1 0.0374
∆a % 1 0.44
C (Å)38.665 (4) 38.594 (4)
∆c (Å) 1 0.071
∆c % 1 0.18
V3)2421.9 (4) 2396.2 (4)
∆V3) 1 25.7
∆V % 1 1.01
1 The differences () of the parameters X (X = a, c, and V) are reported as X(T1)–X(T2) for T1 > T2, and the relative differences (%) are reported with reference to the average value of X.

References

  1. Sefarzedeh, M.; Moats, M.; Miller, J.D. Recent Trends in the Processing of Enargite Concentrates. Miner. Process. Extr. Metall. Rev. 2014, 35, 283–367. [Google Scholar] [CrossRef]
  2. Nazari, A.M.; Radzinski, R.; Ghareman, A. Review of arsenic metallurgy: Treatment of arsenical minerals and the immobilization of arsenic. Hydrometallurgy 2014, 174, 258–281. [Google Scholar] [CrossRef]
  3. Charitos, A.; Wrobel, M.; Runkel, M.; Hammerschmidt, J.; Demopoulos, G.P. Partial Roasting Combined with Scorodite Technology for Efficient Arsenic Removal and Stabilization from Cu-Concentrates. In Proceedings of the 63rd Conference of Metallurgists, Halifax, NS, Canada, 18 August 2024. [Google Scholar] [CrossRef]
  4. Brendler, E.; Meiner, K.; Wagler, J.; Thiere, A.; Charitos, A.; Stelter, M. 75As Nuclear Magnetic Resonance Spectroscopic Investigation of the Thioarsenate Speciation in Strongly Alkaline Sulfidic Leaching Solutions. Molecules 2024, 29, 2848. [Google Scholar] [CrossRef] [PubMed]
  5. Gow, R.N.; Young, C.; Huang, H.; Hope, G. Spectroelectrochemistry of enargite III: Alkaline sulfide leaching. Min. Metall. Explor. 2015, 32, 14–21. [Google Scholar] [CrossRef]
  6. Tongamp, W.; Takasaki, Y.; Shibayama, A. Arsenic removal from copper ores and concentrates through alkaline leaching in NaHS media. Hydrometallurgy 2009, 98, 213–218. [Google Scholar] [CrossRef]
  7. Anderson, C.; Dahlgren, E.; Huang, H.; Miranda, P.; Jeffrey, M.; Chandra, I. Fundamentals and Applications of Alkaline Sulfide Leaching and Recovery of Gold. In Proceedings of the 29th IPMI Annual Precious Metals Conference, Westmount, QC, Canada, 10 May 2014. [Google Scholar]
  8. Parada, F.; Jeffrey, M.I.; Asselin, E. Leaching kinetics of enargite in alkaline sodium sulphide solutions. Hydrometallurgy 2014, 146, 48–58. [Google Scholar] [CrossRef]
  9. Bedlivy, D.; Preisinger, A. Die Struktur von Na2S · 9H2O und Na2Se · 9H2O. Z. Kristallogr. 1965, 121, 114–130. [Google Scholar] [CrossRef]
  10. Sheldrick, G.M. SHELXT—Integrated space-group and crystal-structure determination. Acta Crystallogr. Sect. A 2015, 71, 3–8. [Google Scholar] [CrossRef]
  11. Sheldrick, G.M. Program for the Refinement of Crystal Structures, SHELXL-2019/3; University of Göttingen: Göttingen, Germany, 2019. [Google Scholar]
  12. Sheldrick, G.M. A short history of SHELX. Acta Crystallogr. Sect. A 2008, 64, 112–122. [Google Scholar] [CrossRef]
  13. Farrugia, L.J. ORTEP-3 for windows—A version of ORTEP-III with a graphical user interface (GUI). J. Appl. Crystallogr. 1997, 30, 565. [Google Scholar] [CrossRef]
  14. Farrugia, L.J. WinGX and ORTEP for Windows: An update. J. Appl. Crystallogr. 2012, 45, 849–854. [Google Scholar] [CrossRef]
  15. POV-RAY (Version 3.7), Trademark of Persistence of Vision Raytracer Pty. Ltd., Williamstown, Victoria (Australia). Copyright Hallam Oaks Pty. Ltd., 1994–2004. Available online: http://www.povray.org/download/ (accessed on 28 June 2021).
  16. Labspec6 Spectroscopy Suite, Version 6.5.2.11; Horiba France SAS: Paris, France, 2020.
  17. Origin(Pro), Version 2019b; OriginLab Corporation: Northampton, MA, USA, 2019.
  18. Meiner, K.; Khulan, B.; Weigelt, A.; Thiere, A.; Vogt, D.; Stelter, M.; Kassahun, A.; Meima, J.; Charitos, A. Investigations on the selective arsenic reduction from copper concentrates by alkaline sulfide leaching and arsenic precipitation. In Proceedings of the International Copper 2022 Conference (as part of the 59th Conference of Metallurgists), Santiago de Chile, Chile, 14 November 2022; Hydrometallurgy Volume. p. 336. [Google Scholar]
  19. Knerr, S.; Brendler, E.; Gericke, R.; Kroke, E.; Wagler, J. Two Modifications of Nitrilotris(methylenephenylphosphinic) Acid: A Polymeric Network with Intermolecular (O=P–O–H)3 vs. Monomeric Molecules with Intramolecular (O=P–O–H)3 Hydrogen Bond Cyclotrimers. Crystals 2024, 14, 662. [Google Scholar] [CrossRef]
  20. Goldstein, B.M. Disorder in the structure of trisodium phosphorothioate dodecahydrate. Acta Crystallogr. Sect. B 1982, 38, 1116–1120. [Google Scholar] [CrossRef]
  21. Glaser, J. Crystal and Molecular Structure of Trisodiumhexachlorothallium(III) Dodekahydrate, Na3TlCl6.12H2O. Acta Chem. Scand. 1980, 34, 141–146. [Google Scholar] [CrossRef]
  22. Trots, D.M.; Senyshyn, A.; Mikhailova, D.A.; Vad, T.; Fuess, H. Phase transitions in jalpaite, Ag3CuS2. J. Phys. Condens. Matter 2008, 20, 455204. [Google Scholar] [CrossRef]
  23. Kohner-Kerten, A.; Tshuva, E.Y. Preparation and X-ray characterization of two-coordinate Cu(I) complex of aliphatic thiolato ligand: Effect of steric bulk on coordination features. J. Organomet. Chem. 2008, 693, 2065–2068. [Google Scholar] [CrossRef]
  24. Guschlbauer, J.; Vollgraff, T.; Xie, X.; Weigend, F.; Sundermeyer, J. A Series of Homoleptic Linear Trimethylsilylchalcogenido Cuprates, Argentates and Aurates Cat[Me3SiE−M−ESiMe3] (M = Cu, Ag, Au; E = S, Se). Inorg. Chem. 2020, 59, 17565–17572. [Google Scholar] [CrossRef]
  25. Goreshnik, E.; Petrusenko, S. Cation Charge as a Tool to Change Dimensionality in Organic–Inorganic Hybrids Based on Copper Thiocyanate Templated by 1,4-Diazabicyclo[2.2.2]octane. Molecules 2023, 28, 3608. [Google Scholar] [CrossRef]
  26. Garner, C.D.; Nicholson, J.R.; Clegg, W. Preparation, Crystal Structure, and Spectroscopic Characterization of [NEt4]2[Cu(SPh)3]. Inorg. Chem. 1984, 23, 2148–2150. [Google Scholar] [CrossRef]
  27. Karanović, L.; Cvetković, L.; Poleti, D.; Balić-Žunić, T.; Makovicky, E. Crystal and absolute structure of enargite from Bor (Serbia). N. Jb. Miner. Mh. 2002, 6, 241–253. [Google Scholar] [CrossRef]
  28. Mereiter, K.; Preisinger, A.; Zellner, A.; Mikenda, W.; Steidl, H. Hydrogen bonds in Na2S·5H2O: X-ray diffraction and vibrational spectroscopic study. J. Chem. Soc. Dalton Trans. 1984, 13, 1275–1277. [Google Scholar] [CrossRef]
  29. Allen, F.H.; Bruno, I.J. Bond lengths in organic and metal-organic compounds revisited: X—H bond lengths from neutron diffraction data. Acta Crystallogr. Sect. B 2010, 66, 380–386. [Google Scholar] [CrossRef] [PubMed]
  30. Spackman, P.R.; Turner, M.J.; McKinnon, J.J.; Wolff, S.K.; Grimwood, D.J.; Jayatilaka, D.; Spackman, M.A. CrystalExplorer: A program for Hirshfeld surface analysis, visualization and quantitative analysis of molecular crystals. J. Appl. Cryst. 2021, 54, 1006–1011. [Google Scholar] [CrossRef]
  31. Brafman, O.; Mitra, S.S. Raman Effect in Wurtzite- and Zinc-Blende-Type ZnS Single Crystals. Phys. Rev. 1968, 171, 931–934. [Google Scholar] [CrossRef]
  32. Berkh, K.; Majzlan, J.; Meima, J.A.; Plášil, J.; Rammlmair, D. The effect of chemical variability and weathering on Raman spectra of enargite and fahlore. Eur. J. Mineral. 2023, 35, 737–754. [Google Scholar] [CrossRef]
  33. Angermaier, K.; Zeller, E.; Schmidbaur, H. Crystal structures of chloro(trimethylphosphine) gold(I), chloro(tri-ipropylphosphine)gold(I) and bis(trimethylphosphine) gold(I) chloride. J. Organomet. Chem. 1994, 472, 371–376. [Google Scholar] [CrossRef]
  34. Ainscough, E.W.; Bowmaker, G.A.; Brodie, A.M.; Freeman, G.H.; Hanna, J.V.; Jameson, G.B.; Otter, C.A. Structural and spectroscopic characterization of silver(I) tribenzylphosphane complexes including chloro and bromo derivatives with unusual stoichiometries and an iodo complex with a Ag13I13 cluster core. Polyhedron 2011, 30, 638–646. [Google Scholar] [CrossRef]
  35. Asplund, M.; Jagner, S.; Nilsson, M. Crystal Structures of Tetrabutylammonium Dichlorocuprate(I) and Tetrabutylammonium Dibromocuprate(I), [N(C4H9)4][CuCl2] and [N(C4H9)4][CuBr2]. Acta Chem. Scand. 1983, 37, 57–62. [Google Scholar] [CrossRef]
  36. Effenberger, H.; Pertlik, F. Crystal structure of NaCu5S3. Monshefte. Chem. 1985, 116, 921–926. [Google Scholar] [CrossRef]
  37. Savelsberg, G.; Schäfer, H. Zur Kenntnis von Na2Cu4S3 und KCu3Te2. Mat. Res. Bull. 1981, 16, 1291–1297. [Google Scholar] [CrossRef]
  38. Klepp, K.O.; Sing, M.; Boller, H. Preparation and crystal structure of Na4Cu2S3, a thiocuprate with discrete anions. J. Alloys Compds. 1992, 184, 265–273. [Google Scholar] [CrossRef]
  39. Zhou, X.; Kolluru, V.S.C.; Xu, W.; Wang, L.; Chang, T.; Chen, Y.-S.; Yu, L.; Wen, J.; Chan, M.K.Y.; Chung, D.Y.; et al. Private communication of the experimental crystal structure determination, 2022. (Private Communication to the Cambridge Structure Database, deposition number 2184426, ICSD 175836). [CrossRef]
  40. Hofmann, K.A.; Höchtlen, F. Krystallisirte Polysulfide von Schwermetallen. Ber. Dtsch. Chem. Ges. 1904, 37, 245–249. [Google Scholar] [CrossRef]
  41. Burschka, C. The Crystal Structure of NH4CuS4. Z. Natforsch. B 1980, 35, 1511–1514. [Google Scholar] [CrossRef]
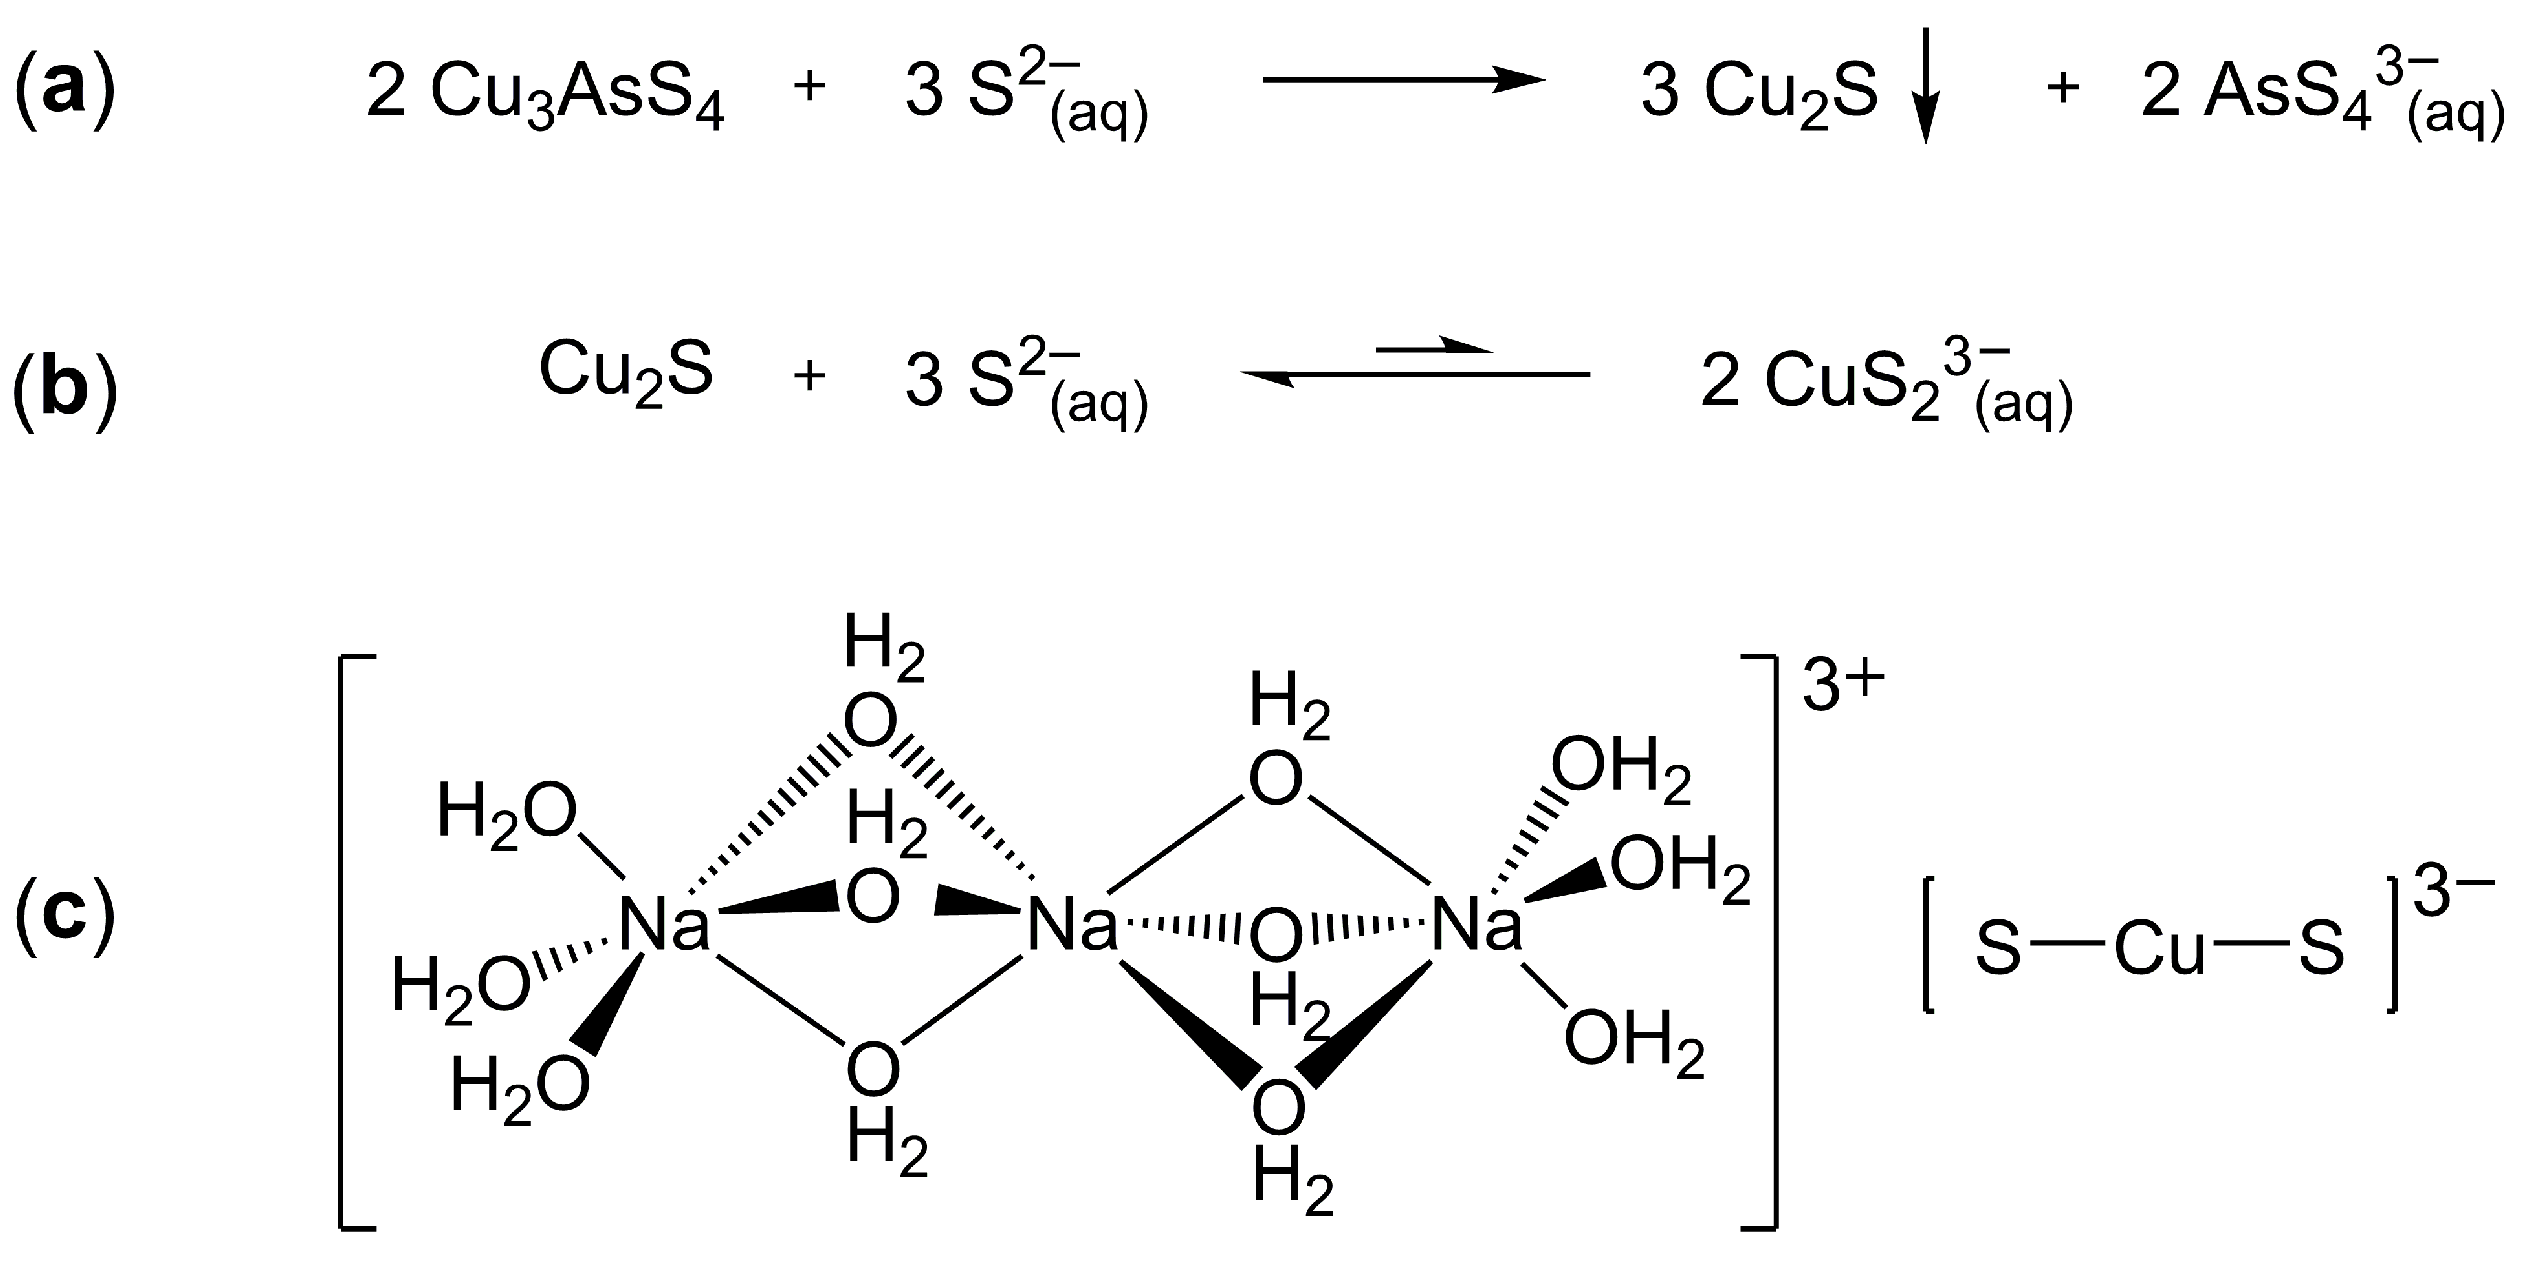
Figure 1. Alkaline sulfide leaching of copper thioarsenates: (a) Target reaction of the sulfide leaching of enargite (Cu3AsS4) with the formation of Cu2S and the thioarsenate solution. (b) Formation of thiocuprate(I) as a side reaction. (c) Constituents of the salt Na3CuS2·12(H2O).
Crystals 15 00501 g001
Figure 2. Selected parts of the crystals structure of Na3CuS2·12(H2O) (cf. entry 2 in Table A1) with thermal displacement ellipsoids at the 50% probability level. Atom labels indicate the atom sites of the asymmetric unit. Selected symmetry equivalents, indicated with asterisks (*), adhere to symmetry operations * (−x + 4/3, −y + 2/3, −z + 2/3) and ** (y + 1/3, x − 1/3, −z + 7/6). (a) shows the ensemble of the cation [Na3(H2O)12]3+ and the anion [CuS2]3− as generated from the asymmetric unit (for clarity, the H atoms are omitted from the coordination sphere of Na2*, and the coordination sphere of Na2 is enhanced by the nearest additional [CuS2]3− anions). The pairs of sub-figures (b);(c) and (d);(e), respectively, show the perspective views along (0 0 1);(1 0 0) of the distorted octahedral coordination spheres of Na1 and Na2, respectively.
Crystals 15 00501 g002
Figure 3. Corresponding atom distances (1, 2, 3, 4) and interatomic angles (α, β, γ, δ) in the cations [Na3(H2O)12]3+ in compounds Na3CuS2·12(H2O) (this work, cf. entry 2 in Table A1), Na3SPO3·12(H2O) [20], and Na3TlCl6·12(H2O) [21] for the assignment of the parameters listed in Table 2 (because of symmetry, only the coordination spheres of the central Na atom and one of the terminal Na atoms are drawn).
Crystals 15 00501 g003
Figure 4. The four different O–H···A (A = acceptor site O, S) hydrogen bonds (red lines) in the crystal structure of in Na3CuS2·12(H2O). The O1*–H1*···S1* hydrogen bond corresponds to the cation–anion connection along the c axis (i.e., the direction of the axis S-Cu-S of the anions, as shown in Figure 2a). The Cu–S bonds and the Na1–Na2 connecting line indicate the direction of c. The different sets of asterisks (*, **, and ***) denote atom sites generated by the different symmetry operations (−x + 5/3, −x + y + 4/3, −z + 5/6), (−y + 2/3, −x + 4/3, z−1/6), and (−2x + 8/3, −x + 4/3, −2z + 11/6), respectively.
Crystals 15 00501 g004
Figure 5. Visualization of the results of the Hirshfeld surface analysis (performed with CrystalExplorer version 21.5, revision 608bb32 [30]) of Na3CuS2·12(H2O). For the sake of the analysis of the individual ions, a symmetry equivalent anion was used in combination with the cation generated from the asymmetric unit. The graphics were generated from the analysis performed with the structure associated with entry 2 in Table A1. (a) Fingerprint plot (de vs. di) of the contacts on the Hirshfeld surface. (A corresponding fingerprint plot of the comparative analysis of the structure refined with O–H bond lengths restrained to 0.98 Å is contained in the supplementary material.) The dnorm plots of the Hirshfeld surface are shown along the crystallographic c axis (b), upon a partial horizontal rotation (c) and eventually a view perpendicular to c (d). In graphics (bd), the dnorm surface color code ranges from −0.594 (red) to 0.972 (blue). (In the comparative analysis, it ranges from −0.599 to 0.972).
Crystals 15 00501 g005
Figure 6. Images of the crystals of Na3CuS2·12(H2O) and their positioning used for Raman measurements. Whereas (a,b) are viewed almost perpendicular to the trigonal axis, view (c) is almost along this axis. The crystals are hanging from the top of a horizontally placed glass vial and the corona around the crystals in images (a,b) originates from a thin layer of mother liquor, which adheres to the sides of each crystal.
Crystals 15 00501 g006
Figure 7. Raman spectrum of Na3CuS2·12(H2O) recorded from the crystal and its positioning shown in Figure 6a.
Crystals 15 00501 g007
Figure 8. Section of the Raman spectra of Na3CuS2·12(H2O) recorded from the crystal positionings shown in Figure 6a–c (the spectral traces a, b, and c from top to bottom correspond to this order).
Crystals 15 00501 g008
Table 1. Details of the leaching experiment of the alkaline sulfide leaching treatment. A leaching solution consisting of 2.5 M NaOH/2.0 M Na2S·3(H2O) was used for the leaching of the concentrate in an s/l ratio of 1/10. The content was measured by AAS and Cu by ICP-OES [7,8]—*[CuICP-gel] in the post-evaluation.
ParameterValue
[AsFeed-Conc.]/wt.-%4.0
[CuFeed-Conc.]/wt.-%14.3
[SFeed-Conc.]/wt.-%40.8
Leaching yield of As (solid based)/%97
Cu residual concentration of leaching residues/wt.-%16.7
As residual concentration of leaching residues/wt.-%0.15
Volumed feed/mL200
Volume after leaching/mL186
Mass of feed concentrate/g20.0
Mass of leached concentrate/g11.9
[AsICP-gel] in g/L3.52
[CuICP-gel]/mg/L126.2
Table 2. Selected crystal data and interatomic distances (Å) and angles (deg) of the [Na3(H2O)12]3+ cation from the crystal structures of Na3CuS2·12(H2O) (this work, cf. entry 2 in Table A1), Na3SPO3·12(H2O) [20], and Na3TlCl6·12(H2O) [21]. The atom distances (1, 2, 3, 4) and angles (α, β, γ, δ) reported in this table refer to those shown in Figure 3.
ParameterNa3CuS2·12(H2O)Na3SPO3·12(H2O)Na3TlCl6·12(H2O)
Crystal
Crystal systemtrigonaltrigonaltrigonal
Space group R 3 ¯ c R 3 ¯ c R 3 ¯ m
a [Å]8.4801(2)9.061(2)10.345(5)
c [Å]38.6136(13)34.34(2)18.007(5)
Atom distances
13.283.183.24
22.402.402.41
32.402.382.44
42.412.382.40
Angles
α78.380.480.7
β78.681.179.7
γ81.190.689.9
δ96.1, 104.793.3, 94.786.1, 106.0
∆δ8.61.419.9
Disclaimer/Publisher’s Note: The statements, opinions and data contained in all publications are solely those of the individual author(s) and contributor(s) and not of MDPI and/or the editor(s). MDPI and/or the editor(s) disclaim responsibility for any injury to people or property resulting from any ideas, methods, instructions or products referred to in the content.