Article

Synthesis, Morphology, and Luminescent Properties of Nanocrystalline KYF4:Eu3+ Phosphors

by
Kirill S. Prichisly
1,
Anna A. Betina
1,
Anastasia L. Petrova
1,
Tatyana S. Bulatova
1,
Sergey N. Orlov
2,
Ilya E. Kolesnikov
1,
Nikita A. Bogachev
1,*,
Mikhail Yu. Skripkin
1 and
Andrey S. Mereshchenko
1
1
Institute of Chemistry, Saint Petersburg State University, 7/9 Universitetskaya Emb., Saint Petersburg 199034, Russia
2
Institute of Nuclear Industry, Peter the Great St. Petersburg Polytechnic University (SPbSU), 29, Polytechnicheskaya Street, Saint Petersburg 195251, Russia
*
Author to whom correspondence should be addressed.
Crystals 2025, 15(6), 500; https://doi.org/10.3390/cryst15060500 (registering DOI)
Submission received: 3 May 2025 / Revised: 17 May 2025 / Accepted: 21 May 2025 / Published: 24 May 2025
(This article belongs to the Section Inorganic Crystalline Materials)

Abstract

:
The study of crystalline nanosized phosphors KYF4:Eu3+ was carried out for the first time in a range of europium concentrations. The particles were obtained by a modified hydrothermal method. The formation of two different cubic phases (α-KY3F10 and KYF4) was detected depending on the ratio of reagents under synthesis conditions. The sizes and shapes of the synthesized particles were determined. For obtained particles, excitation and emission spectra were recorded, luminescence lifetimes and quantum yields were determined, and the mechanism of concentration quenching in these concentration series was disclosed.

1. Introduction

Nanoscale luminescent materials based on solid solutions of rare earth fluorides are promising materials due to a wide range of applications, including bioimaging, image-guided tumor surgery, photocatalysis, luminescent thermometry, anticounterfeiting, sensors, photovoltaics, etc. [1,2,3,4,5,6,7,8,9,10,11]. The synthesis conditions, the nature of rare earth elements (REE), and their relative content usually significantly affect the particle morphology, crystalline phase, and the optical properties of such materials. Despite the wide variety of such compounds containing various REE ions obtained by different methods, which was previously reported in the literature [12,13,14,15,16,17,18,19,20,21,22,23,24], the effect of the material composition and synthesis conditions on the structure and functional properties is often unclear, especially fundamental reasons that could explain such behavior and predict properties are almost miserable.
It is known that the phase composition of the host matrix, which can be doped with other rare earth ions, plays a significant role in the luminescent properties of the final materials. β-NaYF4 is among the most popular and well-studied matrices to date, mainly due to its low phonon energy, which allows the compounds to exhibit remarkable luminescent properties among inorganic phosphors [25]. Another similar compound that has attracted the attention of researchers is α-KY3F10 [26]. At the same time, compounds based on this matrix have been studied to a much smaller extent and contain significant gaps that require attention. This is confirmed, for example, by a recent remarkable review of upconversion compounds based on α-KY3F10 [27]. Among the luminescent ions used for doping in such solid solutions, trivalent europium is of particular importance. The emission spectrum of europium(III) exhibits intense and narrow lines in the visible spectrum, mainly in the red region (570–840 nm, corresponding to the 5D07Fj transitions (j = 0–6)) [28]. Compounds containing europium(III) ions possess a high quantum yield, a large Stokes shift, and a relatively long emission lifetime, which allows their use in bioimaging [29] and is sensitive to the local environment, making it suitable for use as a structural probe [30,31]. The synthesis and study of some KYxF3x+1 (x = 1; 3) compounds doped with europium have been undertaken many times before, and fragmentary information on these compounds can be found in the literature [32,33,34,35,36,37,38,39,40]. In these works, the luminescent and morphological properties of KYxF3x+1 (x = 1; 3) doped with Eu3+ (only at a low concentration of europium, up to 15 at.%), synthesized by different methods, were studied. It should also be especially noted that the results of these works demonstrate that the synthesis conditions determine the crystalline phase of the final compounds: orthorhombic YF3, tetragonal KY3F10, cubic KYF4, KY3F10, or KY3F10·xH2O.
To the best of our knowledge, the study of the entire line of solid solutions in the KF-YF3-EuF3 system obtained by hydrothermal synthesis has not been carried out. This work was performed to conduct such a study and to track the changes in morphological and luminescent properties over the entire range of possible europium concentrations in the compounds.

2. Materials and Methods

The following reagents were used for the synthesis of fluorescent nanoparticles: YCl3∙6H2O (99.9%, Chemcraft, Kaliningrad, Russia), EuCl3∙6H2O (99.9%, Chemcraft, Kaliningrad, Russia), KF∙2H2O, NH3∙H2O, citric acid, and ethanol (Chemcraft, Kaliningrad, Russia). All reagents were used without additional purification.
Nanocrystalline samples of solid solutions were synthesized using a modified hydrothermal method with citric acid as a stabilizer. This modification enabled the synthesis from potassium fluoride. Rare earth chlorides, taken in stoichiometric quantities (total amount of 0.375 mmol), were dissolved with 2.4 mmol of citric acid in distilled water to yield a 2 mL solution. Then, 2 mL of an aqueous solution containing 10 mmol NH3 was added to the flask with the previous solution. After intense stirring for 30 min, 12.5 mL of an aqueous solution containing 10 mmol KF was added. The mixture was stirred intensively for another 30 min at room temperature, then transferred to a Teflon-lined autoclave with an internal volume of 20 mL and heated for 17 h at 180 °C. The resulting colorless precipitate was separated from the reaction mixture by centrifugation, washed with ethanol and deionized water, and dried at 60 °C for 24 h.
The ratio of REE contents in the synthesized compounds was confirmed using energy dispersive X-ray spectroscopy (EDX) (EDX-spectrometer EDX-800P, Shimadzu, Kyoto, Japan)). The morphology and size of particles of the synthesized compounds were characterized using scanning electron microscopy (SEM) on a Zeiss Merlin electron microscope (Zeiss, Jena, Germany) equipped with an EDX module (Oxford Instruments INCAx-act, Oxford, UK). Powder X-ray diffraction (PXRD) measurements were carried out on a D2 Phaser X-ray diffractometer (Bruker, USA Warwic, RI, USA) using Cu Kα radiation (λ = 1.54056 Å). For quantitative photoluminescence studies, synthesized samples were compressed into pellets (20 mg of sample per 300 mg of potassium bromide). Luminescence spectra were recorded on a modular Fluorolog-3 fluorescence spectrometer (Horiba Jobin Yvon, Kyoto, Japan). Lifetime measurements were conducted using the same spectrometer with a Xe pulse lamp (pulse duration 3 ms). Photoluminescence quantum yield was measured by an absolute method using Fluorolog-3 equipped with a 6-inch integrating sphere Quanta-φ.

3. Results

3.1. Crystal Structure and Morphology

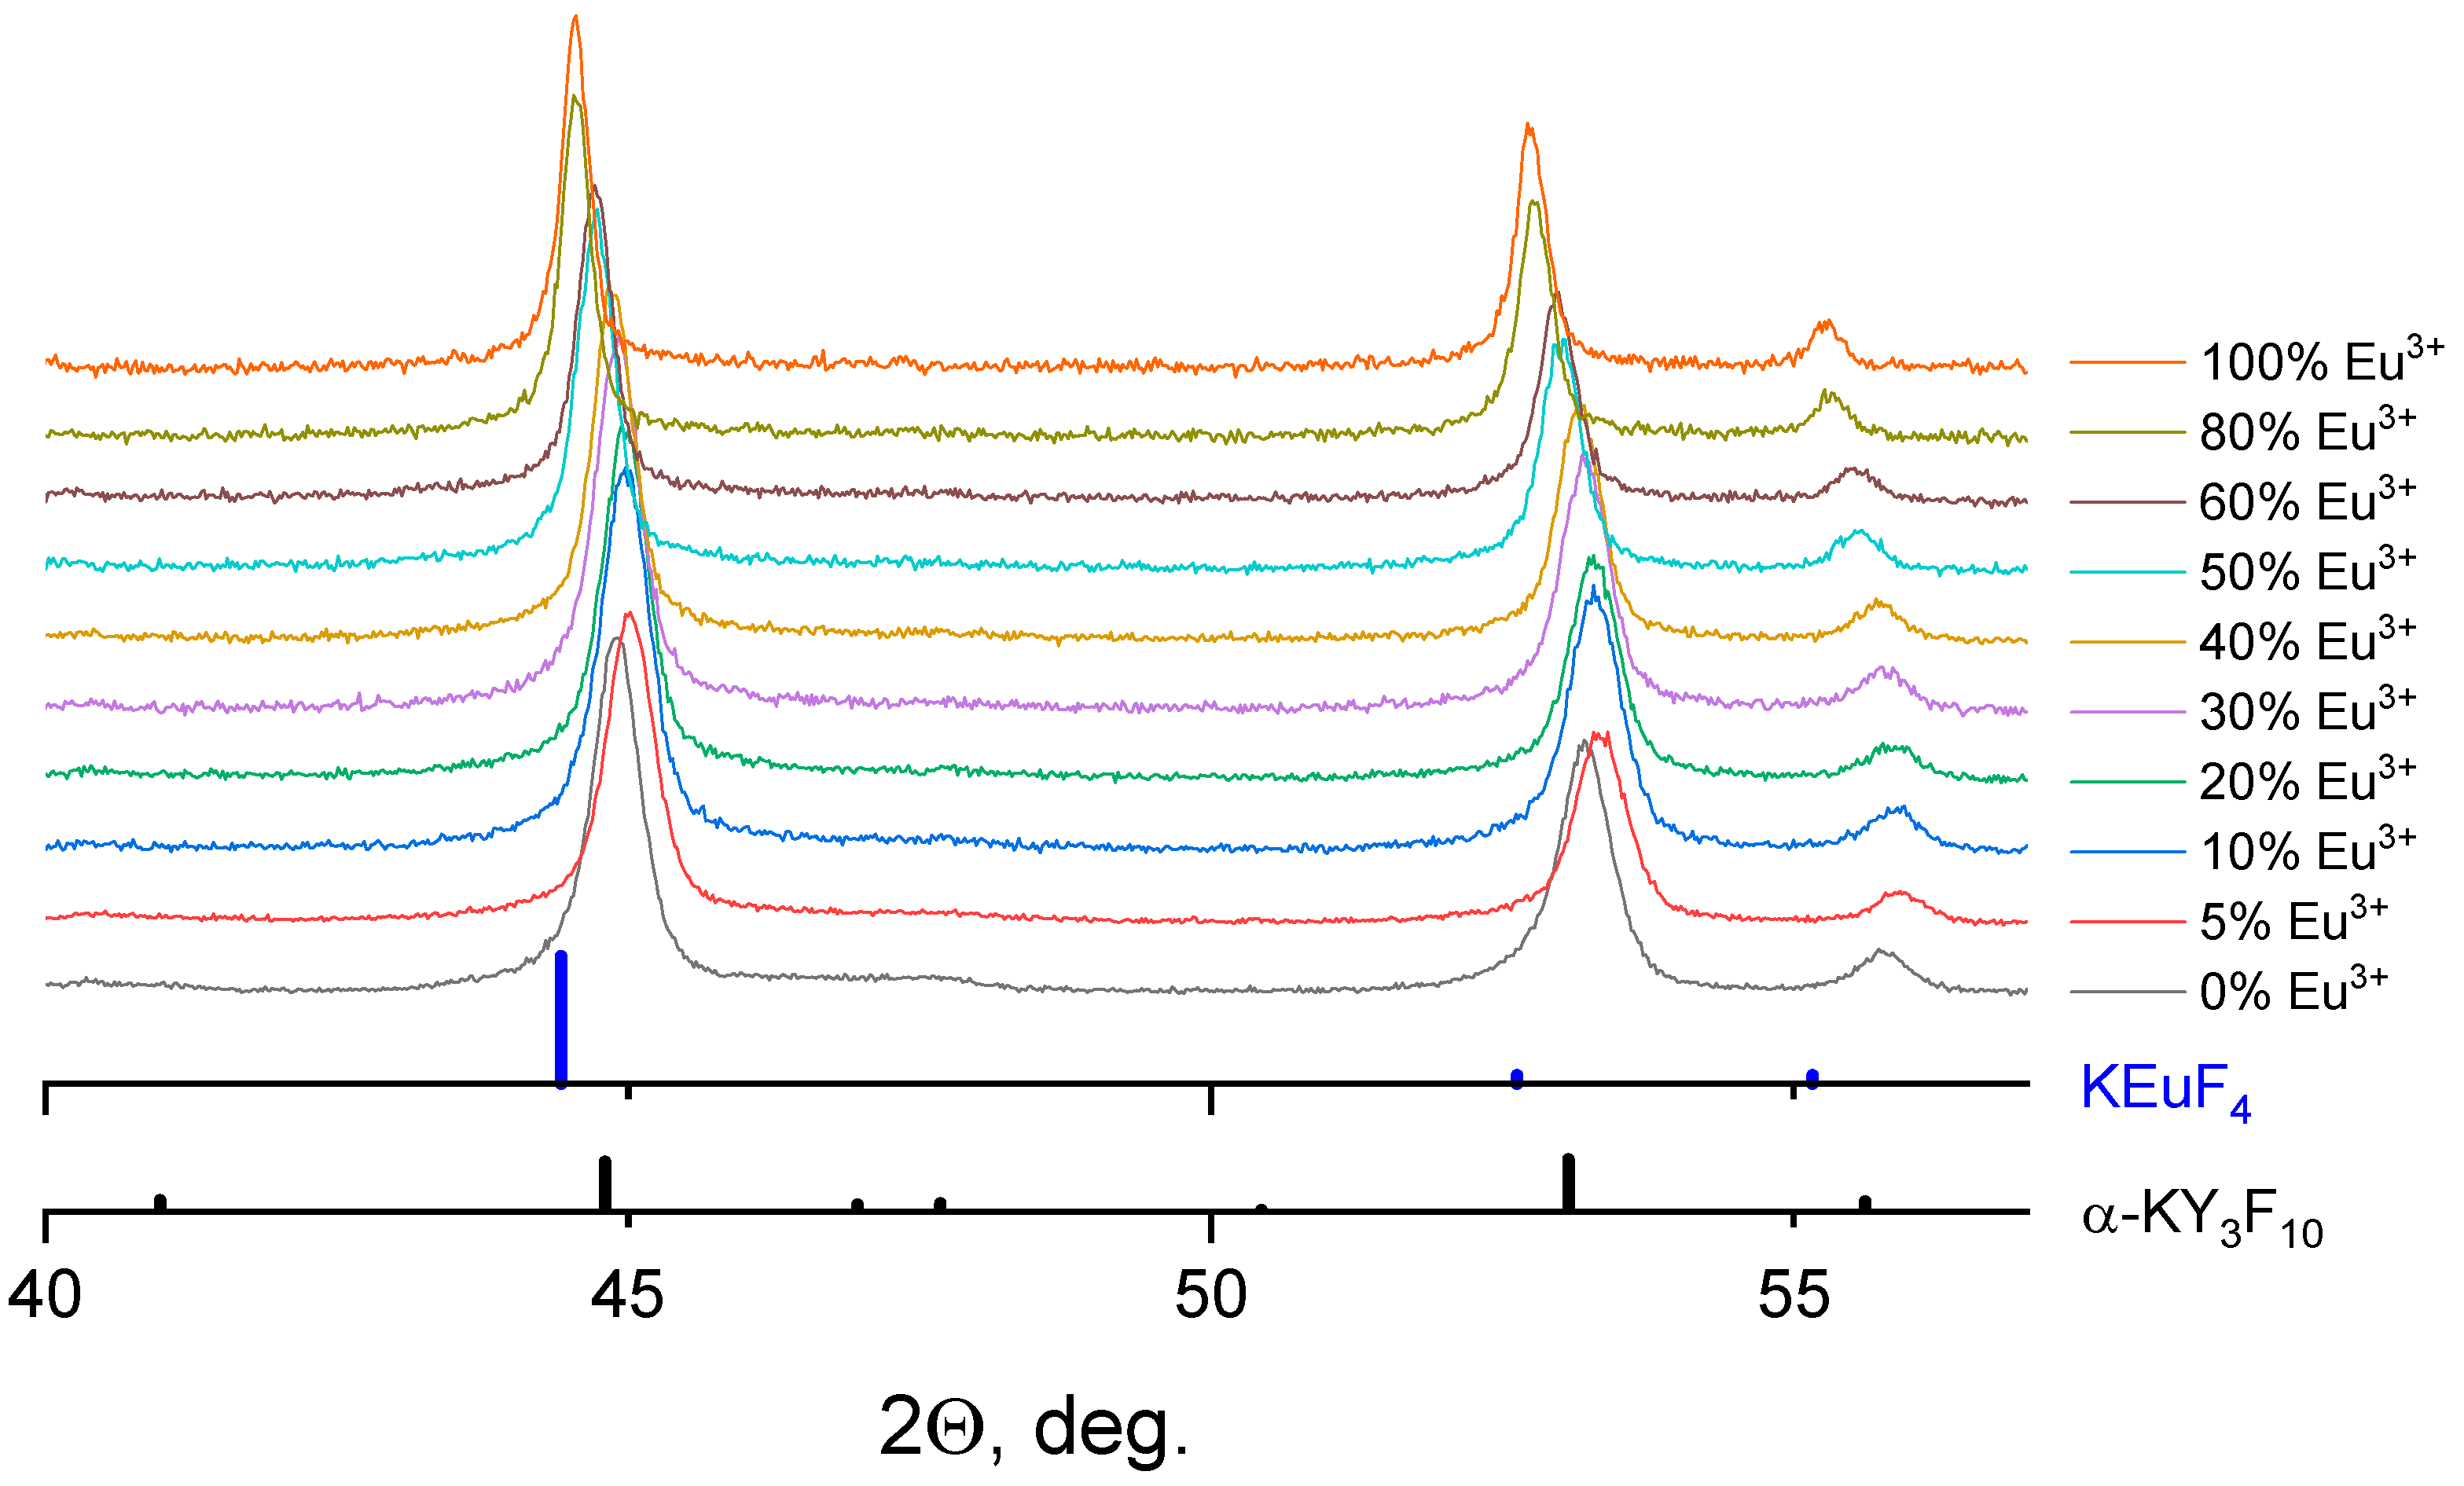
The powder X-ray diffraction (PXRD) patterns for the synthesized compounds are shown in Figure 1. Phase analysis shows the formation of two non-identical crystalline phases in the studied system. For the undoped composition (without europium ions), the analysis revealed the formation of the cubic α-KY₃F₁₀ phase (JCPDS No. 27-0462). In the range of 5–10 at.% of europium added, a mixture of two phases is formed, previously defined as cubic α-KY3F10 and cubic α-NaYF4 (JCPDS file No. 06-0342). Some of the low-intensity peaks of α-KY3F10 disappear when the fraction of europium is increased up to 20 at.%, and within the range of compositions from 20 at.% up to 100 at.%, the particles crystallize in the single α-NaYF4 phase. Comparison of experimental diffraction patterns and calculated one for α-NaYF4 in Figure 1 shows a slight shift in experimental diffraction peaks towards a smaller 2θ angle, which may be explained by ion replacement of smaller ionic radii of Na+ and Y3+ by larger ionic radii of K+ and Eu3+ and formation of the cubic KYF4 phase [32,34], which is assumed to be isostructural with KEuF4. Based on this assumption, a cubic unit cell for the simulated phase KEuF4 with a cell constant of 5.7636(2) Å (space group Fm-3m) was obtained by using TOPAS software (version 5). The calculated positions of the peaks for this compound are presented as blue bars with asterisks in Figure 1 and show an excellent match with the experimental one for the sample with 100 at.% of europium. More accurate analysis of PXRD patterns reveals a monotonic shift in peaks within the range 0–5 at.% of europium (Figure 2), which is caused by a change in phase composition. In the region from 20 to 100 at.% of Eu3+, a uniform shift in the peaks towards smaller angles is observed, which can be easily explained by the homogeneous substitution of yttrium ions by larger europium ions in the KEuF4 phase. To clarify the phase composition for solid solution samples in the range of 5 at.% and 10 at.% compositions, the Rietveld refinement of PXRD was performed (see Tables S1 and S2 in Supplementary Material), which showed that the proportion of the KEuF4 phase for both obtained samples is around 70 mass%, making it the dominant phase. These simulated powder diffractograms were further used to calculate the unit cell parameters of the obtained nanocrystals with 5–100 at.% Eu3+. The dependence of the refined unit cell volumes on the sample composition is shown in Figure 3. Unit cell volumes linearly depend on the concentration of europium(III) ions, which confirms that this series of solid solutions obeys Vegard’s law. The increase in Eu3+ content leads to an increase in unit cell volumes due to the larger ionic radius of Eu3+ ions (1.120 Å) compared to Y3+ ions (1.075 Å) [41,42]. Therefore, the dominant phase (5–10 at.% Eu3+) or single phase (20–100 at.% Eu3+) corresponds to the cubic KYF4:Eu3+ structure across the entire composition range.
The scanning electron microscopy (SEM) images of the synthesized materials are presented in Figure 4. Particle diameters were determined from these SEM images, with the size distribution displayed in the insets of Figure 4. The mean particle diameter was derived from this distribution and is provided in the figure legends. The particles exhibit spherical nanostructures, with sizes ranging from 23 ± 7 nm (for 0% Eu) to 54 ± 6 nm (for 100% Eu), depending on the composition. The nanoparticle size increases in a linear fashion with the increasing concentration of Eu3+.

3.2. Luminescent Properties

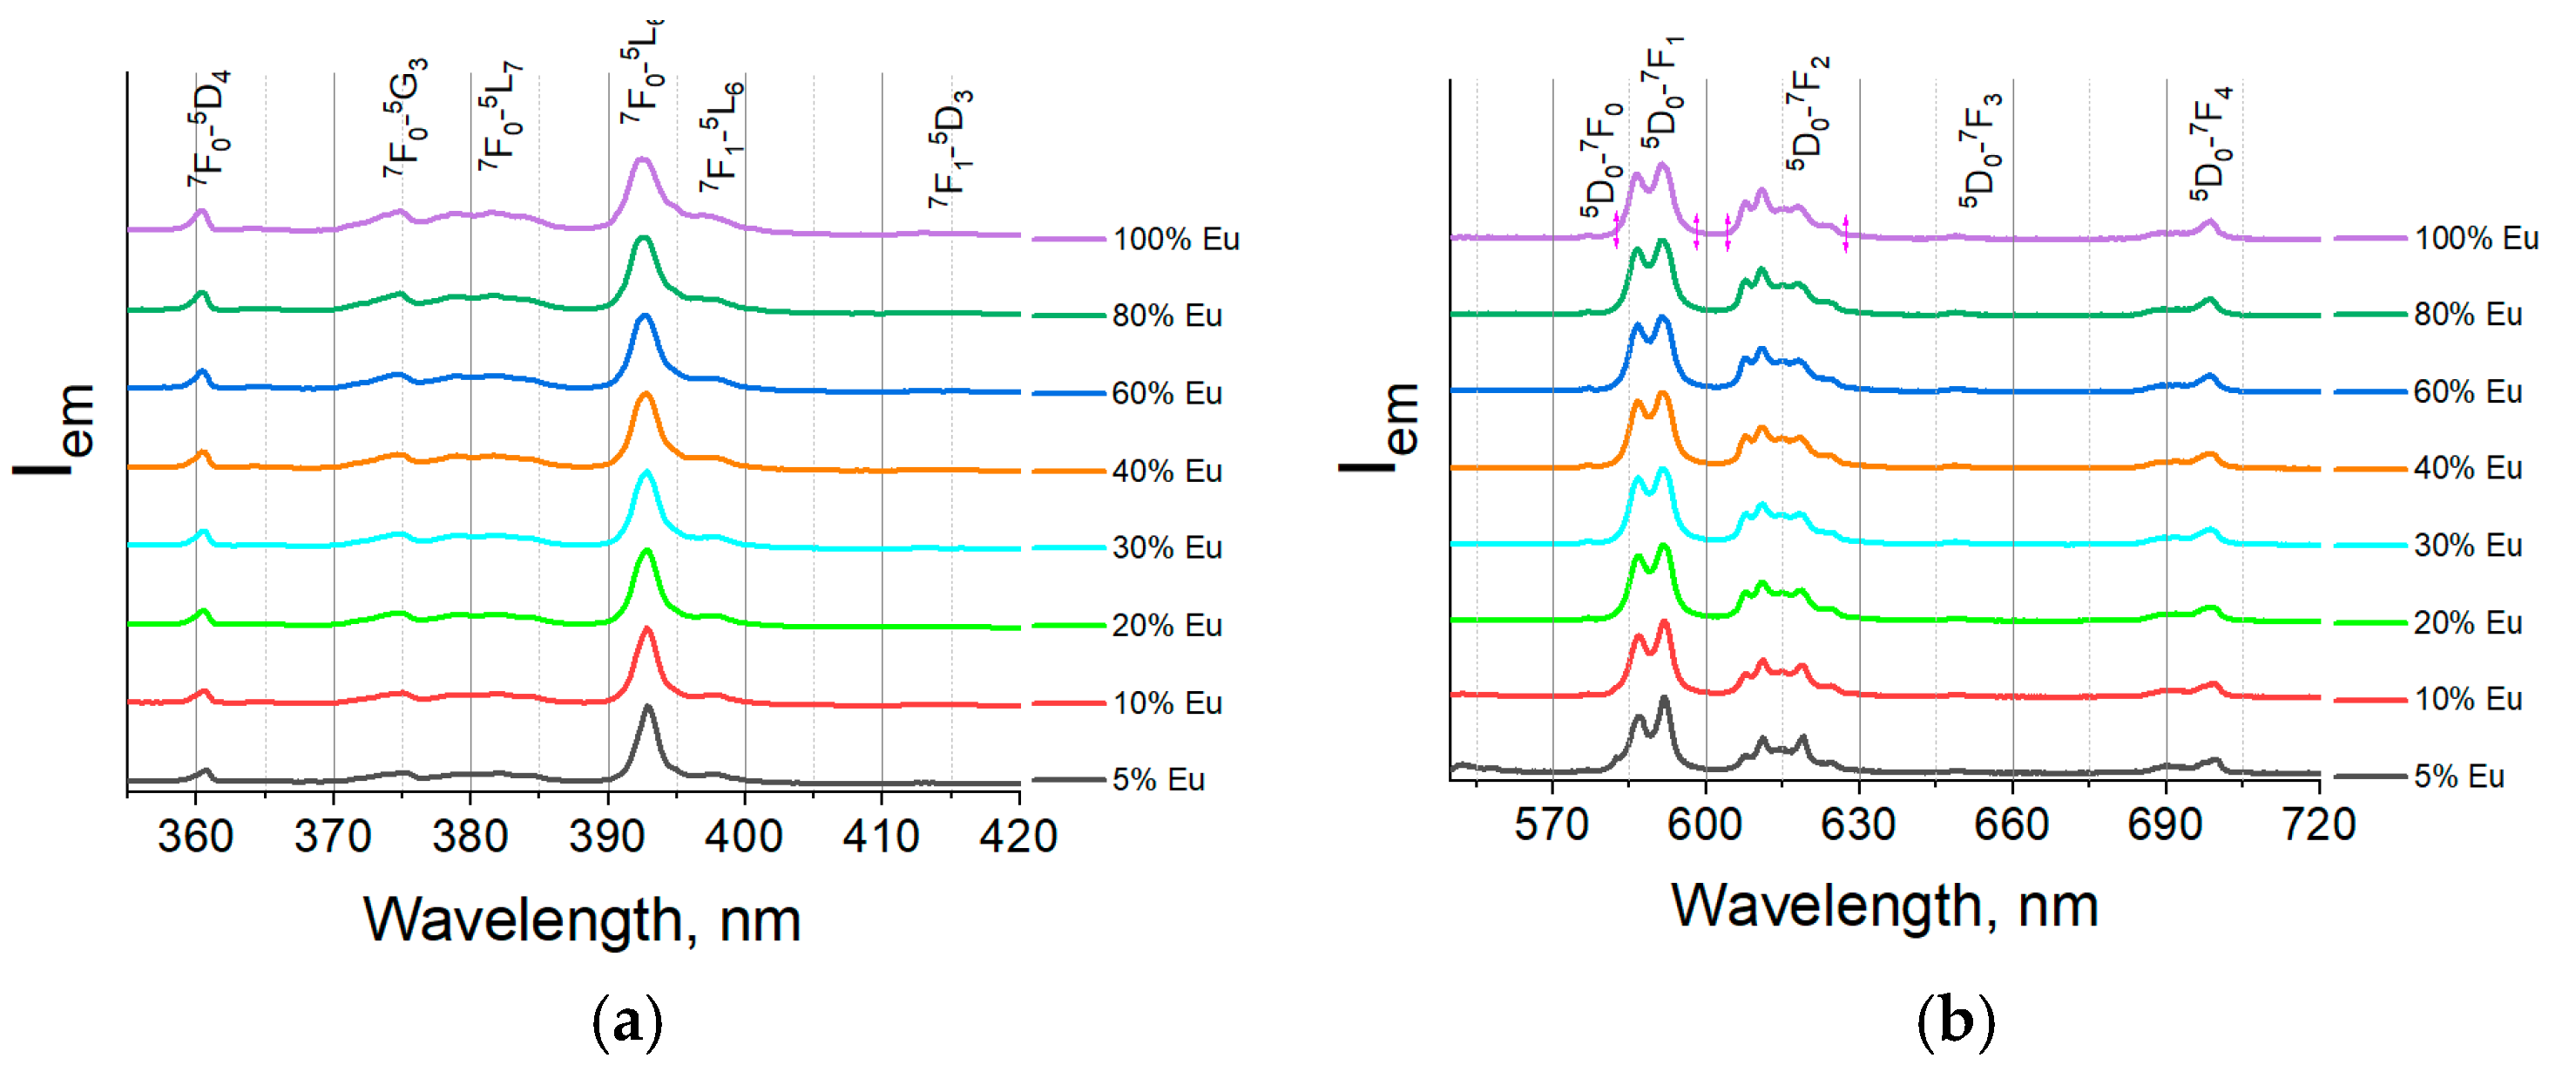
Excitation spectra (Figure 5a) of solid solution samples monitored at the 5D0-7F2 (615 nm) transition were measured in the spectral range of 355–420 nm. One can see that the spectra consist of sharp peaks attributed to the electron transitions of Eu3+ inside the 4f-shell: 7F0-5D4 (360 nm), 7F0-5G3 (375 nm), 7F0-5L7 (382 nm), 7F0-5D4 (360 nm), 7F1-5L6 (393 nm), 7F0-5D3 (415 nm). All obtained spectra have the same shape and are dominated by the 7F0-5L6 (393 nm) transition.
Emission spectra (Figure 5b) of KYF4:Eu3+ samples upon 393 nm excitation (7F0-5L6 transition) were measured in the spectral range of 550–720 nm. Spectra consist of sharp peaks attributed to 5D0-7FJ transitions: 5D0-7F0 (577 nm), 5D0-7F1 (586 and 591 nm), 5D0-7F2 (608, 611, 615, 618, and 625 nm), 5D0-7F3 (650 nm), and 5D0-7F4 (690 and 700 nm).
Analysis of luminescence spectra has shown that europium concentration does not affect the shape of the spectra.
Local symmetry of europium ions in the solid solutions was evaluated by calculating the asymmetry coefficient from the integrated intensity ratio of the 5D0-7F1 (structure-independent) and 5D0-7F2 (hypersensitive) transitions [43]. The obtained values ranged from 0.7 to 0.9 across all compositions, confirming the consistent Eu3+ coordination symmetry in all synthesized compounds.
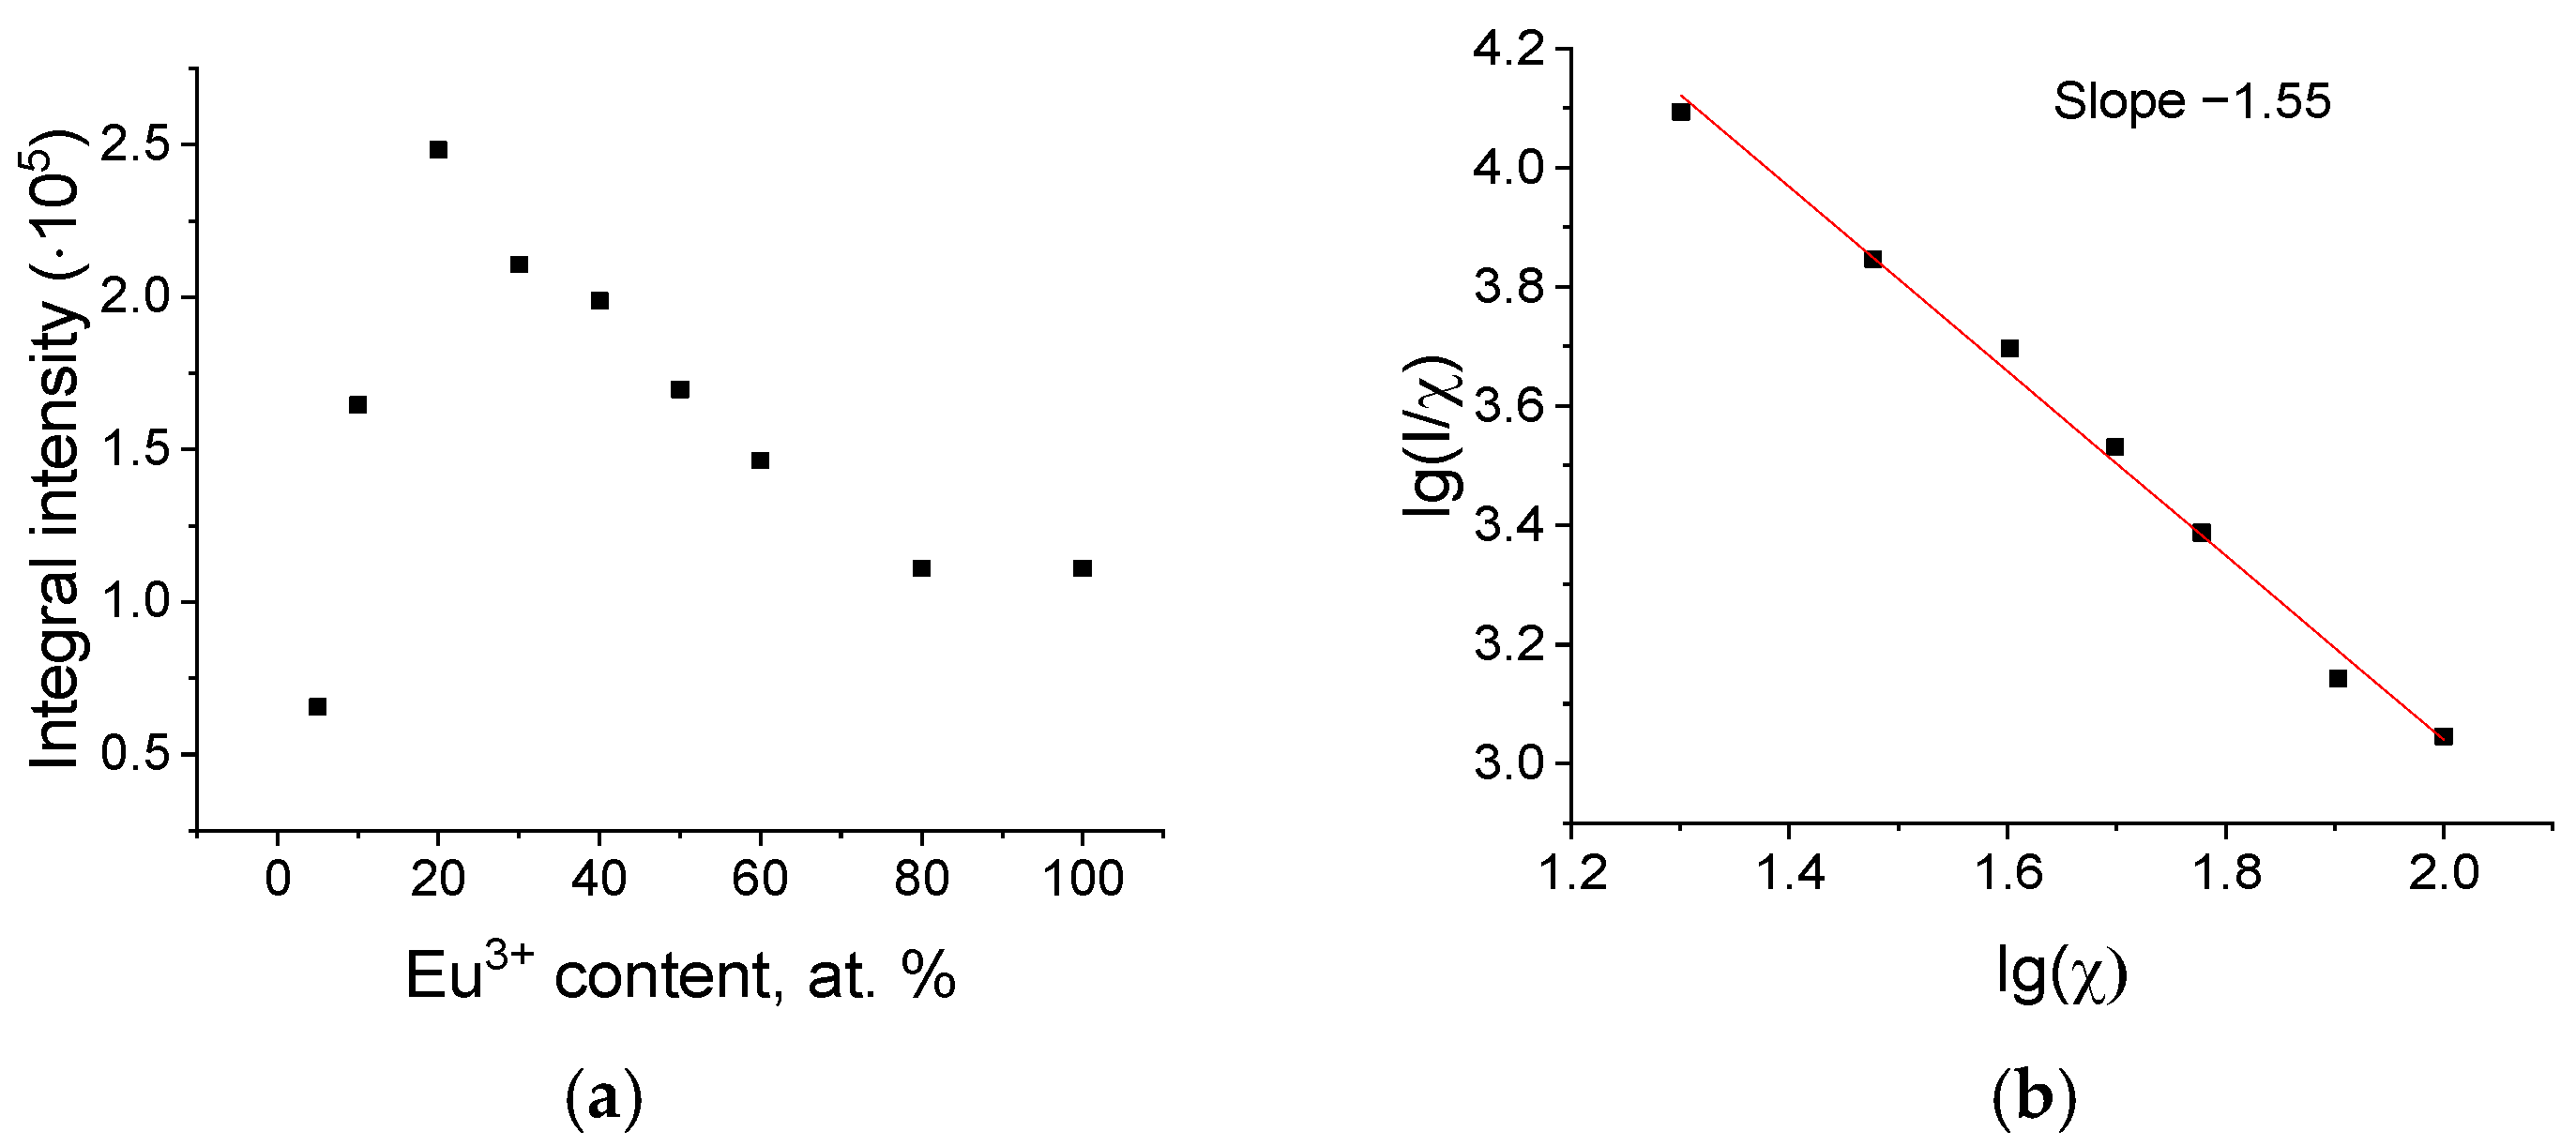
The dependence of the integral intensity on the europium concentration is shown in Figure 6a. The integral intensity grows rapidly from 0 to 20% of the europium concentration, reaching a maximum at 20% because the number of luminescence sites increases. The competitive effect of concentration quenching results in a slow decrease in integral intensity moving from 20 to 100%. This type of concentration dependence can be explained by the two competitive effects in phosphors upon Eu3+ concentration rise [44]. Thus, the rise of Eu3+ concentration results in an increase in the number of luminescent sites and, as a result, an increase in emission intensity. At the same time, as the Eu3+ concentration increases, the distance between Eu3+ ions decreases, resulting in the probability of non-radiative processes increasing, leading to the emission quenching.
If Eu3+ ions occupy a single crystallographic position in the host, the energy transfer mechanism is determined by the critical energy transfer distance Rc. One can calculate Rc using Equation (1) [45]:
R c = 2 ( 3 V 4 π χ c N ) 1 3 ,
χ c —critical concentration of europium (0.2), V—unit cell volume of sample with critical concentration (185.6 Å3), N—number of cation sites in crystal structure (2 for cubic KEuF4). The obtained value of Rc is 9.6 Å. It is known that if Rc > 5 Å, then non-radiative energy transfer occurs mainly by multipole-multipole interactions [45]. The mechanism of concentration quenching can be defined more precisely using Equation 2 [46]:
I χ = k 1 + β χ θ 3 ,
I—integral intensity, χ—concentration of luminescent ion, θ—auxiliary coefficient for determining the mechanism of concentration quenching. Assuming that β χ θ 3 >> 1, one can build the linearized coordinates lg(I/χ) − lgχ (Figure b). The linear fitting of this function gives the value of θ/3 (slope of the fitting line). The dipole–dipole, dipole-quadrupole and quadrupole-quadrupole interactions correspond to θ = 6, 8 and 10, respectively. The fitting of the obtained dependence gives θ/3 -1.55, which gives the value for θ closer to 6, meaning that concentration quenching in KYF4:Eu3+ is mainly caused by dipole–dipole interactions. The same concentration quenching mechanism is observed for NaYF4:Eu3+ [21].
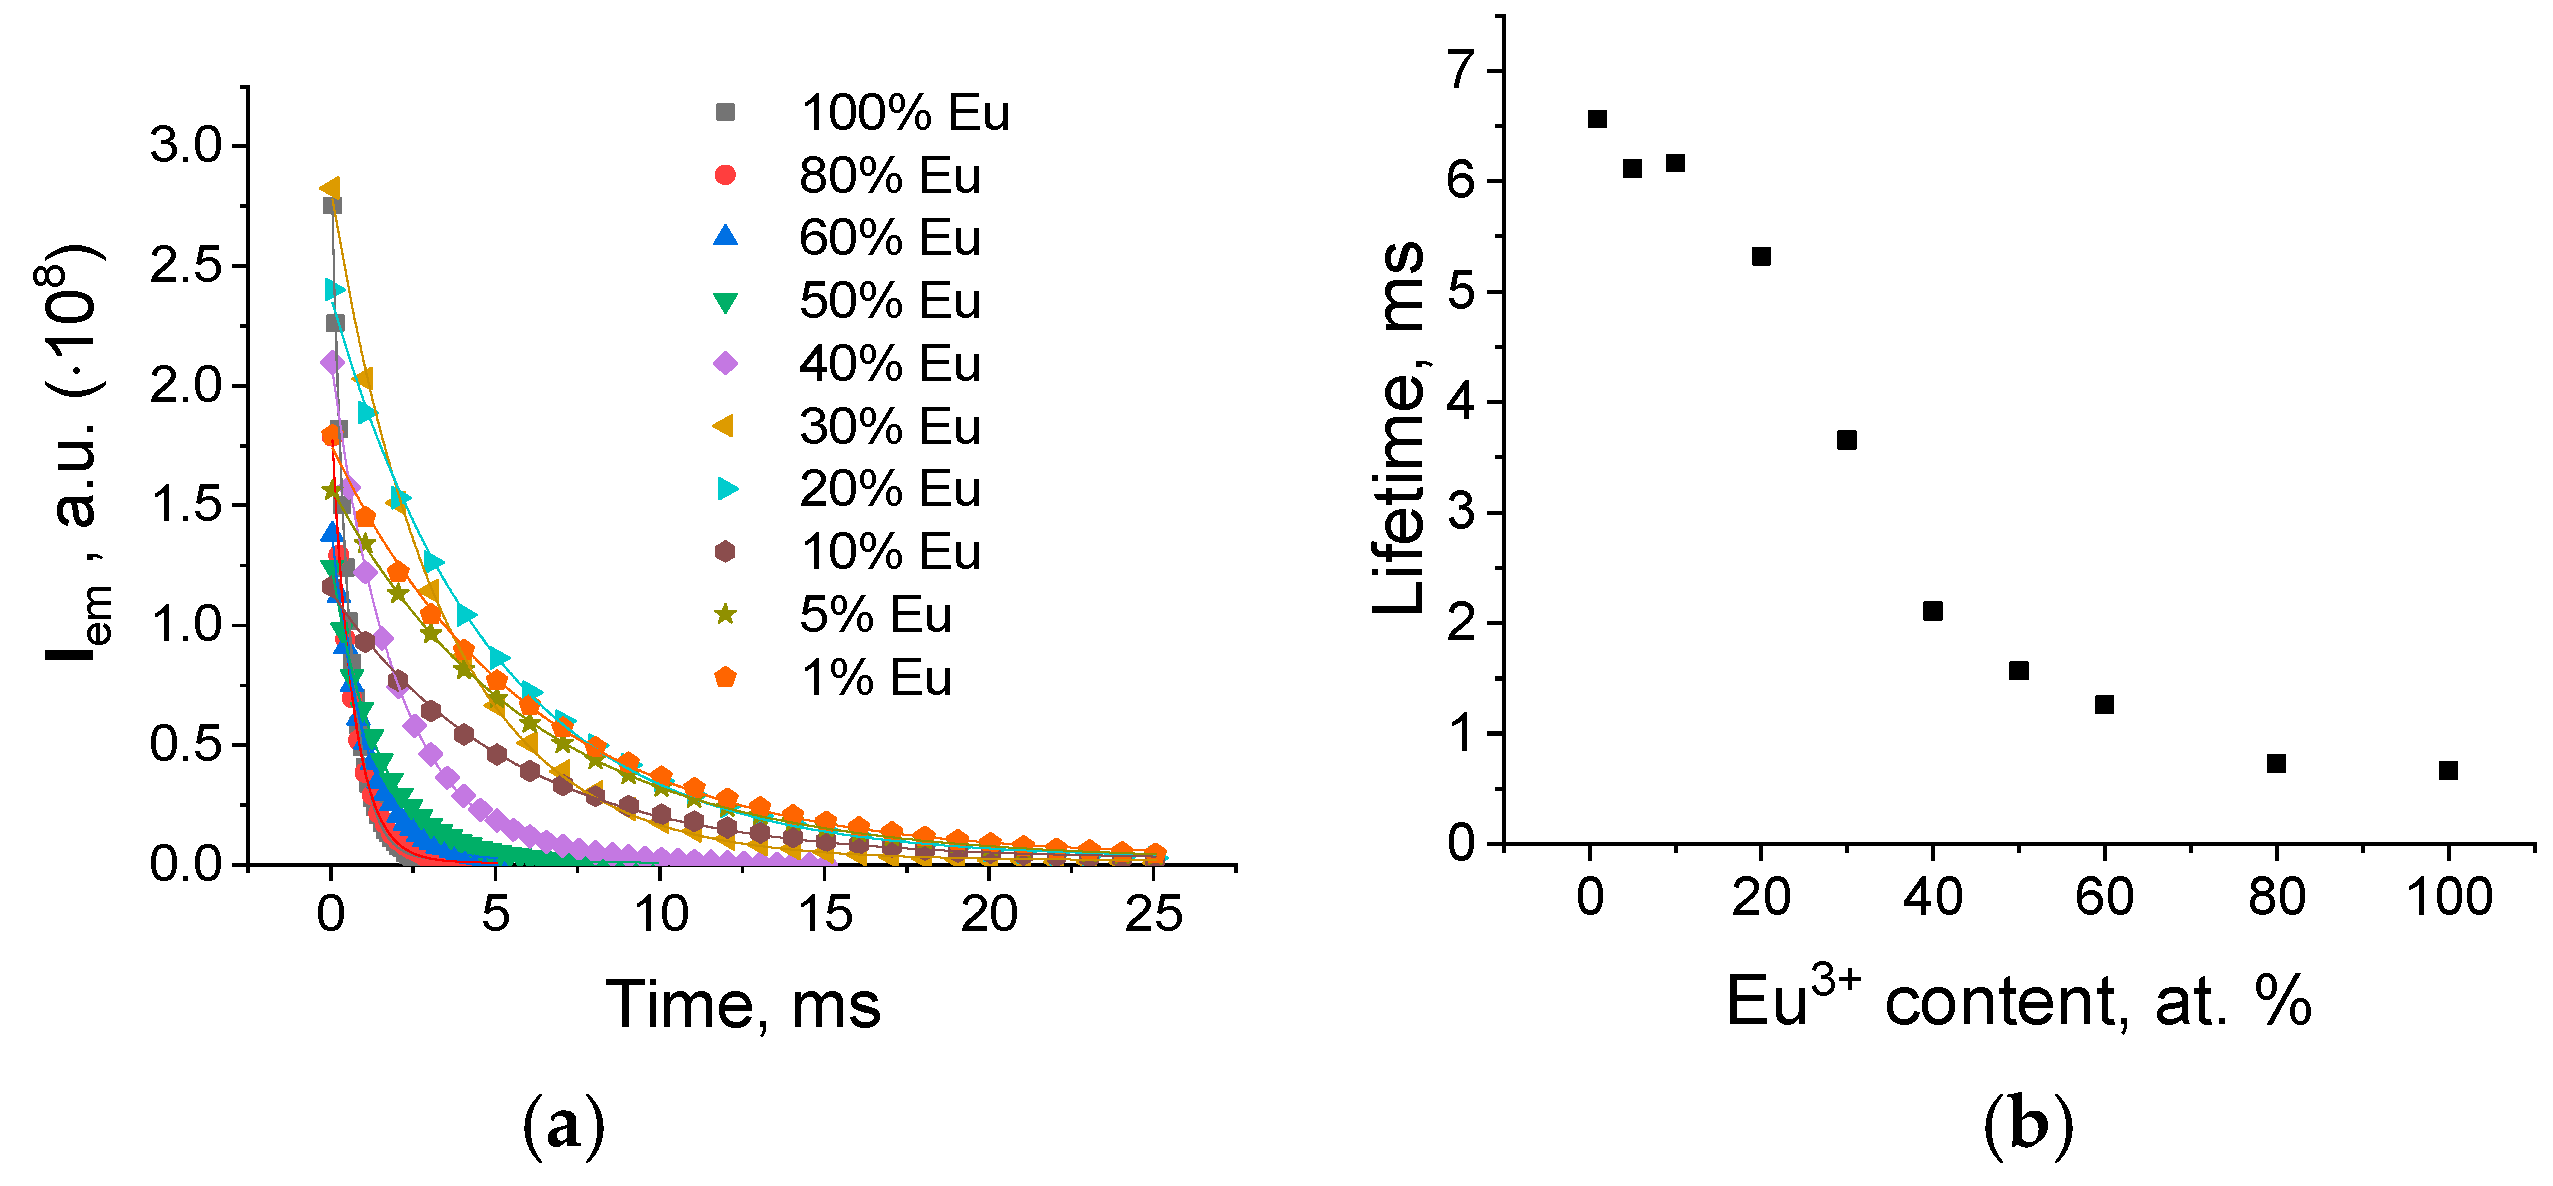
Luminescence decay curves of KYF4:Eu3+ monitored at 615 nm upon 393 nm excitation are presented in Figure 7a. All of the obtained curves demonstrate biexponential behavior. This effect is explained by different decay times of luminescent ions on the surface and in the depth of nanoparticles. Luminescence intensity as a function of time is described by Equation 3 [47,48,49,50]:
I t = A 1 e t τ 1 + A 2 e t τ 2 ,
A1, A2—pre-exponential constants, τ1, τ2—fitting lifetimes.
A lifetime of 5D0 energy level (average lifetime) can be approximately calculated using Equation 4 [49,50]:
τ = A 1 τ 1 2 + A 2 τ 2 2 A 1 τ 1 + A 2 τ 2
The obtained values of τ1 and τ2 are given in Table S3. The dependence of the average lifetime on europium concentration is demonstrated in Figure 7b. The obtained curve demonstrates almost monotonous behavior (average lifetime decreases from 6.6 to 0.7 ms with europium concentration increase). The rise of europium concentration causes a decrease in the distance between Eu3+ ions, resulting in the growth of non-radiative transfer probability. This effect leads to an average lifetime decrease due to the increase in non-radiative decay.
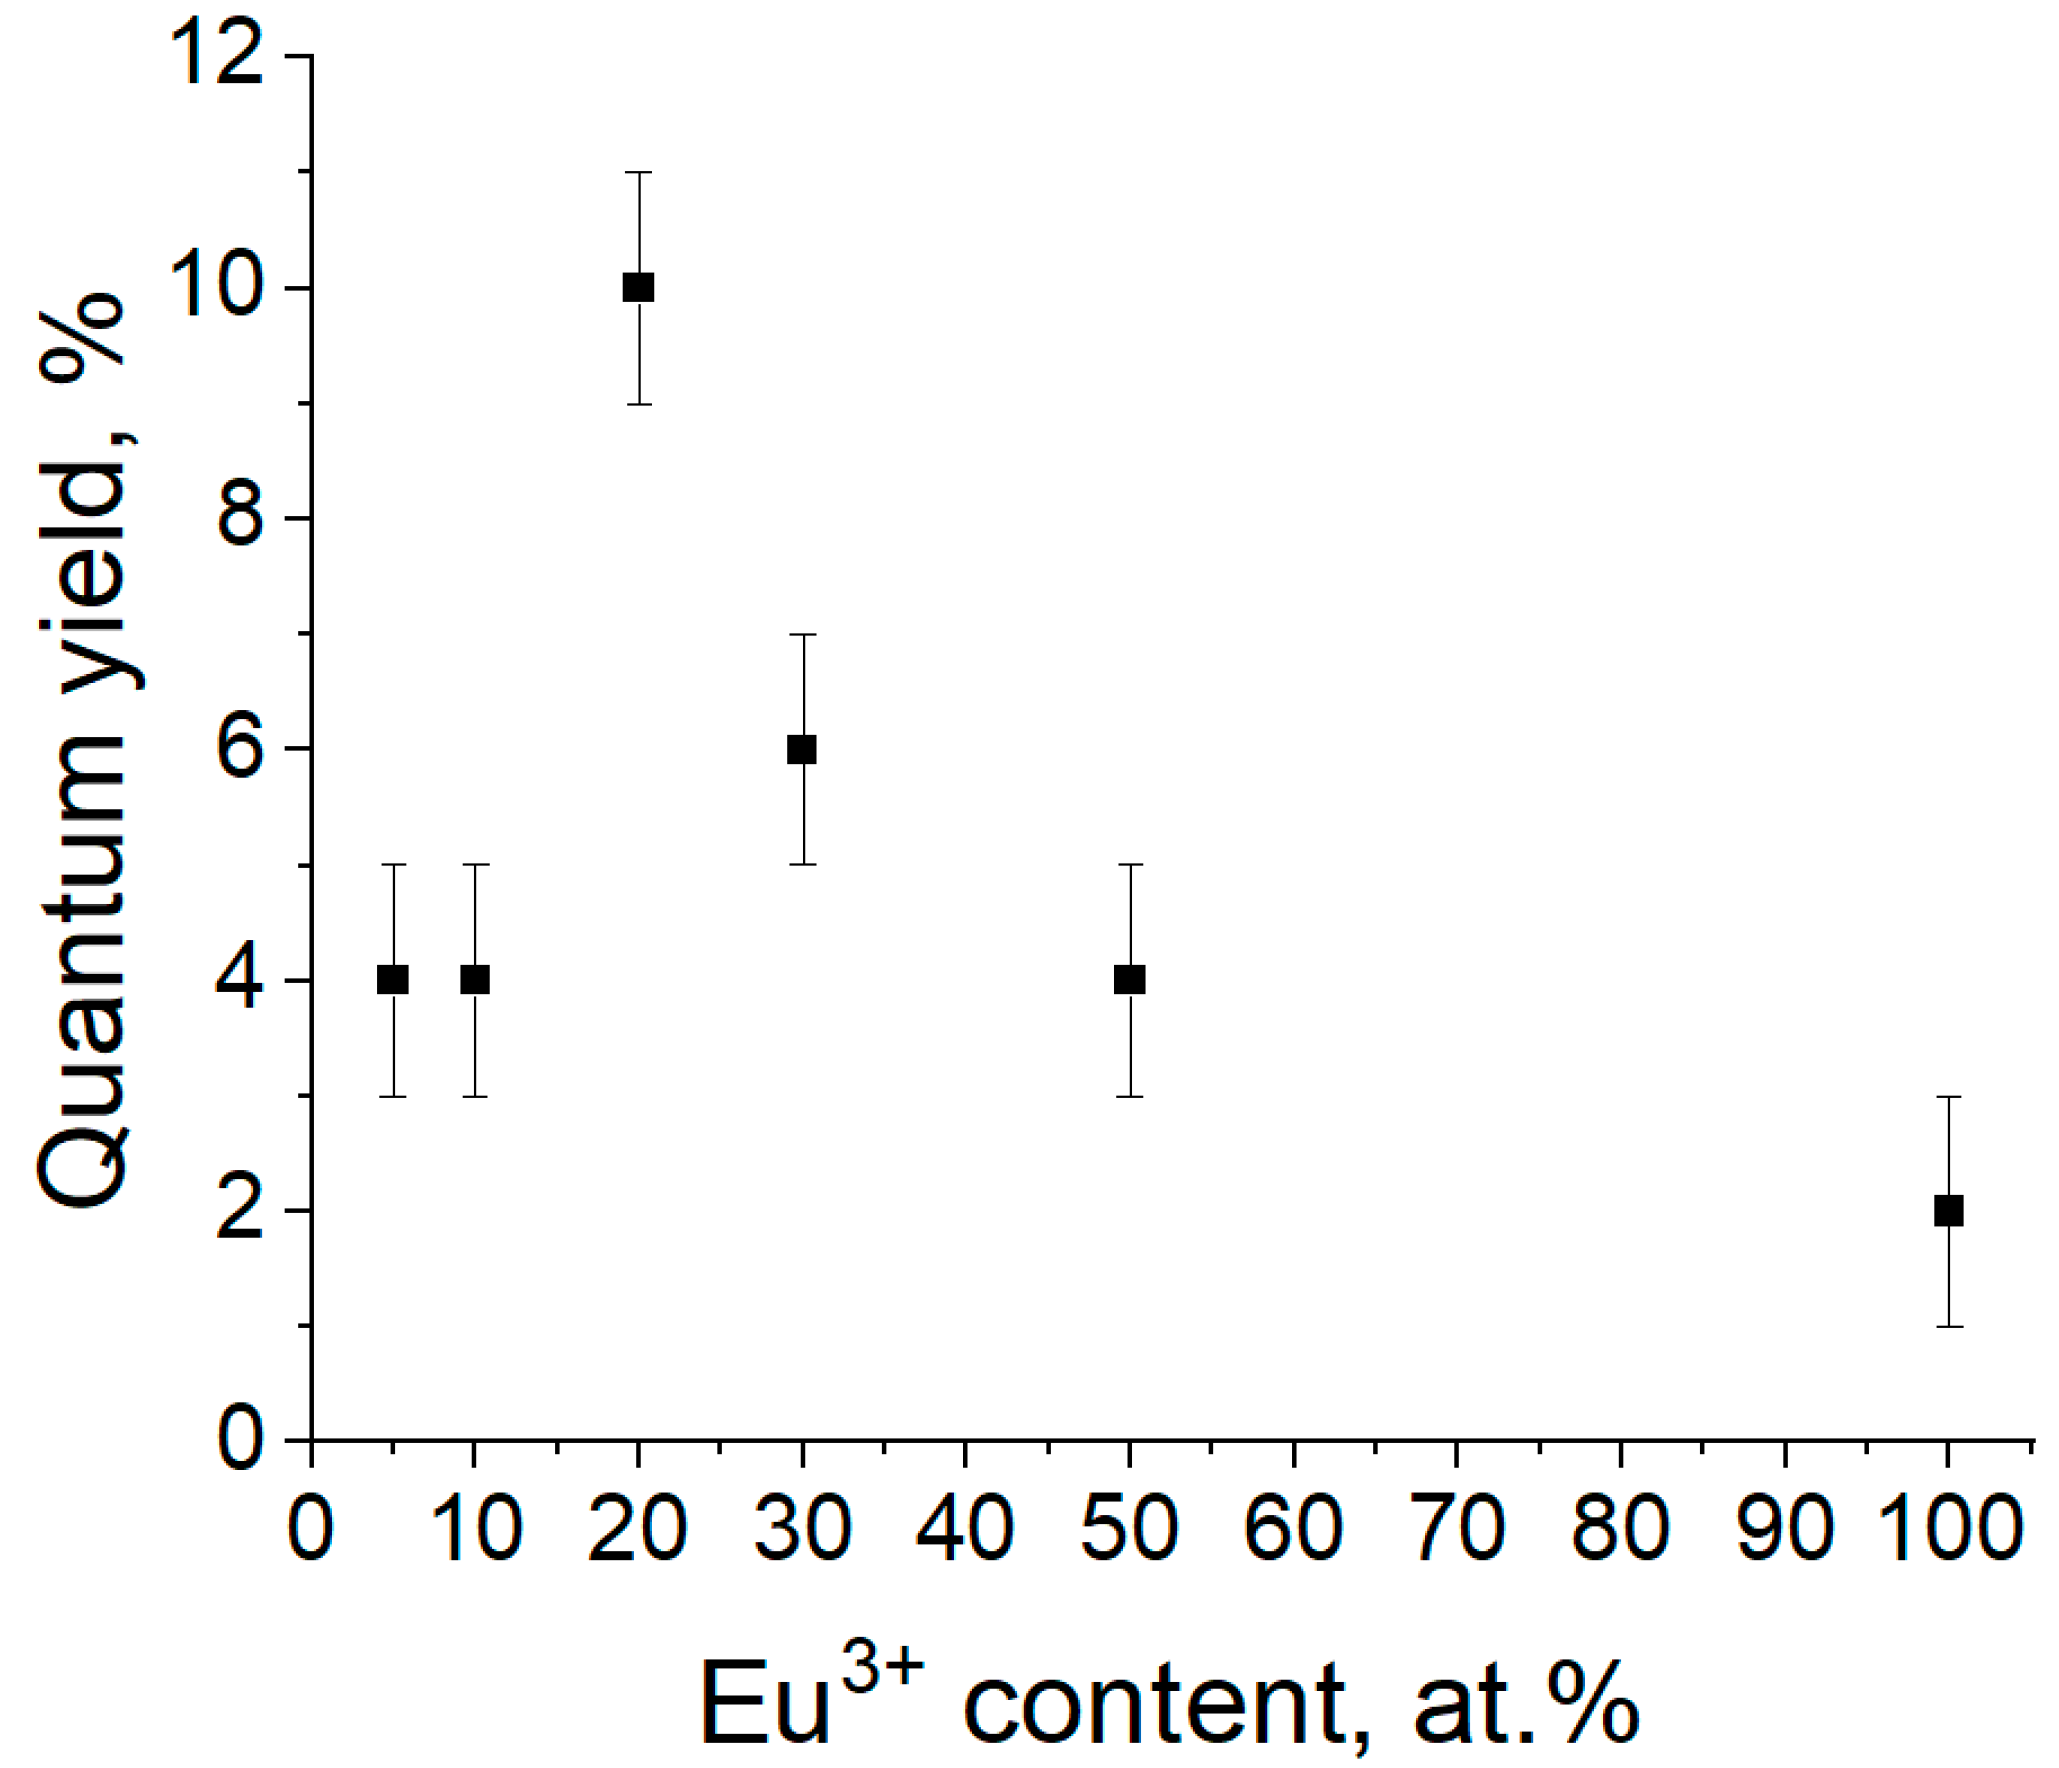
Quantum yields of KY(1−x)EuxF4 (x = 0.05, 0.1, 0.2, 0.3, 0.5, 1) were obtained using an integrating sphere (Figure 8). The measured values for samples with 5 at.% and 10 at.% europium appear to be lower than those at 20 at.%, although one would expect a monotonic decrease in the quantum yield over the entire concentration range. We attribute this effect to the formation of a mixture of two different crystalline phases (α-KY3F10 and KYF4), which occurs up to 20%. In the composition range of solid solutions with higher europium content, a smooth decrease in quantum yield is observed, which is consistent with an increase in the concentration of europium ions in the matrix and the appearance of concentration quenching.
Luminescence decay is a combination of radiative and non-radiative decay. Radiative decay rate of the independent 5D07F1 transition can be calculated using Equation (5) [51]:
A 0 1 = 14.65 n 0 3 ,
n 0 —refraction index ≈ 1.49. The obtained value is 48.46. Radiative decay rates of other transitions can be calculated using Equation 6 [51]:
A 0 j = A 0 1 ν 0 1 I o j ν 0 j I 0 1 ,
I o j   and I o 1 —integral intensities of 5D0-7Fj and 5D0-7Fj transitions, ν 0 j and ν 0 1 frequencies. The total radiative decay rate (Arad) can be calculated as a sum of the radiative decay rates of 5D0-7Fj transitions (j = 0–4). The total decay rate (Atotal) equals τ−1. The non-radiative decay rate (Anrad) can be calculated as the difference between Atotal and Arad. The quantum efficiency of the 5D0 level can be calculated using Equation (7):
η = A r a d A t o t a l
The obtained values of Atotal, Arad, Anrad, η are given in Table 1.
The concentration dependence of Arad almost repeats the concentration dependence of the asymmetrical ratio, which can be explained by the Laporte selection rule relaxation. Obtained values of Anrad are easily explained: an increase in those values with europium concentration increase is due to a decrease in the distance between Eu3+ ions (higher probability of non-radiative processes).

4. Conclusions

In the present work, a series of KF-EuF3-YF3 solid solutions was synthesized by a hydrothermal method at a temperature of 180 °C using citric acid as a stabilizing agent. Analysis of PXRD patterns demonstrated that the compound without added europium ions crystallizes in the cubic α-KY3F10 phase. In the range of 5–10 at.% of europium added, a mixture of two phases is formed, cubic α-KY3F10 without europium ions and cubic KYF4:Eu3+. For compositions between 20 at.% and 100 at.% of europium, solid solutions crystallize in a single cubic phase KYF4:Eu3+. Unit cell volumes linearly depend on the concentration of europium(III) ions in the KYF4 phase, which demonstrates that Eu3+ ions isomorphically substitute Y3+ ions in the structure. According to SEM data, the particles of all synthesized compounds have a spherical form and sizes ranging from 23 to 58 nm, depending on the sample composition. The substitution of Y3+ by Eu3+ ions leads to an increase in particle size. All europium-doped synthesized compounds demonstrate photoluminescence under 393 nm excitation (7F0-5L6 transition in Eu3+). The experimental Eu3+ optimal doping concentration in the cubic KYF4 host is 20 at.%. An increased concentration of Eu3+ leads to strong quenching due to dipole–dipole interactions between Eu3+ ions.

Supplementary Materials

The following supporting information can be downloaded at: https://www.mdpi.com/article/10.3390/cryst15060500/s1, Table S1: Lattice parameters determined for the PXRD data using Rietveld Refinement with TOPAS software; Table S2: Quantitative phase analysis by the Rietveld method for biphasic samples; Table S3: τ1 and τ2 values in decay curves fitting.

Author Contributions

Conceptualization, N.A.B., A.S.M.; Methodology, A.A.B. and A.S.M.; Formal Analysis, A.A.B., T.S.B., S.N.O. and A.S.M.; Investigation, K.S.P., A.A.B., T.S.B. and I.E.K.; Resources, N.A.B., M.Y.S. and A.S.M.; Data Curation, K.S.P., A.A.B., T.S.B., N.A.B. and A.S.M.; Writing—Original Draft Preparation, N.A.B. and K.S.P., A.A.B.; Writing—Review and Editing, N.A.B., K.S.P., A.L.P., M.Y.S. and A.S.M.; Visualization, K.S.P., A.A.B. and T.S.B.; Supervision, N.A.B.; Project Administration, N.A.B.; Funding Acquisition, N.A.B. All authors have read and agreed to the published version of the manuscript.

Funding

This work was supported by the Russian Science Foundation under grant No. 24-73-00034 (https://rscf.ru/project/24-73-00034/ data available on 2 May 2025).

Data Availability Statement

The original contributions presented in this study are included in the article (and Supplementary Materials); further inquiries can be directed to the corresponding authors.

Acknowledgments

The measurements were performed in the Research Park of Saint-Petersburg State University (Magnetic Resonance Research Centre, Chemical Analysis and Materials Research Centre, Interdisciplinary Resource Centre for Nanotechnology, Centre for X-ray Diffraction Studies, Centre for Optical and Laser Materials Research, and Centre for Innovative Technologies of Composite Nanomaterials). The authors would like to express their gratitude to Igor Kasatkin for his valuable help in the discussion of the powder X-ray diffraction data.

Conflicts of Interest

The authors declare no conflicts of interest.

References

  1. van Swieten, T.P.; Yu, D.; Yu, T.; Vonk, S.J.W.; Suta, M.; Zhang, Q.; Meijerink, A.; Rabouw, F.T. A Ho3+ -Based Luminescent Thermometer for Sensitive Sensing over a Wide Temperature Range. Adv. Opt. Mater. 2021, 9, 2001518. [Google Scholar] [CrossRef]
  2. Ćirić, A.; Stojadinović, S.; Dramićanin, M.D. Luminescence Temperature Sensing Using Thin-Films of Undoped Gd2O3 and Doped with Ho3+, Eu3+ and Er3+ Prepared by Plasma Electrolytic Oxidation. Ceram. Int. 2020, 46, 23223–23231. [Google Scholar] [CrossRef]
  3. Pominova, D.; Proydakova, V.; Romanishkin, I.; Ryabova, A.; Kuznetsov, S.; Uvarov, O.; Fedorov, P.; Loschenov, V. Temperature Sensing in the Short-Wave Infrared Spectral Region Using Core-Shell NaGdF4:Yb3+, Ho3+, Er3+@NaYF4 Nanothermometers. Nanomaterials 2020, 10, 1992. [Google Scholar] [CrossRef]
  4. Tou, M.; Mei, Y.; Bai, S.; Luo, Z.; Zhang, Y.; Li, Z. Depositing CdS Nanoclusters on Carbon-Modified NaYF4:Yb,Tm Upconversion Nanocrystals for NIR-Light Enhanced Photocatalysis. Nanoscale 2016, 8, 553–562. [Google Scholar] [CrossRef] [PubMed]
  5. Hu, J.; Wang, R.; Fan, R.; Huang, Z.; Liu, Y.; Guo, G.; Fu, H. Enhanced Luminescence in Yb3+ Doped Core-Shell Upconversion Nanoparticles for Sensitive Doxorubicin Detection. J. Lumin. 2020, 217, 116812. [Google Scholar] [CrossRef]
  6. Schulze, T.F.; Schmidt, T.W. Photochemical Upconversion: Present Status and Prospects for Its Application to Solar Energy Conversion. Energy Environ. Sci. 2015, 8, 103–125. [Google Scholar] [CrossRef]
  7. Liu, W.; Zhang, W.; Liu, R.; Li, G. Screen Printing of Multi-Mode Emission NaYF4:Yb,Er(Tm)/NaYF4:Ce,Mn Composites for Anti-Counterfeiting Applications. New J. Chem. 2021, 45, 9818–9828. [Google Scholar] [CrossRef]
  8. Klier, D.T.; Kumke, M.U. Upconversion Luminescence Properties of NaYF4:Yb:Er Nanoparticles Codoped with Gd3+. J. Phys. Chem. C 2015, 119, 3363–3373. [Google Scholar] [CrossRef]
  9. Lu, E.; Pichaandi, J.; Arnett, L.P.; Tong, L.; Winnik, M.A. Influence of Lu3+ Doping on the Crystal Structure of Uniform Small (5 and 13 Nm) NaLnF4 Upconverting Nanocrystals. J. Phys. Chem. C 2017, 121, 18178–18185. [Google Scholar] [CrossRef]
  10. Hill, T.K.; Mohs, A.M. Image-guided Tumor Surgery: Will There Be a Role for Fluorescent Nanoparticles? WIREs Nanomed. Nanobiotechnology 2016, 8, 498–511. [Google Scholar] [CrossRef]
  11. Sun, J.-X.; Xu, J.-Z.; An, Y.; Ma, S.-Y.; Liu, C.-Q.; Zhang, S.-H.; Luan, Y.; Wang, S.-G.; Xia, Q.-D. Future in Precise Surgery: Fluorescence-Guided Surgery Using EVs Derived Fluorescence Contrast Agent. J. Control. Release 2023, 353, 832–841. [Google Scholar] [CrossRef] [PubMed]
  12. Li, C.; Yang, J.; Quan, Z.; Yang, P.; Kong, D.; Lin, J. Different Microstructures of β-NaYF4 Fabricated by Hydrothermal Process: Effects of PH Values and Fluoride Sources. Chem. Mater. 2007, 19, 4933–4942. [Google Scholar] [CrossRef]
  13. Li, S.; Ye, S.; Chen, X.; Liu, T.; Guo, Z.; Wang, D. OH− Ions-Controlled Synthesis and Upconversion Luminescence Properties of NaYF4:Yb3+,Er3+ Nanocrystals via Oleic Acid-Assisted Hydrothermal Process. J. Rare Earths 2017, 35, 753–760. [Google Scholar] [CrossRef]
  14. Sun, Y.; Chen, Y.; Tian, L.; Yu, Y.; Kong, X.; Zhao, J.; Zhang, H. Controlled Synthesis and Morphology Dependent Upconversion Luminescence of NaYF4:Yb, Er Nanocrystals. Nanotechnology 2007, 18, 275609. [Google Scholar] [CrossRef]
  15. Sun, C.; Schäferling, M.; Resch-Genger, U.; Gradzielski, M. Solvothermal Synthesis of Lanthanide-doped NaYF4 Upconversion Crystals with Size and Shape Control: Particle Properties and Growth Mechanism. ChemNanoMat 2021, 7, 174–183. [Google Scholar] [CrossRef]
  16. Guo, X.; Li, P.; Yin, S.; Qin, W. Effect of NaF/RE (RE=Yb, Tm) Molar Ratio on the Morphologies and Upconversion Properties of NaYbF4:Tm3+ Microrods. J. Fluor. Chem. 2017, 200, 91–95. [Google Scholar] [CrossRef]
  17. Zhuang, J.; Liang, L.; Sung, H.H.Y.; Yang, X.; Wu, M.; Williams, I.D.; Feng, S.; Su, Q. Controlled Hydrothermal Growth and Up-Conversion Emission of NaLnF4 (Ln = Y, Dy−Yb). Inorg. Chem. 2007, 46, 5404–5410. [Google Scholar] [CrossRef]
  18. Wang, Z.; Tao, F.; Yao, L.; Cai, W.; Li, X. Selected Synthesis of Cubic and Hexagonal NaYF4 Crystals via a Complex-Assisted Hydrothermal Route. J. Cryst. Growth 2006, 290, 296–300. [Google Scholar] [CrossRef]
  19. Sun, X.; Wang, X.; Chen, B.; Zhao, F.; Xu, X.; Ren, K.; Lu, Y.; Qiao, X.; Qian, G.; Fan, X. Phase and Morphology Evolution of Luminescent NaLnF4 (Ln = La to Yb) Micro-Crystals: Understanding the Ionic Radii and Surface Energy-Dependent Solution Growth Mechanism. CrystEngComm 2019, 21, 6652–6658. [Google Scholar] [CrossRef]
  20. Ladol, J.; Khajuria, H.; Khajuria, S.; Sheikh, H.N. Hydrothermal Synthesis, Characterization and Luminescent Properties of Lanthanide-Doped NaLaF4 Nanoparticles. Bull. Mater. Sci. 2016, 39, 943–952. [Google Scholar] [CrossRef]
  21. Kolesnikov, I.E.; Vidyakina, A.A.; Vasileva, M.S.; Nosov, V.G.; Bogachev, N.A.; Sosnovsky, V.B.; Skripkin, M.Y.; Tumkin, I.I.; Lähderanta, E.; Mereshchenko, A.S. The Effect of Eu3+ and Gd3+ Co-Doping on the Morphology and Luminescence of NaYF4:Eu3+, Gd3+ Phosphors. New J. Chem. 2021, 45, 10599–10607. [Google Scholar] [CrossRef]
  22. Vidyakina, A.A.; Kolesnikov, I.E.; Bogachev, N.A.; Skripkin, M.Y.; Tumkin, I.I.; Lähderanta, E.; Mereshchenko, A.S. Gd3+-Doping Effect on Upconversion Emission of NaYF4: Yb3+, Er3+/Tm3+ Microparticles. Materials 2020, 13, 3397. [Google Scholar] [CrossRef]
  23. Wang, F.; Han, Y.; Lim, C.S.; Lu, Y.; Wang, J.; Xu, J.; Chen, H.; Zhang, C.; Hong, M.; Liu, X. Simultaneous Phase and Size Control of Upconversion Nanocrystals through Lanthanide Doping. Nature 2010, 463, 1061–1065. [Google Scholar] [CrossRef]
  24. Vidyakina, A.A.; Zheglov, D.A.; Oleinik, A.V.; Freinkman, O.V.; Kolesnikov, I.E.; Bogachev, N.A.; Skripkin, M.Y.; Mereshchenko, A.S. Microcrystalline Anti-Stokes Luminophores NaYF4 Doped with Ytterbium, Erbium, and Lutetium Ions. Russ. J. Gen. Chem. 2021, 91, 844–849. [Google Scholar] [CrossRef]
  25. Kumar, D.; Verma, K.; Verma, S.; Chaudhary, B.; Som, S.; Sharma, V.; Kumar, V.; Swart, H.C. Recent Advances in Enhanced Luminescence Upconversion of Lanthanide-Doped NaYF4 Phosphors. Phys. B Condens. Matter 2018, 535, 278–286. [Google Scholar] [CrossRef]
  26. Cressoni, C.; Vurro, F.; Milan, E.; Muccilli, M.; Mazzer, F.; Gerosa, M.; Boschi, F.; Spinelli, A.E.; Badocco, D.; Pastore, P.; et al. From Nanothermometry to Bioimaging: Lanthanide-Activated KY 3 F 10 Nanostructures as Biocompatible Multifunctional Tools for Nanomedicine. ACS Appl. Mater. Interfaces 2023, 15, 12171–12188. [Google Scholar] [CrossRef] [PubMed]
  27. Serna-Gallén, P. Fantastic Photons and Where to Excite Them: Revolutionizing Upconversion with KY3F10-Based Compounds. Crystals 2024, 14, 762. [Google Scholar] [CrossRef]
  28. Binnemans, K. Interpretation of Europium(III) Spectra. Coord. Chem. Rev. 2015, 295, 1–45. [Google Scholar] [CrossRef]
  29. Wu, Y.; Shi, M.; Zhao, L.; Feng, W.; Li, F.; Huang, C. Visible-Light-Excited and Europium-Emissive Nanoparticles for Highly-Luminescent Bioimaging in Vivo. Biomaterials 2014, 35, 5830–5839. [Google Scholar] [CrossRef]
  30. McNemar, C.W.; Horrocks, W. Dew. Europium(III) Ion Luminescence as a Structural Probe of Parvalbumin Isotypes. Biochim. Biophys. Acta (BBA)–Protein Struct. Mol. Enzymol. 1990, 1040, 229–236. [Google Scholar] [CrossRef]
  31. Das, D.; Gupta, S.K.; Sudarshan, K. Europium Luminescence as a Structural Probe to Understand Defect Evolution in CeO2/Eu3+, M3+ (M = Y and La): Contrasting Role of Codopant Ionic Size. J. Mater. Sci. 2021, 56, 17205–17220. [Google Scholar] [CrossRef]
  32. Cao, C.; Yang, H.K.; Moon, B.K.; Choi, B.C.; Jeong, J.H.; Kim, K.H. Hydrothermal Synthesis, Phase Evolution, and Optical Properties of Eu3+ -Doped KF–YF 3 System Materials. J. Mater. Res. 2012, 27, 2988–2995. [Google Scholar] [CrossRef]
  33. Bartholomew, J.G.; Zhang, Z.; Di Lieto, A.; Tonelli, M.; Goldner, P. High Resolution Spectroscopy of the 7F0↔5D0 Transition in Eu3+:KYF4. J. Lumin. 2016, 171, 221–225. [Google Scholar] [CrossRef]
  34. Bajaj, R.; Rao, A.S.; Prakash, G.V. Linear and Nonlinear Photoluminescence from Thermally Stable KYF4:Eu3+ Cubic Nanocrystals. J. Alloys Compd. 2021, 885, 160893. [Google Scholar] [CrossRef]
  35. Wang, Y.; Liu, Y.; Xiao, Q.; Zhu, H.; Li, R.; Chen, X. Eu3+ Doped KYF4 Nanocrystals: Synthesis, Electronic Structure, and Optical Properties. Nanoscale 2011, 3, 3164. [Google Scholar] [CrossRef]
  36. Andraud, C.; Denis, J.P.; Blanzat, B.; Vedrine, A. Luminescent Properties of Eu3+ and Tb3+ in KY3F10. Chem. Phys. Lett. 1983, 101, 357–360. [Google Scholar] [CrossRef]
  37. Serna-Gallén, P.; Beltrán-Mir, H.; Cordoncillo, E.; Balda, R.; Fernández, J. A Site-Selective Fluorescence Spectroscopy Study of the Crystal Phases of KY3F10: Leveraging the Optical Response of Eu3+ Ions. J. Alloys Compd. 2023, 953, 170020. [Google Scholar] [CrossRef]
  38. Gaume-Mahn, F.; Boulon, G.; Gâcon, J.C.; Sériot, J.; Védrine, A. Spectra-Structure Relations in KY3F10 Isotypic Compounds Doped with Eu2+ or Eu3+. In The Rare Earths in Modern Science and Technology; Springer: Boston, MA, USA, 1978; pp. 547–552. [Google Scholar]
  39. Porcher, P.; Caro, P. Crystal Field Parameters for Eu3+ in KY3F10. J. Chem. Phys. 1976, 65, 89–94. [Google Scholar] [CrossRef]
  40. Zhu, L.; Meng, J.; Cao, X. Sonochemical Synthesis of Monodispersed KY3F10:Eu3+ Nanospheres with Bimodal Size Distribution. Mater. Lett. 2008, 62, 3007–3009. [Google Scholar] [CrossRef]
  41. Shannon, R.D. Revised Effective Ionic Radii and Systematic Studies of Interatomic Distances in Halides and Chalcogenides. Acta Crystallogr. Sect. A 1976, 32, 751–767. [Google Scholar] [CrossRef]
  42. Szefczyk, B.; Roszak, R.; Roszak, S. Structure of the Hexagonal NaYF4 Phase from First-Principles Molecular Dynamics. RSC Adv. 2014, 4, 22526. [Google Scholar] [CrossRef]
  43. Kolesnikov, I.E.; Povolotskiy, A.V.; Mamonova, D.V.; Kurochkin, E.Y.; Kurochkin, A.V.; Lahderanta, E.; Mikhailov, M.D. Asymmetry ratio as a parameter of Eu3+ local environment in phosphors. J. Rare Earths 2018, 36, 474–481. [Google Scholar] [CrossRef]
  44. Honma, T.; Toda, K.; Ye, Z.-G.; Sato, M. Concentration quenching of the eu3+-activated luminescence in some layered perovskites with two-dimensional arrangement. J. Phys. Chem. Solids 1998, 59, 1187–1193. [Google Scholar] [CrossRef]
  45. Naik, R.; Nagabhushana, H.; Sharma, S.C.; Nagabhushana, B.M.; Nagaswarupa, H.P.; Premkumar, H.B. Low temperature synthesis and photoluminescence properties of red emitting Mg2SiO4:Eu3⁺ nanophosphor for near UV light emitting diodes. Sens. Actuators B Chem. 2014, 195, 140–149. [Google Scholar] [CrossRef]
  46. Van Uitert, L.G. Characterization of energy transfer interactions between rare earth ions. J. Electrochem. Soc. 1967, 114, 1048–1053. [Google Scholar] [CrossRef]
  47. Miao, J.; Su, J.; Wen, Y.; Rao, W. Preparation, Characterization and Photoluminescence of Sm3+ Doped NaGdF4 Nanoparticles. J. Alloys Compd. 2015, 636, 8–11. [Google Scholar] [CrossRef]
  48. Singh, N.S.; Ningthoujam, R.S.; Luwang, M.N.; Singh, S.D.; Vatsa, R.K. Luminescence, Lifetime and Quantum Yield Studies of YVO4:Ln3+ (Ln3+ = Dy3+, Eu3+) Nanoparticles: Concentration and Annealing Effects. Chem. Phys. Lett. 2009, 480, 237–242. [Google Scholar] [CrossRef]
  49. Wu, Y.; Lin, S.; Shao, W.; Zhang, X.; Xu, J.; Yu, L.; Chen, K. Enhanced Up-Conversion Luminescence from NaYF4:Yb,Er Nanocrystals by Gd3+ Ions Induced Phase Transformation and Plasmonic Au Nanosphere Arrays. RSC Adv. 2016, 6, 102869–102874. [Google Scholar] [CrossRef]
  50. Shi, F.; Zhao, Y. Sub-10 Nm and Monodisperse β-NaYF4:Yb,Tm,Gd Nanocrystals with Intense Ultraviolet Upconversion Luminescence. J. Mater. Chem. C 2014, 2, 2198–2203. [Google Scholar] [CrossRef]
  51. Kolesnikov, I.E.; Kolokolov, D.S.; Kurochkin, A.V.; Voznesenskiy, M.A.; Osmolowsky, M.G.; Lahderanta, E.; Osmolovskaya, O.M. Morphology and doping concentration effect on the luminescence properties of SnO2:Eu3+ nanoparticles. J. Alloys Compd. 2020, 824, 153640–153648. [Google Scholar] [CrossRef]
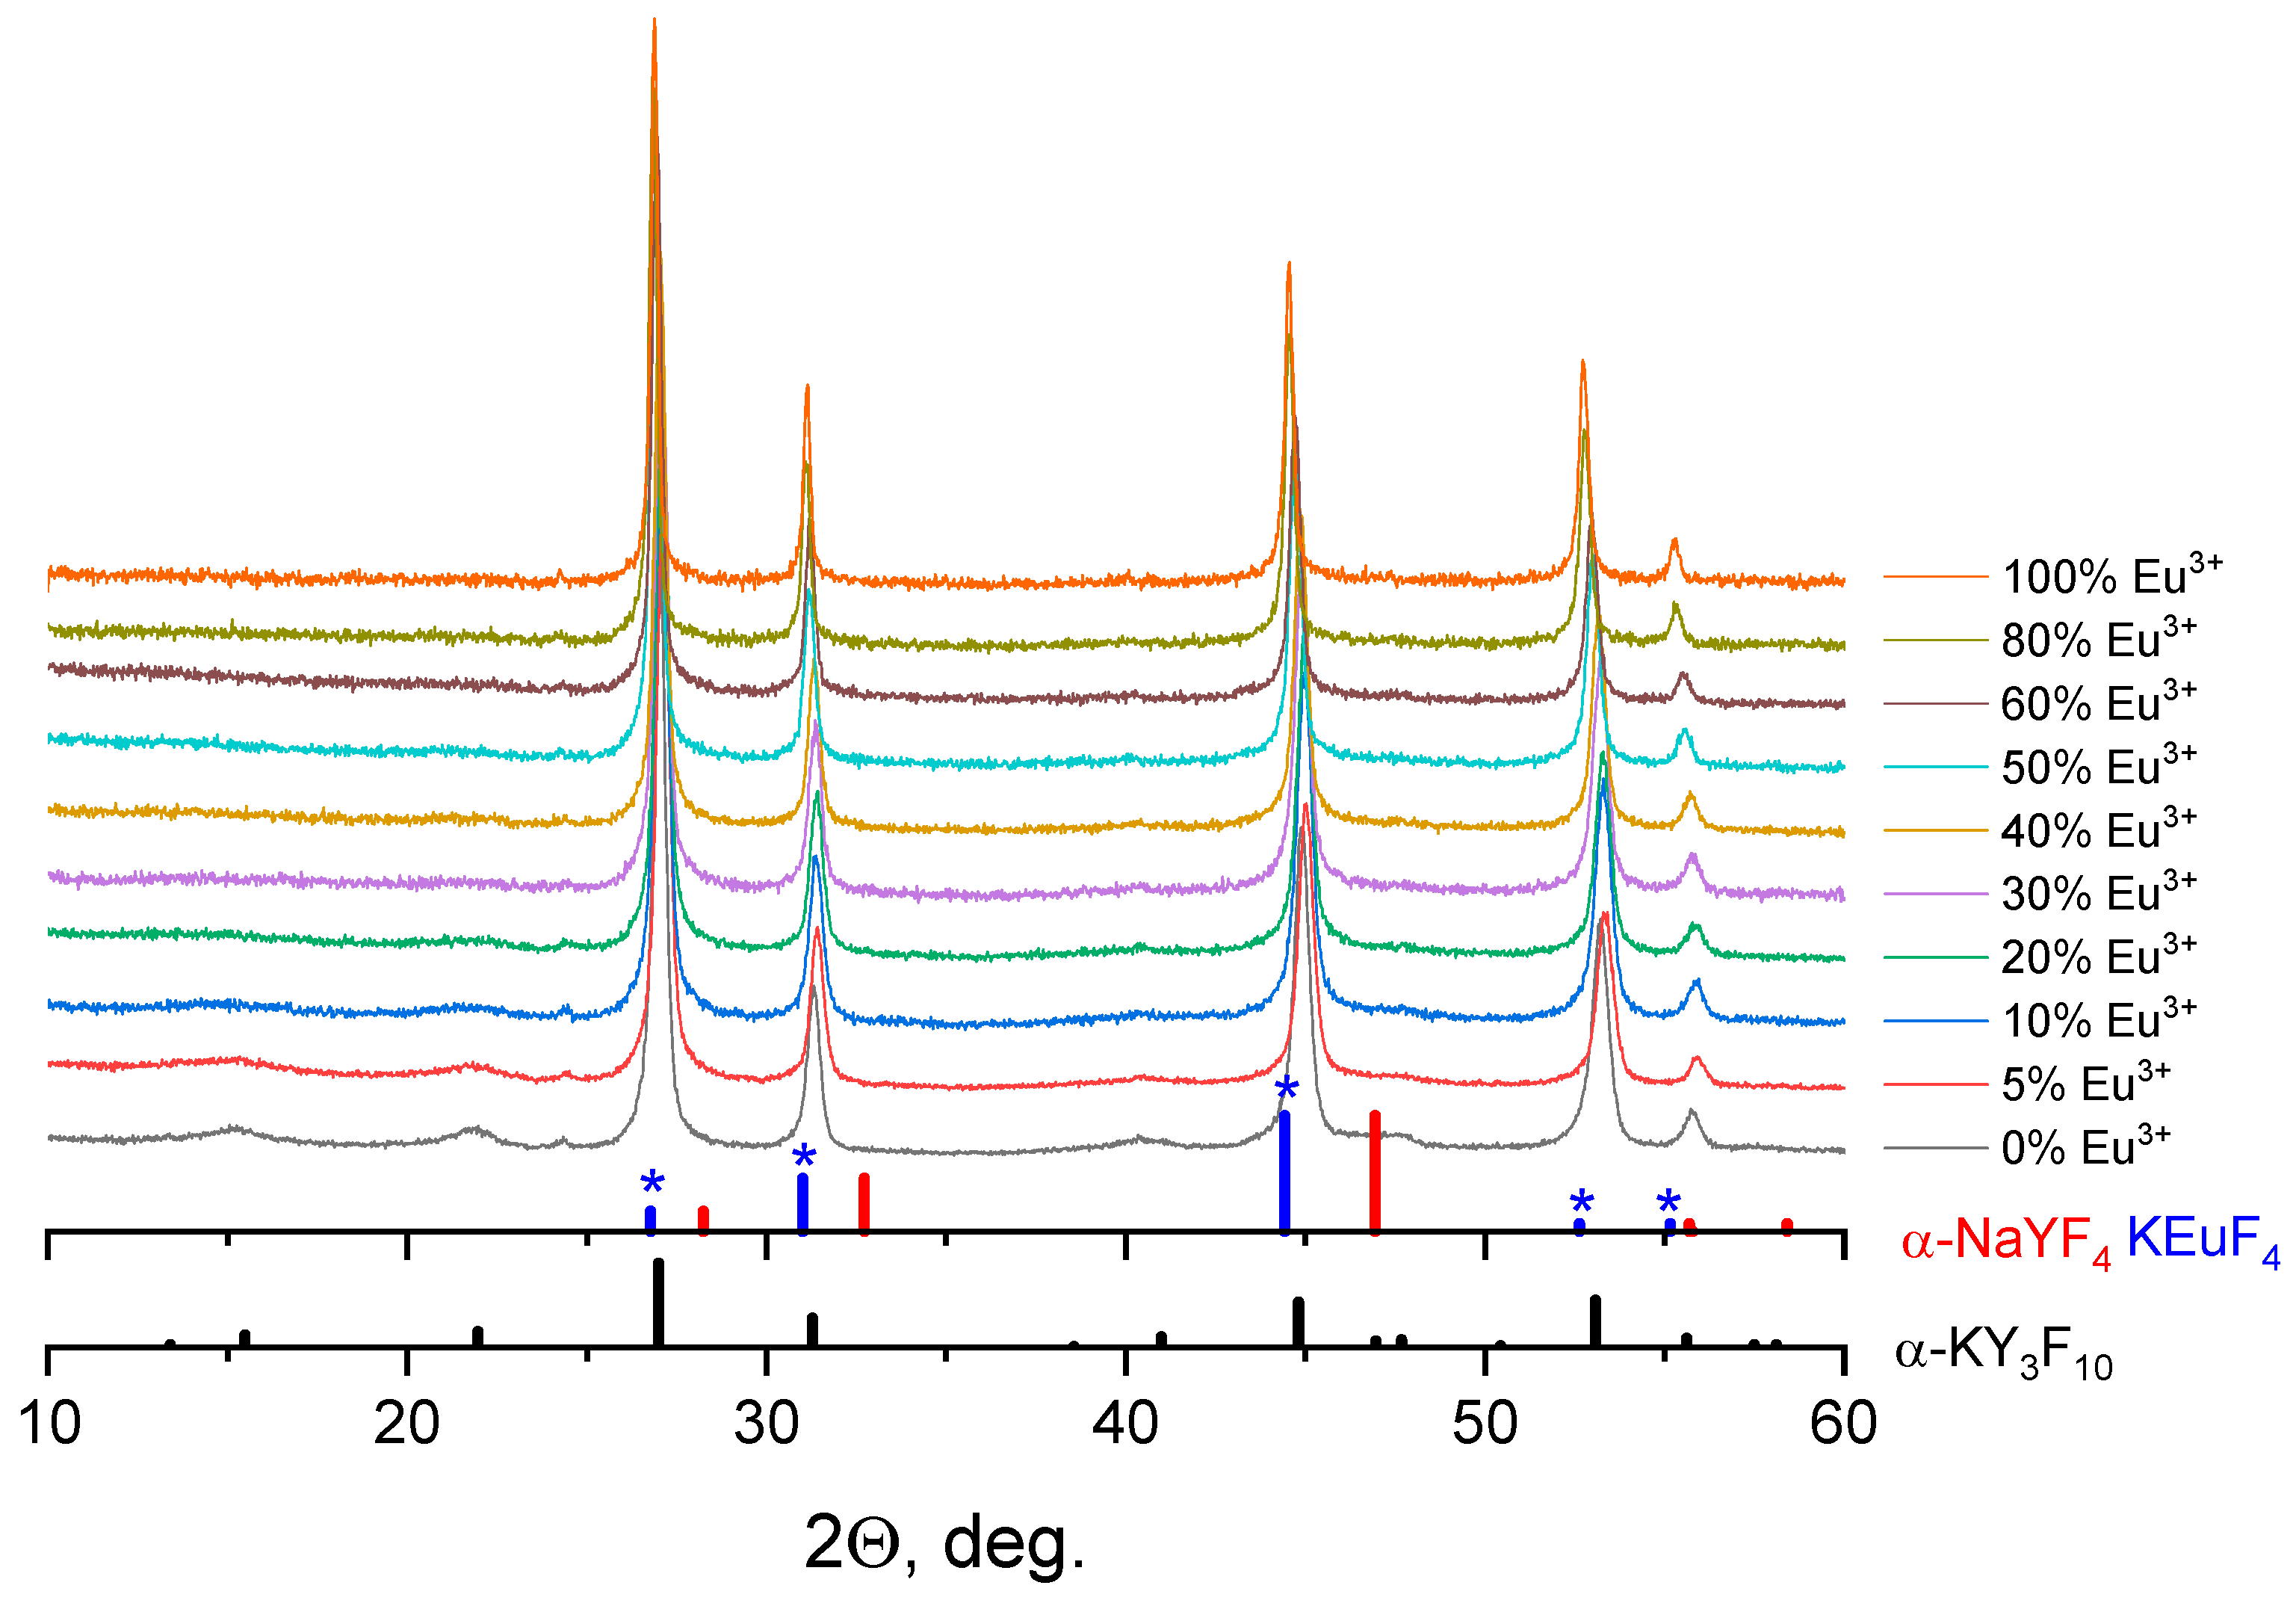
Figure 1. XRD patterns of obtained particles KY(1−x)EuxF4 (x = 0.05, 0.1, 0.2, 0.3, 0.4, 0.5, 0.6, 0.8, 1) and referenced patterns for cubic α-KY3F10 (JCPDS file No. 27–0462), cubic α-NaYF4 (JCPDS file No. 06-0342) and calculated peaks for KEuF4.
Crystals 15 00500 g001
Figure 2. XRD patterns of solid solution samples in the range 40–57 degrees of 2θ angle and referenced patterns for cubic α-KY3F10 and KEuF4.
Crystals 15 00500 g002
Figure 3. Unit cell volume of KYF4:Eu3+ as a function of europium concentration.
Crystals 15 00500 g003
Figure 4. SEM images of the samples α-KY3F10 (a) and KY(1−x)EuxF4 (x = 0.2 (b), 0.4 (c), 0.6 (d), 0.8 (e), and 1 (f) of Eu3+). Particle size distribution of the samples is shown in the insets. The average diameter of particles is equal to 23 ± 7, 24 ± 5, 26 ± 5, 30 ± 6, 36 ± 4, and 54 ± 6 nm for the Eu3+ concentration of 0, 20, 40, 60, 80, and 100 at.%, respectively.
Crystals 15 00500 g004
Figure 5. Excitation (a) and emission (b) spectra of KY(1−x)EuxF4 (x = 0.05, 0.1, 0.2, 0.3, 0.4, 0.6, 0.8, 1).
Crystals 15 00500 g005
Figure 6. Integral intensity of emission spectra of KYF4:Eu3+ as a function of europium concentration (a) and a logarithmic plot of KYF4:Eu3+ of emission integral intensity dependence on dopant concentration fitted to the linear function (b).
Crystals 15 00500 g006
Figure 7. Decay curves of KYF4:Eu3+ (a) and average lifetime (b) of KYF4:Eu3+ as a function of europium concentration.
Crystals 15 00500 g007
Figure 8. Quantum yields of KY(1−x)EuxF4 (x = 0.05, 0.1, 0.2, 0.3, 0.5, 1).
Crystals 15 00500 g008
Table 1. Values of Atotal, Arad, Anrad, η of KYF4:xEu3+ (x = 20, 30, 40, 50, 60, 80, 100 at.%).
ΧEu (at.%)Atotal(s−1)Arad(s−1)Anrad(s−1)η (%)
201881018754
3027310317038
4047410337122
5063710453416
6079410468913
80136910612628
100150410913957
Disclaimer/Publisher’s Note: The statements, opinions and data contained in all publications are solely those of the individual author(s) and contributor(s) and not of MDPI and/or the editor(s). MDPI and/or the editor(s) disclaim responsibility for any injury to people or property resulting from any ideas, methods, instructions or products referred to in the content.